Graysville, OH Map & Demographics
Graysville Map
Graysville Overview
$21,662
PER CAPITA INCOME
$70,000
AVG FAMILY INCOME
18.2%
WAGE / INCOME GAP [ % ]
81.8¢/ $1
WAGE / INCOME GAP [ $ ]
0.49
INEQUALITY / GINI INDEX
77
TOTAL POPULATION
29
MALE POPULATION
48
FEMALE POPULATION
60.42
MALES / 100 FEMALES
165.52
FEMALES / 100 MALES
53.3
MEDIAN AGE
2.8
AVG FAMILY SIZE
2.4
AVG HOUSEHOLD SIZE
23
LABOR FORCE [ PEOPLE ]
34.8%
PERCENT IN LABOR FORCE
Graysville Zip Codes
Graysville Area Codes
Income in Graysville
Income Overview in Graysville
| Characteristic | Number | Measure |
| Per Capita Income | 77 | $21,662 |
| Median Family Income | 22 | $70,000 |
| Mean Family Income | 22 | $69,814 |
| Median Household Income | 32 | $0 |
| Mean Household Income | 32 | $52,791 |
| Income Deficit | 22 | $0 |
| Wage / Income Gap (%) | 77 | 18.18% |
| Wage / Income Gap ($) | 77 | 81.82¢ per $1 |
| Gini / Inequality Index | 77 | 0.49 |
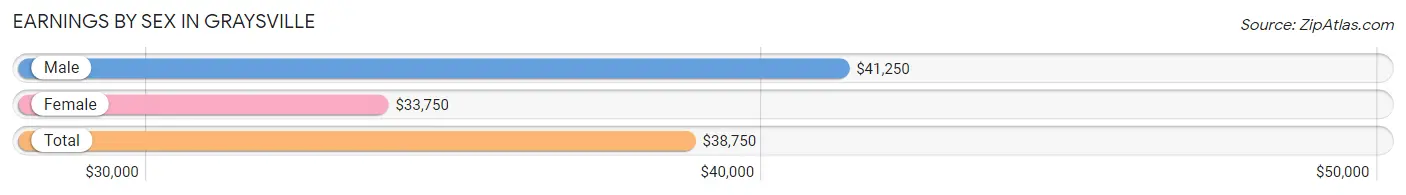
Earnings by Sex in Graysville
Average Earnings in Graysville are $38,750, $41,250 for men and $33,750 for women, a difference of 18.2%.
| Sex | Number | Average Earnings |
| Male | 8 (33.3%) | $41,250 |
| Female | 16 (66.7%) | $33,750 |
| Total | 24 (100.0%) | $38,750 |
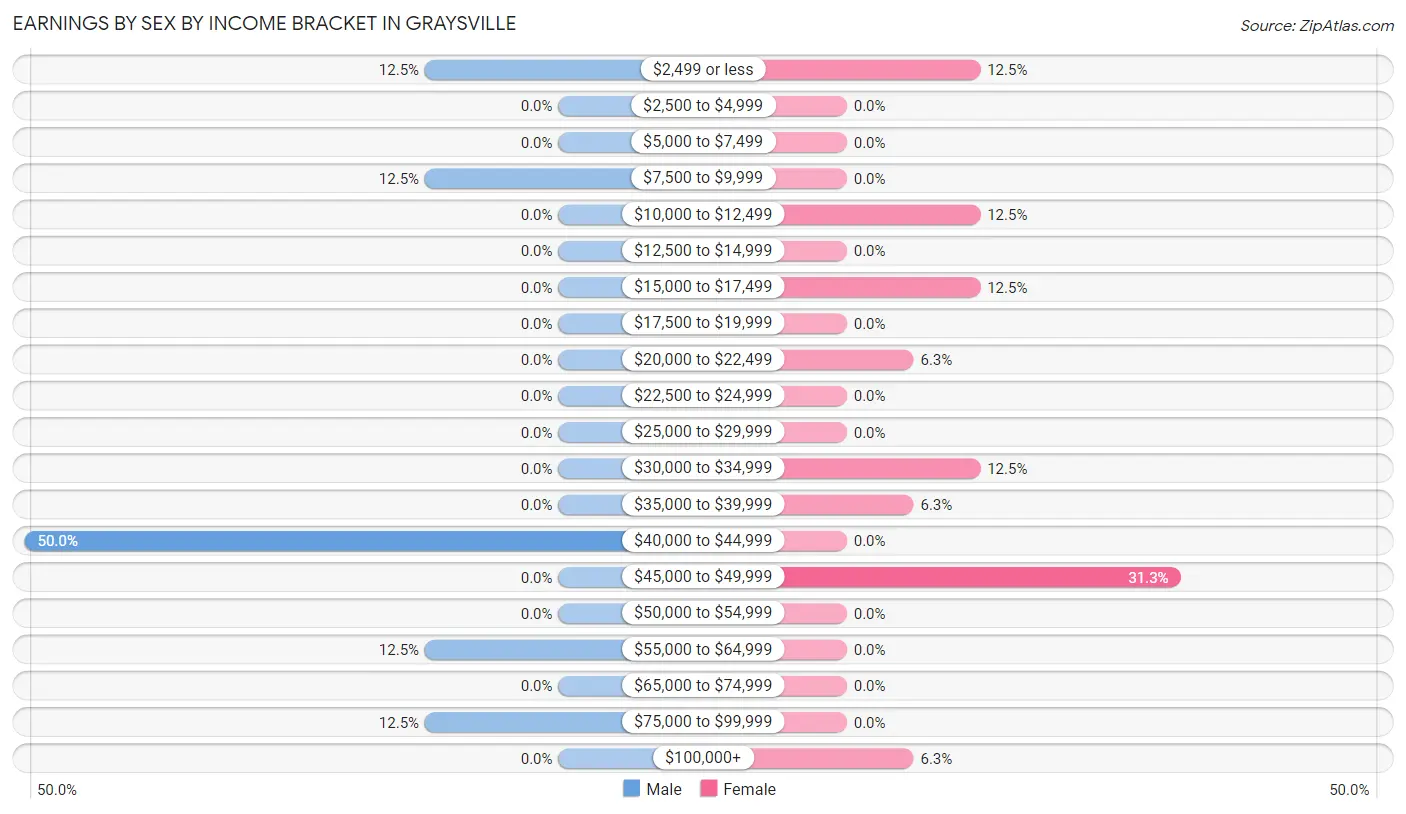
Earnings by Sex by Income Bracket in Graysville
The most common earnings brackets in Graysville are $40,000 to $44,999 for men (4 | 50.0%) and $45,000 to $49,999 for women (5 | 31.2%).
| Income | Male | Female |
| $2,499 or less | 1 (12.5%) | 2 (12.5%) |
| $2,500 to $4,999 | 0 (0.0%) | 0 (0.0%) |
| $5,000 to $7,499 | 0 (0.0%) | 0 (0.0%) |
| $7,500 to $9,999 | 1 (12.5%) | 0 (0.0%) |
| $10,000 to $12,499 | 0 (0.0%) | 2 (12.5%) |
| $12,500 to $14,999 | 0 (0.0%) | 0 (0.0%) |
| $15,000 to $17,499 | 0 (0.0%) | 2 (12.5%) |
| $17,500 to $19,999 | 0 (0.0%) | 0 (0.0%) |
| $20,000 to $22,499 | 0 (0.0%) | 1 (6.2%) |
| $22,500 to $24,999 | 0 (0.0%) | 0 (0.0%) |
| $25,000 to $29,999 | 0 (0.0%) | 0 (0.0%) |
| $30,000 to $34,999 | 0 (0.0%) | 2 (12.5%) |
| $35,000 to $39,999 | 0 (0.0%) | 1 (6.2%) |
| $40,000 to $44,999 | 4 (50.0%) | 0 (0.0%) |
| $45,000 to $49,999 | 0 (0.0%) | 5 (31.2%) |
| $50,000 to $54,999 | 0 (0.0%) | 0 (0.0%) |
| $55,000 to $64,999 | 1 (12.5%) | 0 (0.0%) |
| $65,000 to $74,999 | 0 (0.0%) | 0 (0.0%) |
| $75,000 to $99,999 | 1 (12.5%) | 0 (0.0%) |
| $100,000+ | 0 (0.0%) | 1 (6.2%) |
| Total | 8 (100.0%) | 16 (100.0%) |
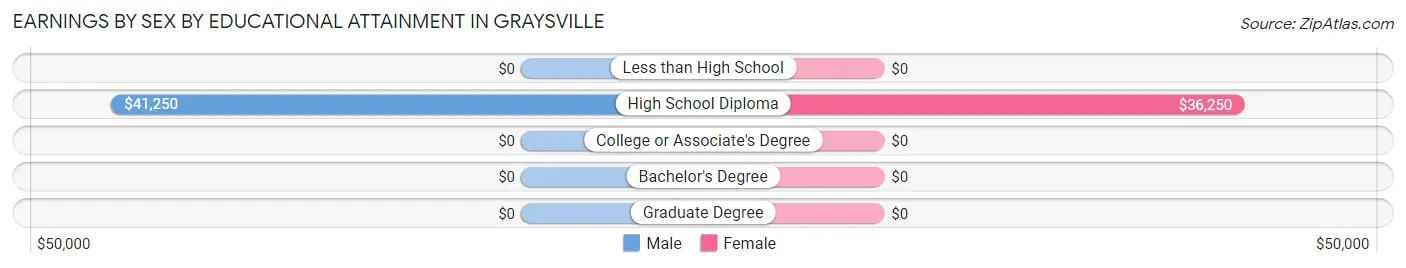
Earnings by Sex by Educational Attainment in Graysville
Average earnings in Graysville are $41,250 for men and $33,750 for women, a difference of 18.2%. Men with an educational attainment of high school diploma enjoy the highest average annual earnings of $41,250, while those with high school diploma education earn the least with $41,250. Women with an educational attainment of high school diploma earn the most with the average annual earnings of $36,250, while those with high school diploma education have the smallest earnings of $36,250.
| Educational Attainment | Male Income | Female Income |
| Less than High School | - | - |
| High School Diploma | $41,250 | $36,250 |
| College or Associate's Degree | - | - |
| Bachelor's Degree | - | - |
| Graduate Degree | - | - |
| Total | $41,250 | $33,750 |
Family Income in Graysville
Family Income Brackets in Graysville
According to the Graysville family income data, there are 7 families falling into the $75,000 to $99,999 income range, which is the most common income bracket and makes up 31.8% of all families.
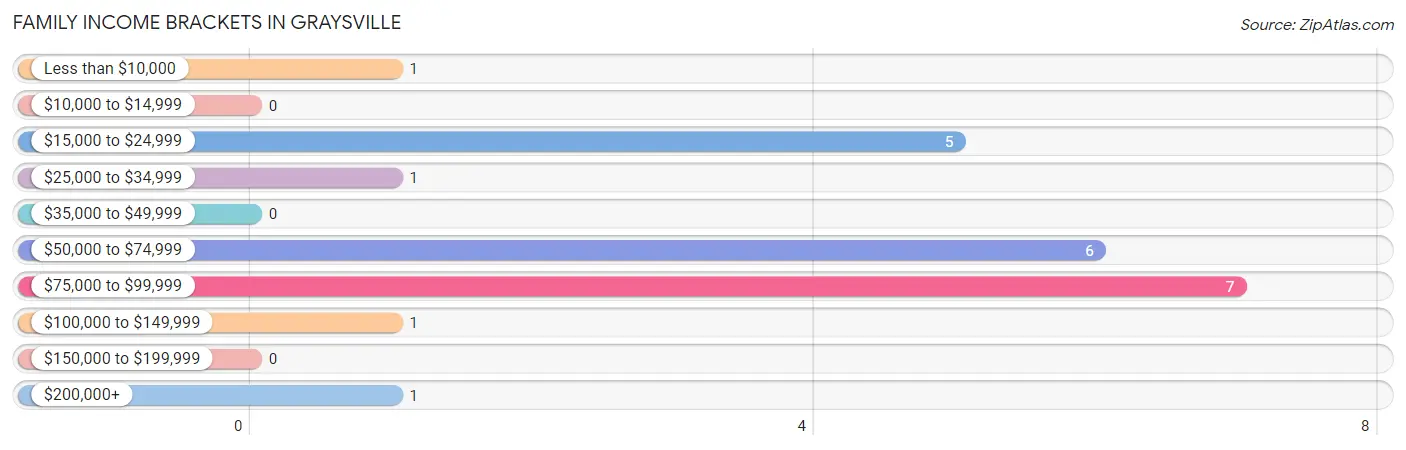
| Income Bracket | # Families | % Families |
| Less than $10,000 | 1 | 4.5% |
| $10,000 to $14,999 | 0 | 0.0% |
| $15,000 to $24,999 | 5 | 22.7% |
| $25,000 to $34,999 | 1 | 4.5% |
| $35,000 to $49,999 | 0 | 0.0% |
| $50,000 to $74,999 | 6 | 27.3% |
| $75,000 to $99,999 | 7 | 31.8% |
| $100,000 to $149,999 | 1 | 4.5% |
| $150,000 to $199,999 | 0 | 0.0% |
| $200,000+ | 1 | 4.5% |
Family Income by Famaliy Size in Graysville
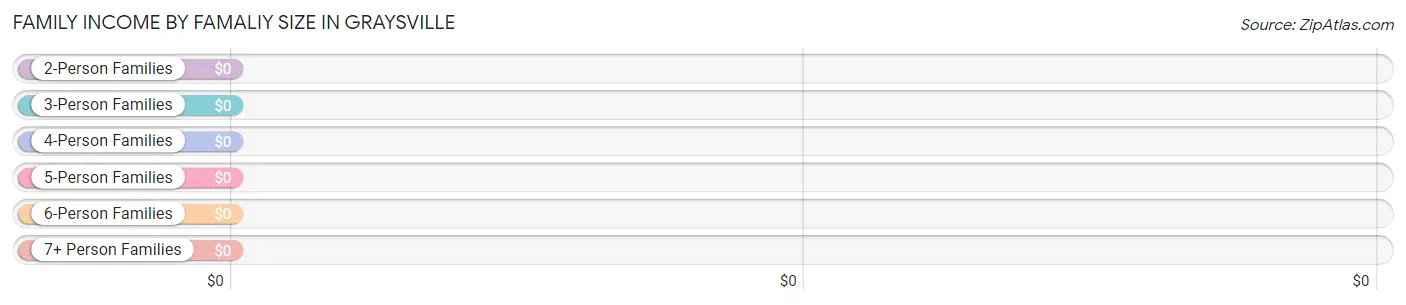
| Income Bracket | # Families | Median Income |
| 2-Person Families | 18 (81.8%) | $0 |
| 3-Person Families | 0 (0.0%) | $0 |
| 4-Person Families | 2 (9.1%) | $0 |
| 5-Person Families | 1 (4.5%) | $0 |
| 6-Person Families | 0 (0.0%) | $0 |
| 7+ Person Families | 1 (4.5%) | $0 |
| Total | 22 (100.0%) | $70,000 |
Family Income by Number of Earners in Graysville
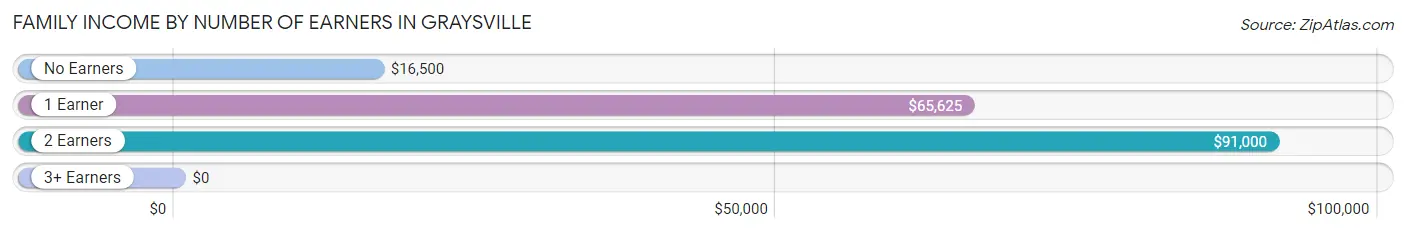
| Number of Earners | # Families | Median Income |
| No Earners | 8 (36.4%) | $16,500 |
| 1 Earner | 5 (22.7%) | $65,625 |
| 2 Earners | 8 (36.4%) | $91,000 |
| 3+ Earners | 1 (4.5%) | $0 |
| Total | 22 (100.0%) | $70,000 |
Household Income in Graysville
Household Income Brackets in Graysville
With 11 households falling in the category, the $15,000 to $24,999 income range is the most frequent in Graysville, accounting for 34.4% of all households.
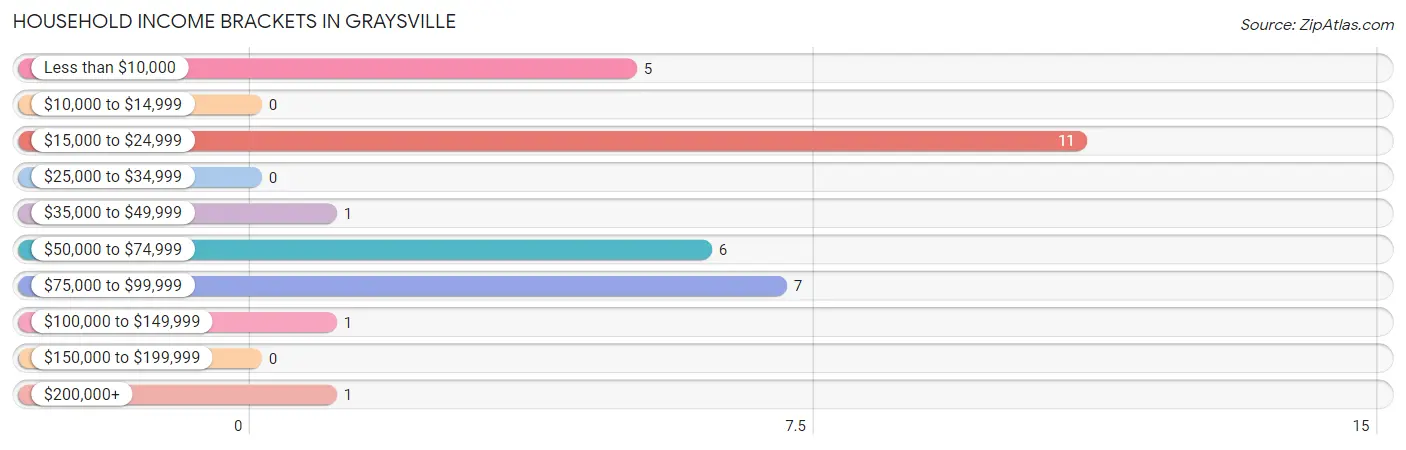
| Income Bracket | # Households | % Households |
| Less than $10,000 | 5 | 15.6% |
| $10,000 to $14,999 | 0 | 0.0% |
| $15,000 to $24,999 | 11 | 34.4% |
| $25,000 to $34,999 | 0 | 0.0% |
| $35,000 to $49,999 | 1 | 3.1% |
| $50,000 to $74,999 | 6 | 18.8% |
| $75,000 to $99,999 | 7 | 21.9% |
| $100,000 to $149,999 | 1 | 3.1% |
| $150,000 to $199,999 | 0 | 0.0% |
| $200,000+ | 1 | 3.1% |
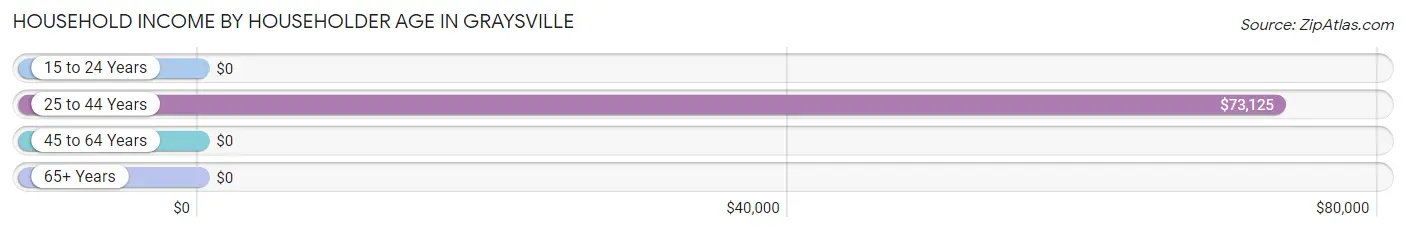
Household Income by Householder Age in Graysville
The median household income in Graysville is $0, with the highest median household income of $73,125 found in the 25 to 44 years age bracket for the primary householder. A total of 3 households (9.4%) fall into this category.
| Income Bracket | # Households | Median Income |
| 15 to 24 Years | 0 (0.0%) | $0 |
| 25 to 44 Years | 3 (9.4%) | $73,125 |
| 45 to 64 Years | 13 (40.6%) | $0 |
| 65+ Years | 16 (50.0%) | $0 |
| Total | 32 (100.0%) | $0 |
Poverty in Graysville
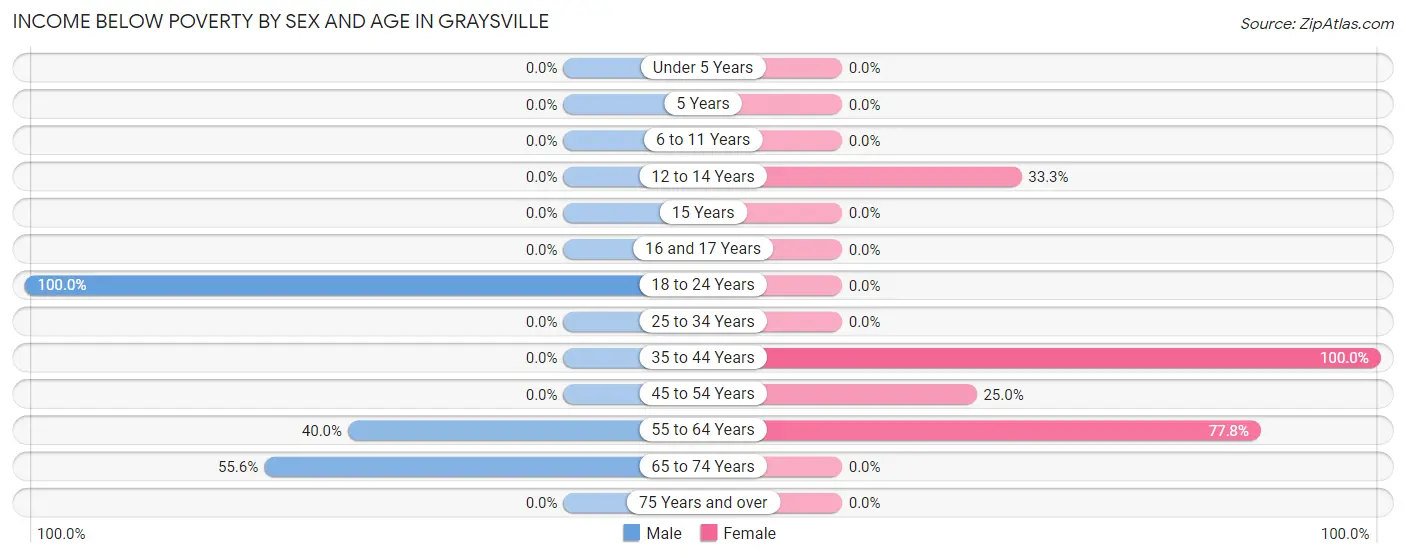
Income Below Poverty by Sex and Age in Graysville
With 41.4% poverty level for males and 25.0% for females among the residents of Graysville, 18 to 24 year old males and 35 to 44 year old females are the most vulnerable to poverty, with 5 males (100.0%) and 1 females (100.0%) in their respective age groups living below the poverty level.
| Age Bracket | Male | Female |
| Under 5 Years | 0 (0.0%) | 0 (0.0%) |
| 5 Years | 0 (0.0%) | 0 (0.0%) |
| 6 to 11 Years | 0 (0.0%) | 0 (0.0%) |
| 12 to 14 Years | 0 (0.0%) | 1 (33.3%) |
| 15 Years | 0 (0.0%) | 0 (0.0%) |
| 16 and 17 Years | 0 (0.0%) | 0 (0.0%) |
| 18 to 24 Years | 5 (100.0%) | 0 (0.0%) |
| 25 to 34 Years | 0 (0.0%) | 0 (0.0%) |
| 35 to 44 Years | 0 (0.0%) | 1 (100.0%) |
| 45 to 54 Years | 0 (0.0%) | 3 (25.0%) |
| 55 to 64 Years | 2 (40.0%) | 7 (77.8%) |
| 65 to 74 Years | 5 (55.6%) | 0 (0.0%) |
| 75 Years and over | 0 (0.0%) | 0 (0.0%) |
| Total | 12 (41.4%) | 12 (25.0%) |
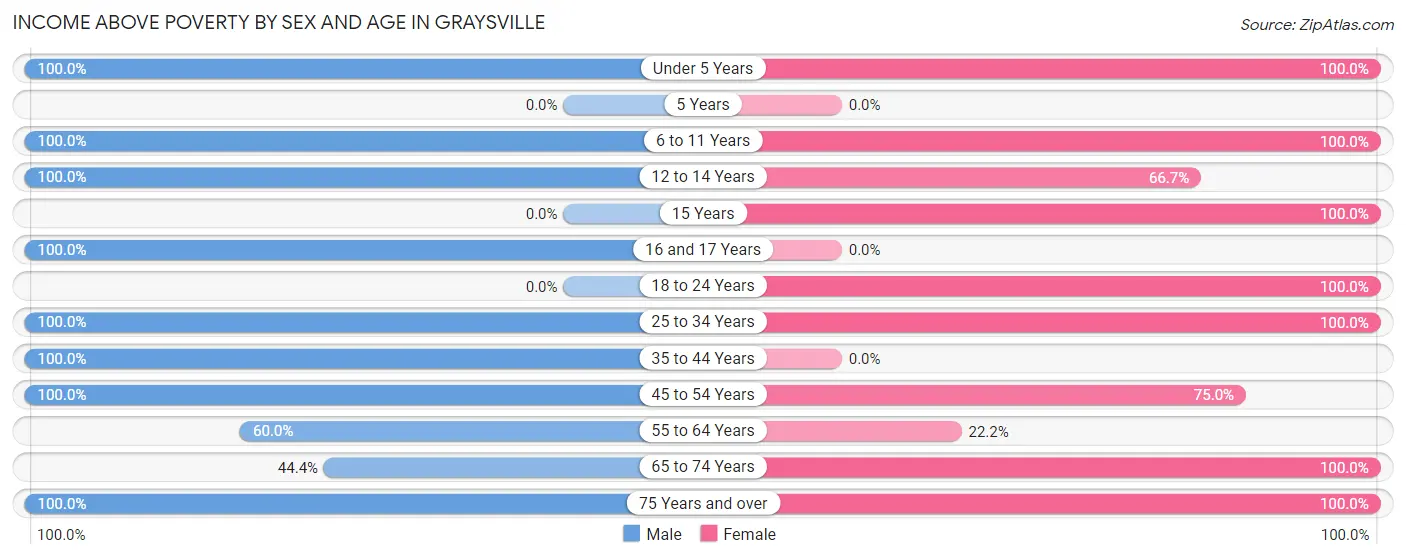
Income Above Poverty by Sex and Age in Graysville
According to the poverty statistics in Graysville, males aged under 5 years and females aged under 5 years are the age groups that are most secure financially, with 100.0% of males and 100.0% of females in these age groups living above the poverty line.
| Age Bracket | Male | Female |
| Under 5 Years | 1 (100.0%) | 1 (100.0%) |
| 5 Years | 0 (0.0%) | 0 (0.0%) |
| 6 to 11 Years | 1 (100.0%) | 2 (100.0%) |
| 12 to 14 Years | 1 (100.0%) | 2 (66.7%) |
| 15 Years | 0 (0.0%) | 2 (100.0%) |
| 16 and 17 Years | 2 (100.0%) | 0 (0.0%) |
| 18 to 24 Years | 0 (0.0%) | 5 (100.0%) |
| 25 to 34 Years | 1 (100.0%) | 3 (100.0%) |
| 35 to 44 Years | 1 (100.0%) | 0 (0.0%) |
| 45 to 54 Years | 1 (100.0%) | 9 (75.0%) |
| 55 to 64 Years | 3 (60.0%) | 2 (22.2%) |
| 65 to 74 Years | 4 (44.4%) | 4 (100.0%) |
| 75 Years and over | 2 (100.0%) | 6 (100.0%) |
| Total | 17 (58.6%) | 36 (75.0%) |
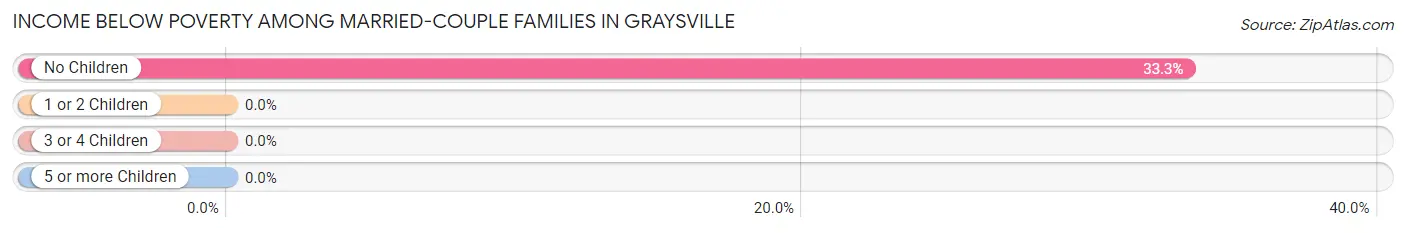
Income Below Poverty Among Married-Couple Families in Graysville
The poverty statistics for married-couple families in Graysville show that 28.6% or 6 of the total 21 families live below the poverty line. Families with no children have the highest poverty rate of 33.3%, comprising of 6 families. On the other hand, families with 1 or 2 children have the lowest poverty rate of 0.0%, which includes 0 families.
| Children | Above Poverty | Below Poverty |
| No Children | 12 (66.7%) | 6 (33.3%) |
| 1 or 2 Children | 2 (100.0%) | 0 (0.0%) |
| 3 or 4 Children | 0 (0.0%) | 0 (0.0%) |
| 5 or more Children | 1 (100.0%) | 0 (0.0%) |
| Total | 15 (71.4%) | 6 (28.6%) |
Income Below Poverty Among Single-Parent Households in Graysville
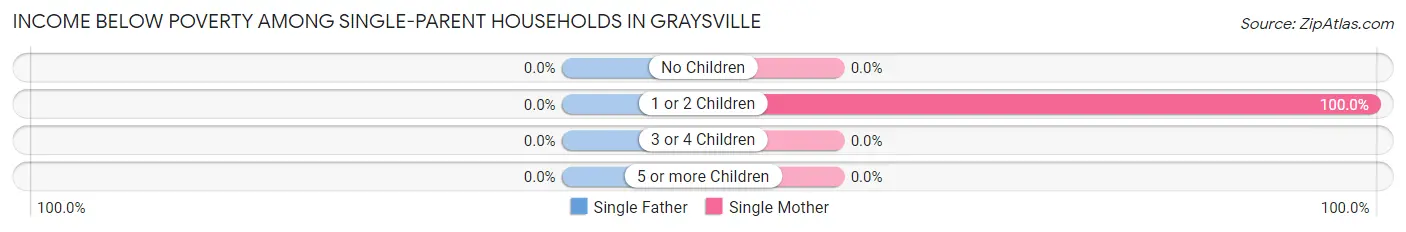
| Children | Single Father | Single Mother |
| No Children | 0 (0.0%) | 0 (0.0%) |
| 1 or 2 Children | 0 (0.0%) | 1 (100.0%) |
| 3 or 4 Children | 0 (0.0%) | 0 (0.0%) |
| 5 or more Children | 0 (0.0%) | 0 (0.0%) |
| Total | 0 (0.0%) | 1 (100.0%) |
Income Below Poverty Among Married-Couple vs Single-Parent Households in Graysville
The poverty data for Graysville shows that 6 of the married-couple family households (28.6%) and 1 of the single-parent households (100.0%) are living below the poverty level. Within the married-couple family households, those with no children have the highest poverty rate, with 6 households (33.3%) falling below the poverty line. Among the single-parent households, those with 1 or 2 children have the highest poverty rate, with 1 household (100.0%) living below poverty.
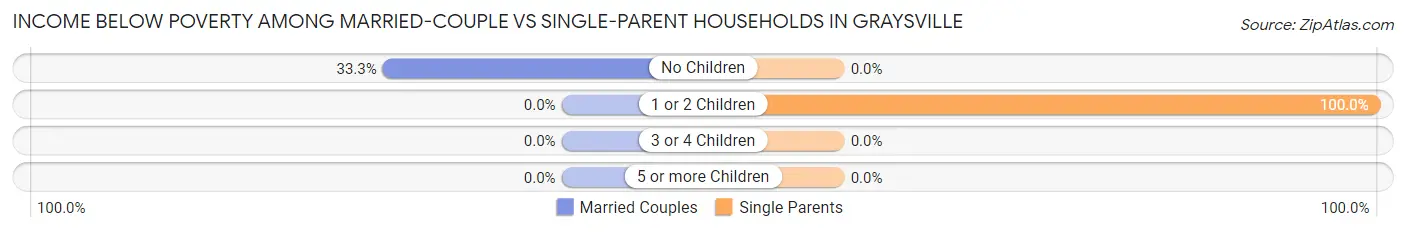
| Children | Married-Couple Families | Single-Parent Households |
| No Children | 6 (33.3%) | 0 (0.0%) |
| 1 or 2 Children | 0 (0.0%) | 1 (100.0%) |
| 3 or 4 Children | 0 (0.0%) | 0 (0.0%) |
| 5 or more Children | 0 (0.0%) | 0 (0.0%) |
| Total | 6 (28.6%) | 1 (100.0%) |
Race in Graysville
The most populous races in Graysville are White / Caucasian (72 | 93.5%), and Two or more Races (5 | 6.5%).
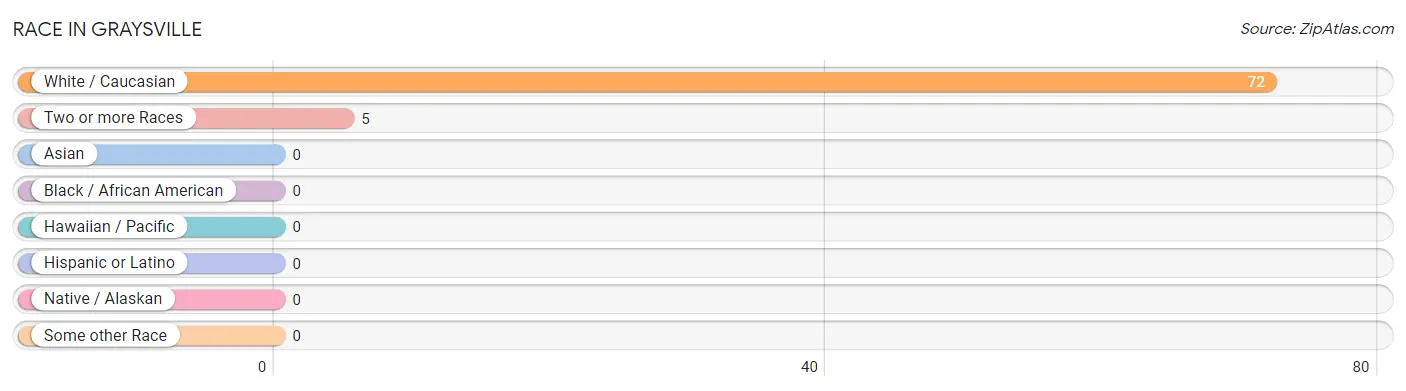
| Race | # Population | % Population |
| Asian | 0 | 0.0% |
| Black / African American | 0 | 0.0% |
| Hawaiian / Pacific | 0 | 0.0% |
| Hispanic or Latino | 0 | 0.0% |
| Native / Alaskan | 0 | 0.0% |
| White / Caucasian | 72 | 93.5% |
| Two or more Races | 5 | 6.5% |
| Some other Race | 0 | 0.0% |
| Total | 77 | 100.0% |
Ancestry in Graysville
The most populous ancestries reported in Graysville are German (24 | 31.2%), Irish (11 | 14.3%), French (9 | 11.7%), American (7 | 9.1%), and British (5 | 6.5%), together accounting for 72.7% of all Graysville residents.
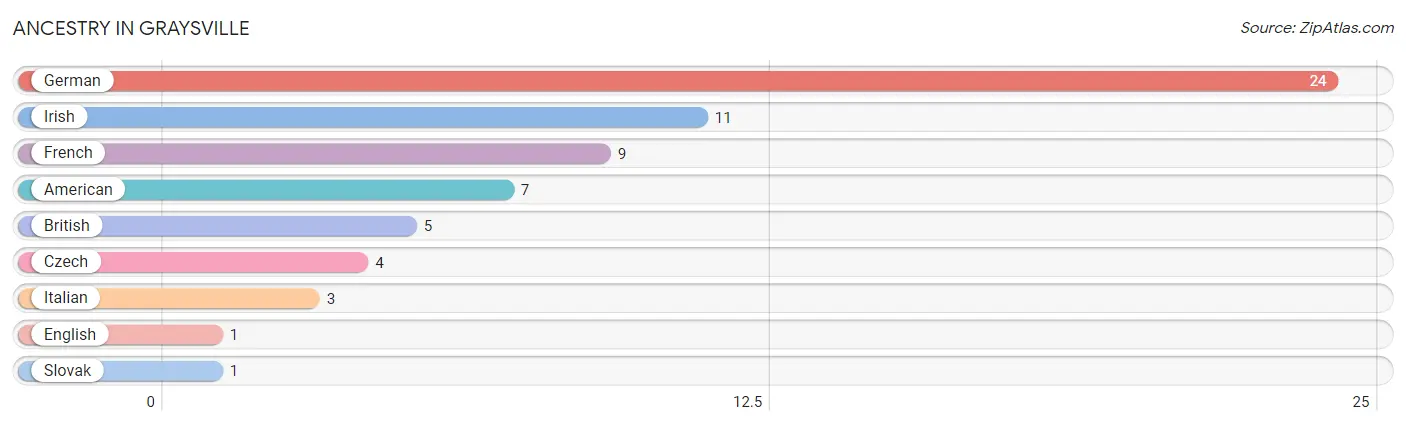
| Ancestry | # Population | % Population |
| American | 7 | 9.1% |
| British | 5 | 6.5% |
| Czech | 4 | 5.2% |
| English | 1 | 1.3% |
| French | 9 | 11.7% |
| German | 24 | 31.2% |
| Irish | 11 | 14.3% |
| Italian | 3 | 3.9% |
| Slovak | 1 | 1.3% | View All 9 Rows |
Immigrants in Graysville

| Immigration Origin | # Population | % Population | View All 0 Rows |
Sex and Age in Graysville
Sex and Age in Graysville
The most populous age groups in Graysville are 65 to 69 Years (6 | 20.7%) for men and 50 to 54 Years (8 | 16.7%) for women.
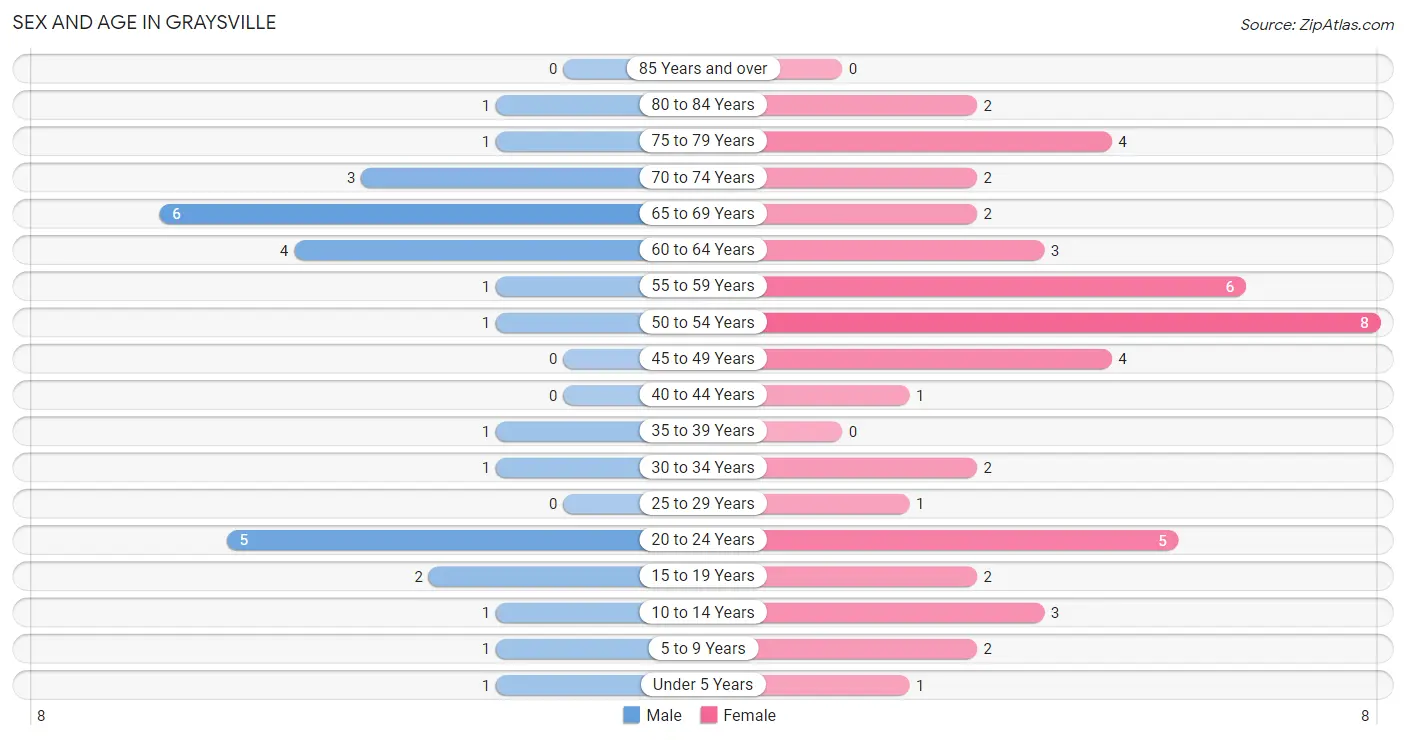
| Age Bracket | Male | Female |
| Under 5 Years | 1 (3.5%) | 1 (2.1%) |
| 5 to 9 Years | 1 (3.5%) | 2 (4.2%) |
| 10 to 14 Years | 1 (3.5%) | 3 (6.2%) |
| 15 to 19 Years | 2 (6.9%) | 2 (4.2%) |
| 20 to 24 Years | 5 (17.2%) | 5 (10.4%) |
| 25 to 29 Years | 0 (0.0%) | 1 (2.1%) |
| 30 to 34 Years | 1 (3.5%) | 2 (4.2%) |
| 35 to 39 Years | 1 (3.5%) | 0 (0.0%) |
| 40 to 44 Years | 0 (0.0%) | 1 (2.1%) |
| 45 to 49 Years | 0 (0.0%) | 4 (8.3%) |
| 50 to 54 Years | 1 (3.5%) | 8 (16.7%) |
| 55 to 59 Years | 1 (3.5%) | 6 (12.5%) |
| 60 to 64 Years | 4 (13.8%) | 3 (6.2%) |
| 65 to 69 Years | 6 (20.7%) | 2 (4.2%) |
| 70 to 74 Years | 3 (10.3%) | 2 (4.2%) |
| 75 to 79 Years | 1 (3.5%) | 4 (8.3%) |
| 80 to 84 Years | 1 (3.5%) | 2 (4.2%) |
| 85 Years and over | 0 (0.0%) | 0 (0.0%) |
| Total | 29 (100.0%) | 48 (100.0%) |
Families and Households in Graysville
Median Family Size in Graysville
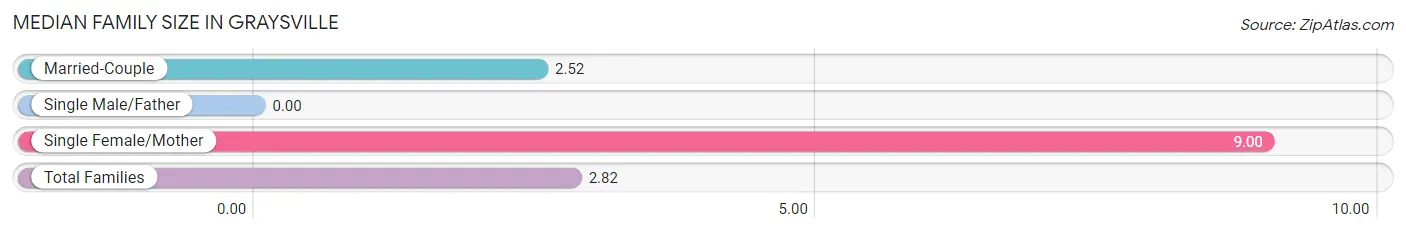
| Family Type | # Families | Family Size |
| Married-Couple | 21 (95.5%) | 2.52 |
| Single Male/Father | 0 (0.0%) | - |
| Single Female/Mother | 1 (4.5%) | 9.00 |
| Total Families | 22 (100.0%) | 2.82 |
Median Household Size in Graysville
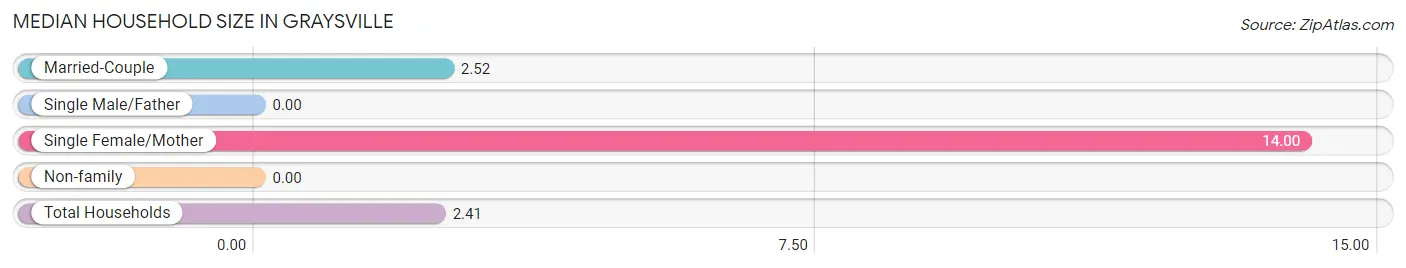
| Household Type | # Households | Household Size |
| Married-Couple | 21 (65.6%) | 2.52 |
| Single Male/Father | 0 (0.0%) | - |
| Single Female/Mother | 1 (3.1%) | 14.00 |
| Non-family | 10 (31.2%) | - |
| Total Households | 32 (100.0%) | 2.41 |
Household Size by Marriage Status in Graysville
Out of a total of 32 households in Graysville, 22 (68.8%) are family households, while 10 (31.2%) are nonfamily households. The most numerous type of family households are 2-person households, comprising 18, and the most common type of nonfamily households are 1-person households, comprising 10.
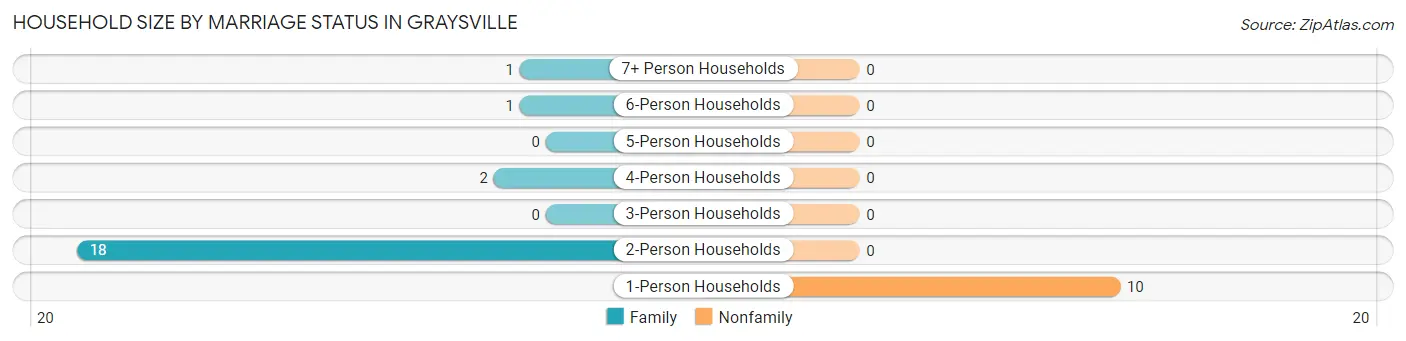
| Household Size | Family Households | Nonfamily Households |
| 1-Person Households | - | 10 (31.2%) |
| 2-Person Households | 18 (56.2%) | 0 (0.0%) |
| 3-Person Households | 0 (0.0%) | 0 (0.0%) |
| 4-Person Households | 2 (6.2%) | 0 (0.0%) |
| 5-Person Households | 0 (0.0%) | 0 (0.0%) |
| 6-Person Households | 1 (3.1%) | 0 (0.0%) |
| 7+ Person Households | 1 (3.1%) | 0 (0.0%) |
| Total | 22 (68.8%) | 10 (31.2%) |
Female Fertility in Graysville
Fertility by Age in Graysville
Average fertility rate in Graysville is 67.0 births per 1,000 women. Women in the age bracket of 20 to 34 years have the highest fertility rate with 125.0 births per 1,000 women. Women in the age bracket of 20 to 34 years acount for 100.0% of all women with births.
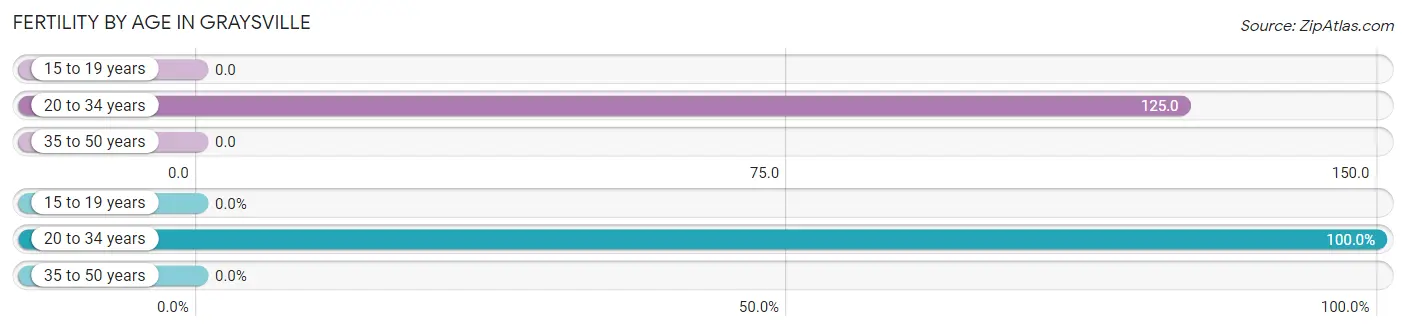
| Age Bracket | Women with Births | Births / 1,000 Women |
| 15 to 19 years | 0 (0.0%) | 0.0 |
| 20 to 34 years | 1 (100.0%) | 125.0 |
| 35 to 50 years | 0 (0.0%) | 0.0 |
| Total | 1 (100.0%) | 67.0 |
Fertility by Age by Marriage Status in Graysville
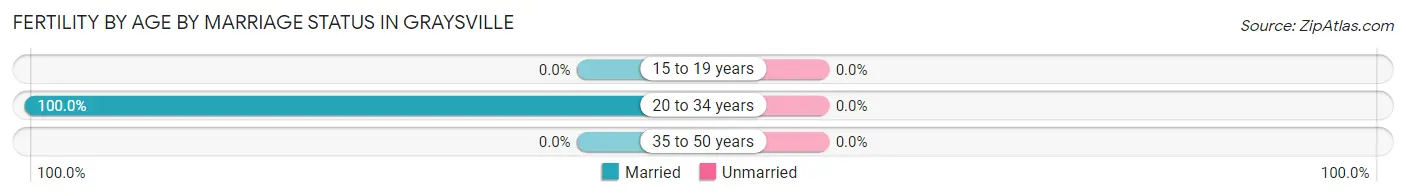
| Age Bracket | Married | Unmarried |
| 15 to 19 years | 0 (0.0%) | 0 (0.0%) |
| 20 to 34 years | 1 (100.0%) | 0 (0.0%) |
| 35 to 50 years | 0 (0.0%) | 0 (0.0%) |
| Total | 1 (100.0%) | 0 (0.0%) |
Fertility by Education in Graysville
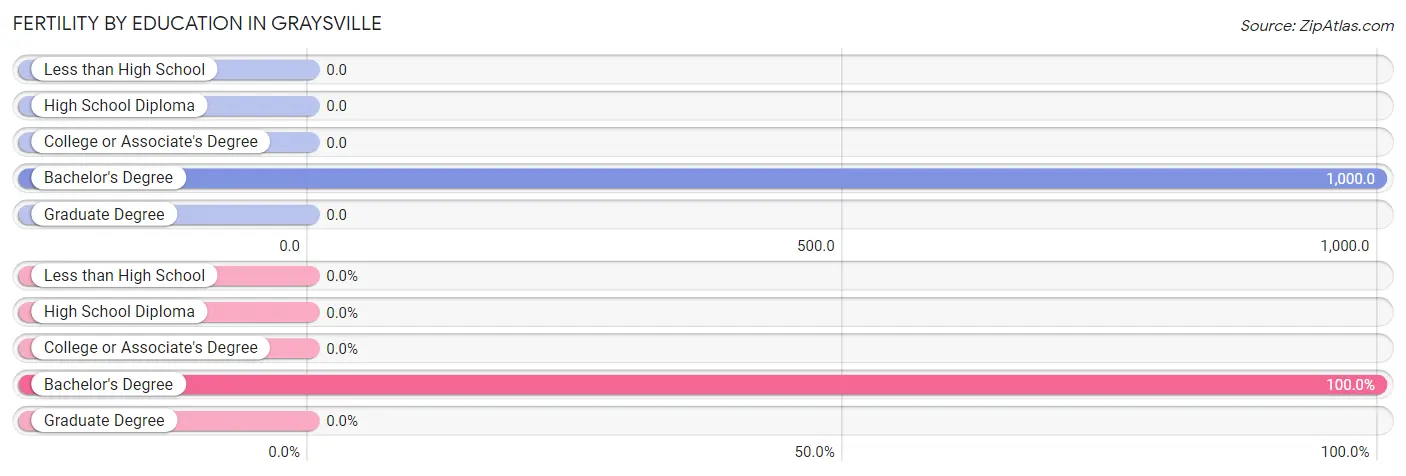
| Educational Attainment | Women with Births | Births / 1,000 Women |
| Less than High School | 0 (0.0%) | 0.0 |
| High School Diploma | 0 (0.0%) | 0.0 |
| College or Associate's Degree | 0 (0.0%) | 0.0 |
| Bachelor's Degree | 1 (100.0%) | 1,000.0 |
| Graduate Degree | 0 (0.0%) | 0.0 |
| Total | 1 (100.0%) | 67.0 |
Fertility by Education by Marriage Status in Graysville
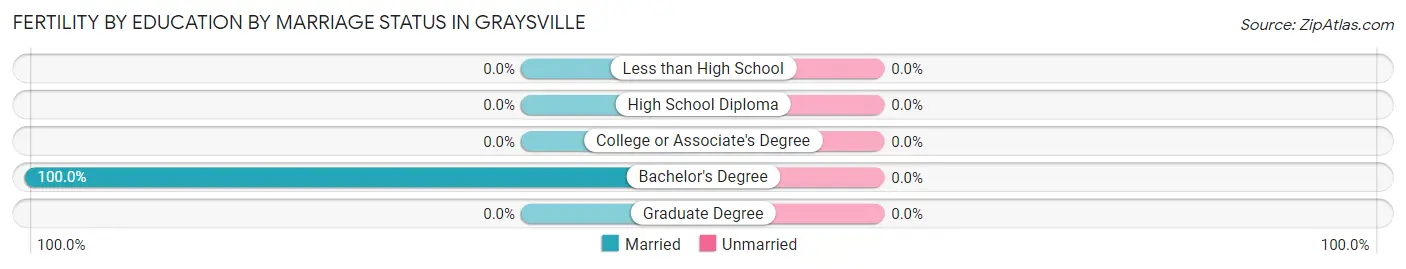
| Educational Attainment | Married | Unmarried |
| Less than High School | 0 (0.0%) | 0 (0.0%) |
| High School Diploma | 0 (0.0%) | 0 (0.0%) |
| College or Associate's Degree | 0 (0.0%) | 0 (0.0%) |
| Bachelor's Degree | 1 (100.0%) | 0 (0.0%) |
| Graduate Degree | 0 (0.0%) | 0 (0.0%) |
| Total | 1 (100.0%) | 0 (0.0%) |
Employment Characteristics in Graysville
Employment by Class of Employer in Graysville
Among the 23 employed individuals in Graysville, local government employees (12 | 52.2%), private company employees (4 | 17.4%), and not-for-profit organizations (3 | 13.0%) make up the most common classes of employment.
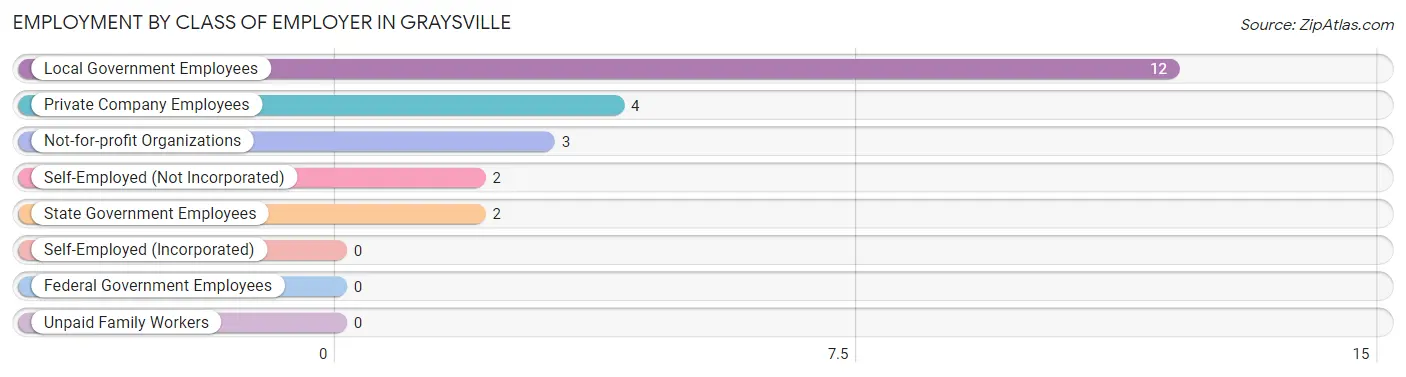
| Employer Class | # Employees | % Employees |
| Private Company Employees | 4 | 17.4% |
| Self-Employed (Incorporated) | 0 | 0.0% |
| Self-Employed (Not Incorporated) | 2 | 8.7% |
| Not-for-profit Organizations | 3 | 13.0% |
| Local Government Employees | 12 | 52.2% |
| State Government Employees | 2 | 8.7% |
| Federal Government Employees | 0 | 0.0% |
| Unpaid Family Workers | 0 | 0.0% |
| Total | 23 | 100.0% |
Employment Status by Age in Graysville
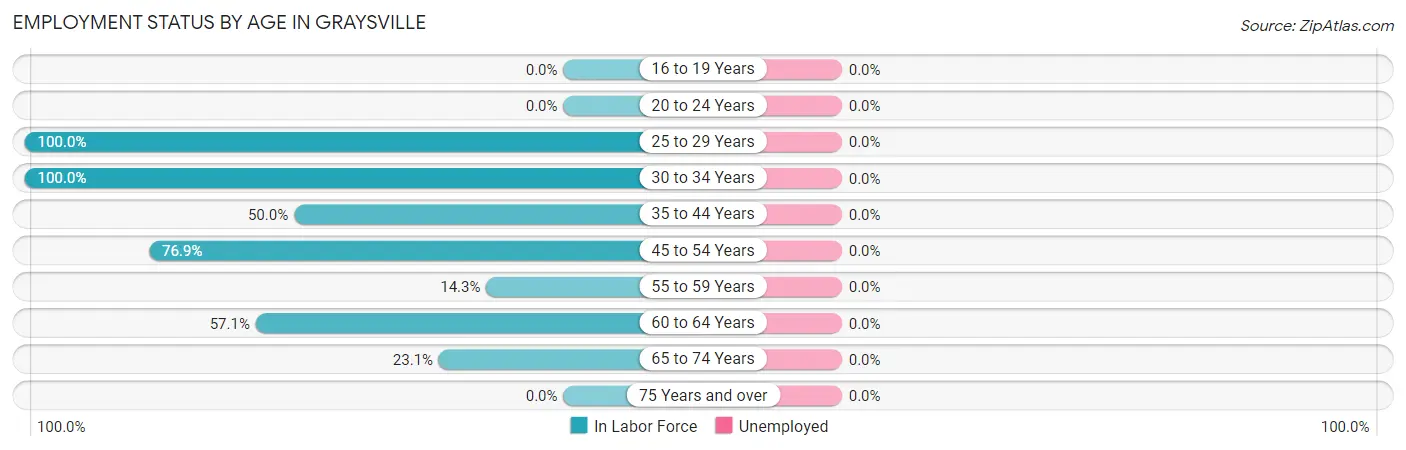
| Age Bracket | In Labor Force | Unemployed |
| 16 to 19 Years | 0 (0.0%) | 0 (0.0%) |
| 20 to 24 Years | 0 (0.0%) | 0 (0.0%) |
| 25 to 29 Years | 1 (100.0%) | 0 (0.0%) |
| 30 to 34 Years | 3 (100.0%) | 0 (0.0%) |
| 35 to 44 Years | 1 (50.0%) | 0 (0.0%) |
| 45 to 54 Years | 10 (76.9%) | 0 (0.0%) |
| 55 to 59 Years | 1 (14.3%) | 0 (0.0%) |
| 60 to 64 Years | 4 (57.1%) | 0 (0.0%) |
| 65 to 74 Years | 3 (23.1%) | 0 (0.0%) |
| 75 Years and over | 0 (0.0%) | 0 (0.0%) |
| Total | 23 (34.8%) | 0 (0.0%) |
Employment Status by Educational Attainment in Graysville
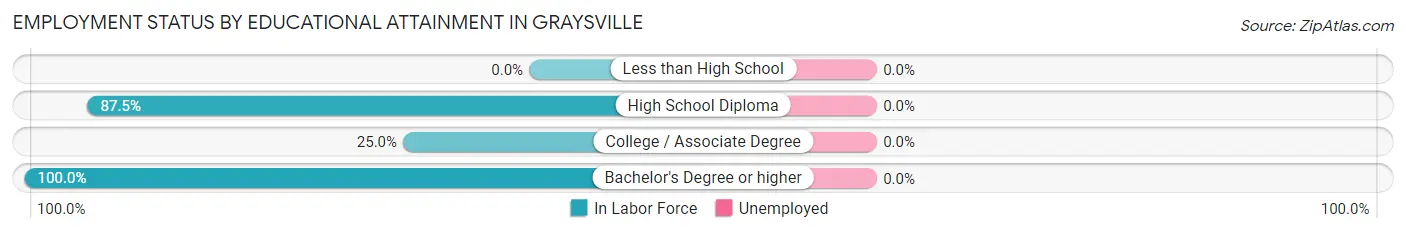
| Educational Attainment | In Labor Force | Unemployed |
| Less than High School | 0 (0.0%) | 0 (0.0%) |
| High School Diploma | 14 (87.5%) | 0 (0.0%) |
| College / Associate Degree | 3 (25.0%) | 0 (0.0%) |
| Bachelor's Degree or higher | 3 (100.0%) | 0 (0.0%) |
| Total | 20 (60.6%) | 0 (0.0%) |
Employment Occupations by Sex in Graysville
Management, Business, Science and Arts Occupations
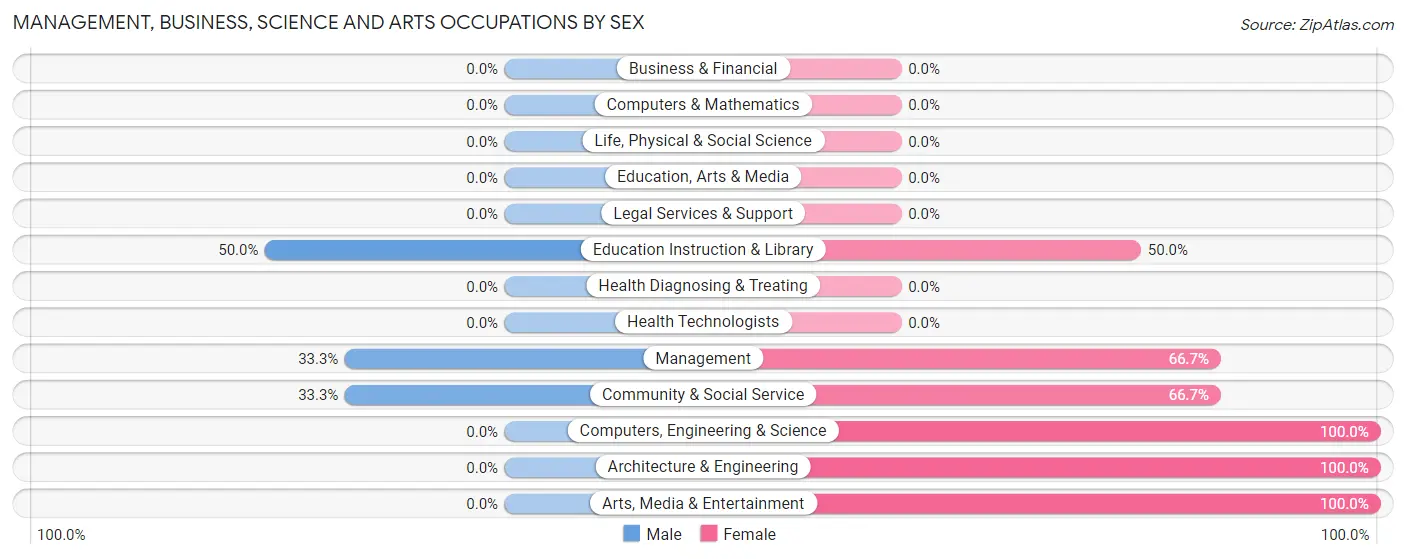
The most common Management, Business, Science and Arts occupations in Graysville are Computers, Engineering & Science (5 | 21.7%), Architecture & Engineering (5 | 21.7%), Management (3 | 13.0%), Community & Social Service (3 | 13.0%), and Education Instruction & Library (2 | 8.7%).
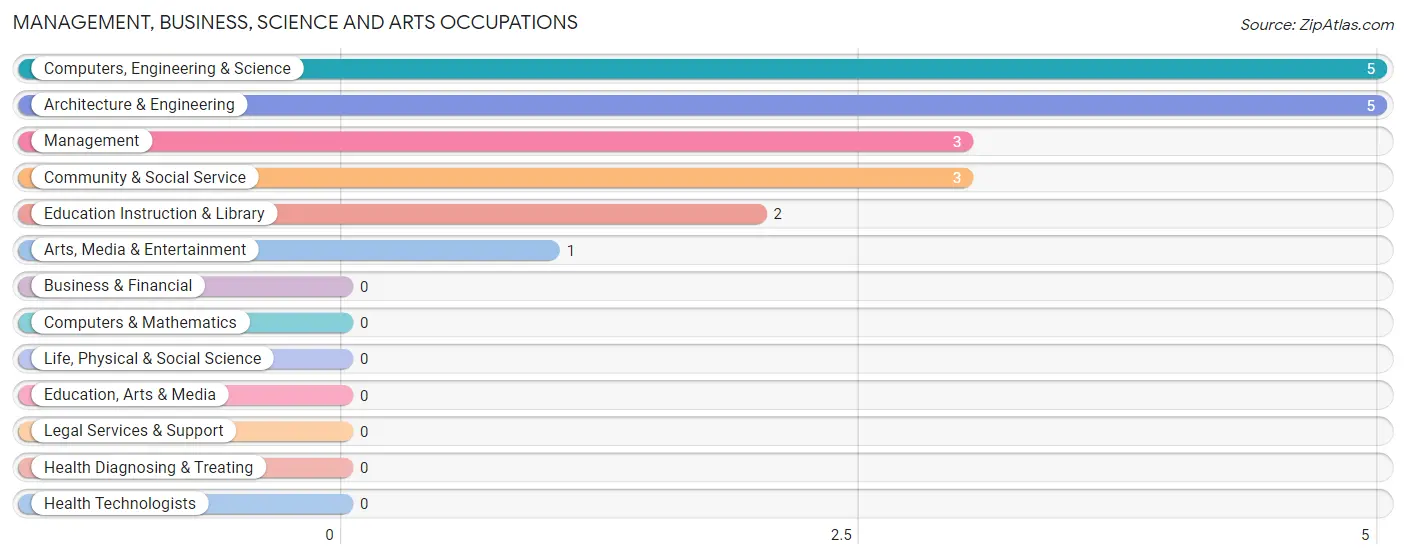
Management, Business, Science and Arts Occupations by Sex
Within the Management, Business, Science and Arts occupations in Graysville, the most male-oriented occupations are Education Instruction & Library (50.0%), Management (33.3%), and Community & Social Service (33.3%), while the most female-oriented occupations are Computers, Engineering & Science (100.0%), Architecture & Engineering (100.0%), and Arts, Media & Entertainment (100.0%).
| Occupation | Male | Female |
| Management | 1 (33.3%) | 2 (66.7%) |
| Business & Financial | 0 (0.0%) | 0 (0.0%) |
| Computers, Engineering & Science | 0 (0.0%) | 5 (100.0%) |
| Computers & Mathematics | 0 (0.0%) | 0 (0.0%) |
| Architecture & Engineering | 0 (0.0%) | 5 (100.0%) |
| Life, Physical & Social Science | 0 (0.0%) | 0 (0.0%) |
| Community & Social Service | 1 (33.3%) | 2 (66.7%) |
| Education, Arts & Media | 0 (0.0%) | 0 (0.0%) |
| Legal Services & Support | 0 (0.0%) | 0 (0.0%) |
| Education Instruction & Library | 1 (50.0%) | 1 (50.0%) |
| Arts, Media & Entertainment | 0 (0.0%) | 1 (100.0%) |
| Health Diagnosing & Treating | 0 (0.0%) | 0 (0.0%) |
| Health Technologists | 0 (0.0%) | 0 (0.0%) |
| Total (Category) | 2 (18.2%) | 9 (81.8%) |
| Total (Overall) | 7 (30.4%) | 16 (69.6%) |
Services Occupations
The most common Services occupations in Graysville are Food Preparation & Serving (4 | 17.4%), Cleaning & Maintenance (2 | 8.7%), Security & Protection (1 | 4.3%), and Firefighting & Prevention (1 | 4.3%).
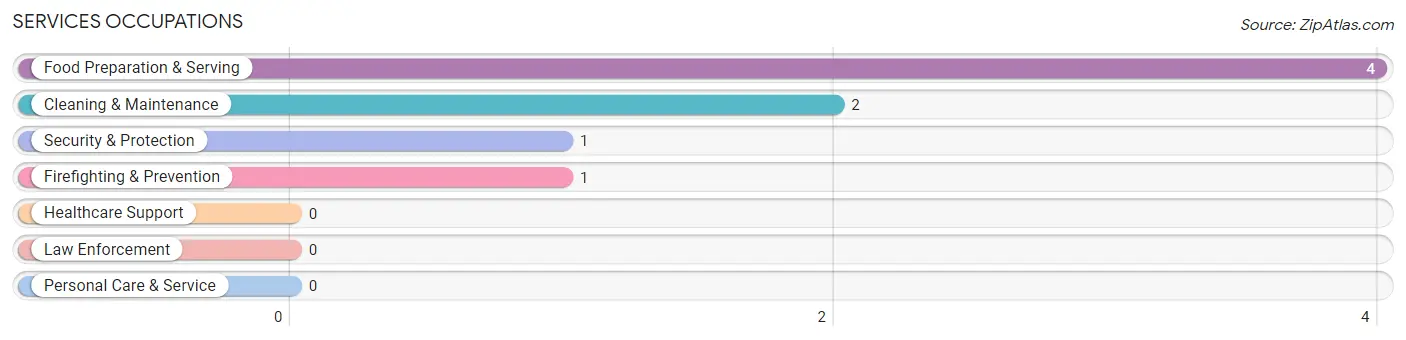
Services Occupations by Sex

| Occupation | Male | Female |
| Healthcare Support | 0 (0.0%) | 0 (0.0%) |
| Security & Protection | 0 (0.0%) | 1 (100.0%) |
| Firefighting & Prevention | 0 (0.0%) | 1 (100.0%) |
| Law Enforcement | 0 (0.0%) | 0 (0.0%) |
| Food Preparation & Serving | 0 (0.0%) | 4 (100.0%) |
| Cleaning & Maintenance | 1 (50.0%) | 1 (50.0%) |
| Personal Care & Service | 0 (0.0%) | 0 (0.0%) |
| Total (Category) | 1 (14.3%) | 6 (85.7%) |
| Total (Overall) | 7 (30.4%) | 16 (69.6%) |
Sales and Office Occupations
The most common Sales and Office occupations in Graysville are , and Sales & Related (3 | 13.0%).

Sales and Office Occupations by Sex

| Occupation | Male | Female |
| Sales & Related | 3 (100.0%) | 0 (0.0%) |
| Office & Administration | 0 (0.0%) | 0 (0.0%) |
| Total (Category) | 3 (100.0%) | 0 (0.0%) |
| Total (Overall) | 7 (30.4%) | 16 (69.6%) |
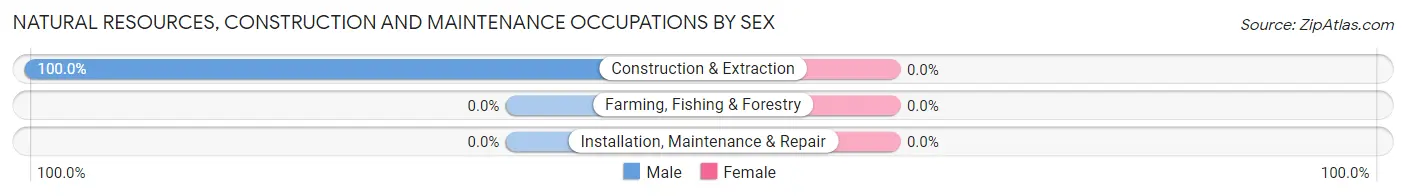
Natural Resources, Construction and Maintenance Occupations
The most common Natural Resources, Construction and Maintenance occupations in Graysville are , and Construction & Extraction (1 | 4.3%).

Natural Resources, Construction and Maintenance Occupations by Sex
| Occupation | Male | Female |
| Farming, Fishing & Forestry | 0 (0.0%) | 0 (0.0%) |
| Construction & Extraction | 1 (100.0%) | 0 (0.0%) |
| Installation, Maintenance & Repair | 0 (0.0%) | 0 (0.0%) |
| Total (Category) | 1 (100.0%) | 0 (0.0%) |
| Total (Overall) | 7 (30.4%) | 16 (69.6%) |
Production, Transportation and Moving Occupations
The most common Production, Transportation and Moving occupations in Graysville are , and Material Moving (1 | 4.3%).
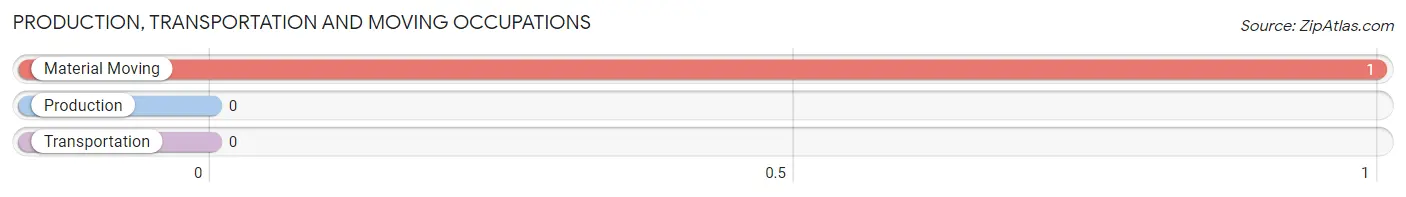
Production, Transportation and Moving Occupations by Sex
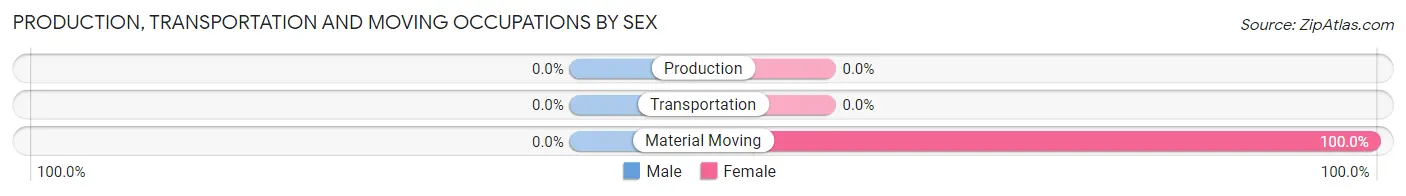
| Occupation | Male | Female |
| Production | 0 (0.0%) | 0 (0.0%) |
| Transportation | 0 (0.0%) | 0 (0.0%) |
| Material Moving | 0 (0.0%) | 1 (100.0%) |
| Total (Category) | 0 (0.0%) | 1 (100.0%) |
| Total (Overall) | 7 (30.4%) | 16 (69.6%) |
Employment Industries by Sex in Graysville
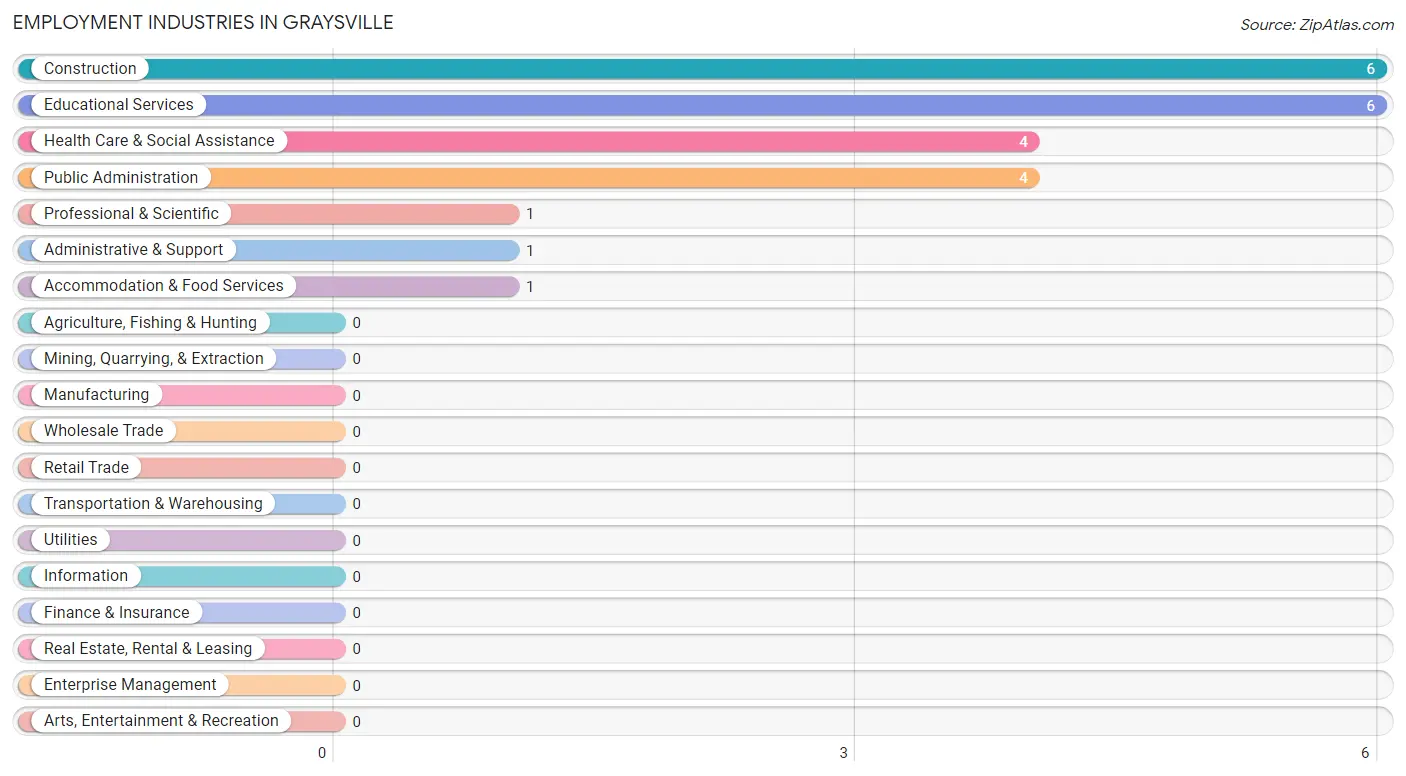
Employment Industries in Graysville
The major employment industries in Graysville include Construction (6 | 26.1%), Educational Services (6 | 26.1%), Health Care & Social Assistance (4 | 17.4%), Public Administration (4 | 17.4%), and Professional & Scientific (1 | 4.3%).
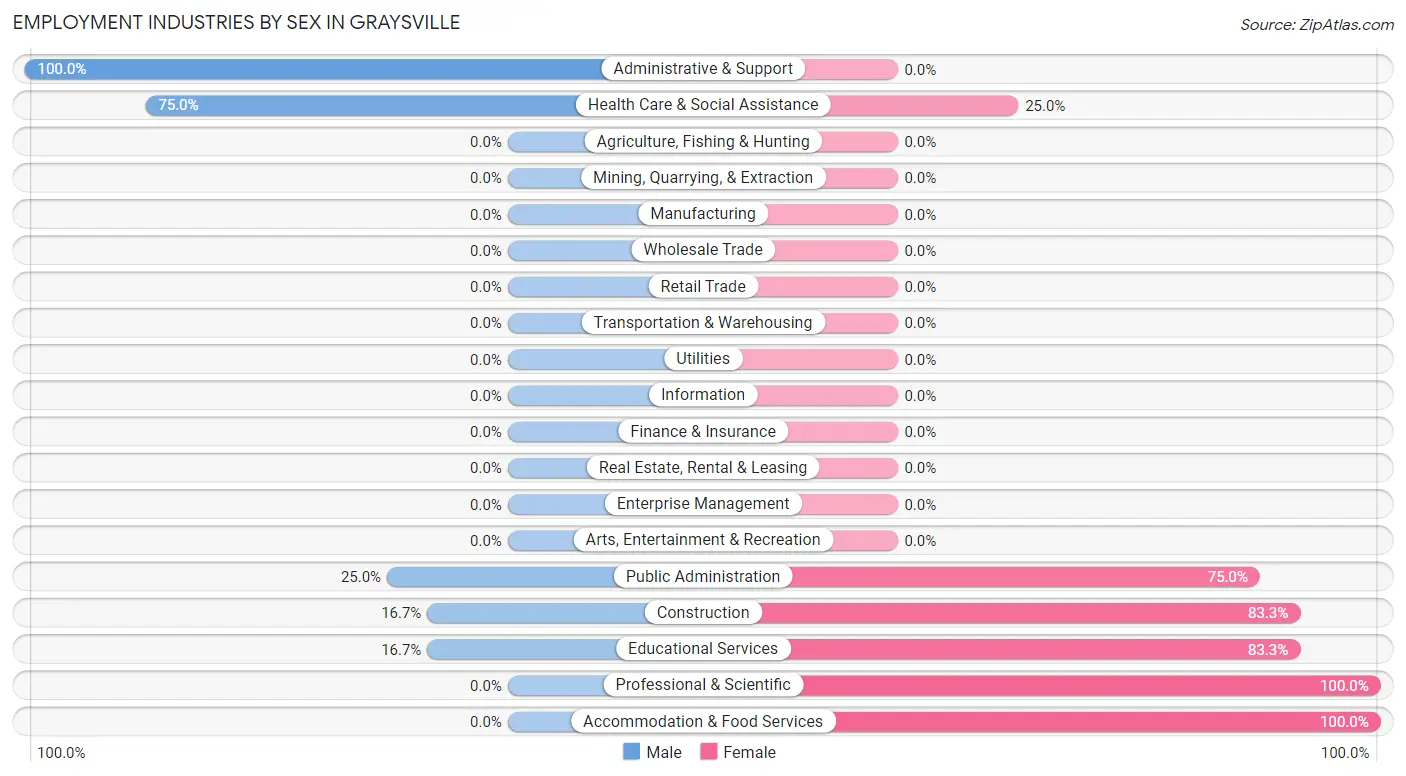
Employment Industries by Sex in Graysville
The Graysville industries that see more men than women are Administrative & Support (100.0%), Health Care & Social Assistance (75.0%), and Public Administration (25.0%), whereas the industries that tend to have a higher number of women are Professional & Scientific (100.0%), Accommodation & Food Services (100.0%), and Construction (83.3%).
| Industry | Male | Female |
| Agriculture, Fishing & Hunting | 0 (0.0%) | 0 (0.0%) |
| Mining, Quarrying, & Extraction | 0 (0.0%) | 0 (0.0%) |
| Construction | 1 (16.7%) | 5 (83.3%) |
| Manufacturing | 0 (0.0%) | 0 (0.0%) |
| Wholesale Trade | 0 (0.0%) | 0 (0.0%) |
| Retail Trade | 0 (0.0%) | 0 (0.0%) |
| Transportation & Warehousing | 0 (0.0%) | 0 (0.0%) |
| Utilities | 0 (0.0%) | 0 (0.0%) |
| Information | 0 (0.0%) | 0 (0.0%) |
| Finance & Insurance | 0 (0.0%) | 0 (0.0%) |
| Real Estate, Rental & Leasing | 0 (0.0%) | 0 (0.0%) |
| Professional & Scientific | 0 (0.0%) | 1 (100.0%) |
| Enterprise Management | 0 (0.0%) | 0 (0.0%) |
| Administrative & Support | 1 (100.0%) | 0 (0.0%) |
| Educational Services | 1 (16.7%) | 5 (83.3%) |
| Health Care & Social Assistance | 3 (75.0%) | 1 (25.0%) |
| Arts, Entertainment & Recreation | 0 (0.0%) | 0 (0.0%) |
| Accommodation & Food Services | 0 (0.0%) | 1 (100.0%) |
| Public Administration | 1 (25.0%) | 3 (75.0%) |
| Total | 7 (30.4%) | 16 (69.6%) |
Education in Graysville
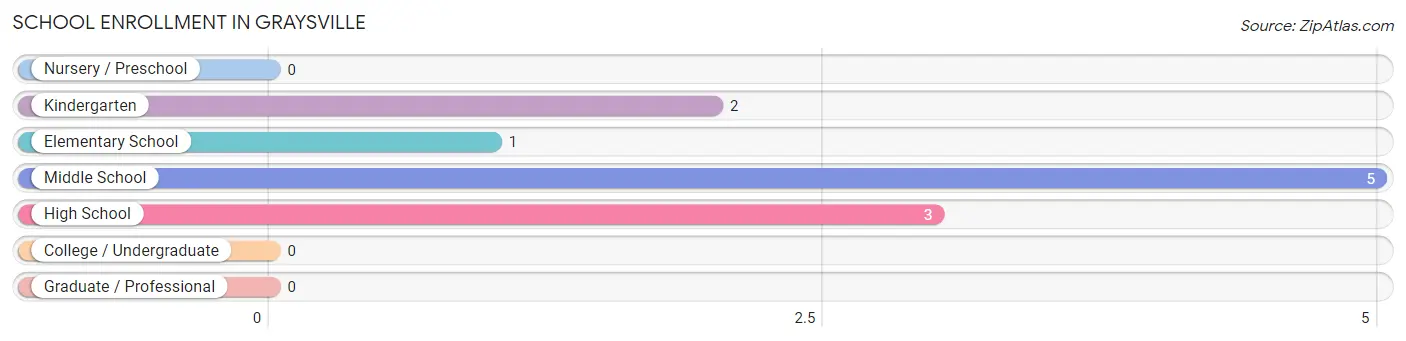
School Enrollment in Graysville
The most common levels of schooling among the 11 students in Graysville are middle school (5 | 45.5%), high school (3 | 27.3%), and kindergarten (2 | 18.2%).
| School Level | # Students | % Students |
| Nursery / Preschool | 0 | 0.0% |
| Kindergarten | 2 | 18.2% |
| Elementary School | 1 | 9.1% |
| Middle School | 5 | 45.5% |
| High School | 3 | 27.3% |
| College / Undergraduate | 0 | 0.0% |
| Graduate / Professional | 0 | 0.0% |
| Total | 11 | 100.0% |
School Enrollment by Age by Funding Source in Graysville
Out of a total of 11 students who are enrolled in schools in Graysville, 3 (27.3%) attend a private institution, while the remaining 8 (72.7%) are enrolled in public schools. The age group of 5 to 9 year old has the highest likelihood of being enrolled in private schools, with 2 (66.7% in the age bracket) enrolled. Conversely, the age group of 15 to 17 year olds has the lowest likelihood of being enrolled in a private school, with 4 (100.0% in the age bracket) attending a public institution.
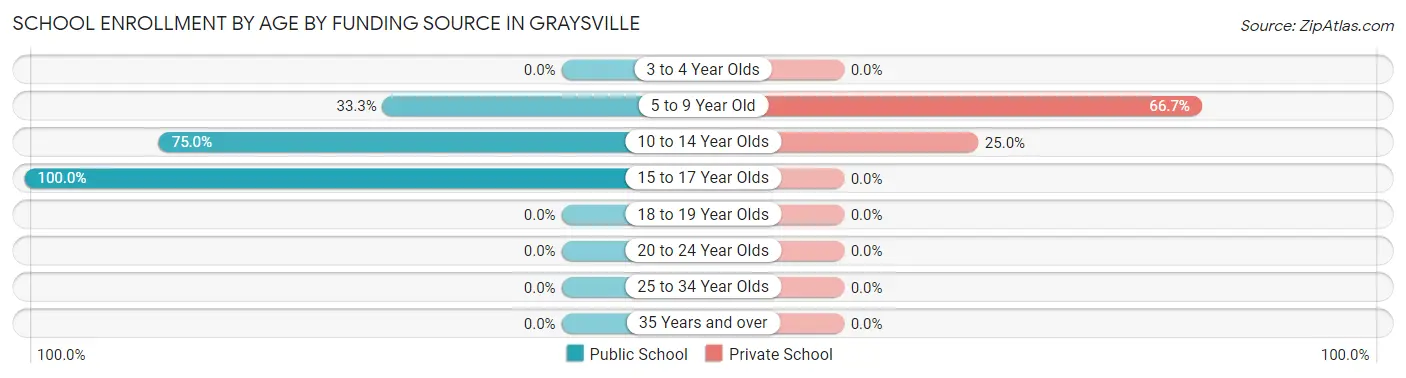
| Age Bracket | Public School | Private School |
| 3 to 4 Year Olds | 0 (0.0%) | 0 (0.0%) |
| 5 to 9 Year Old | 1 (33.3%) | 2 (66.7%) |
| 10 to 14 Year Olds | 3 (75.0%) | 1 (25.0%) |
| 15 to 17 Year Olds | 4 (100.0%) | 0 (0.0%) |
| 18 to 19 Year Olds | 0 (0.0%) | 0 (0.0%) |
| 20 to 24 Year Olds | 0 (0.0%) | 0 (0.0%) |
| 25 to 34 Year Olds | 0 (0.0%) | 0 (0.0%) |
| 35 Years and over | 0 (0.0%) | 0 (0.0%) |
| Total | 8 (72.7%) | 3 (27.3%) |
Educational Attainment by Field of Study in Graysville
Visual & performing arts (6 | 60.0%), education (2 | 20.0%), science & technology (1 | 10.0%), and arts & humanities (1 | 10.0%) are the most common fields of study among 10 individuals in Graysville who have obtained a bachelor's degree or higher.
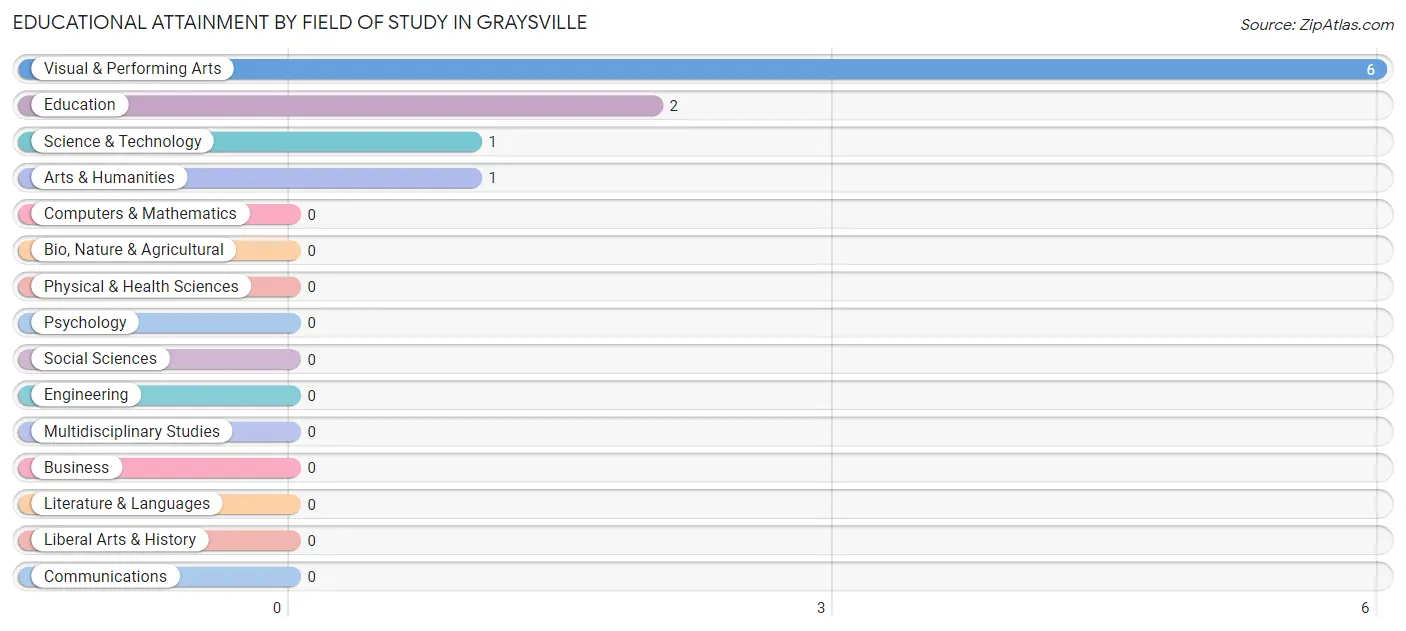
| Field of Study | # Graduates | % Graduates |
| Computers & Mathematics | 0 | 0.0% |
| Bio, Nature & Agricultural | 0 | 0.0% |
| Physical & Health Sciences | 0 | 0.0% |
| Psychology | 0 | 0.0% |
| Social Sciences | 0 | 0.0% |
| Engineering | 0 | 0.0% |
| Multidisciplinary Studies | 0 | 0.0% |
| Science & Technology | 1 | 10.0% |
| Business | 0 | 0.0% |
| Education | 2 | 20.0% |
| Literature & Languages | 0 | 0.0% |
| Liberal Arts & History | 0 | 0.0% |
| Visual & Performing Arts | 6 | 60.0% |
| Communications | 0 | 0.0% |
| Arts & Humanities | 1 | 10.0% |
| Total | 10 | 100.0% |
Transportation & Commute in Graysville
Vehicle Availability by Sex in Graysville
The most prevalent vehicle ownership categories in Graysville are males with 3 vehicles (4, accounting for 57.1%) and females with 3 vehicles (8, making up 25.0%).
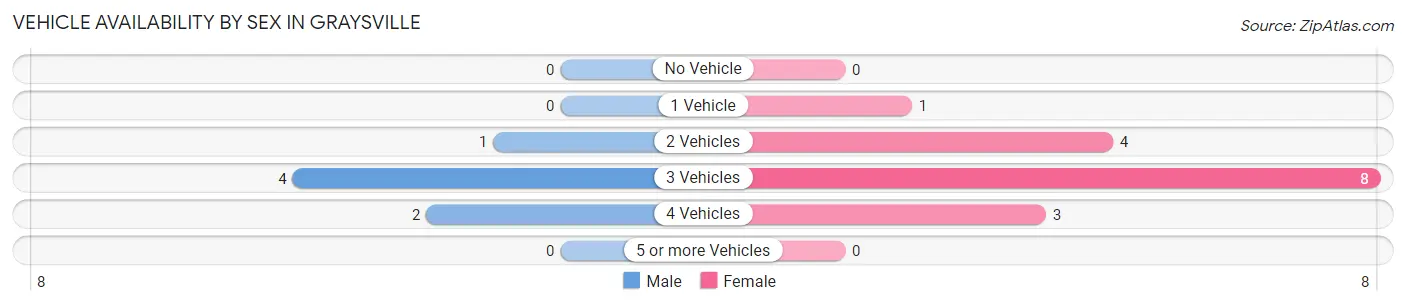
| Vehicles Available | Male | Female |
| No Vehicle | 0 (0.0%) | 0 (0.0%) |
| 1 Vehicle | 0 (0.0%) | 1 (6.2%) |
| 2 Vehicles | 1 (14.3%) | 4 (25.0%) |
| 3 Vehicles | 4 (57.1%) | 8 (50.0%) |
| 4 Vehicles | 2 (28.6%) | 3 (18.8%) |
| 5 or more Vehicles | 0 (0.0%) | 0 (0.0%) |
| Total | 7 (100.0%) | 16 (100.0%) |
Commute Time in Graysville
The most frequently occuring commute durations in Graysville are 20 to 24 minutes (6 commuters, 30.0%), 15 to 19 minutes (4 commuters, 20.0%), and 60 to 89 minutes (4 commuters, 20.0%).
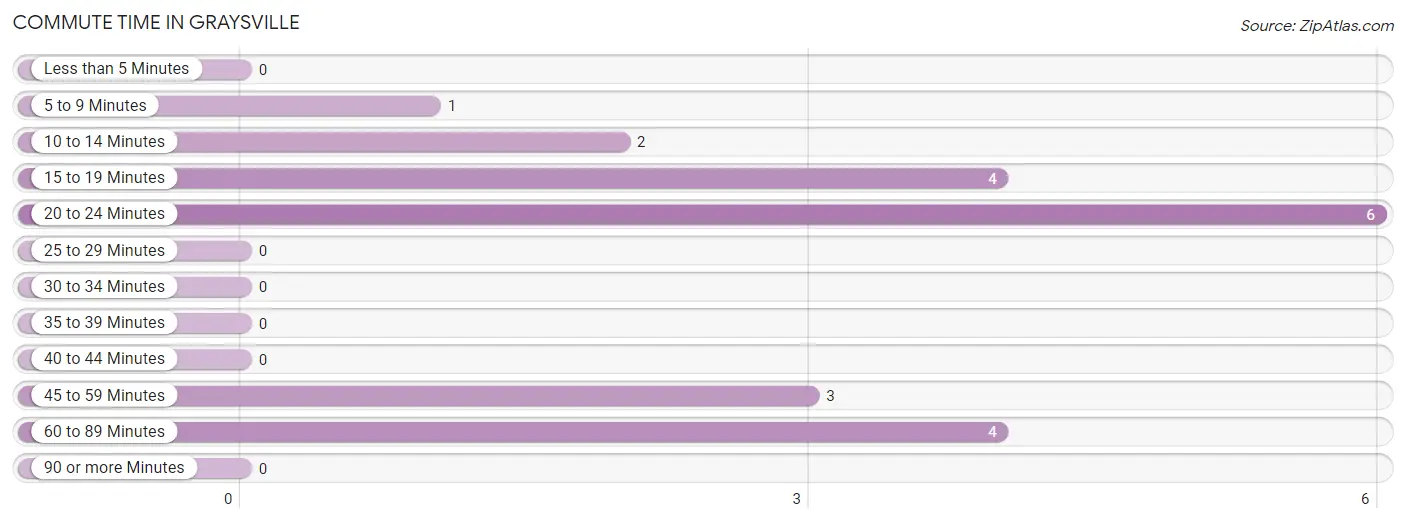
| Commute Time | # Commuters | % Commuters |
| Less than 5 Minutes | 0 | 0.0% |
| 5 to 9 Minutes | 1 | 5.0% |
| 10 to 14 Minutes | 2 | 10.0% |
| 15 to 19 Minutes | 4 | 20.0% |
| 20 to 24 Minutes | 6 | 30.0% |
| 25 to 29 Minutes | 0 | 0.0% |
| 30 to 34 Minutes | 0 | 0.0% |
| 35 to 39 Minutes | 0 | 0.0% |
| 40 to 44 Minutes | 0 | 0.0% |
| 45 to 59 Minutes | 3 | 15.0% |
| 60 to 89 Minutes | 4 | 20.0% |
| 90 or more Minutes | 0 | 0.0% |
Commute Time by Sex in Graysville
The most common commute times in Graysville are 60 to 89 minutes (3 commuters, 50.0%) for males and 20 to 24 minutes (6 commuters, 42.9%) for females.
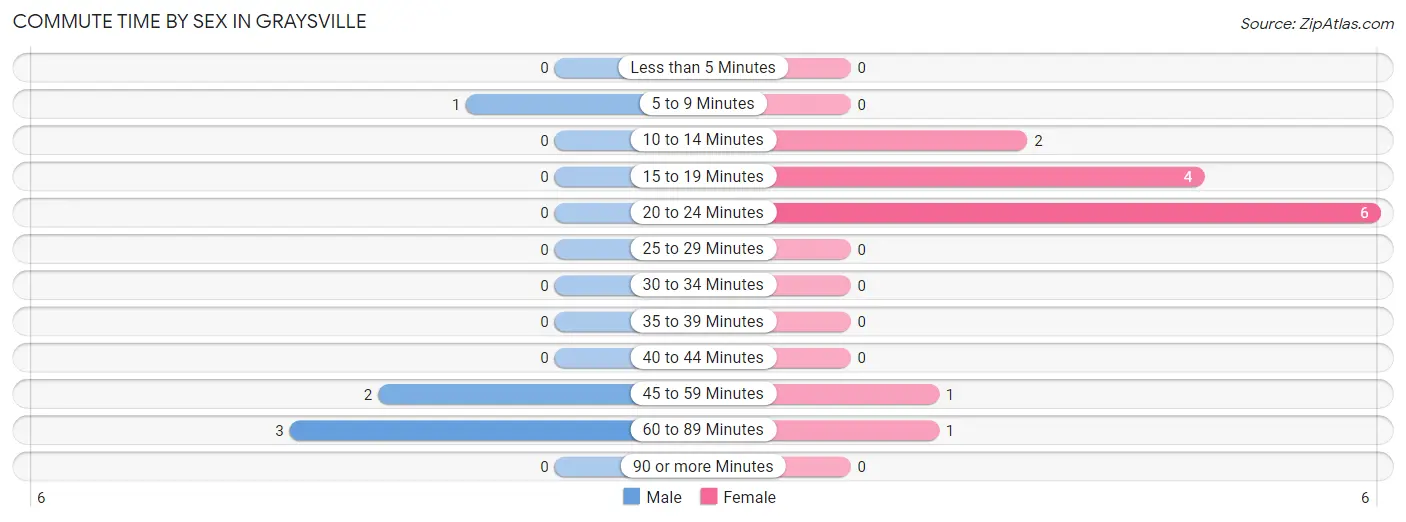
| Commute Time | Male | Female |
| Less than 5 Minutes | 0 (0.0%) | 0 (0.0%) |
| 5 to 9 Minutes | 1 (16.7%) | 0 (0.0%) |
| 10 to 14 Minutes | 0 (0.0%) | 2 (14.3%) |
| 15 to 19 Minutes | 0 (0.0%) | 4 (28.6%) |
| 20 to 24 Minutes | 0 (0.0%) | 6 (42.9%) |
| 25 to 29 Minutes | 0 (0.0%) | 0 (0.0%) |
| 30 to 34 Minutes | 0 (0.0%) | 0 (0.0%) |
| 35 to 39 Minutes | 0 (0.0%) | 0 (0.0%) |
| 40 to 44 Minutes | 0 (0.0%) | 0 (0.0%) |
| 45 to 59 Minutes | 2 (33.3%) | 1 (7.1%) |
| 60 to 89 Minutes | 3 (50.0%) | 1 (7.1%) |
| 90 or more Minutes | 0 (0.0%) | 0 (0.0%) |
Time of Departure to Work by Sex in Graysville
The most frequent times of departure to work in Graysville are 6:00 AM to 6:29 AM (4, 66.7%) for males and 6:00 AM to 6:29 AM (6, 42.9%) for females.
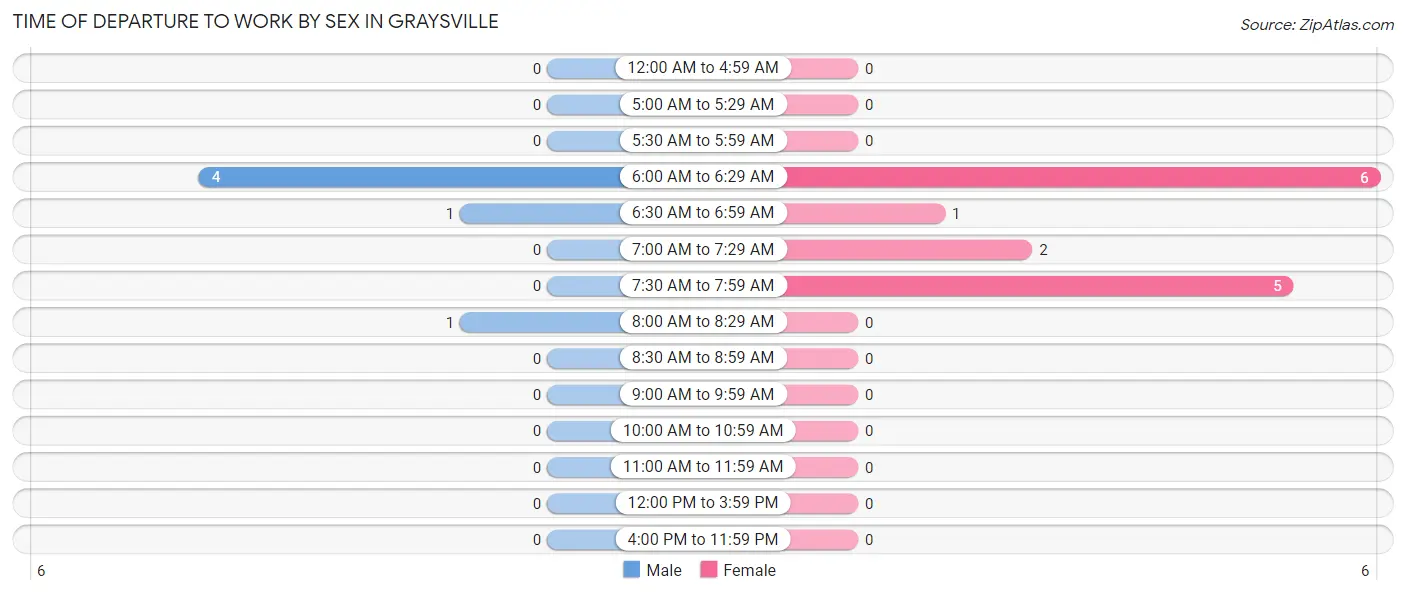
| Time of Departure | Male | Female |
| 12:00 AM to 4:59 AM | 0 (0.0%) | 0 (0.0%) |
| 5:00 AM to 5:29 AM | 0 (0.0%) | 0 (0.0%) |
| 5:30 AM to 5:59 AM | 0 (0.0%) | 0 (0.0%) |
| 6:00 AM to 6:29 AM | 4 (66.7%) | 6 (42.9%) |
| 6:30 AM to 6:59 AM | 1 (16.7%) | 1 (7.1%) |
| 7:00 AM to 7:29 AM | 0 (0.0%) | 2 (14.3%) |
| 7:30 AM to 7:59 AM | 0 (0.0%) | 5 (35.7%) |
| 8:00 AM to 8:29 AM | 1 (16.7%) | 0 (0.0%) |
| 8:30 AM to 8:59 AM | 0 (0.0%) | 0 (0.0%) |
| 9:00 AM to 9:59 AM | 0 (0.0%) | 0 (0.0%) |
| 10:00 AM to 10:59 AM | 0 (0.0%) | 0 (0.0%) |
| 11:00 AM to 11:59 AM | 0 (0.0%) | 0 (0.0%) |
| 12:00 PM to 3:59 PM | 0 (0.0%) | 0 (0.0%) |
| 4:00 PM to 11:59 PM | 0 (0.0%) | 0 (0.0%) |
| Total | 6 (100.0%) | 14 (100.0%) |
Housing Occupancy in Graysville
Occupancy by Ownership in Graysville
Of the total 32 dwellings in Graysville, owner-occupied units account for 31 (96.9%), while renter-occupied units make up 1 (3.1%).
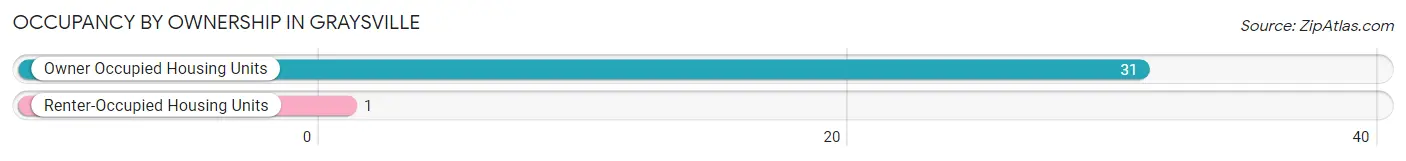
| Occupancy | # Housing Units | % Housing Units |
| Owner Occupied Housing Units | 31 | 96.9% |
| Renter-Occupied Housing Units | 1 | 3.1% |
| Total Occupied Housing Units | 32 | 100.0% |
Occupancy by Household Size in Graysville
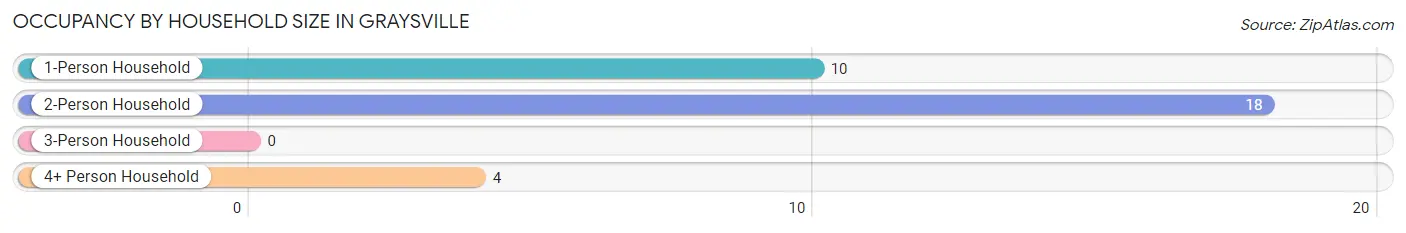
| Household Size | # Housing Units | % Housing Units |
| 1-Person Household | 10 | 31.2% |
| 2-Person Household | 18 | 56.2% |
| 3-Person Household | 0 | 0.0% |
| 4+ Person Household | 4 | 12.5% |
| Total Housing Units | 32 | 100.0% |
Occupancy by Ownership by Household Size in Graysville
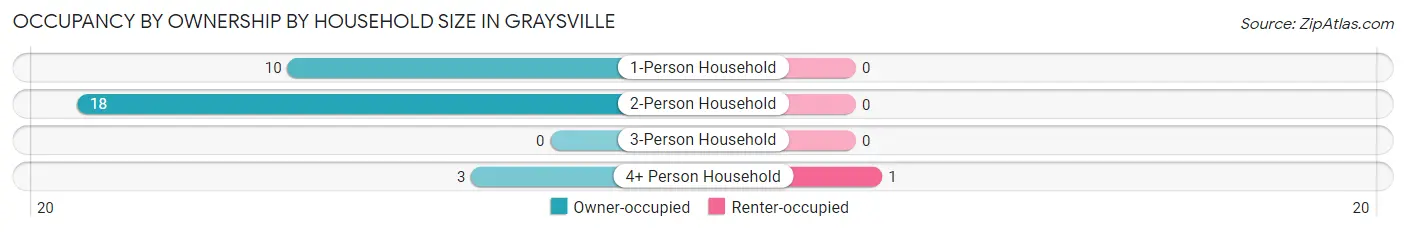
| Household Size | Owner-occupied | Renter-occupied |
| 1-Person Household | 10 (100.0%) | 0 (0.0%) |
| 2-Person Household | 18 (100.0%) | 0 (0.0%) |
| 3-Person Household | 0 (0.0%) | 0 (0.0%) |
| 4+ Person Household | 3 (75.0%) | 1 (25.0%) |
| Total Housing Units | 31 (96.9%) | 1 (3.1%) |
Occupancy by Educational Attainment in Graysville
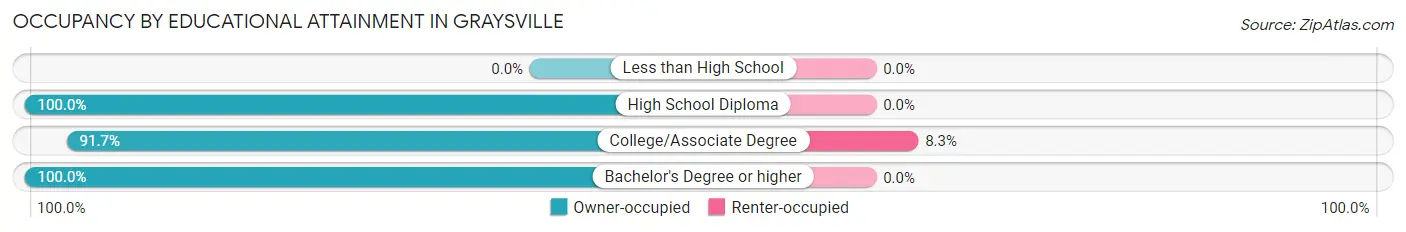
| Household Size | Owner-occupied | Renter-occupied |
| Less than High School | 0 (0.0%) | 0 (0.0%) |
| High School Diploma | 13 (100.0%) | 0 (0.0%) |
| College/Associate Degree | 11 (91.7%) | 1 (8.3%) |
| Bachelor's Degree or higher | 7 (100.0%) | 0 (0.0%) |
Occupancy by Age of Householder in Graysville
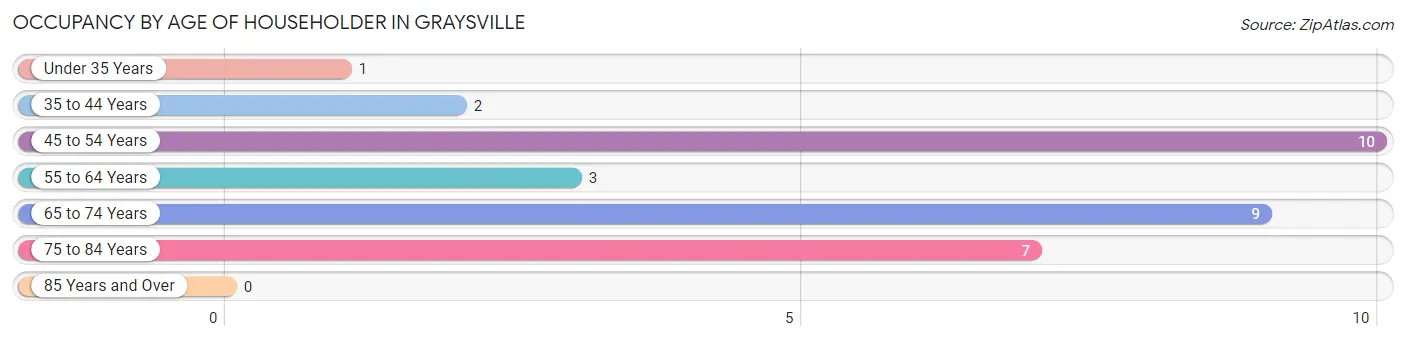
| Age Bracket | # Households | % Households |
| Under 35 Years | 1 | 3.1% |
| 35 to 44 Years | 2 | 6.2% |
| 45 to 54 Years | 10 | 31.2% |
| 55 to 64 Years | 3 | 9.4% |
| 65 to 74 Years | 9 | 28.1% |
| 75 to 84 Years | 7 | 21.9% |
| 85 Years and Over | 0 | 0.0% |
| Total | 32 | 100.0% |
Housing Finances in Graysville
Median Income by Occupancy in Graysville
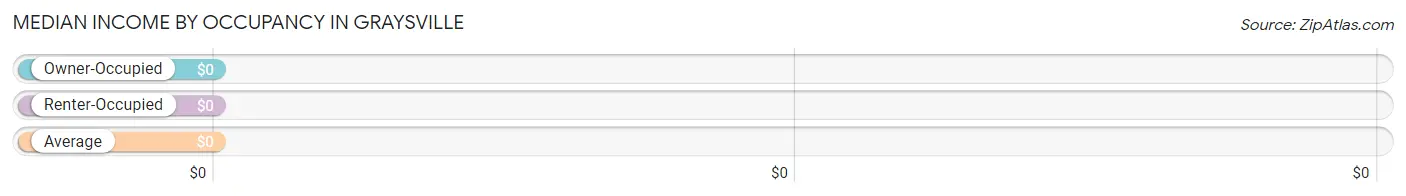
| Occupancy Type | # Households | Median Income |
| Owner-Occupied | 31 (96.9%) | $0 |
| Renter-Occupied | 1 (3.1%) | $0 |
| Average | 32 (100.0%) | $0 |
Occupancy by Householder Income Bracket in Graysville
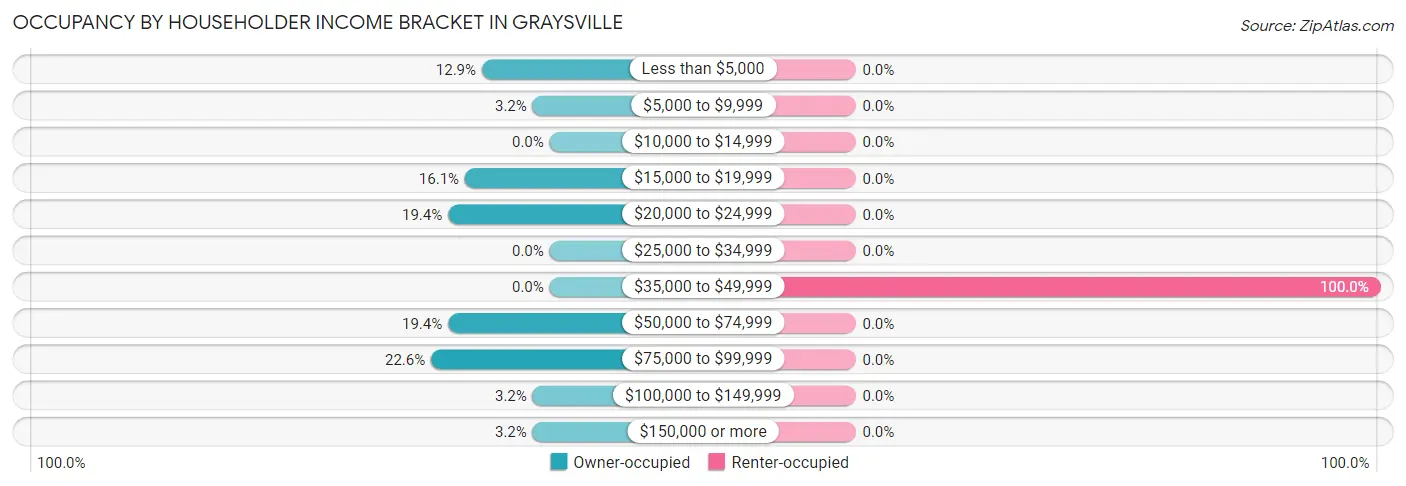
| Income Bracket | Owner-occupied | Renter-occupied |
| Less than $5,000 | 4 (12.9%) | 0 (0.0%) |
| $5,000 to $9,999 | 1 (3.2%) | 0 (0.0%) |
| $10,000 to $14,999 | 0 (0.0%) | 0 (0.0%) |
| $15,000 to $19,999 | 5 (16.1%) | 0 (0.0%) |
| $20,000 to $24,999 | 6 (19.4%) | 0 (0.0%) |
| $25,000 to $34,999 | 0 (0.0%) | 0 (0.0%) |
| $35,000 to $49,999 | 0 (0.0%) | 1 (100.0%) |
| $50,000 to $74,999 | 6 (19.4%) | 0 (0.0%) |
| $75,000 to $99,999 | 7 (22.6%) | 0 (0.0%) |
| $100,000 to $149,999 | 1 (3.2%) | 0 (0.0%) |
| $150,000 or more | 1 (3.2%) | 0 (0.0%) |
| Total | 31 (100.0%) | 1 (100.0%) |
Monthly Housing Cost Tiers in Graysville
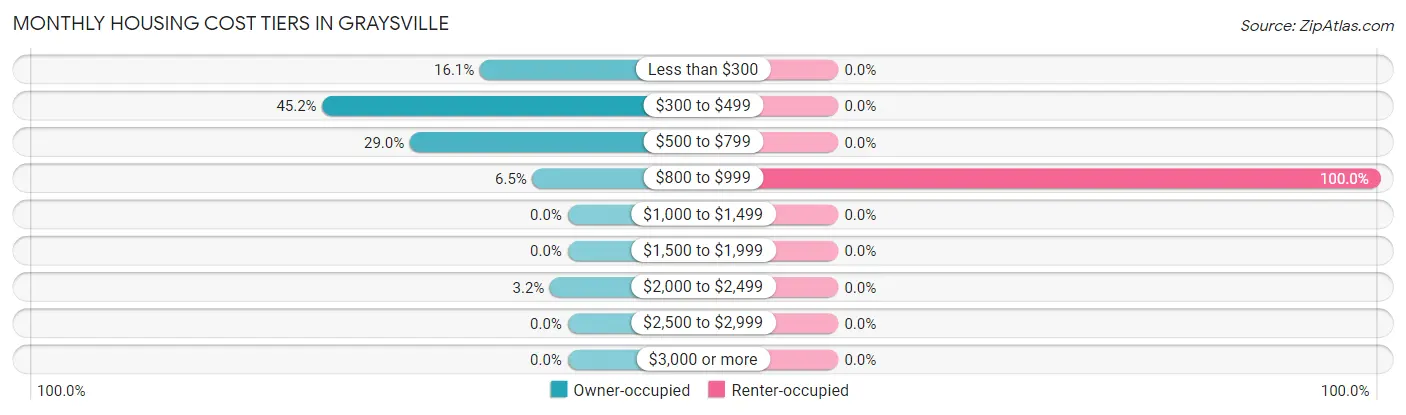
| Monthly Cost | Owner-occupied | Renter-occupied |
| Less than $300 | 5 (16.1%) | 0 (0.0%) |
| $300 to $499 | 14 (45.2%) | 0 (0.0%) |
| $500 to $799 | 9 (29.0%) | 0 (0.0%) |
| $800 to $999 | 2 (6.5%) | 1 (100.0%) |
| $1,000 to $1,499 | 0 (0.0%) | 0 (0.0%) |
| $1,500 to $1,999 | 0 (0.0%) | 0 (0.0%) |
| $2,000 to $2,499 | 1 (3.2%) | 0 (0.0%) |
| $2,500 to $2,999 | 0 (0.0%) | 0 (0.0%) |
| $3,000 or more | 0 (0.0%) | 0 (0.0%) |
| Total | 31 (100.0%) | 1 (100.0%) |
Physical Housing Characteristics in Graysville
Housing Structures in Graysville
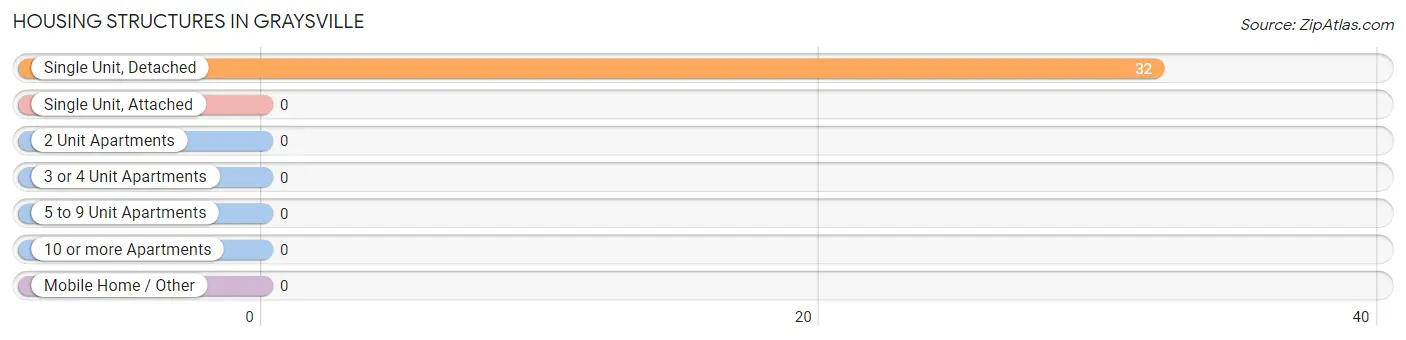
| Structure Type | # Housing Units | % Housing Units |
| Single Unit, Detached | 32 | 100.0% |
| Single Unit, Attached | 0 | 0.0% |
| 2 Unit Apartments | 0 | 0.0% |
| 3 or 4 Unit Apartments | 0 | 0.0% |
| 5 to 9 Unit Apartments | 0 | 0.0% |
| 10 or more Apartments | 0 | 0.0% |
| Mobile Home / Other | 0 | 0.0% |
| Total | 32 | 100.0% |
Housing Structures by Occupancy in Graysville
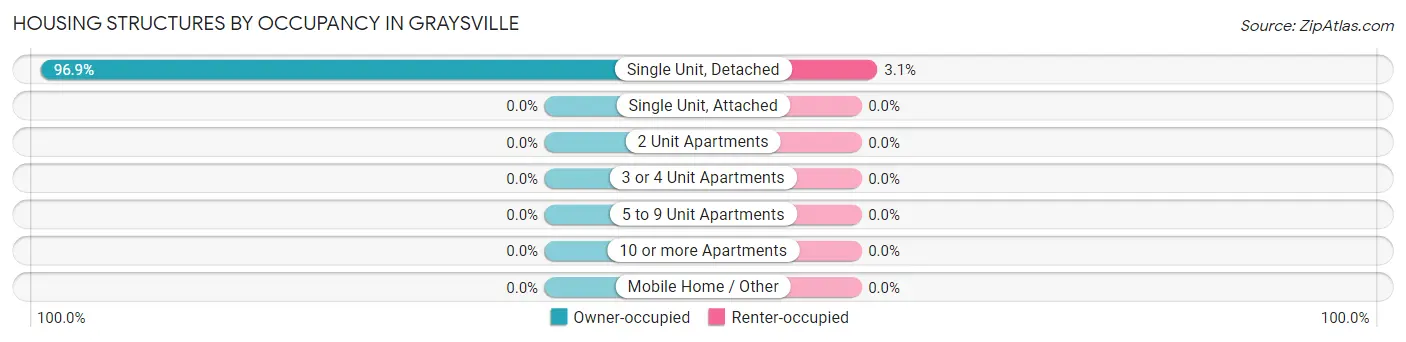
| Structure Type | Owner-occupied | Renter-occupied |
| Single Unit, Detached | 31 (96.9%) | 1 (3.1%) |
| Single Unit, Attached | 0 (0.0%) | 0 (0.0%) |
| 2 Unit Apartments | 0 (0.0%) | 0 (0.0%) |
| 3 or 4 Unit Apartments | 0 (0.0%) | 0 (0.0%) |
| 5 to 9 Unit Apartments | 0 (0.0%) | 0 (0.0%) |
| 10 or more Apartments | 0 (0.0%) | 0 (0.0%) |
| Mobile Home / Other | 0 (0.0%) | 0 (0.0%) |
| Total | 31 (96.9%) | 1 (3.1%) |
Housing Structures by Number of Rooms in Graysville
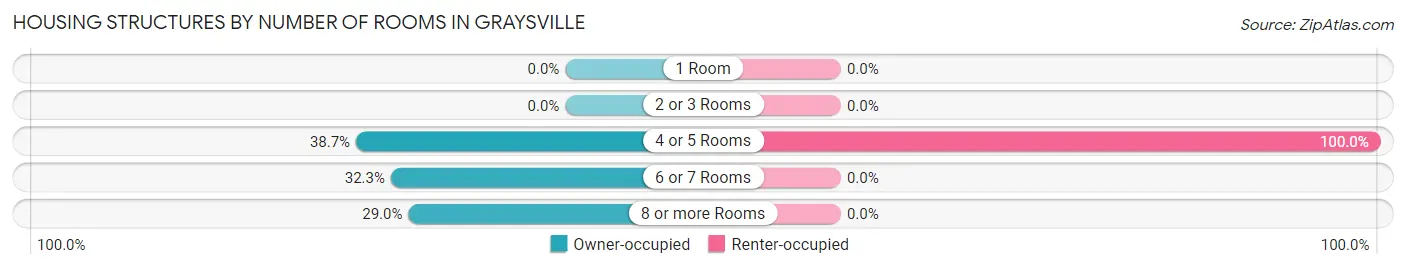
| Number of Rooms | Owner-occupied | Renter-occupied |
| 1 Room | 0 (0.0%) | 0 (0.0%) |
| 2 or 3 Rooms | 0 (0.0%) | 0 (0.0%) |
| 4 or 5 Rooms | 12 (38.7%) | 1 (100.0%) |
| 6 or 7 Rooms | 10 (32.3%) | 0 (0.0%) |
| 8 or more Rooms | 9 (29.0%) | 0 (0.0%) |
| Total | 31 (100.0%) | 1 (100.0%) |
Housing Structure by Heating Type in Graysville
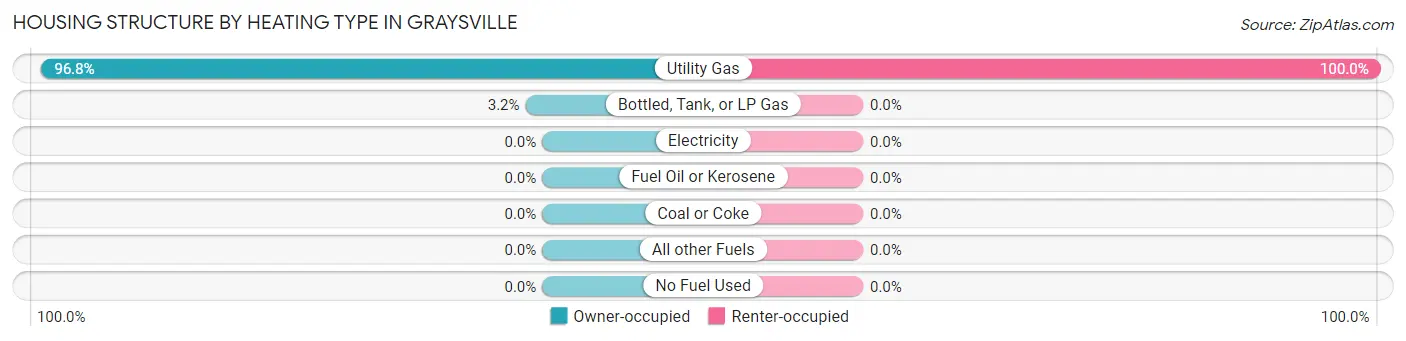
| Heating Type | Owner-occupied | Renter-occupied |
| Utility Gas | 30 (96.8%) | 1 (100.0%) |
| Bottled, Tank, or LP Gas | 1 (3.2%) | 0 (0.0%) |
| Electricity | 0 (0.0%) | 0 (0.0%) |
| Fuel Oil or Kerosene | 0 (0.0%) | 0 (0.0%) |
| Coal or Coke | 0 (0.0%) | 0 (0.0%) |
| All other Fuels | 0 (0.0%) | 0 (0.0%) |
| No Fuel Used | 0 (0.0%) | 0 (0.0%) |
| Total | 31 (100.0%) | 1 (100.0%) |
Household Vehicle Usage in Graysville
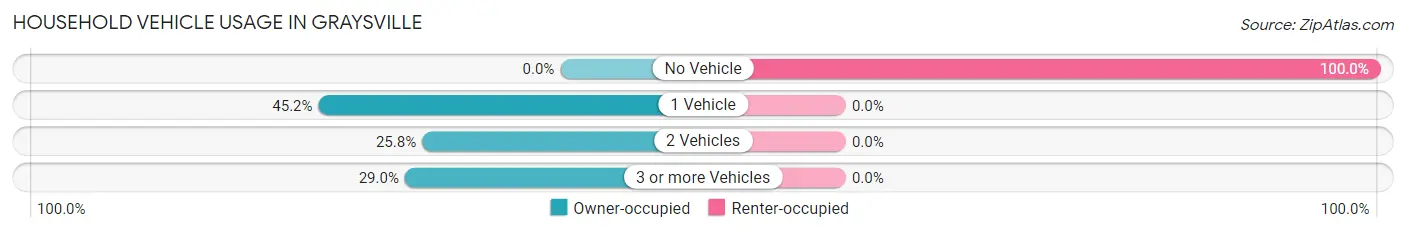
| Vehicles per Household | Owner-occupied | Renter-occupied |
| No Vehicle | 0 (0.0%) | 1 (100.0%) |
| 1 Vehicle | 14 (45.2%) | 0 (0.0%) |
| 2 Vehicles | 8 (25.8%) | 0 (0.0%) |
| 3 or more Vehicles | 9 (29.0%) | 0 (0.0%) |
| Total | 31 (100.0%) | 1 (100.0%) |
Real Estate & Mortgages in Graysville
Real Estate and Mortgage Overview in Graysville
| Characteristic | Without Mortgage | With Mortgage |
| Housing Units | 23 | 8 |
| Median Property Value | $55,000 | $0 |
| Median Household Income | - | - |
| Monthly Housing Costs | $363 | $0 |
| Real Estate Taxes | $700 | $0 |
Property Value by Mortgage Status in Graysville
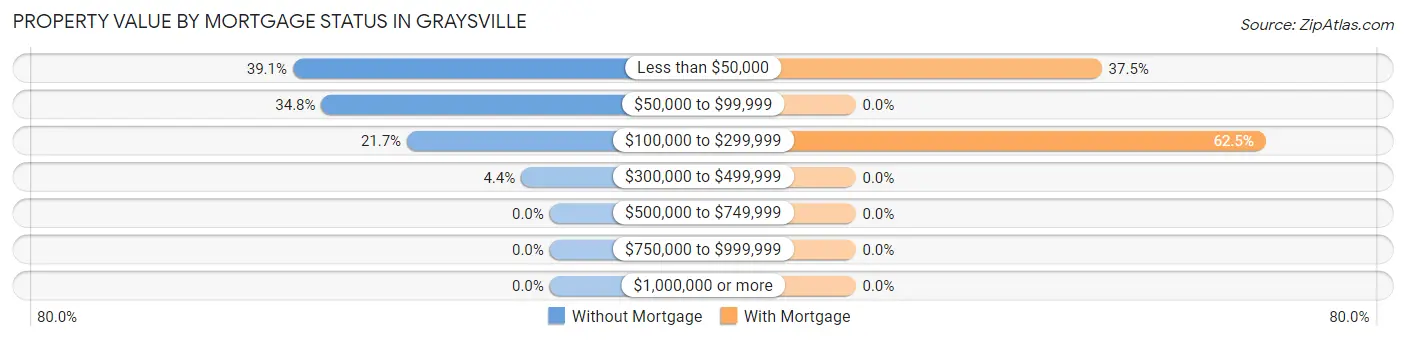
| Property Value | Without Mortgage | With Mortgage |
| Less than $50,000 | 9 (39.1%) | 3 (37.5%) |
| $50,000 to $99,999 | 8 (34.8%) | 0 (0.0%) |
| $100,000 to $299,999 | 5 (21.7%) | 5 (62.5%) |
| $300,000 to $499,999 | 1 (4.3%) | 0 (0.0%) |
| $500,000 to $749,999 | 0 (0.0%) | 0 (0.0%) |
| $750,000 to $999,999 | 0 (0.0%) | 0 (0.0%) |
| $1,000,000 or more | 0 (0.0%) | 0 (0.0%) |
| Total | 23 (100.0%) | 8 (100.0%) |
Household Income by Mortgage Status in Graysville
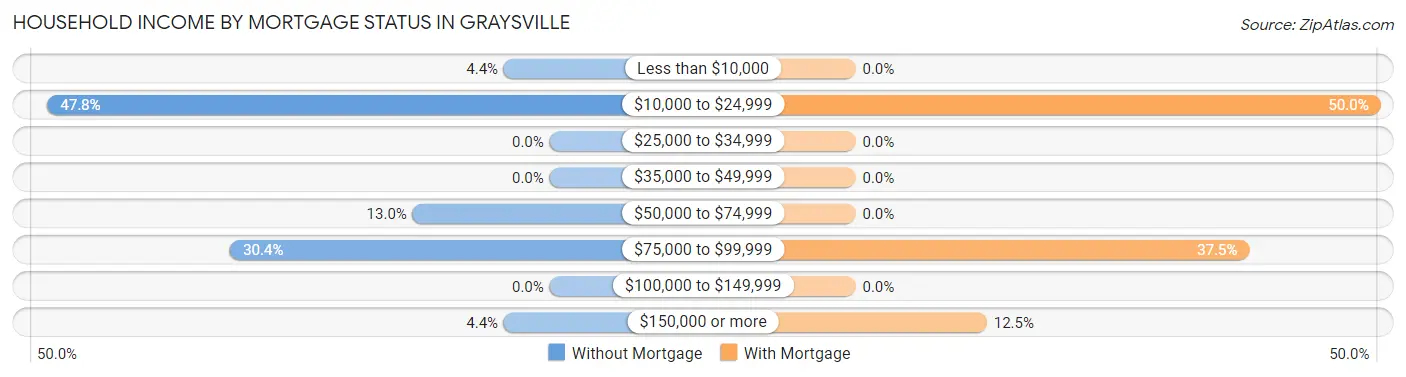
| Household Income | Without Mortgage | With Mortgage |
| Less than $10,000 | 1 (4.3%) | 0 (0.0%) |
| $10,000 to $24,999 | 11 (47.8%) | 4 (50.0%) |
| $25,000 to $34,999 | 0 (0.0%) | 0 (0.0%) |
| $35,000 to $49,999 | 0 (0.0%) | 0 (0.0%) |
| $50,000 to $74,999 | 3 (13.0%) | 0 (0.0%) |
| $75,000 to $99,999 | 7 (30.4%) | 3 (37.5%) |
| $100,000 to $149,999 | 0 (0.0%) | 0 (0.0%) |
| $150,000 or more | 1 (4.3%) | 1 (12.5%) |
| Total | 23 (100.0%) | 8 (100.0%) |
Property Value to Household Income Ratio in Graysville
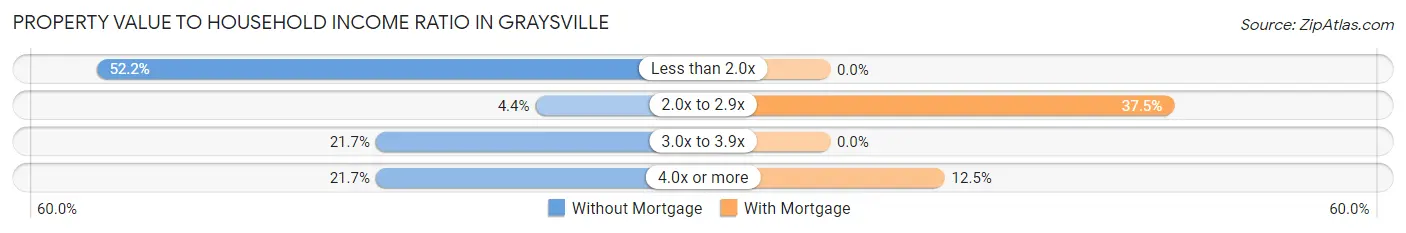
| Value-to-Income Ratio | Without Mortgage | With Mortgage |
| Less than 2.0x | 12 (52.2%) | 0 (0.0%) |
| 2.0x to 2.9x | 1 (4.3%) | 3 (37.5%) |
| 3.0x to 3.9x | 5 (21.7%) | 0 (0.0%) |
| 4.0x or more | 5 (21.7%) | 1 (12.5%) |
| Total | 23 (100.0%) | 8 (100.0%) |
Real Estate Taxes by Mortgage Status in Graysville
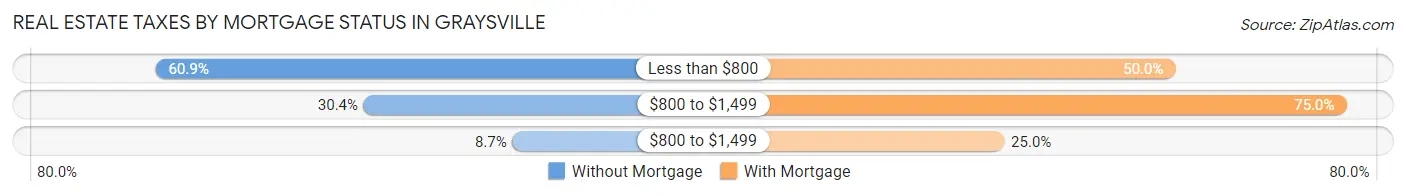
| Property Taxes | Without Mortgage | With Mortgage |
| Less than $800 | 14 (60.9%) | 4 (50.0%) |
| $800 to $1,499 | 7 (30.4%) | 6 (75.0%) |
| $800 to $1,499 | 2 (8.7%) | 2 (25.0%) |
| Total | 23 (100.0%) | 8 (100.0%) |
Health & Disability in Graysville
Health Insurance Coverage by Age in Graysville
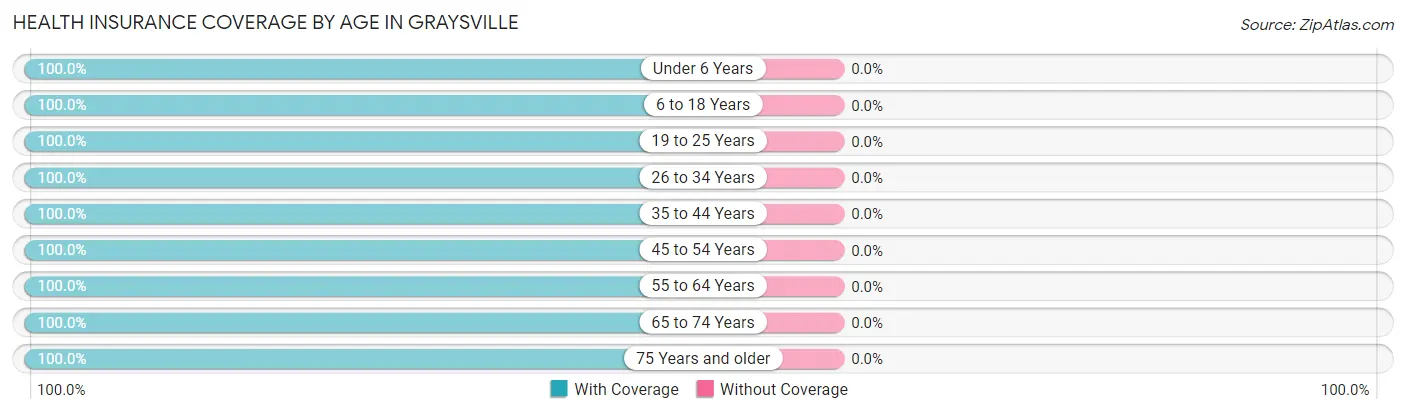
| Age Bracket | With Coverage | Without Coverage |
| Under 6 Years | 2 (100.0%) | 0 (0.0%) |
| 6 to 18 Years | 11 (100.0%) | 0 (0.0%) |
| 19 to 25 Years | 10 (100.0%) | 0 (0.0%) |
| 26 to 34 Years | 4 (100.0%) | 0 (0.0%) |
| 35 to 44 Years | 2 (100.0%) | 0 (0.0%) |
| 45 to 54 Years | 13 (100.0%) | 0 (0.0%) |
| 55 to 64 Years | 14 (100.0%) | 0 (0.0%) |
| 65 to 74 Years | 13 (100.0%) | 0 (0.0%) |
| 75 Years and older | 8 (100.0%) | 0 (0.0%) |
| Total | 77 (100.0%) | 0 (0.0%) |
Health Insurance Coverage by Citizenship Status in Graysville
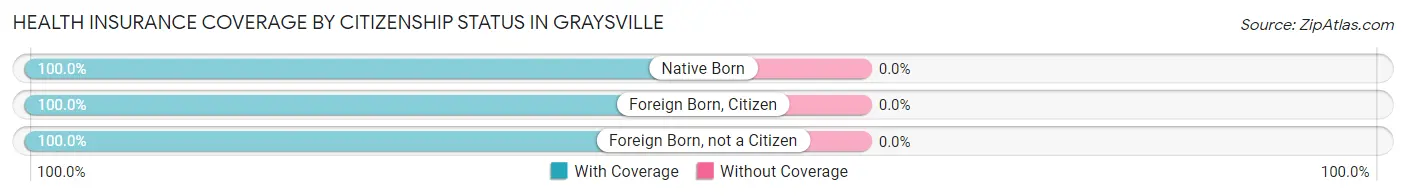
| Citizenship Status | With Coverage | Without Coverage |
| Native Born | 2 (100.0%) | 0 (0.0%) |
| Foreign Born, Citizen | 11 (100.0%) | 0 (0.0%) |
| Foreign Born, not a Citizen | 10 (100.0%) | 0 (0.0%) |
Health Insurance Coverage by Household Income in Graysville
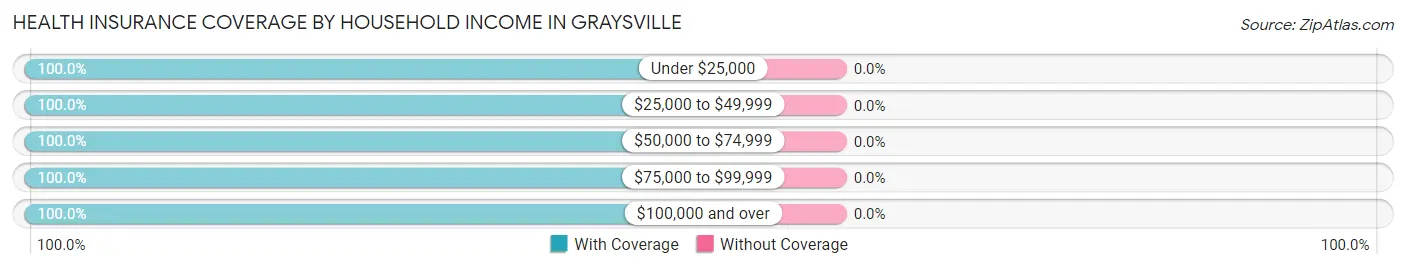
| Household Income | With Coverage | Without Coverage |
| Under $25,000 | 21 (100.0%) | 0 (0.0%) |
| $25,000 to $49,999 | 14 (100.0%) | 0 (0.0%) |
| $50,000 to $74,999 | 22 (100.0%) | 0 (0.0%) |
| $75,000 to $99,999 | 16 (100.0%) | 0 (0.0%) |
| $100,000 and over | 4 (100.0%) | 0 (0.0%) |
Public vs Private Health Insurance Coverage by Age in Graysville
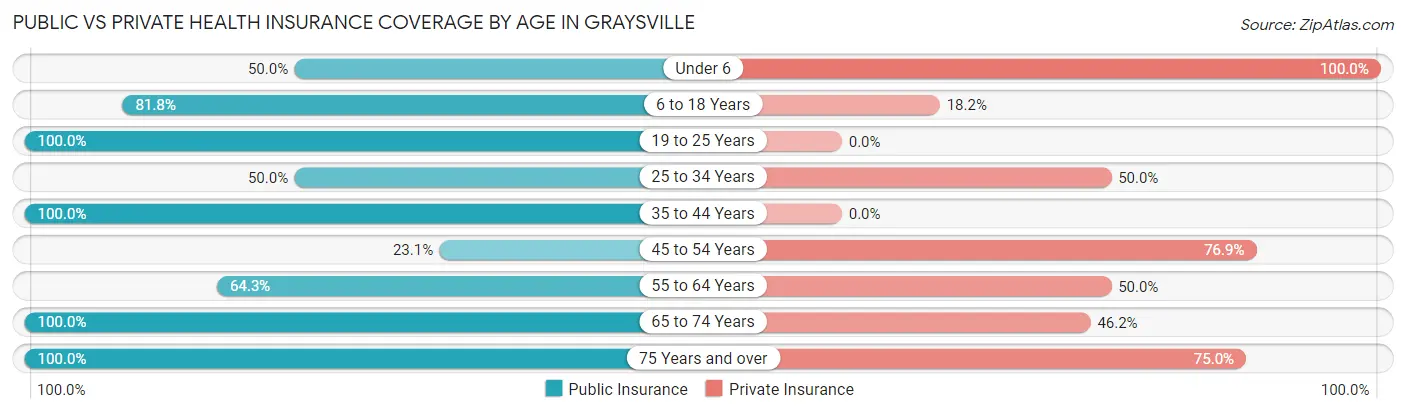
| Age Bracket | Public Insurance | Private Insurance |
| Under 6 | 1 (50.0%) | 2 (100.0%) |
| 6 to 18 Years | 9 (81.8%) | 2 (18.2%) |
| 19 to 25 Years | 10 (100.0%) | 0 (0.0%) |
| 25 to 34 Years | 2 (50.0%) | 2 (50.0%) |
| 35 to 44 Years | 2 (100.0%) | 0 (0.0%) |
| 45 to 54 Years | 3 (23.1%) | 10 (76.9%) |
| 55 to 64 Years | 9 (64.3%) | 7 (50.0%) |
| 65 to 74 Years | 13 (100.0%) | 6 (46.2%) |
| 75 Years and over | 8 (100.0%) | 6 (75.0%) |
| Total | 57 (74.0%) | 35 (45.5%) |
Disability Status by Sex by Age in Graysville
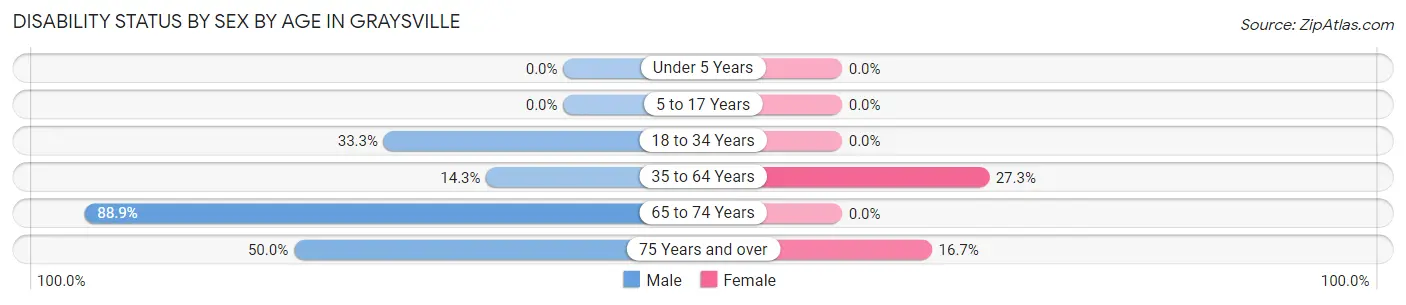
| Age Bracket | Male | Female |
| Under 5 Years | 0 (0.0%) | 0 (0.0%) |
| 5 to 17 Years | 0 (0.0%) | 0 (0.0%) |
| 18 to 34 Years | 2 (33.3%) | 0 (0.0%) |
| 35 to 64 Years | 1 (14.3%) | 6 (27.3%) |
| 65 to 74 Years | 8 (88.9%) | 0 (0.0%) |
| 75 Years and over | 1 (50.0%) | 1 (16.7%) |
Disability Class by Sex by Age in Graysville
Disability Class: Hearing Difficulty
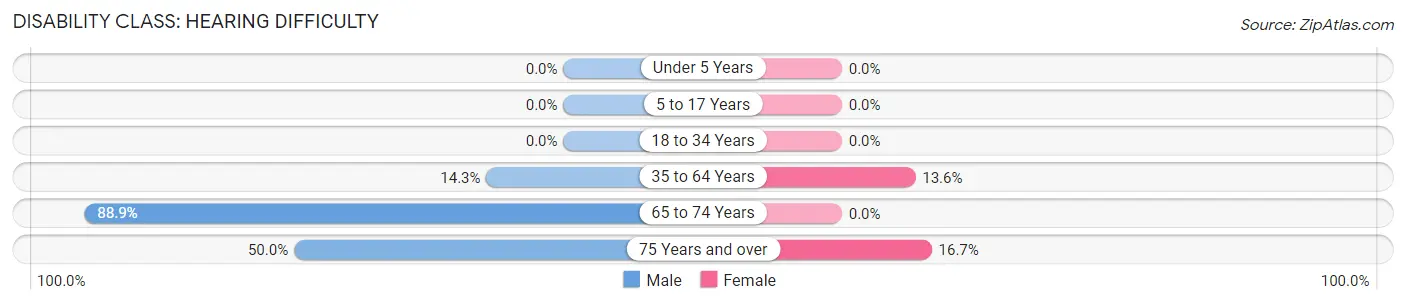
| Age Bracket | Male | Female |
| Under 5 Years | 0 (0.0%) | 0 (0.0%) |
| 5 to 17 Years | 0 (0.0%) | 0 (0.0%) |
| 18 to 34 Years | 0 (0.0%) | 0 (0.0%) |
| 35 to 64 Years | 1 (14.3%) | 3 (13.6%) |
| 65 to 74 Years | 8 (88.9%) | 0 (0.0%) |
| 75 Years and over | 1 (50.0%) | 1 (16.7%) |
Disability Class: Vision Difficulty
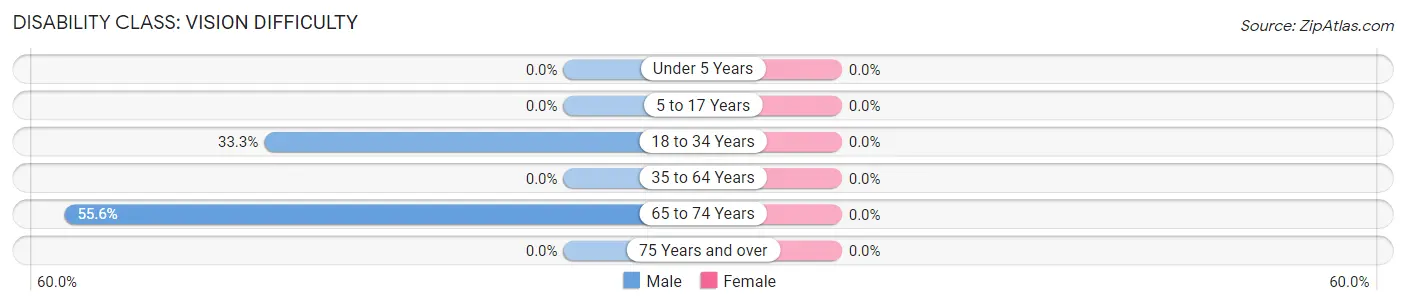
| Age Bracket | Male | Female |
| Under 5 Years | 0 (0.0%) | 0 (0.0%) |
| 5 to 17 Years | 0 (0.0%) | 0 (0.0%) |
| 18 to 34 Years | 2 (33.3%) | 0 (0.0%) |
| 35 to 64 Years | 0 (0.0%) | 0 (0.0%) |
| 65 to 74 Years | 5 (55.6%) | 0 (0.0%) |
| 75 Years and over | 0 (0.0%) | 0 (0.0%) |
Disability Class: Cognitive Difficulty
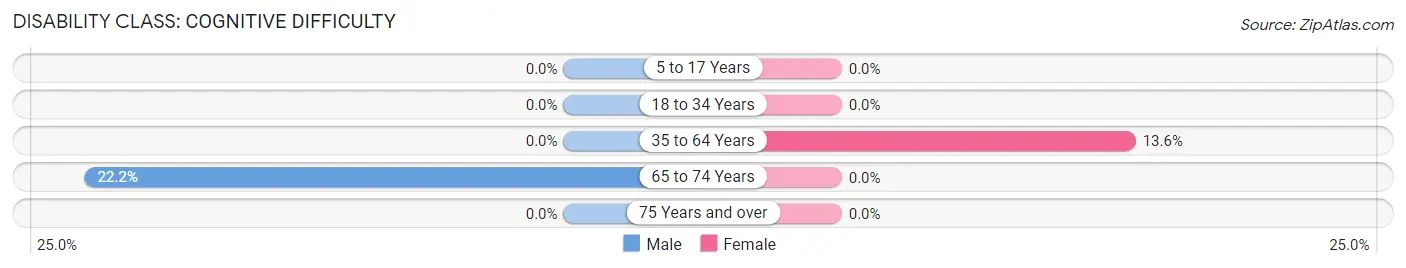
| Age Bracket | Male | Female |
| 5 to 17 Years | 0 (0.0%) | 0 (0.0%) |
| 18 to 34 Years | 0 (0.0%) | 0 (0.0%) |
| 35 to 64 Years | 0 (0.0%) | 3 (13.6%) |
| 65 to 74 Years | 2 (22.2%) | 0 (0.0%) |
| 75 Years and over | 0 (0.0%) | 0 (0.0%) |
Disability Class: Ambulatory Difficulty
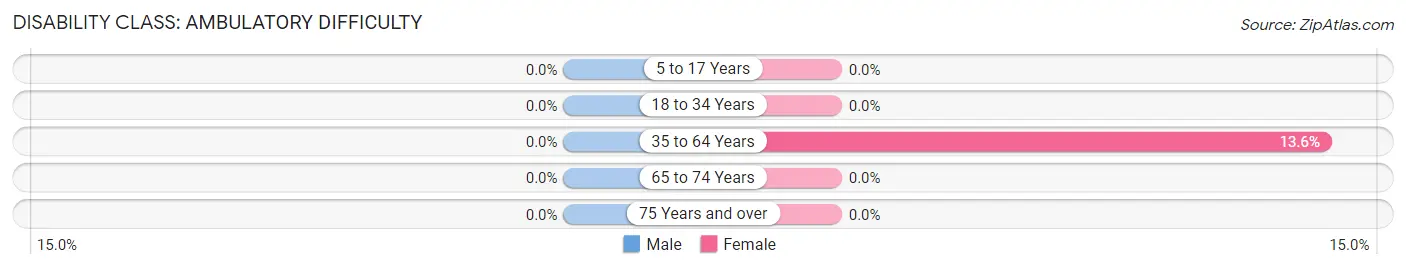
| Age Bracket | Male | Female |
| 5 to 17 Years | 0 (0.0%) | 0 (0.0%) |
| 18 to 34 Years | 0 (0.0%) | 0 (0.0%) |
| 35 to 64 Years | 0 (0.0%) | 3 (13.6%) |
| 65 to 74 Years | 0 (0.0%) | 0 (0.0%) |
| 75 Years and over | 0 (0.0%) | 0 (0.0%) |
Disability Class: Self-Care Difficulty
| Age Bracket | Male | Female |
| 5 to 17 Years | 0 (0.0%) | 0 (0.0%) |
| 18 to 34 Years | 0 (0.0%) | 0 (0.0%) |
| 35 to 64 Years | 0 (0.0%) | 0 (0.0%) |
| 65 to 74 Years | 0 (0.0%) | 0 (0.0%) |
| 75 Years and over | 0 (0.0%) | 0 (0.0%) |
Technology Access in Graysville
Computing Device Access in Graysville
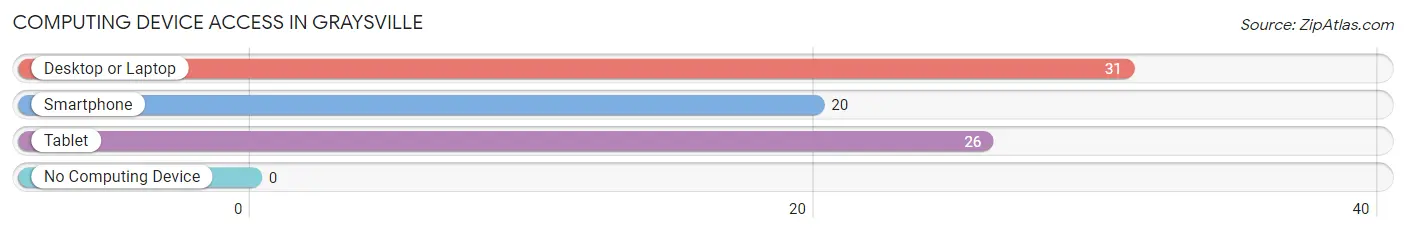
| Device Type | # Households | % Households |
| Desktop or Laptop | 31 | 96.9% |
| Smartphone | 20 | 62.5% |
| Tablet | 26 | 81.2% |
| No Computing Device | 0 | 0.0% |
| Total | 32 | 100.0% |
Internet Access in Graysville
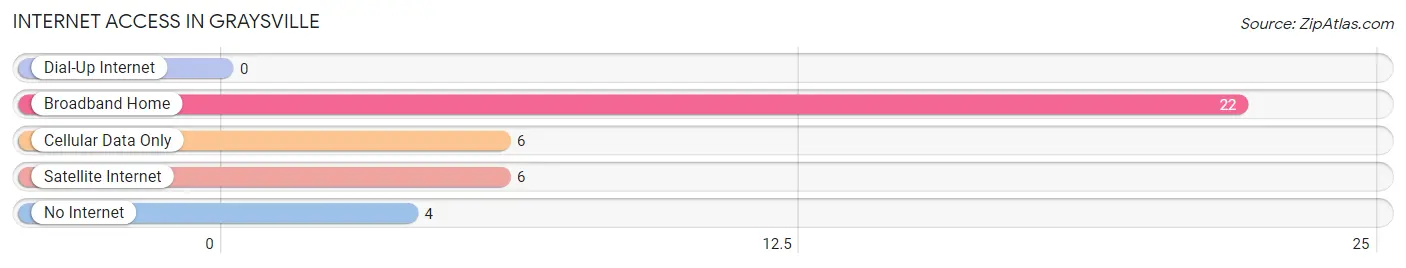
| Internet Type | # Households | % Households |
| Dial-Up Internet | 0 | 0.0% |
| Broadband Home | 22 | 68.8% |
| Cellular Data Only | 6 | 18.8% |
| Satellite Internet | 6 | 18.8% |
| No Internet | 4 | 12.5% |
| Total | 32 | 100.0% |
Graysville Summary
Graysville, Ohio is a small village located in the southeastern corner of the state, in Jefferson County. It is situated on the banks of the Ohio River, and is bordered by the towns of Richmond, Steubenville, and Wellsville. The village has a population of approximately 1,000 people, and is part of the Steubenville-Weirton Metropolitan Statistical Area.
History
Graysville was founded in 1817 by William Gray, a Revolutionary War veteran. He purchased the land from the United States government and named the village after himself. The village was incorporated in 1837, and the first post office was established in 1845.
In the late 19th century, Graysville was a thriving industrial center, with several factories and mills located in the village. The most prominent of these was the Graysville Iron Works, which produced iron products for the railroad industry. The village also had a number of stores and businesses, including a hotel, a bank, and a newspaper.
In the early 20th century, Graysville experienced a period of decline, as the factories and mills closed and the population decreased. The village was hit hard by the Great Depression, and many of the businesses closed. However, the village was able to survive, and in the 1950s, the population began to increase again.
Geography
Graysville is located in the southeastern corner of Ohio, in Jefferson County. It is situated on the banks of the Ohio River, and is bordered by the towns of Richmond, Steubenville, and Wellsville. The village has a total area of 0.7 square miles, all of which is land.
The climate in Graysville is humid continental, with hot summers and cold winters. The average annual temperature is around 50 degrees Fahrenheit, and the average annual precipitation is around 40 inches.
Economy
Graysville’s economy is largely based on agriculture and tourism. The village is home to several farms, which produce a variety of crops, including corn, soybeans, and wheat. The village also has a number of tourist attractions, including the Graysville Museum, which showcases the history of the village, and the Graysville Nature Center, which offers educational programs and outdoor activities.
Demographics
As of the 2010 census, Graysville had a population of 1,000 people. The racial makeup of the village was 97.2% White, 0.7% African American, 0.3% Native American, 0.2% Asian, and 1.6% from other races. The median household income was $37,500, and the median family income was $45,000. The per capita income was $18,000.
Graysville is a small, rural village with a rich history and a strong sense of community. The village is home to a variety of businesses and attractions, and offers a peaceful, rural lifestyle.
Common Questions
What is Per Capita Income in Graysville?
Per Capita income in Graysville is $21,662.
What is the Median Family Income in Graysville?
Median Family Income in Graysville is $70,000.
What is Income or Wage Gap in Graysville?
Income or Wage Gap in Graysville is 18.2%.
Women in Graysville earn 81.8 cents for every dollar earned by a man.
What is Inequality or Gini Index in Graysville?
Inequality or Gini Index in Graysville is 0.49.
What is the Total Population of Graysville?
Total Population of Graysville is 77.
What is the Total Male Population of Graysville?
Total Male Population of Graysville is 29.
What is the Total Female Population of Graysville?
Total Female Population of Graysville is 48.
What is the Ratio of Males per 100 Females in Graysville?
There are 60.42 Males per 100 Females in Graysville.
What is the Ratio of Females per 100 Males in Graysville?
There are 165.52 Females per 100 Males in Graysville.
What is the Median Population Age in Graysville?
Median Population Age in Graysville is 53.3 Years.
What is the Average Family Size in Graysville
Average Family Size in Graysville is 2.8 People.
What is the Average Household Size in Graysville
Average Household Size in Graysville is 2.4 People.
How Large is the Labor Force in Graysville?
There are 23 People in the Labor Forcein in Graysville.
What is the Percentage of People in the Labor Force in Graysville?
34.8% of People are in the Labor Force in Graysville.