Cities with the Highest Percentage of Immigrants from Uzbekistan in Ohio
RELATED REPORTS & OPTIONS
Uzbekistan
Ohio
Compare Cities
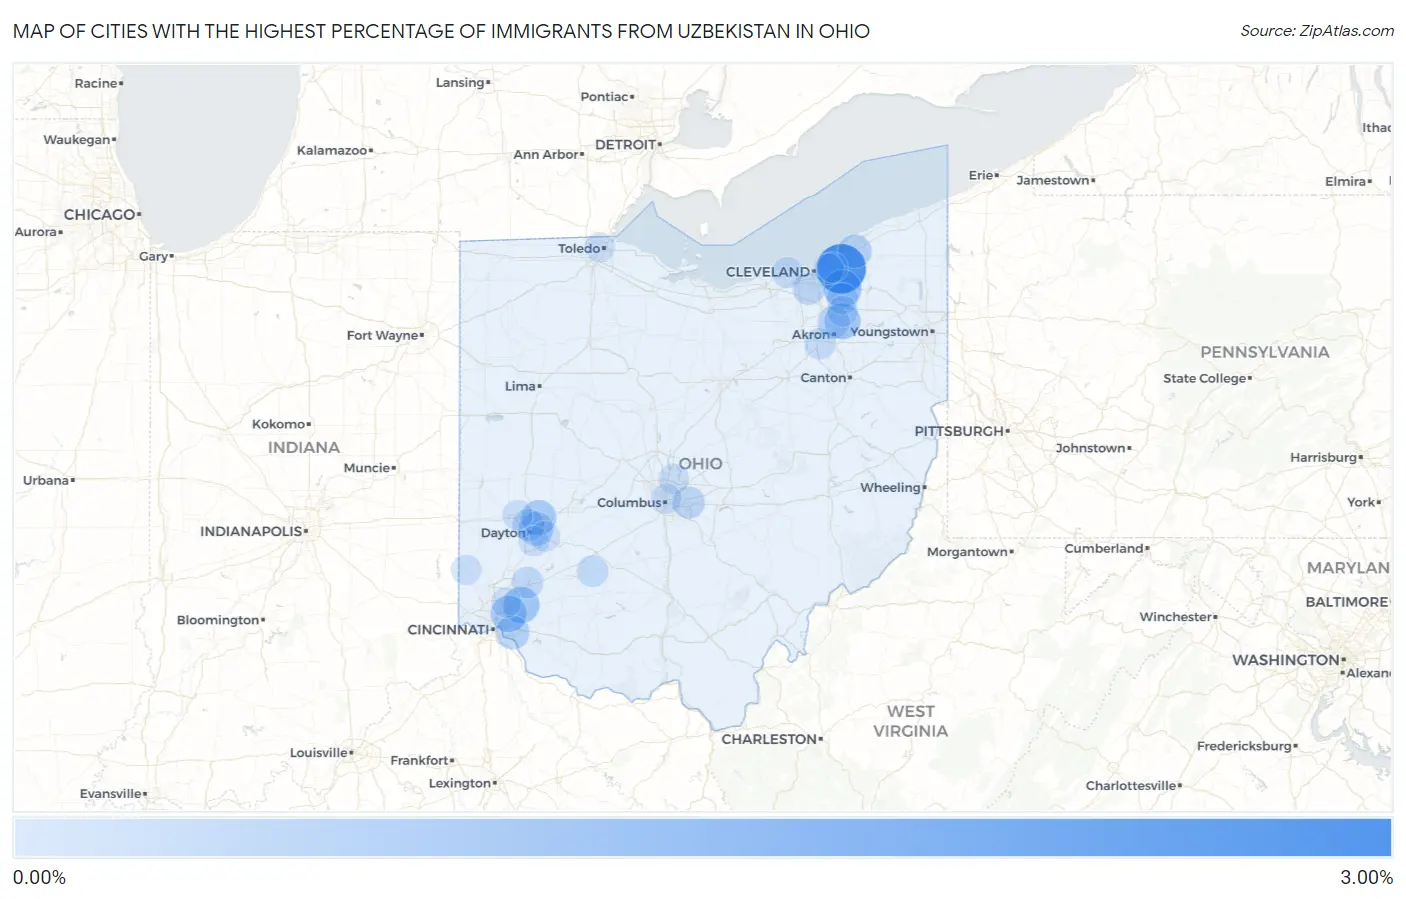
Map of Cities with the Highest Percentage of Immigrants from Uzbekistan in Ohio
0.00%
3.00%
Cities with the Highest Percentage of Immigrants from Uzbekistan in Ohio
| City | Uzbekistan | vs State | vs National | |
| 1. | Mayfield Heights | 2.57% | 0.033%(+2.54)#19 | 0.022%(+2.55)#474 |
| 2. | Solon | 1.00% | 0.033%(+0.965)#20 | 0.022%(+0.976)#475 |
| 3. | Loveland | 0.81% | 0.033%(+0.775)#21 | 0.022%(+0.786)#476 |
| 4. | Kenwood | 0.78% | 0.033%(+0.752)#22 | 0.022%(+0.763)#477 |
| 5. | Stow | 0.77% | 0.033%(+0.733)#23 | 0.022%(+0.745)#478 |
| 6. | Huber Heights | 0.63% | 0.033%(+0.596)#24 | 0.022%(+0.607)#479 |
| 7. | Riverside | 0.53% | 0.033%(+0.498)#25 | 0.022%(+0.509)#480 |
| 8. | Forestville | 0.48% | 0.033%(+0.443)#26 | 0.022%(+0.454)#481 |
| 9. | Kirtland Hills | 0.44% | 0.033%(+0.410)#27 | 0.022%(+0.421)#482 |
| 10. | Cuyahoga Falls | 0.31% | 0.033%(+0.276)#28 | 0.022%(+0.287)#483 |
| 11. | Reynoldsburg | 0.27% | 0.033%(+0.241)#29 | 0.022%(+0.252)#484 |
| 12. | Parma | 0.27% | 0.033%(+0.234)#30 | 0.022%(+0.245)#485 |
| 13. | Dayton | 0.25% | 0.033%(+0.218)#31 | 0.022%(+0.230)#486 |
| 14. | Lebanon | 0.20% | 0.033%(+0.167)#32 | 0.022%(+0.178)#487 |
| 15. | Sabina | 0.19% | 0.033%(+0.159)#33 | 0.022%(+0.170)#488 |
| 16. | Twinsburg | 0.16% | 0.033%(+0.123)#34 | 0.022%(+0.134)#489 |
| 17. | Norton | 0.14% | 0.033%(+0.105)#35 | 0.022%(+0.116)#490 |
| 18. | Bay Village | 0.13% | 0.033%(+0.098)#36 | 0.022%(+0.109)#491 |
| 19. | Hudson | 0.096% | 0.033%(+0.063)#37 | 0.022%(+0.074)#492 |
| 20. | Cleveland Heights | 0.062% | 0.033%(+0.029)#38 | 0.022%(+0.041)#607 |
| 21. | Westerville | 0.044% | 0.033%(+0.011)#39 | 0.022%(+0.022)#608 |
| 22. | Oxford | 0.041% | 0.033%(+0.008)#40 | 0.022%(+0.019)#609 |
| 23. | Kettering | 0.036% | 0.033%(+0.004)#41 | 0.022%(+0.015)#610 |
| 24. | Clayton | 0.030% | 0.033%(-0.003)#42 | 0.022%(+0.009)#611 |
| 25. | Beavercreek | 0.030% | 0.033%(-0.003)#43 | 0.022%(+0.009)#612 |
| 26. | Columbus | 0.029% | 0.033%(-0.004)#44 | 0.022%(+0.007)#789 |
| 27. | Sharonville | 0.021% | 0.033%(-0.011)#45 | 0.022%(-0.000)#790 |
| 28. | South Euclid | 0.014% | 0.033%(-0.019)#46 | 0.022%(-0.008)#791 |
| 29. | Toledo | 0.0044% | 0.033%(-0.028)#47 | 0.022%(-0.017)#792 |
Common Questions
What are the Top 10 Cities with the Highest Percentage of Immigrants from Uzbekistan in Ohio?
Top 10 Cities with the Highest Percentage of Immigrants from Uzbekistan in Ohio are:
#1
2.57%
#2
1.00%
#3
0.81%
#4
0.78%
#5
0.77%
#6
0.63%
#7
0.53%
#8
0.48%
#9
0.44%
#10
0.31%
What city has the Highest Percentage of Immigrants from Uzbekistan in Ohio?
Mayfield Heights has the Highest Percentage of Immigrants from Uzbekistan in Ohio with 2.57%.
What is the Percentage of Immigrants from Uzbekistan in the State of Ohio?
Percentage of Immigrants from Uzbekistan in Ohio is 0.033%.
What is the Percentage of Immigrants from Uzbekistan in the United States?
Percentage of Immigrants from Uzbekistan in the United States is 0.022%.