Cities with the Highest Percentage of French Canadian Population in Ohio
RELATED REPORTS & OPTIONS
French Canadian
Ohio
Compare Cities
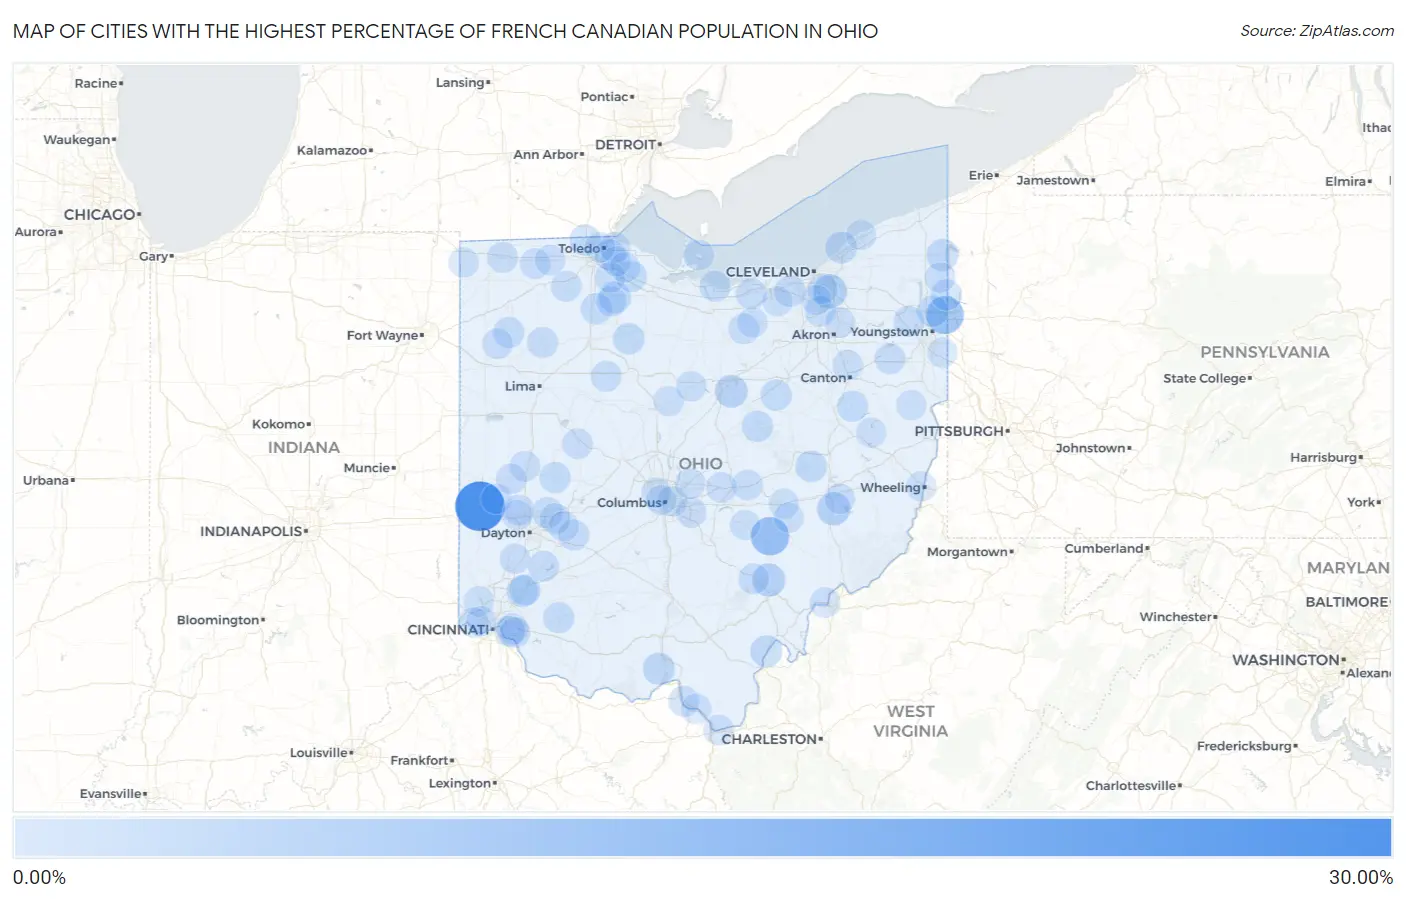
Map of Cities with the Highest Percentage of French Canadian Population in Ohio
0.00%
30.00%
Cities with the Highest Percentage of French Canadian Population in Ohio
| City | French Canadian | vs State | vs National | |
| 1. | Castine | 25.62% | 0.23%(+25.4)#1 | 0.54%(+25.1)#35 |
| 2. | Rose Farm | 10.75% | 0.23%(+10.5)#2 | 0.54%(+10.2)#221 |
| 3. | Masury | 10.13% | 0.23%(+9.90)#3 | 0.54%(+9.58)#251 |
| 4. | Walton Hills | 5.23% | 0.23%(+5.01)#4 | 0.54%(+4.69)#703 |
| 5. | Buffalo | 4.28% | 0.23%(+4.06)#5 | 0.54%(+3.74)#893 |
| 6. | Millfield | 4.26% | 0.23%(+4.04)#6 | 0.54%(+3.72)#903 |
| 7. | Lucas | 3.81% | 0.23%(+3.58)#7 | 0.54%(+3.26)#1,036 |
| 8. | Mcdermott | 2.84% | 0.23%(+2.61)#8 | 0.54%(+2.29)#1,389 |
| 9. | Andover | 2.68% | 0.23%(+2.46)#9 | 0.54%(+2.14)#1,470 |
| 10. | Bradner | 2.66% | 0.23%(+2.43)#10 | 0.54%(+2.11)#1,488 |
| 11. | Cheshire | 2.63% | 0.23%(+2.41)#11 | 0.54%(+2.09)#1,511 |
| 12. | Lakeline | 2.53% | 0.23%(+2.30)#12 | 0.54%(+1.98)#1,586 |
| 13. | Kings Mills | 2.42% | 0.23%(+2.19)#13 | 0.54%(+1.87)#1,660 |
| 14. | Plainfield | 2.17% | 0.23%(+1.95)#14 | 0.54%(+1.63)#1,861 |
| 15. | Vienna Center | 2.15% | 0.23%(+1.93)#15 | 0.54%(+1.61)#1,883 |
| 16. | New Riegel | 2.13% | 0.23%(+1.91)#16 | 0.54%(+1.59)#1,892 |
| 17. | Bass Lake | 1.99% | 0.23%(+1.76)#17 | 0.54%(+1.44)#2,019 |
| 18. | Elmore | 1.94% | 0.23%(+1.71)#18 | 0.54%(+1.39)#2,075 |
| 19. | Shreve | 1.90% | 0.23%(+1.68)#19 | 0.54%(+1.36)#2,099 |
| 20. | Jerry City | 1.87% | 0.23%(+1.64)#20 | 0.54%(+1.32)#2,145 |
| 21. | Olmsted Falls | 1.82% | 0.23%(+1.60)#21 | 0.54%(+1.28)#2,193 |
| 22. | Orangeville | 1.75% | 0.23%(+1.53)#22 | 0.54%(+1.21)#2,277 |
| 23. | Mineral City | 1.75% | 0.23%(+1.53)#23 | 0.54%(+1.21)#2,283 |
| 24. | Oakwood | 1.75% | 0.23%(+1.52)#24 | 0.54%(+1.20)#2,288 |
| 25. | St Paris | 1.73% | 0.23%(+1.51)#25 | 0.54%(+1.19)#2,309 |
| 26. | Gann Brinkhaven | 1.71% | 0.23%(+1.48)#26 | 0.54%(+1.16)#2,343 |
| 27. | Huron | 1.67% | 0.23%(+1.45)#27 | 0.54%(+1.13)#2,393 |
| 28. | Fayetteville | 1.66% | 0.23%(+1.43)#28 | 0.54%(+1.12)#2,411 |
| 29. | Sylvania | 1.64% | 0.23%(+1.41)#29 | 0.54%(+1.09)#2,434 |
| 30. | South Lebanon | 1.60% | 0.23%(+1.37)#30 | 0.54%(+1.06)#2,484 |
| 31. | Park Layne | 1.59% | 0.23%(+1.36)#31 | 0.54%(+1.04)#2,503 |
| 32. | Dry Run | 1.58% | 0.23%(+1.35)#32 | 0.54%(+1.03)#2,511 |
| 33. | Glandorf | 1.56% | 0.23%(+1.33)#33 | 0.54%(+1.01)#2,547 |
| 34. | South Amherst | 1.54% | 0.23%(+1.32)#34 | 0.54%(+0.999)#2,568 |
| 35. | Cedarville | 1.51% | 0.23%(+1.28)#35 | 0.54%(+0.963)#2,626 |
| 36. | Nelsonville | 1.50% | 0.23%(+1.27)#36 | 0.54%(+0.955)#2,638 |
| 37. | Corwin | 1.49% | 0.23%(+1.27)#37 | 0.54%(+0.948)#2,648 |
| 38. | Northwood | 1.49% | 0.23%(+1.26)#38 | 0.54%(+0.942)#2,655 |
| 39. | Hanover | 1.42% | 0.23%(+1.20)#39 | 0.54%(+0.880)#2,747 |
| 40. | Holiday Valley | 1.39% | 0.23%(+1.16)#40 | 0.54%(+0.842)#2,809 |
| 41. | Sebring | 1.39% | 0.23%(+1.16)#41 | 0.54%(+0.841)#2,810 |
| 42. | West Unity | 1.38% | 0.23%(+1.16)#42 | 0.54%(+0.840)#2,812 |
| 43. | Lordstown | 1.32% | 0.23%(+1.10)#43 | 0.54%(+0.778)#2,926 |
| 44. | Franklin Furnace | 1.32% | 0.23%(+1.09)#44 | 0.54%(+0.774)#2,937 |
| 45. | Rochester | 1.31% | 0.23%(+1.08)#45 | 0.54%(+0.763)#2,966 |
| 46. | Forest | 1.31% | 0.23%(+1.08)#46 | 0.54%(+0.761)#2,968 |
| 47. | Grand Rapids | 1.26% | 0.23%(+1.03)#47 | 0.54%(+0.714)#3,079 |
| 48. | Pitsburg | 1.21% | 0.23%(+0.983)#48 | 0.54%(+0.664)#3,194 |
| 49. | Bellefontaine | 1.20% | 0.23%(+0.979)#49 | 0.54%(+0.660)#3,204 |
| 50. | Granville | 1.19% | 0.23%(+0.969)#50 | 0.54%(+0.650)#3,224 |
| 51. | Lockington | 1.16% | 0.23%(+0.931)#51 | 0.54%(+0.612)#3,327 |
| 52. | Cherry Grove | 1.15% | 0.23%(+0.926)#52 | 0.54%(+0.607)#3,335 |
| 53. | Union | 1.15% | 0.23%(+0.920)#53 | 0.54%(+0.601)#3,347 |
| 54. | Richfield | 1.13% | 0.23%(+0.904)#54 | 0.54%(+0.585)#3,396 |
| 55. | Wayne | 1.11% | 0.23%(+0.888)#55 | 0.54%(+0.569)#3,427 |
| 56. | Oregon | 1.10% | 0.23%(+0.870)#56 | 0.54%(+0.551)#3,484 |
| 57. | Sherwood | 1.09% | 0.23%(+0.860)#57 | 0.54%(+0.541)#3,509 |
| 58. | Grover Hill | 1.08% | 0.23%(+0.859)#58 | 0.54%(+0.540)#3,512 |
| 59. | Wauseon | 1.08% | 0.23%(+0.857)#59 | 0.54%(+0.538)#3,523 |
| 60. | Burlington | 1.04% | 0.23%(+0.818)#60 | 0.54%(+0.499)#3,620 |
| 61. | Carlisle | 1.02% | 0.23%(+0.795)#61 | 0.54%(+0.476)#3,687 |
| 62. | Belpre | 0.99% | 0.23%(+0.761)#62 | 0.54%(+0.442)#3,785 |
| 63. | Pickerington | 0.99% | 0.23%(+0.760)#63 | 0.54%(+0.441)#3,788 |
| 64. | Covington | 0.98% | 0.23%(+0.751)#64 | 0.54%(+0.432)#3,830 |
| 65. | Kelleys Island | 0.90% | 0.23%(+0.679)#65 | 0.54%(+0.361)#4,049 |
| 66. | Delta | 0.85% | 0.23%(+0.628)#66 | 0.54%(+0.309)#4,263 |
| 67. | Kinsman Center | 0.85% | 0.23%(+0.627)#67 | 0.54%(+0.308)#4,270 |
| 68. | Lore City | 0.85% | 0.23%(+0.624)#68 | 0.54%(+0.305)#4,282 |
| 69. | North Canton | 0.84% | 0.23%(+0.613)#69 | 0.54%(+0.294)#4,323 |
| 70. | Bexley | 0.83% | 0.23%(+0.609)#70 | 0.54%(+0.290)#4,338 |
| 71. | Luckey | 0.82% | 0.23%(+0.599)#71 | 0.54%(+0.280)#4,394 |
| 72. | Galion | 0.82% | 0.23%(+0.594)#72 | 0.54%(+0.275)#4,426 |
| 73. | Sharon Center | 0.81% | 0.23%(+0.582)#73 | 0.54%(+0.263)#4,469 |
| 74. | New Albany | 0.79% | 0.23%(+0.564)#74 | 0.54%(+0.245)#4,550 |
| 75. | Upper Arlington | 0.79% | 0.23%(+0.564)#75 | 0.54%(+0.245)#4,551 |
| 76. | Genoa | 0.78% | 0.23%(+0.559)#76 | 0.54%(+0.240)#4,567 |
| 77. | Dunlap | 0.78% | 0.23%(+0.554)#77 | 0.54%(+0.235)#4,583 |
| 78. | Pleasant Grove | 0.76% | 0.23%(+0.538)#78 | 0.54%(+0.219)#4,649 |
| 79. | Salineville | 0.75% | 0.23%(+0.528)#79 | 0.54%(+0.209)#4,707 |
| 80. | Clayton | 0.75% | 0.23%(+0.527)#80 | 0.54%(+0.208)#4,714 |
| 81. | Millbury | 0.74% | 0.23%(+0.519)#81 | 0.54%(+0.200)#4,754 |
| 82. | Yellow Springs | 0.72% | 0.23%(+0.497)#82 | 0.54%(+0.178)#4,876 |
| 83. | New Middletown | 0.69% | 0.23%(+0.467)#83 | 0.54%(+0.149)#5,043 |
| 84. | Wellington | 0.69% | 0.23%(+0.466)#84 | 0.54%(+0.147)#5,058 |
| 85. | Hanging Rock | 0.69% | 0.23%(+0.464)#85 | 0.54%(+0.145)#5,067 |
| 86. | Caledonia | 0.68% | 0.23%(+0.450)#86 | 0.54%(+0.131)#5,133 |
| 87. | Mack | 0.67% | 0.23%(+0.446)#87 | 0.54%(+0.127)#5,157 |
| 88. | Edon | 0.67% | 0.23%(+0.440)#88 | 0.54%(+0.121)#5,191 |
| 89. | Toledo | 0.66% | 0.23%(+0.438)#89 | 0.54%(+0.119)#5,203 |
| 90. | Somerset | 0.65% | 0.23%(+0.422)#90 | 0.54%(+0.103)#5,282 |
| 91. | Bowerston | 0.63% | 0.23%(+0.409)#91 | 0.54%(+0.090)#5,356 |
| 92. | Valley View | 0.63% | 0.23%(+0.402)#92 | 0.54%(+0.083)#5,394 |
| 93. | Bridgeport | 0.62% | 0.23%(+0.396)#93 | 0.54%(+0.077)#5,425 |
| 94. | Broadview Heights | 0.62% | 0.23%(+0.395)#94 | 0.54%(+0.076)#5,428 |
| 95. | Philo | 0.62% | 0.23%(+0.391)#95 | 0.54%(+0.072)#5,459 |
| 96. | Silver Lake | 0.61% | 0.23%(+0.385)#96 | 0.54%(+0.066)#5,491 |
| 97. | Grandview Heights | 0.61% | 0.23%(+0.380)#97 | 0.54%(+0.061)#5,526 |
| 98. | Cheviot | 0.60% | 0.23%(+0.373)#98 | 0.54%(+0.054)#5,561 |
| 99. | Grand River | 0.59% | 0.23%(+0.365)#99 | 0.54%(+0.046)#5,625 |
| 100. | Eaton Estates | 0.59% | 0.23%(+0.362)#100 | 0.54%(+0.043)#5,654 |
Common Questions
What are the Top 10 Cities with the Highest Percentage of French Canadian Population in Ohio?
Top 10 Cities with the Highest Percentage of French Canadian Population in Ohio are:
What city has the Highest Percentage of French Canadian Population in Ohio?
Castine has the Highest Percentage of French Canadian Population in Ohio with 25.62%.
What is the Percentage of French Canadian Population in the State of Ohio?
Percentage of French Canadian Population in Ohio is 0.23%.
What is the Percentage of French Canadian Population in the United States?
Percentage of French Canadian Population in the United States is 0.54%.