Lake Lakengren, OH Map & Demographics
Lake Lakengren Map
Lake Lakengren Overview
$38,748
PER CAPITA INCOME
$93,906
AVG FAMILY INCOME
$83,722
AVG HOUSEHOLD INCOME
24.8%
WAGE / INCOME GAP [ % ]
75.2¢/ $1
WAGE / INCOME GAP [ $ ]
0.36
INEQUALITY / GINI INDEX
3,504
TOTAL POPULATION
1,870
MALE POPULATION
1,634
FEMALE POPULATION
114.44
MALES / 100 FEMALES
87.38
FEMALES / 100 MALES
44.0
MEDIAN AGE
2.9
AVG FAMILY SIZE
2.5
AVG HOUSEHOLD SIZE
1,899
LABOR FORCE [ PEOPLE ]
68.2%
PERCENT IN LABOR FORCE
1.2%
UNEMPLOYMENT RATE
Income in Lake Lakengren
Income Overview in Lake Lakengren
Per Capita Income in Lake Lakengren is $38,748, while median incomes of families and households are $93,906 and $83,722 respectively.
| Characteristic | Number | Measure |
| Per Capita Income | 3,504 | $38,748 |
| Median Family Income | 1,060 | $93,906 |
| Mean Family Income | 1,060 | $105,748 |
| Median Household Income | 1,409 | $83,722 |
| Mean Household Income | 1,409 | $95,336 |
| Income Deficit | 1,060 | $0 |
| Wage / Income Gap (%) | 3,504 | 24.79% |
| Wage / Income Gap ($) | 3,504 | 75.21¢ per $1 |
| Gini / Inequality Index | 3,504 | 0.36 |
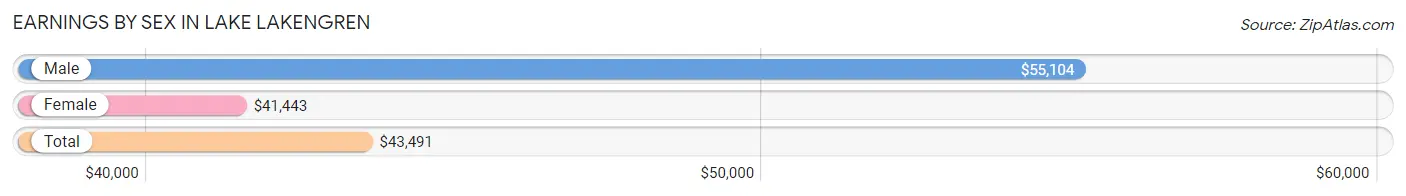
Earnings by Sex in Lake Lakengren
Average Earnings in Lake Lakengren are $43,491, $55,104 for men and $41,443 for women, a difference of 24.8%.
| Sex | Number | Average Earnings |
| Male | 1,043 (52.5%) | $55,104 |
| Female | 944 (47.5%) | $41,443 |
| Total | 1,987 (100.0%) | $43,491 |
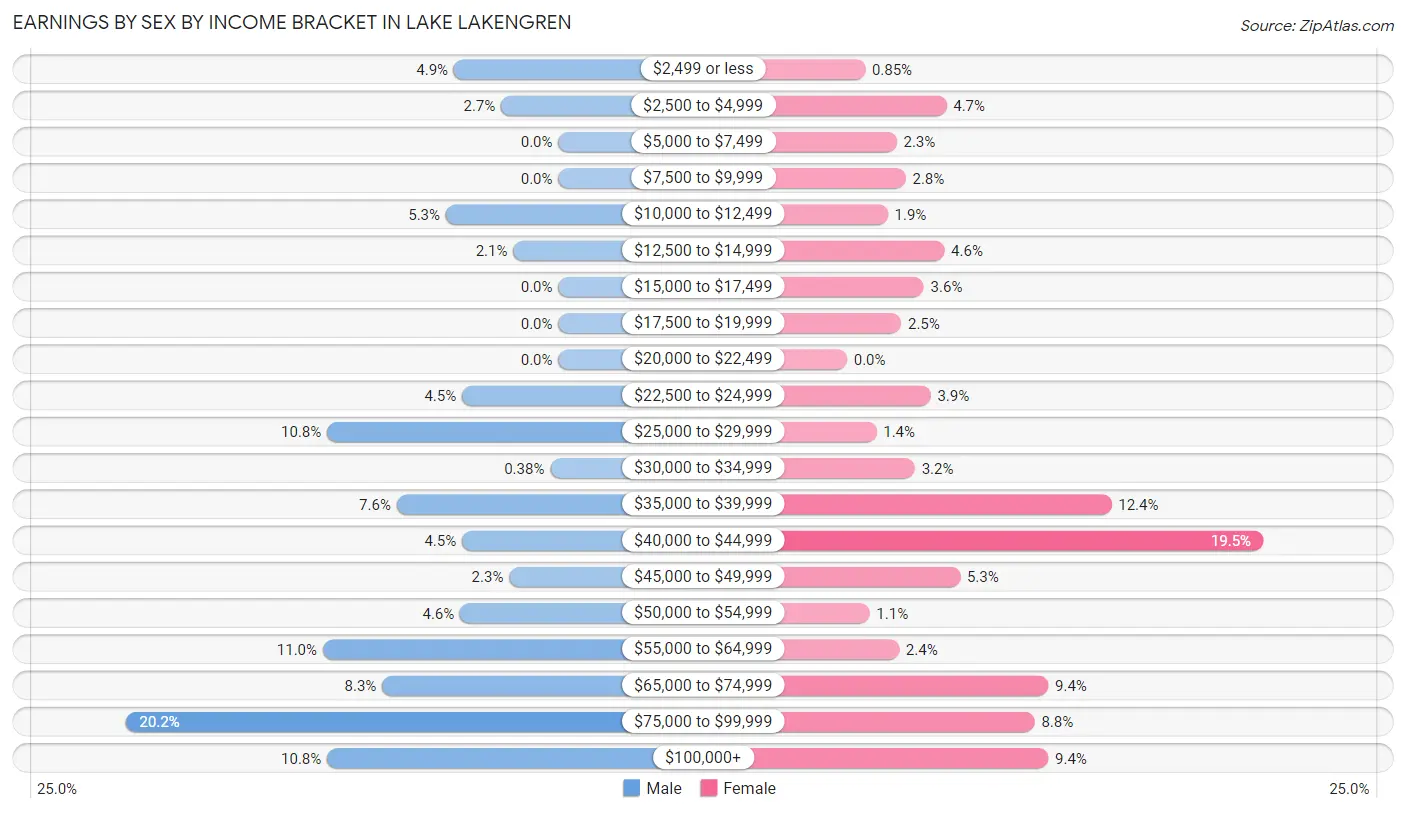
Earnings by Sex by Income Bracket in Lake Lakengren
The most common earnings brackets in Lake Lakengren are $75,000 to $99,999 for men (211 | 20.2%) and $40,000 to $44,999 for women (184 | 19.5%).
| Income | Male | Female |
| $2,499 or less | 51 (4.9%) | 8 (0.9%) |
| $2,500 to $4,999 | 28 (2.7%) | 44 (4.7%) |
| $5,000 to $7,499 | 0 (0.0%) | 22 (2.3%) |
| $7,500 to $9,999 | 0 (0.0%) | 26 (2.8%) |
| $10,000 to $12,499 | 55 (5.3%) | 18 (1.9%) |
| $12,500 to $14,999 | 22 (2.1%) | 43 (4.6%) |
| $15,000 to $17,499 | 0 (0.0%) | 34 (3.6%) |
| $17,500 to $19,999 | 0 (0.0%) | 24 (2.5%) |
| $20,000 to $22,499 | 0 (0.0%) | 0 (0.0%) |
| $22,500 to $24,999 | 47 (4.5%) | 37 (3.9%) |
| $25,000 to $29,999 | 113 (10.8%) | 13 (1.4%) |
| $30,000 to $34,999 | 4 (0.4%) | 30 (3.2%) |
| $35,000 to $39,999 | 79 (7.6%) | 117 (12.4%) |
| $40,000 to $44,999 | 47 (4.5%) | 184 (19.5%) |
| $45,000 to $49,999 | 24 (2.3%) | 50 (5.3%) |
| $50,000 to $54,999 | 48 (4.6%) | 10 (1.1%) |
| $55,000 to $64,999 | 115 (11.0%) | 23 (2.4%) |
| $65,000 to $74,999 | 86 (8.3%) | 89 (9.4%) |
| $75,000 to $99,999 | 211 (20.2%) | 83 (8.8%) |
| $100,000+ | 113 (10.8%) | 89 (9.4%) |
| Total | 1,043 (100.0%) | 944 (100.0%) |
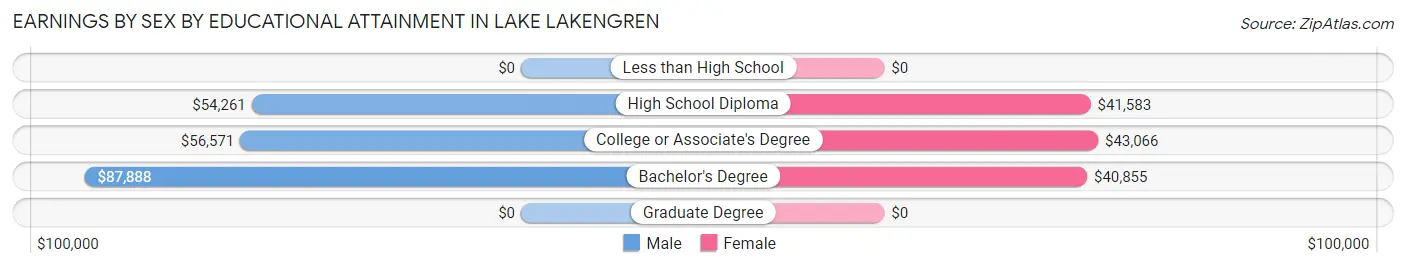
Earnings by Sex by Educational Attainment in Lake Lakengren
Average earnings in Lake Lakengren are $56,607 for men and $42,487 for women, a difference of 24.9%. Men with an educational attainment of bachelor's degree enjoy the highest average annual earnings of $87,888, while those with high school diploma education earn the least with $54,261. Women with an educational attainment of college or associate's degree earn the most with the average annual earnings of $43,066, while those with bachelor's degree education have the smallest earnings of $40,855.
| Educational Attainment | Male Income | Female Income |
| Less than High School | - | - |
| High School Diploma | $54,261 | $41,583 |
| College or Associate's Degree | $56,571 | $43,066 |
| Bachelor's Degree | $87,888 | $40,855 |
| Graduate Degree | - | - |
| Total | $56,607 | $42,487 |
Family Income in Lake Lakengren
Family Income Brackets in Lake Lakengren
According to the Lake Lakengren family income data, there are 258 families falling into the $100,000 to $149,999 income range, which is the most common income bracket and makes up 24.3% of all families.
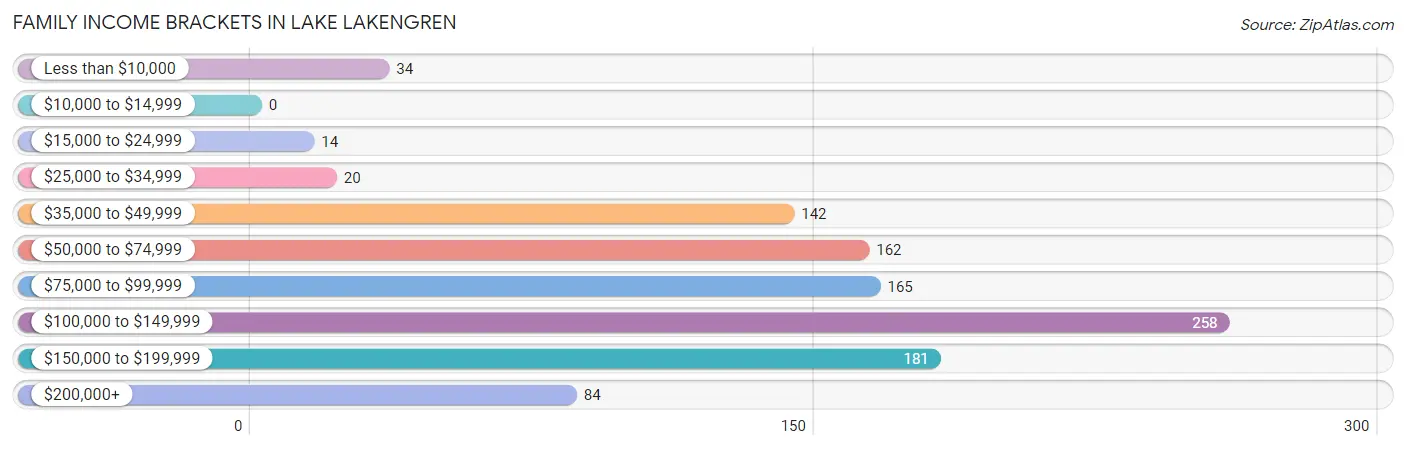
| Income Bracket | # Families | % Families |
| Less than $10,000 | 34 | 3.2% |
| $10,000 to $14,999 | 0 | 0.0% |
| $15,000 to $24,999 | 14 | 1.3% |
| $25,000 to $34,999 | 20 | 1.9% |
| $35,000 to $49,999 | 142 | 13.4% |
| $50,000 to $74,999 | 162 | 15.3% |
| $75,000 to $99,999 | 165 | 15.6% |
| $100,000 to $149,999 | 258 | 24.3% |
| $150,000 to $199,999 | 181 | 17.1% |
| $200,000+ | 84 | 7.9% |
Family Income by Famaliy Size in Lake Lakengren
4-person families (191 | 18.0%) account for the highest median family income in Lake Lakengren with $144,401 per family, while 2-person families (578 | 54.5%) have the highest median income of $44,262 per family member.
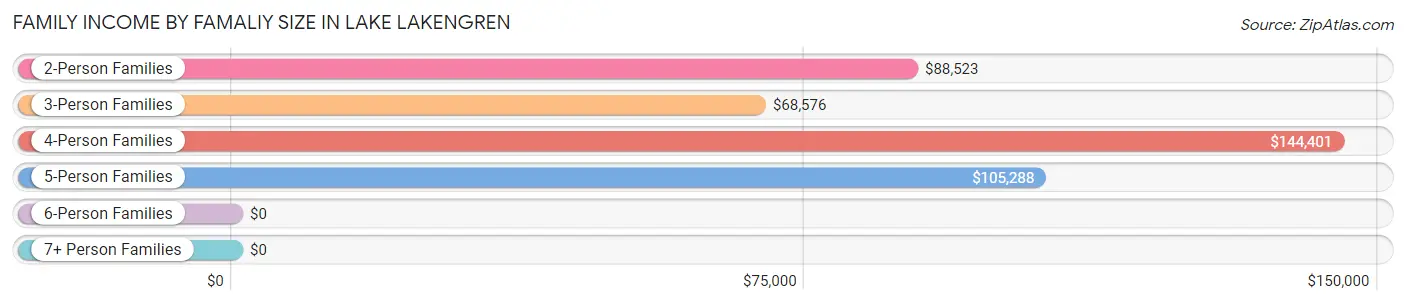
| Income Bracket | # Families | Median Income |
| 2-Person Families | 578 (54.5%) | $88,523 |
| 3-Person Families | 187 (17.6%) | $68,576 |
| 4-Person Families | 191 (18.0%) | $144,401 |
| 5-Person Families | 104 (9.8%) | $105,288 |
| 6-Person Families | 0 (0.0%) | $0 |
| 7+ Person Families | 0 (0.0%) | $0 |
| Total | 1,060 (100.0%) | $93,906 |
Family Income by Number of Earners in Lake Lakengren
The median family income in Lake Lakengren is $93,906, with families comprising 3+ earners (123) having the highest median family income of $153,563, while families with 1 earner (381) have the lowest median family income of $66,641, accounting for 11.6% and 35.9% of families, respectively.
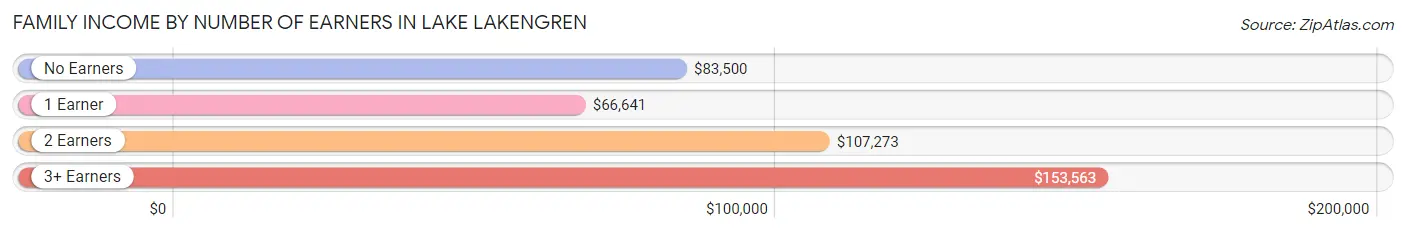
| Number of Earners | # Families | Median Income |
| No Earners | 138 (13.0%) | $83,500 |
| 1 Earner | 381 (35.9%) | $66,641 |
| 2 Earners | 418 (39.4%) | $107,273 |
| 3+ Earners | 123 (11.6%) | $153,563 |
| Total | 1,060 (100.0%) | $93,906 |
Household Income in Lake Lakengren
Household Income Brackets in Lake Lakengren
With 280 households falling in the category, the $100,000 to $149,999 income range is the most frequent in Lake Lakengren, accounting for 19.9% of all households. In contrast, only 8 households (0.6%) fall into the $10,000 to $14,999 income bracket, making it the least populous group.
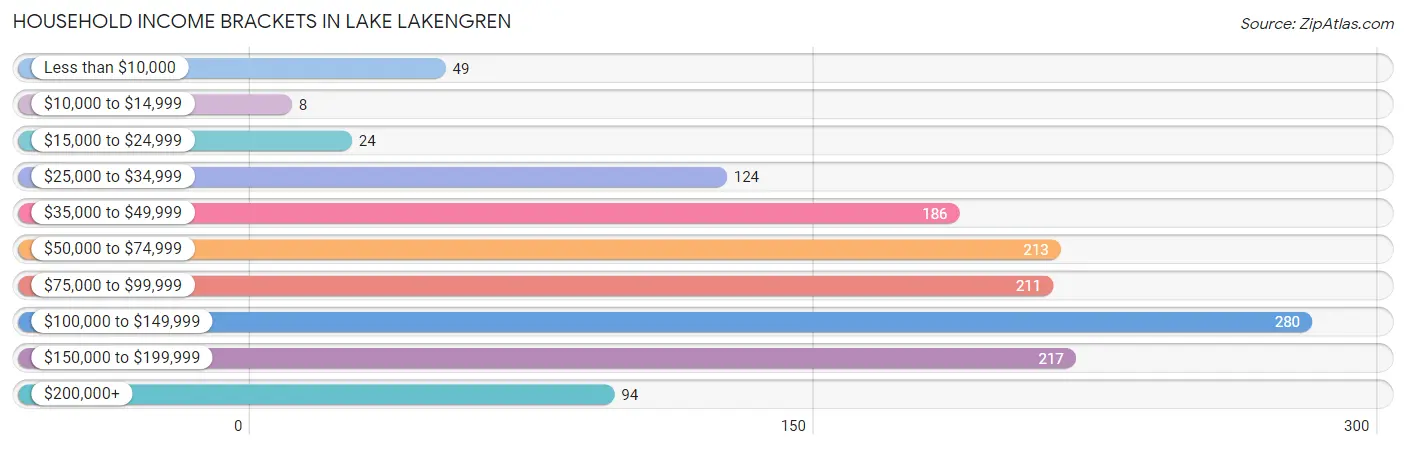
| Income Bracket | # Households | % Households |
| Less than $10,000 | 49 | 3.5% |
| $10,000 to $14,999 | 8 | 0.6% |
| $15,000 to $24,999 | 24 | 1.7% |
| $25,000 to $34,999 | 124 | 8.8% |
| $35,000 to $49,999 | 186 | 13.2% |
| $50,000 to $74,999 | 213 | 15.1% |
| $75,000 to $99,999 | 211 | 15.0% |
| $100,000 to $149,999 | 280 | 19.9% |
| $150,000 to $199,999 | 217 | 15.4% |
| $200,000+ | 94 | 6.7% |
Household Income by Householder Age in Lake Lakengren
The median household income in Lake Lakengren is $83,722, with the highest median household income of $112,188 found in the 45 to 64 years age bracket for the primary householder. A total of 576 households (40.9%) fall into this category. Meanwhile, the 15 to 24 years age bracket for the primary householder has the lowest median household income of $0, with 20 households (1.4%) in this group.
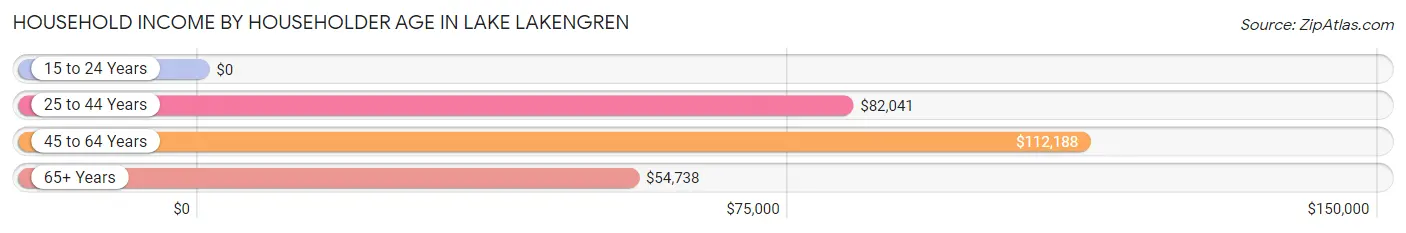
| Income Bracket | # Households | Median Income |
| 15 to 24 Years | 20 (1.4%) | $0 |
| 25 to 44 Years | 368 (26.1%) | $82,041 |
| 45 to 64 Years | 576 (40.9%) | $112,188 |
| 65+ Years | 445 (31.6%) | $54,738 |
| Total | 1,409 (100.0%) | $83,722 |
Poverty in Lake Lakengren
Income Below Poverty by Sex and Age in Lake Lakengren
With 2.3% poverty level for males and 5.2% for females among the residents of Lake Lakengren, 75 year old and over males and 75 year old and over females are the most vulnerable to poverty, with 16 males (18.0%) and 23 females (16.7%) in their respective age groups living below the poverty level.
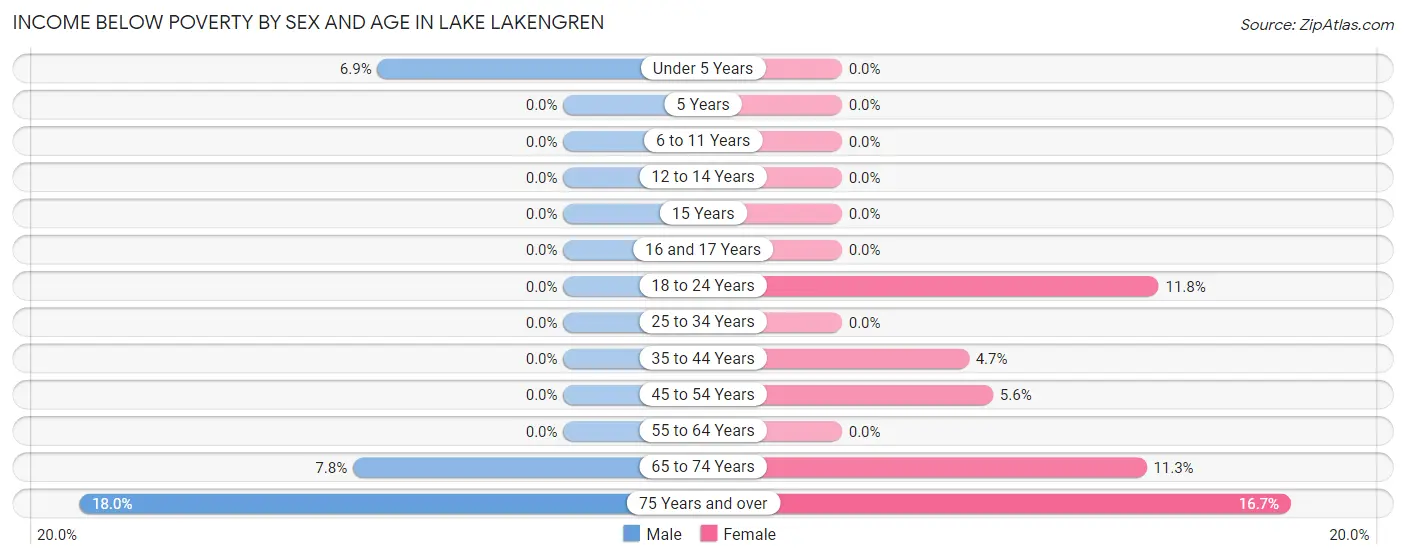
| Age Bracket | Male | Female |
| Under 5 Years | 12 (6.9%) | 0 (0.0%) |
| 5 Years | 0 (0.0%) | 0 (0.0%) |
| 6 to 11 Years | 0 (0.0%) | 0 (0.0%) |
| 12 to 14 Years | 0 (0.0%) | 0 (0.0%) |
| 15 Years | 0 (0.0%) | 0 (0.0%) |
| 16 and 17 Years | 0 (0.0%) | 0 (0.0%) |
| 18 to 24 Years | 0 (0.0%) | 10 (11.8%) |
| 25 to 34 Years | 0 (0.0%) | 0 (0.0%) |
| 35 to 44 Years | 0 (0.0%) | 9 (4.7%) |
| 45 to 54 Years | 0 (0.0%) | 16 (5.6%) |
| 55 to 64 Years | 0 (0.0%) | 0 (0.0%) |
| 65 to 74 Years | 15 (7.8%) | 25 (11.3%) |
| 75 Years and over | 16 (18.0%) | 23 (16.7%) |
| Total | 43 (2.3%) | 83 (5.2%) |
Income Above Poverty by Sex and Age in Lake Lakengren
According to the poverty statistics in Lake Lakengren, males aged 6 to 11 years and females aged under 5 years are the age groups that are most secure financially, with 100.0% of males and 100.0% of females in these age groups living above the poverty line.
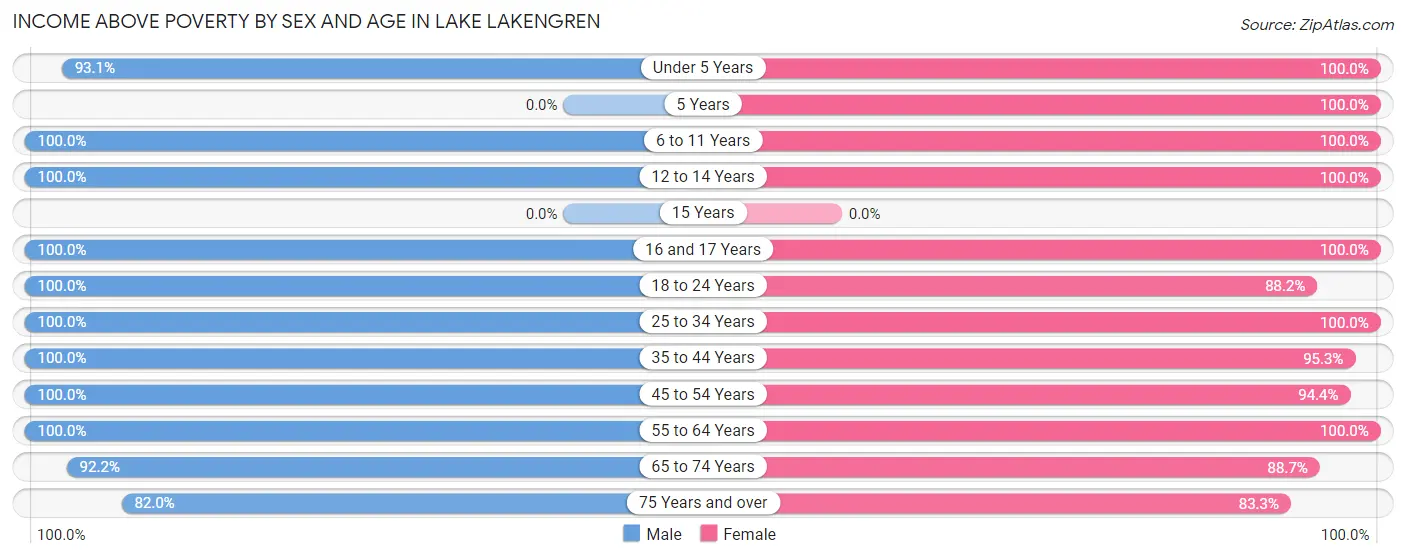
| Age Bracket | Male | Female |
| Under 5 Years | 162 (93.1%) | 10 (100.0%) |
| 5 Years | 0 (0.0%) | 7 (100.0%) |
| 6 to 11 Years | 246 (100.0%) | 185 (100.0%) |
| 12 to 14 Years | 32 (100.0%) | 40 (100.0%) |
| 15 Years | 0 (0.0%) | 0 (0.0%) |
| 16 and 17 Years | 58 (100.0%) | 39 (100.0%) |
| 18 to 24 Years | 173 (100.0%) | 75 (88.2%) |
| 25 to 34 Years | 146 (100.0%) | 198 (100.0%) |
| 35 to 44 Years | 212 (100.0%) | 182 (95.3%) |
| 45 to 54 Years | 313 (100.0%) | 269 (94.4%) |
| 55 to 64 Years | 235 (100.0%) | 209 (100.0%) |
| 65 to 74 Years | 177 (92.2%) | 196 (88.7%) |
| 75 Years and over | 73 (82.0%) | 115 (83.3%) |
| Total | 1,827 (97.7%) | 1,525 (94.8%) |
Income Below Poverty Among Married-Couple Families in Lake Lakengren
The poverty statistics for married-couple families in Lake Lakengren show that 3.7% or 31 of the total 840 families live below the poverty line. Families with no children have the highest poverty rate of 5.4%, comprising of 31 families. On the other hand, families with 1 or 2 children have the lowest poverty rate of 0.0%, which includes 0 families.
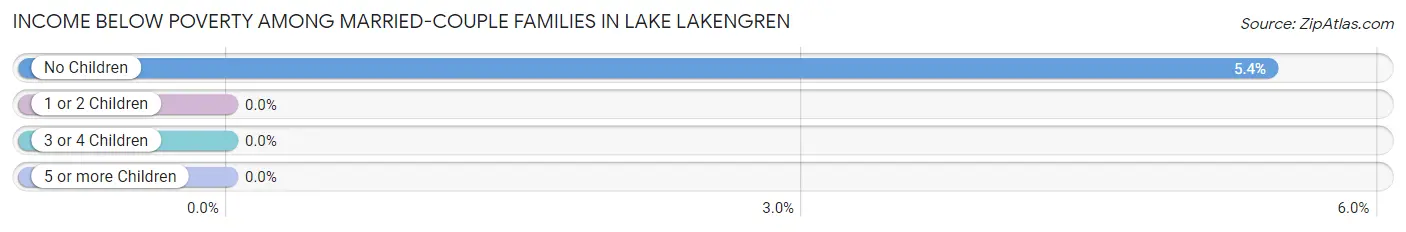
| Children | Above Poverty | Below Poverty |
| No Children | 540 (94.6%) | 31 (5.4%) |
| 1 or 2 Children | 194 (100.0%) | 0 (0.0%) |
| 3 or 4 Children | 75 (100.0%) | 0 (0.0%) |
| 5 or more Children | 0 (0.0%) | 0 (0.0%) |
| Total | 809 (96.3%) | 31 (3.7%) |
Income Below Poverty Among Single-Parent Households in Lake Lakengren
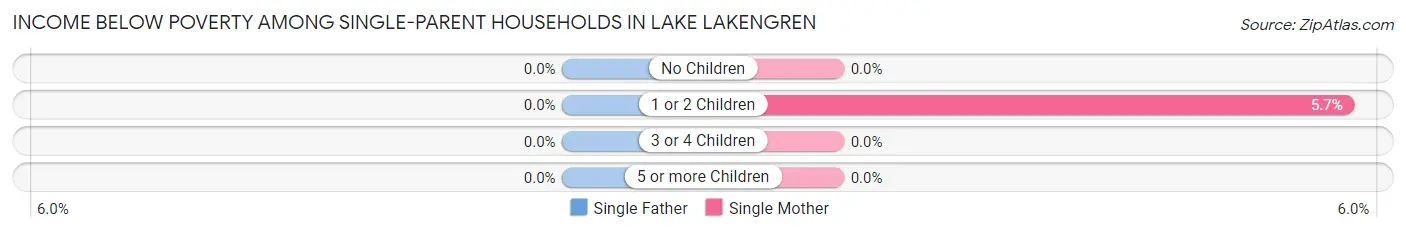
| Children | Single Father | Single Mother |
| No Children | 0 (0.0%) | 0 (0.0%) |
| 1 or 2 Children | 0 (0.0%) | 10 (5.7%) |
| 3 or 4 Children | 0 (0.0%) | 0 (0.0%) |
| 5 or more Children | 0 (0.0%) | 0 (0.0%) |
| Total | 0 (0.0%) | 10 (4.7%) |
Income Below Poverty Among Married-Couple vs Single-Parent Households in Lake Lakengren
The poverty data for Lake Lakengren shows that 31 of the married-couple family households (3.7%) and 10 of the single-parent households (4.5%) are living below the poverty level. Within the married-couple family households, those with no children have the highest poverty rate, with 31 households (5.4%) falling below the poverty line. Among the single-parent households, those with 1 or 2 children have the highest poverty rate, with 10 household (5.7%) living below poverty.
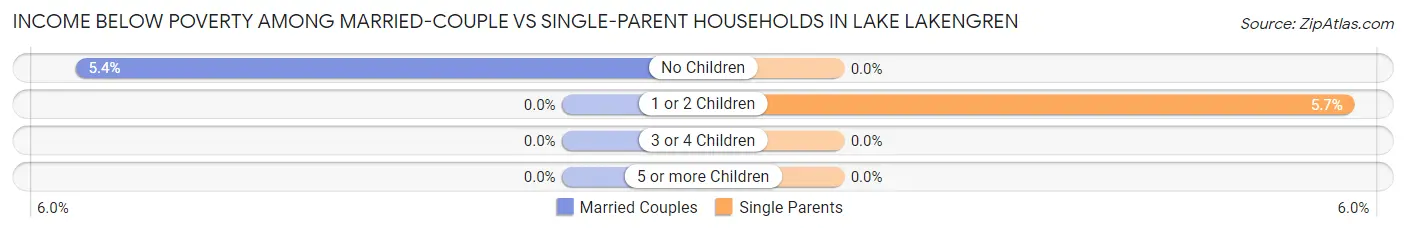
| Children | Married-Couple Families | Single-Parent Households |
| No Children | 31 (5.4%) | 0 (0.0%) |
| 1 or 2 Children | 0 (0.0%) | 10 (5.7%) |
| 3 or 4 Children | 0 (0.0%) | 0 (0.0%) |
| 5 or more Children | 0 (0.0%) | 0 (0.0%) |
| Total | 31 (3.7%) | 10 (4.5%) |
Race in Lake Lakengren
The most populous races in Lake Lakengren are White / Caucasian (3,339 | 95.3%), Two or more Races (114 | 3.3%), and Hispanic or Latino (50 | 1.4%).
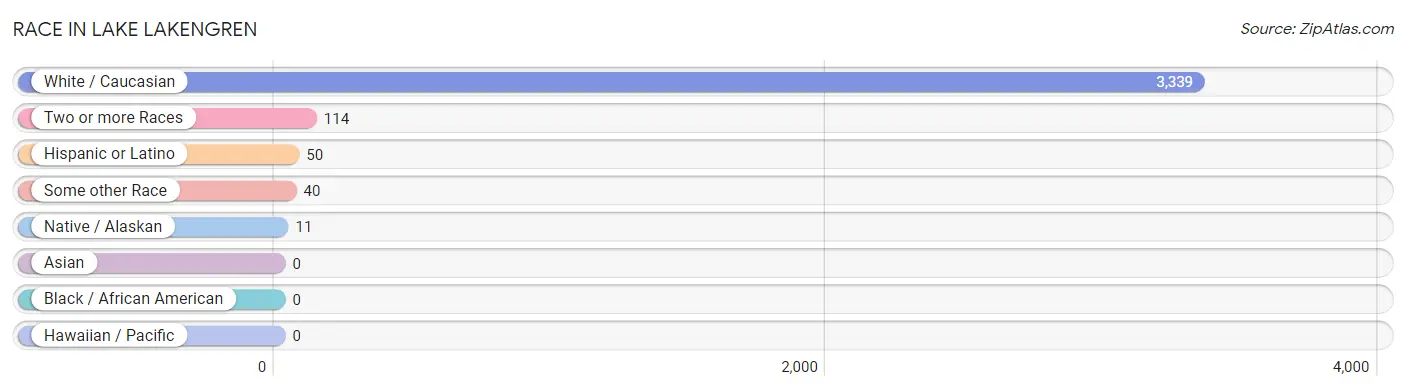
| Race | # Population | % Population |
| Asian | 0 | 0.0% |
| Black / African American | 0 | 0.0% |
| Hawaiian / Pacific | 0 | 0.0% |
| Hispanic or Latino | 50 | 1.4% |
| Native / Alaskan | 11 | 0.3% |
| White / Caucasian | 3,339 | 95.3% |
| Two or more Races | 114 | 3.3% |
| Some other Race | 40 | 1.1% |
| Total | 3,504 | 100.0% |
Ancestry in Lake Lakengren
The most populous ancestries reported in Lake Lakengren are German (1,188 | 33.9%), English (390 | 11.1%), Irish (269 | 7.7%), American (161 | 4.6%), and Italian (90 | 2.6%), together accounting for 59.9% of all Lake Lakengren residents.
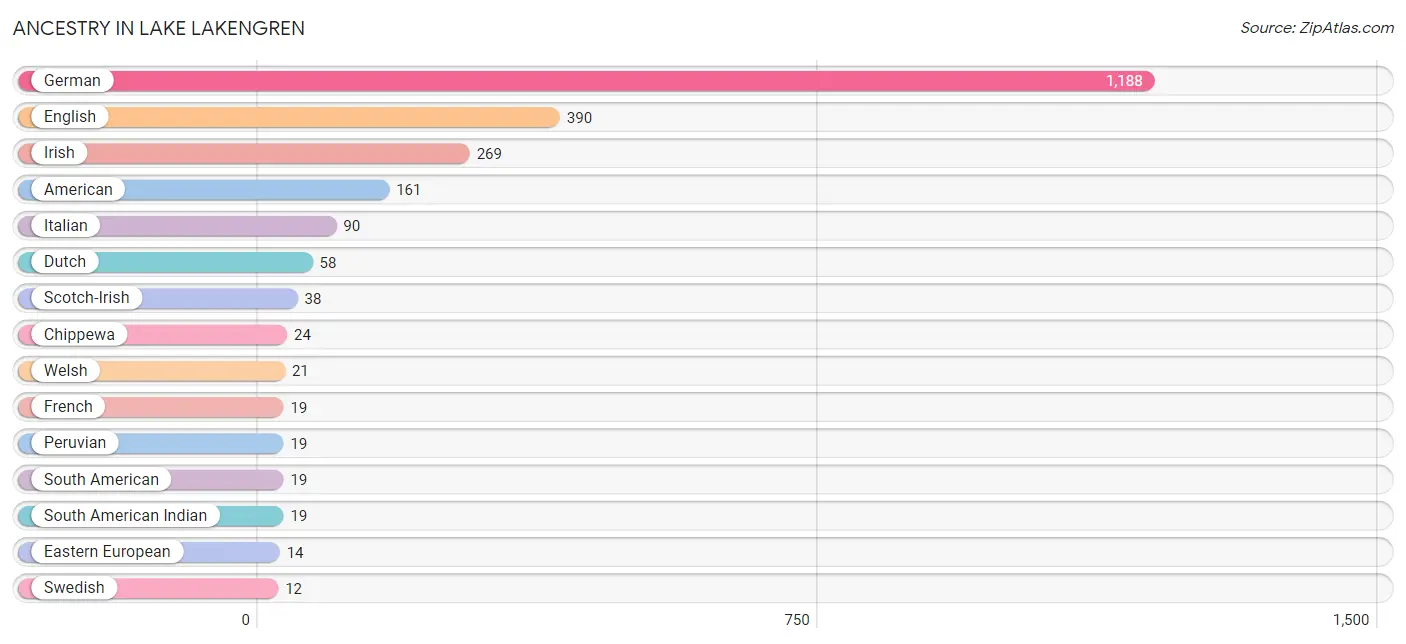
| Ancestry | # Population | % Population |
| American | 161 | 4.6% |
| Brazilian | 8 | 0.2% |
| Chippewa | 24 | 0.7% |
| Dutch | 58 | 1.7% |
| Eastern European | 14 | 0.4% |
| English | 390 | 11.1% |
| European | 9 | 0.3% |
| Finnish | 11 | 0.3% |
| French | 19 | 0.5% |
| German | 1,188 | 33.9% |
| Hungarian | 6 | 0.2% |
| Irish | 269 | 7.7% |
| Italian | 90 | 2.6% |
| Korean | 9 | 0.3% |
| Peruvian | 19 | 0.5% |
| Scandinavian | 8 | 0.2% |
| Scotch-Irish | 38 | 1.1% |
| Scottish | 9 | 0.3% |
| South American | 19 | 0.5% |
| South American Indian | 19 | 0.5% |
| Swedish | 12 | 0.3% |
| Swiss | 8 | 0.2% |
| Welsh | 21 | 0.6% | View All 23 Rows |
Immigrants in Lake Lakengren
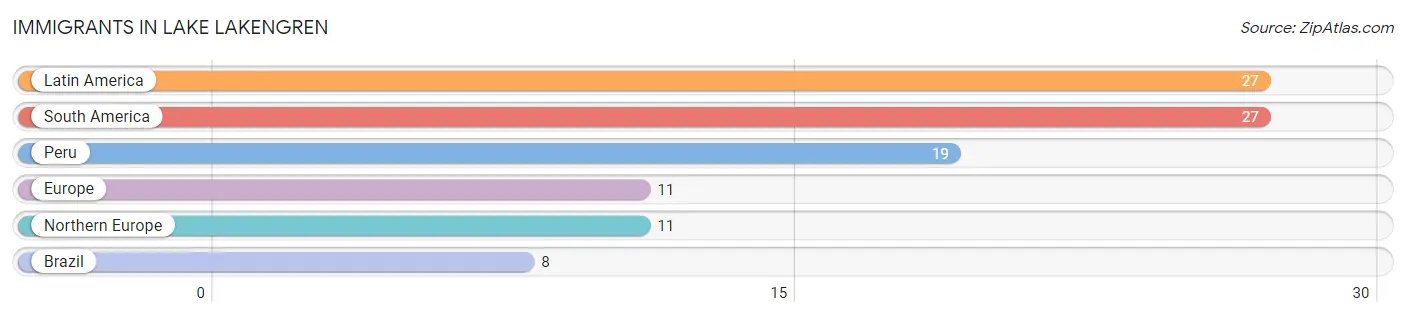
The most numerous immigrant groups reported in Lake Lakengren came from Latin America (27 | 0.8%), South America (27 | 0.8%), Peru (19 | 0.5%), Europe (11 | 0.3%), and Northern Europe (11 | 0.3%), together accounting for 2.7% of all Lake Lakengren residents.
| Immigration Origin | # Population | % Population |
| Brazil | 8 | 0.2% |
| Europe | 11 | 0.3% |
| Latin America | 27 | 0.8% |
| Northern Europe | 11 | 0.3% |
| Peru | 19 | 0.5% |
| South America | 27 | 0.8% | View All 6 Rows |
Sex and Age in Lake Lakengren
Sex and Age in Lake Lakengren
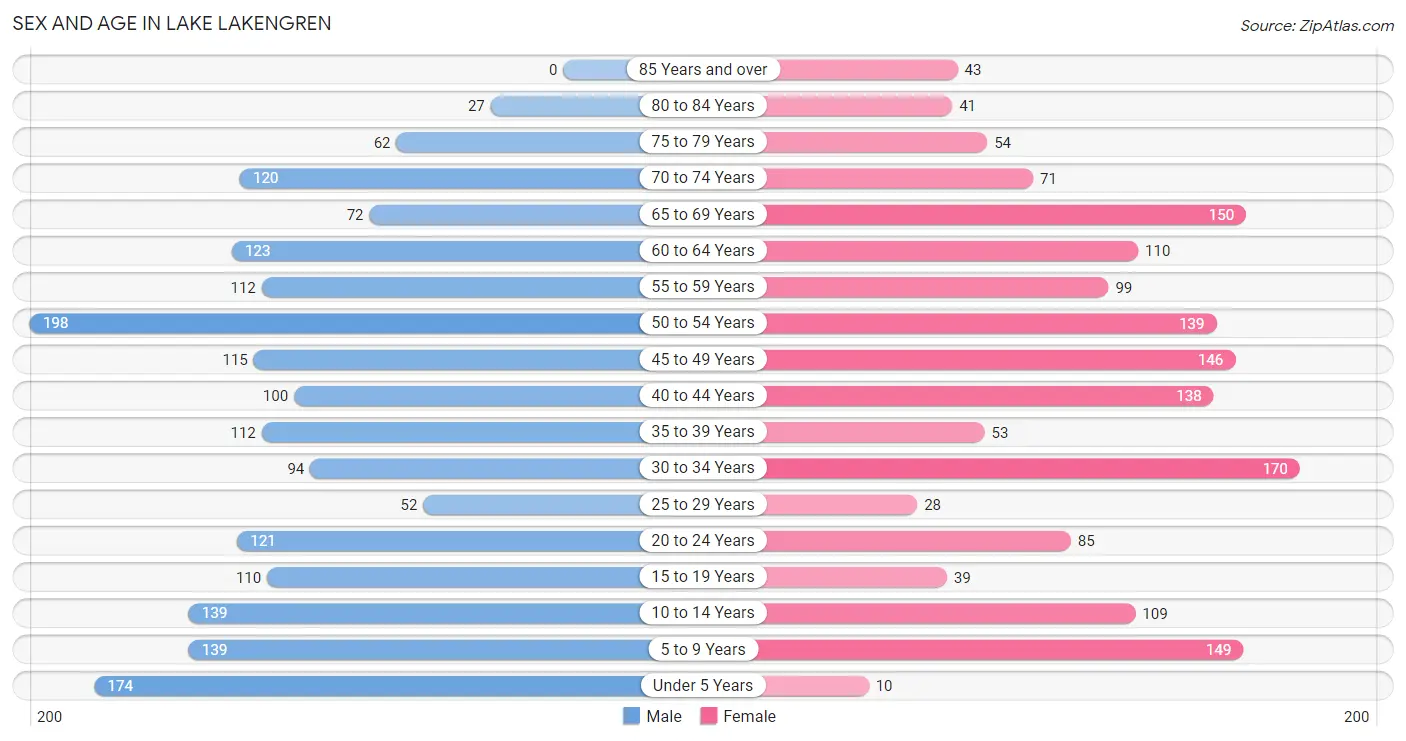
The most populous age groups in Lake Lakengren are 50 to 54 Years (198 | 10.6%) for men and 30 to 34 Years (170 | 10.4%) for women.
| Age Bracket | Male | Female |
| Under 5 Years | 174 (9.3%) | 10 (0.6%) |
| 5 to 9 Years | 139 (7.4%) | 149 (9.1%) |
| 10 to 14 Years | 139 (7.4%) | 109 (6.7%) |
| 15 to 19 Years | 110 (5.9%) | 39 (2.4%) |
| 20 to 24 Years | 121 (6.5%) | 85 (5.2%) |
| 25 to 29 Years | 52 (2.8%) | 28 (1.7%) |
| 30 to 34 Years | 94 (5.0%) | 170 (10.4%) |
| 35 to 39 Years | 112 (6.0%) | 53 (3.2%) |
| 40 to 44 Years | 100 (5.3%) | 138 (8.5%) |
| 45 to 49 Years | 115 (6.1%) | 146 (8.9%) |
| 50 to 54 Years | 198 (10.6%) | 139 (8.5%) |
| 55 to 59 Years | 112 (6.0%) | 99 (6.1%) |
| 60 to 64 Years | 123 (6.6%) | 110 (6.7%) |
| 65 to 69 Years | 72 (3.8%) | 150 (9.2%) |
| 70 to 74 Years | 120 (6.4%) | 71 (4.3%) |
| 75 to 79 Years | 62 (3.3%) | 54 (3.3%) |
| 80 to 84 Years | 27 (1.4%) | 41 (2.5%) |
| 85 Years and over | 0 (0.0%) | 43 (2.6%) |
| Total | 1,870 (100.0%) | 1,634 (100.0%) |
Families and Households in Lake Lakengren
Median Family Size in Lake Lakengren
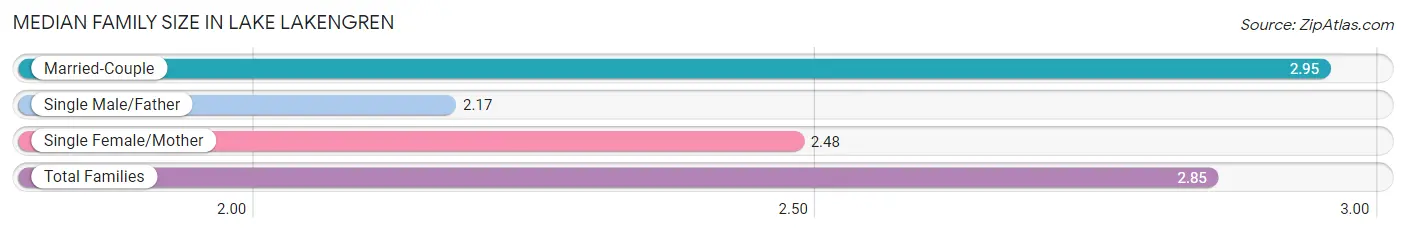
The median family size in Lake Lakengren is 2.85 persons per family, with married-couple families (840 | 79.2%) accounting for the largest median family size of 2.95 persons per family. On the other hand, single male/father families (6 | 0.6%) represent the smallest median family size with 2.17 persons per family.
| Family Type | # Families | Family Size |
| Married-Couple | 840 (79.2%) | 2.95 |
| Single Male/Father | 6 (0.6%) | 2.17 |
| Single Female/Mother | 214 (20.2%) | 2.48 |
| Total Families | 1,060 (100.0%) | 2.85 |
Median Household Size in Lake Lakengren
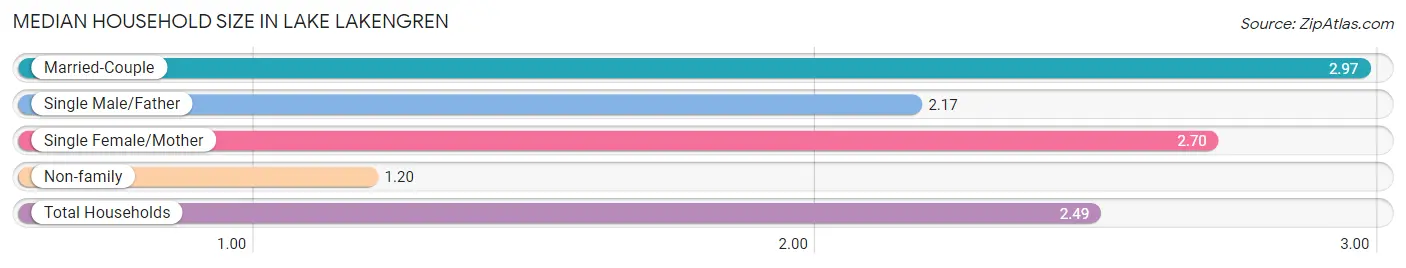
The median household size in Lake Lakengren is 2.49 persons per household, with married-couple households (840 | 59.6%) accounting for the largest median household size of 2.97 persons per household. non-family households (349 | 24.8%) represent the smallest median household size with 1.20 persons per household.
| Household Type | # Households | Household Size |
| Married-Couple | 840 (59.6%) | 2.97 |
| Single Male/Father | 6 (0.4%) | 2.17 |
| Single Female/Mother | 214 (15.2%) | 2.70 |
| Non-family | 349 (24.8%) | 1.20 |
| Total Households | 1,409 (100.0%) | 2.49 |
Household Size by Marriage Status in Lake Lakengren
Out of a total of 1,409 households in Lake Lakengren, 1,060 (75.2%) are family households, while 349 (24.8%) are nonfamily households. The most numerous type of family households are 2-person households, comprising 570, and the most common type of nonfamily households are 1-person households, comprising 280.
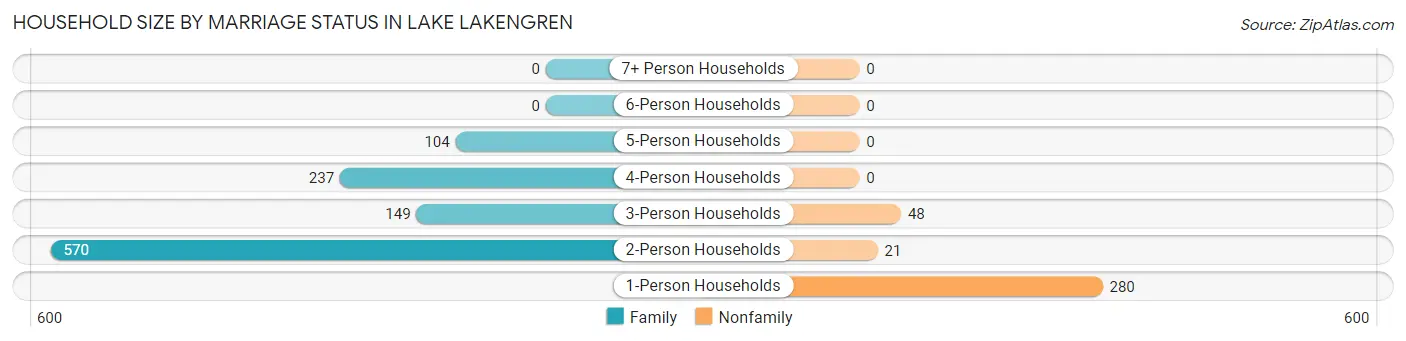
| Household Size | Family Households | Nonfamily Households |
| 1-Person Households | - | 280 (19.9%) |
| 2-Person Households | 570 (40.5%) | 21 (1.5%) |
| 3-Person Households | 149 (10.6%) | 48 (3.4%) |
| 4-Person Households | 237 (16.8%) | 0 (0.0%) |
| 5-Person Households | 104 (7.4%) | 0 (0.0%) |
| 6-Person Households | 0 (0.0%) | 0 (0.0%) |
| 7+ Person Households | 0 (0.0%) | 0 (0.0%) |
| Total | 1,060 (75.2%) | 349 (24.8%) |
Female Fertility in Lake Lakengren
Fertility by Age in Lake Lakengren
Average fertility rate in Lake Lakengren is 25.0 births per 1,000 women. Women in the age bracket of 20 to 34 years have the highest fertility rate with 64.0 births per 1,000 women. Women in the age bracket of 20 to 34 years acount for 100.0% of all women with births.
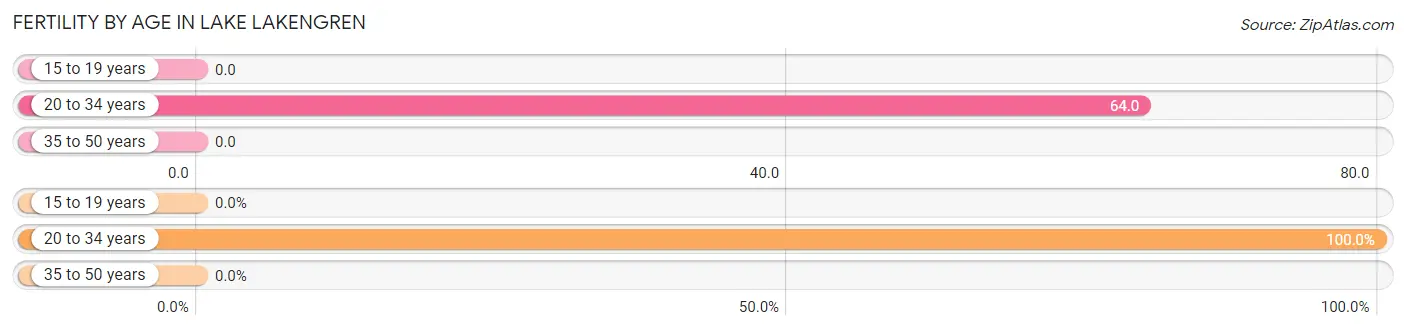
| Age Bracket | Women with Births | Births / 1,000 Women |
| 15 to 19 years | 0 (0.0%) | 0.0 |
| 20 to 34 years | 18 (100.0%) | 64.0 |
| 35 to 50 years | 0 (0.0%) | 0.0 |
| Total | 18 (100.0%) | 25.0 |
Fertility by Age by Marriage Status in Lake Lakengren
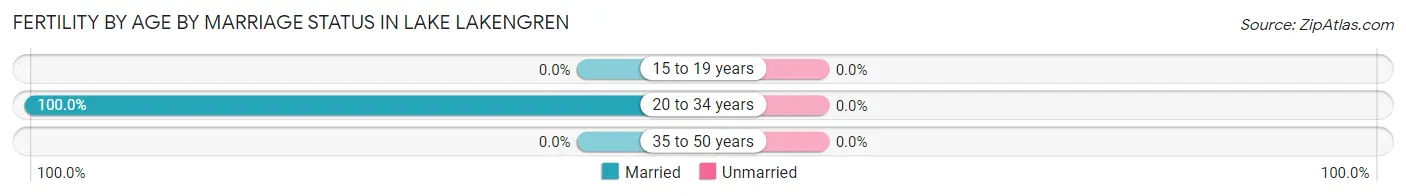
| Age Bracket | Married | Unmarried |
| 15 to 19 years | 0 (0.0%) | 0 (0.0%) |
| 20 to 34 years | 18 (100.0%) | 0 (0.0%) |
| 35 to 50 years | 0 (0.0%) | 0 (0.0%) |
| Total | 18 (100.0%) | 0 (0.0%) |
Fertility by Education in Lake Lakengren
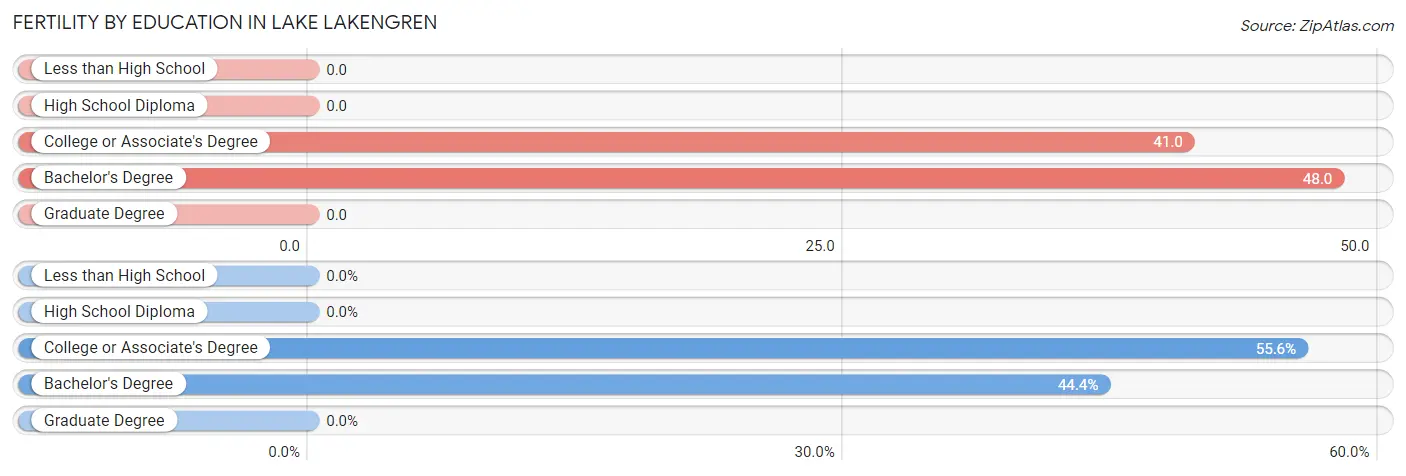
| Educational Attainment | Women with Births | Births / 1,000 Women |
| Less than High School | 0 (0.0%) | 0.0 |
| High School Diploma | 0 (0.0%) | 0.0 |
| College or Associate's Degree | 10 (55.6%) | 41.0 |
| Bachelor's Degree | 8 (44.4%) | 48.0 |
| Graduate Degree | 0 (0.0%) | 0.0 |
| Total | 18 (100.0%) | 25.0 |
Fertility by Education by Marriage Status in Lake Lakengren
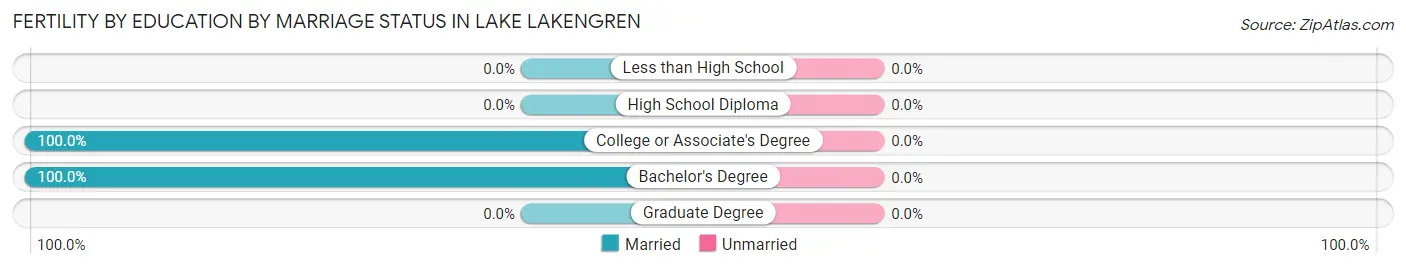
| Educational Attainment | Married | Unmarried |
| Less than High School | 0 (0.0%) | 0 (0.0%) |
| High School Diploma | 0 (0.0%) | 0 (0.0%) |
| College or Associate's Degree | 10 (100.0%) | 0 (0.0%) |
| Bachelor's Degree | 8 (100.0%) | 0 (0.0%) |
| Graduate Degree | 0 (0.0%) | 0 (0.0%) |
| Total | 18 (100.0%) | 0 (0.0%) |
Employment Characteristics in Lake Lakengren
Employment by Class of Employer in Lake Lakengren
Among the 1,828 employed individuals in Lake Lakengren, private company employees (1,337 | 73.1%), not-for-profit organizations (194 | 10.6%), and local government employees (87 | 4.8%) make up the most common classes of employment.
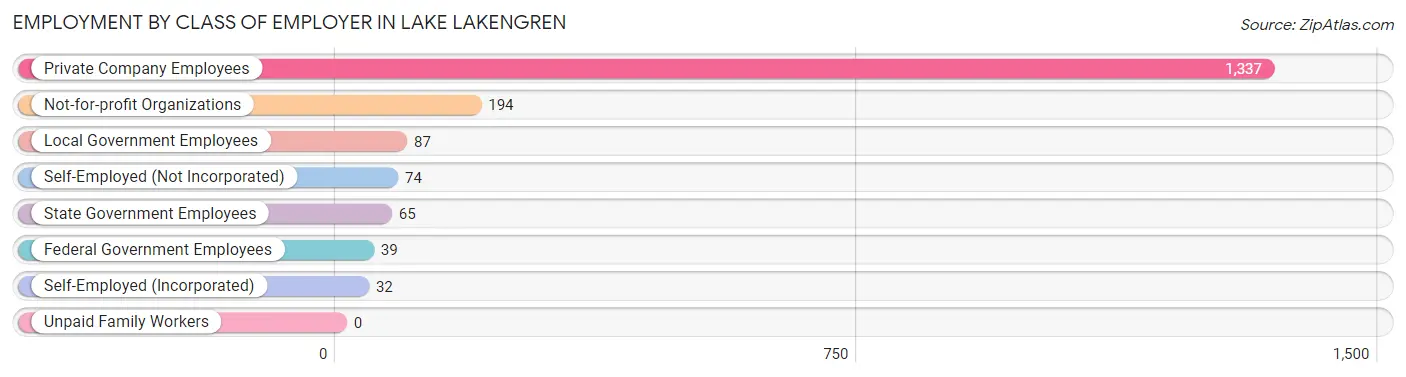
| Employer Class | # Employees | % Employees |
| Private Company Employees | 1,337 | 73.1% |
| Self-Employed (Incorporated) | 32 | 1.8% |
| Self-Employed (Not Incorporated) | 74 | 4.1% |
| Not-for-profit Organizations | 194 | 10.6% |
| Local Government Employees | 87 | 4.8% |
| State Government Employees | 65 | 3.6% |
| Federal Government Employees | 39 | 2.1% |
| Unpaid Family Workers | 0 | 0.0% |
| Total | 1,828 | 100.0% |
Employment Status by Age in Lake Lakengren
According to the labor force statistics for Lake Lakengren, out of the total population over 16 years of age (2,784), 68.2% or 1,899 individuals are in the labor force, with 1.2% or 23 of them unemployed. The age group with the highest labor force participation rate is 25 to 29 years, with 100.0% or 80 individuals in the labor force. Within the labor force, the 55 to 59 years age range has the highest percentage of unemployed individuals, with 5.1% or 9 of them being unemployed.
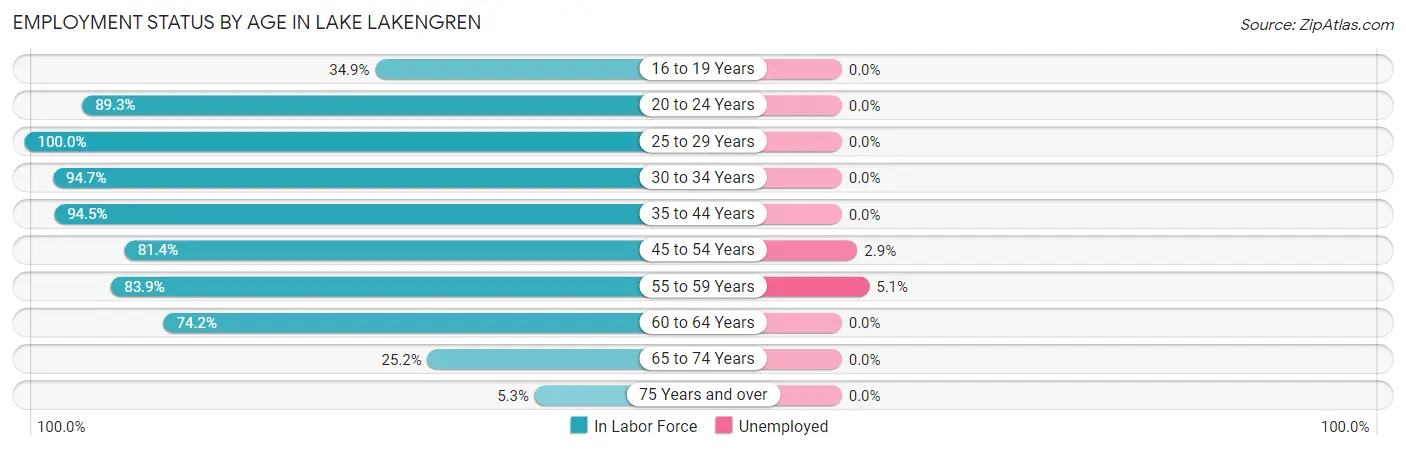
| Age Bracket | In Labor Force | Unemployed |
| 16 to 19 Years | 52 (34.9%) | 0 (0.0%) |
| 20 to 24 Years | 184 (89.3%) | 0 (0.0%) |
| 25 to 29 Years | 80 (100.0%) | 0 (0.0%) |
| 30 to 34 Years | 250 (94.7%) | 0 (0.0%) |
| 35 to 44 Years | 381 (94.5%) | 0 (0.0%) |
| 45 to 54 Years | 487 (81.4%) | 14 (2.9%) |
| 55 to 59 Years | 177 (83.9%) | 9 (5.1%) |
| 60 to 64 Years | 173 (74.2%) | 0 (0.0%) |
| 65 to 74 Years | 104 (25.2%) | 0 (0.0%) |
| 75 Years and over | 12 (5.3%) | 0 (0.0%) |
| Total | 1,899 (68.2%) | 23 (1.2%) |
Employment Status by Educational Attainment in Lake Lakengren
According to labor force statistics for Lake Lakengren, 86.5% of individuals (1,547) out of the total population between 25 and 64 years of age (1,789) are in the labor force, with 1.5% or 23 of them being unemployed. The group with the highest labor force participation rate are those with the educational attainment of less than high school, with 100.0% or 51 individuals in the labor force. Within the labor force, individuals with high school diploma education have the highest percentage of unemployment, with 4.2% or 23 of them being unemployed.
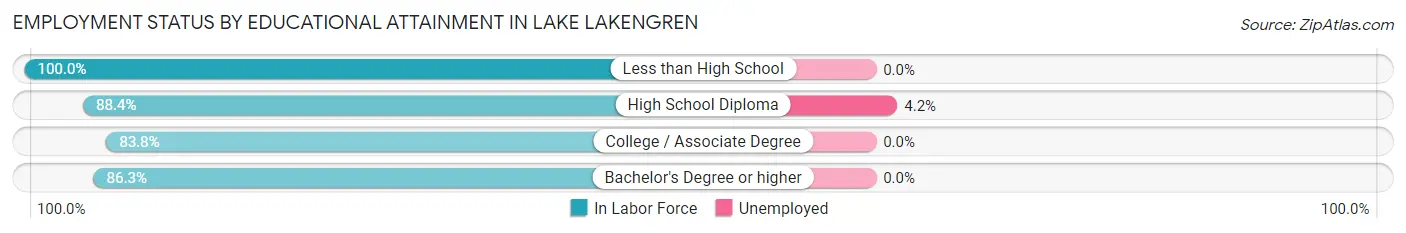
| Educational Attainment | In Labor Force | Unemployed |
| Less than High School | 51 (100.0%) | 0 (0.0%) |
| High School Diploma | 550 (88.4%) | 26 (4.2%) |
| College / Associate Degree | 539 (83.8%) | 0 (0.0%) |
| Bachelor's Degree or higher | 408 (86.3%) | 0 (0.0%) |
| Total | 1,547 (86.5%) | 27 (1.5%) |
Employment Occupations by Sex in Lake Lakengren
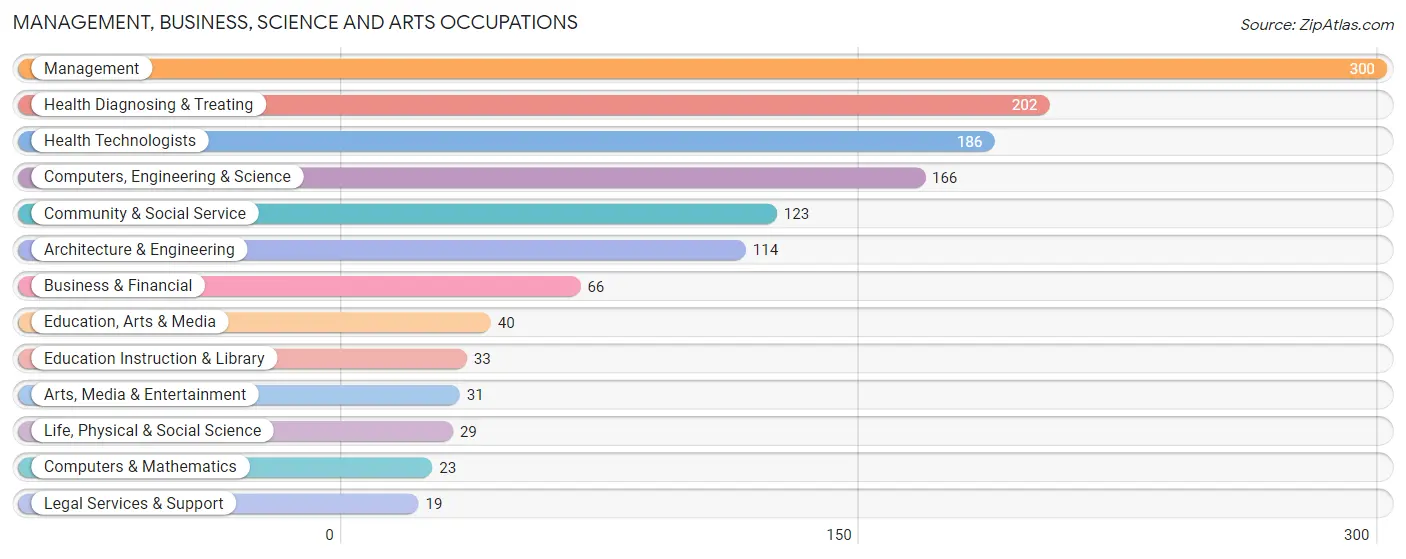
Management, Business, Science and Arts Occupations
The most common Management, Business, Science and Arts occupations in Lake Lakengren are Management (300 | 16.0%), Health Diagnosing & Treating (202 | 10.8%), Health Technologists (186 | 9.9%), Computers, Engineering & Science (166 | 8.8%), and Community & Social Service (123 | 6.6%).
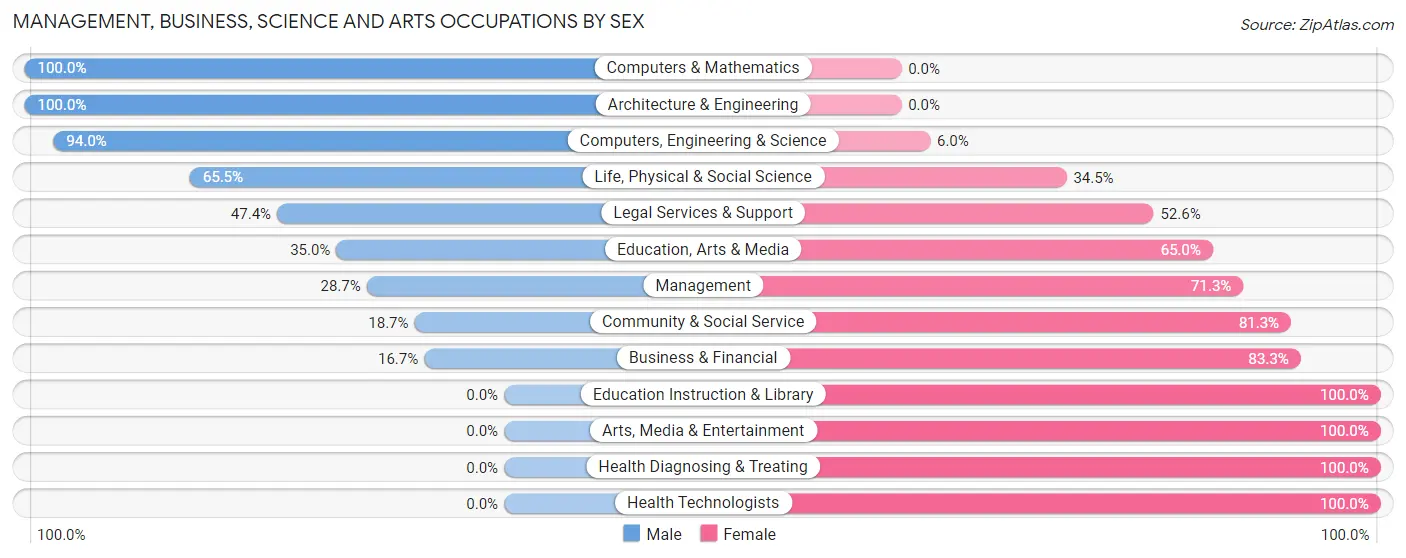
Management, Business, Science and Arts Occupations by Sex
Within the Management, Business, Science and Arts occupations in Lake Lakengren, the most male-oriented occupations are Computers & Mathematics (100.0%), Architecture & Engineering (100.0%), and Computers, Engineering & Science (94.0%), while the most female-oriented occupations are Education Instruction & Library (100.0%), Arts, Media & Entertainment (100.0%), and Health Diagnosing & Treating (100.0%).
| Occupation | Male | Female |
| Management | 86 (28.7%) | 214 (71.3%) |
| Business & Financial | 11 (16.7%) | 55 (83.3%) |
| Computers, Engineering & Science | 156 (94.0%) | 10 (6.0%) |
| Computers & Mathematics | 23 (100.0%) | 0 (0.0%) |
| Architecture & Engineering | 114 (100.0%) | 0 (0.0%) |
| Life, Physical & Social Science | 19 (65.5%) | 10 (34.5%) |
| Community & Social Service | 23 (18.7%) | 100 (81.3%) |
| Education, Arts & Media | 14 (35.0%) | 26 (65.0%) |
| Legal Services & Support | 9 (47.4%) | 10 (52.6%) |
| Education Instruction & Library | 0 (0.0%) | 33 (100.0%) |
| Arts, Media & Entertainment | 0 (0.0%) | 31 (100.0%) |
| Health Diagnosing & Treating | 0 (0.0%) | 202 (100.0%) |
| Health Technologists | 0 (0.0%) | 186 (100.0%) |
| Total (Category) | 276 (32.2%) | 581 (67.8%) |
| Total (Overall) | 999 (53.2%) | 878 (46.8%) |
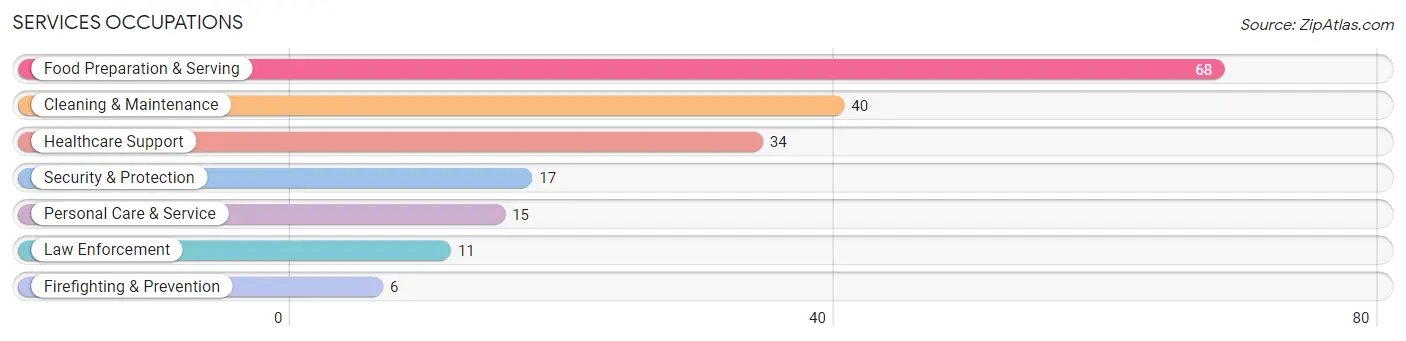
Services Occupations
The most common Services occupations in Lake Lakengren are Food Preparation & Serving (68 | 3.6%), Cleaning & Maintenance (40 | 2.1%), Healthcare Support (34 | 1.8%), Security & Protection (17 | 0.9%), and Personal Care & Service (15 | 0.8%).
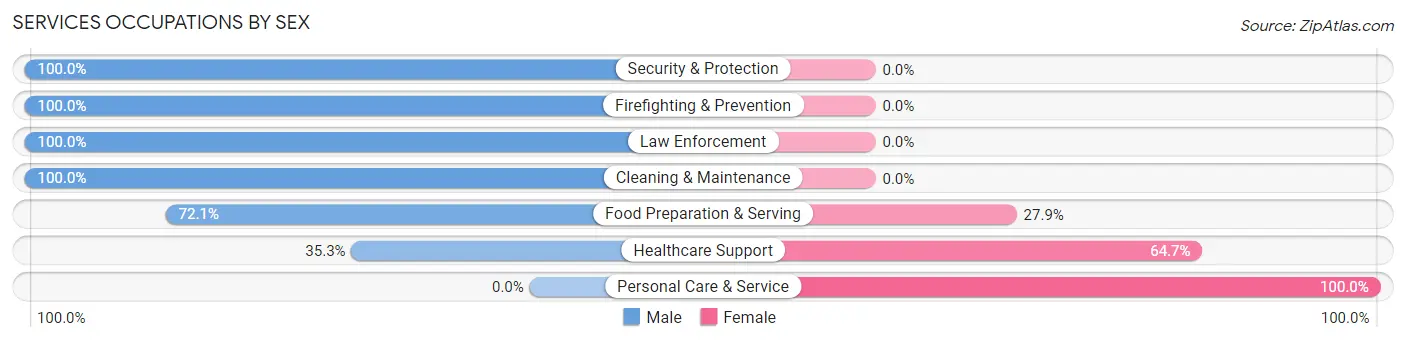
Services Occupations by Sex
Within the Services occupations in Lake Lakengren, the most male-oriented occupations are Security & Protection (100.0%), Firefighting & Prevention (100.0%), and Law Enforcement (100.0%), while the most female-oriented occupations are Personal Care & Service (100.0%), Healthcare Support (64.7%), and Food Preparation & Serving (27.9%).
| Occupation | Male | Female |
| Healthcare Support | 12 (35.3%) | 22 (64.7%) |
| Security & Protection | 17 (100.0%) | 0 (0.0%) |
| Firefighting & Prevention | 6 (100.0%) | 0 (0.0%) |
| Law Enforcement | 11 (100.0%) | 0 (0.0%) |
| Food Preparation & Serving | 49 (72.1%) | 19 (27.9%) |
| Cleaning & Maintenance | 40 (100.0%) | 0 (0.0%) |
| Personal Care & Service | 0 (0.0%) | 15 (100.0%) |
| Total (Category) | 118 (67.8%) | 56 (32.2%) |
| Total (Overall) | 999 (53.2%) | 878 (46.8%) |
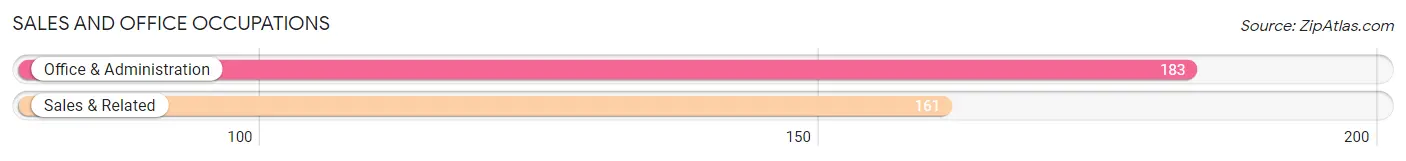
Sales and Office Occupations
The most common Sales and Office occupations in Lake Lakengren are Office & Administration (183 | 9.8%), and Sales & Related (161 | 8.6%).
Sales and Office Occupations by Sex
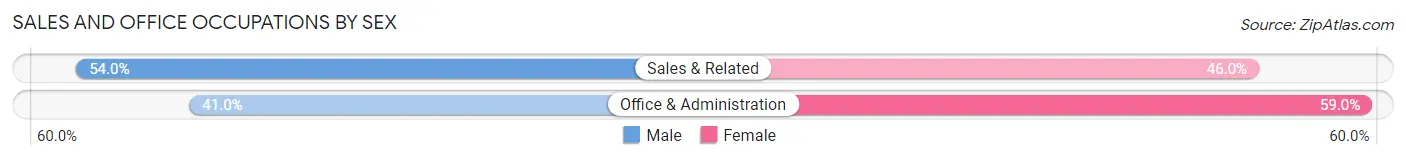
| Occupation | Male | Female |
| Sales & Related | 87 (54.0%) | 74 (46.0%) |
| Office & Administration | 75 (41.0%) | 108 (59.0%) |
| Total (Category) | 162 (47.1%) | 182 (52.9%) |
| Total (Overall) | 999 (53.2%) | 878 (46.8%) |
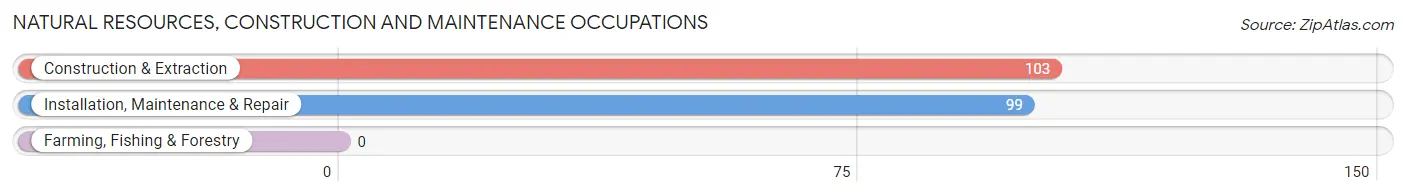
Natural Resources, Construction and Maintenance Occupations
The most common Natural Resources, Construction and Maintenance occupations in Lake Lakengren are Construction & Extraction (103 | 5.5%), and Installation, Maintenance & Repair (99 | 5.3%).
Natural Resources, Construction and Maintenance Occupations by Sex
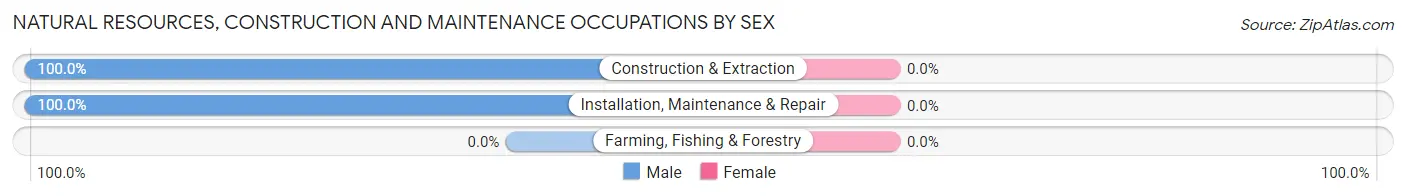
| Occupation | Male | Female |
| Farming, Fishing & Forestry | 0 (0.0%) | 0 (0.0%) |
| Construction & Extraction | 103 (100.0%) | 0 (0.0%) |
| Installation, Maintenance & Repair | 99 (100.0%) | 0 (0.0%) |
| Total (Category) | 202 (100.0%) | 0 (0.0%) |
| Total (Overall) | 999 (53.2%) | 878 (46.8%) |
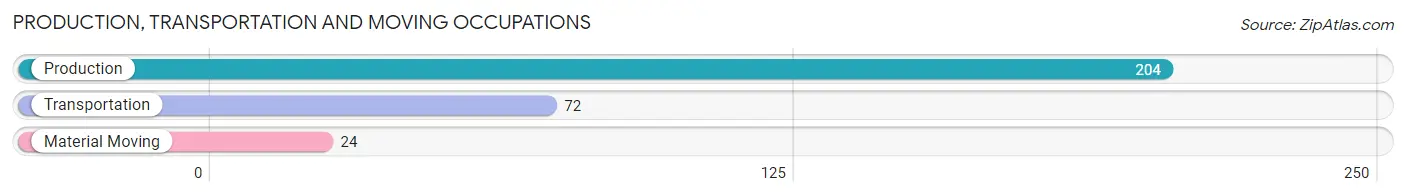
Production, Transportation and Moving Occupations
The most common Production, Transportation and Moving occupations in Lake Lakengren are Production (204 | 10.9%), Transportation (72 | 3.8%), and Material Moving (24 | 1.3%).
Production, Transportation and Moving Occupations by Sex
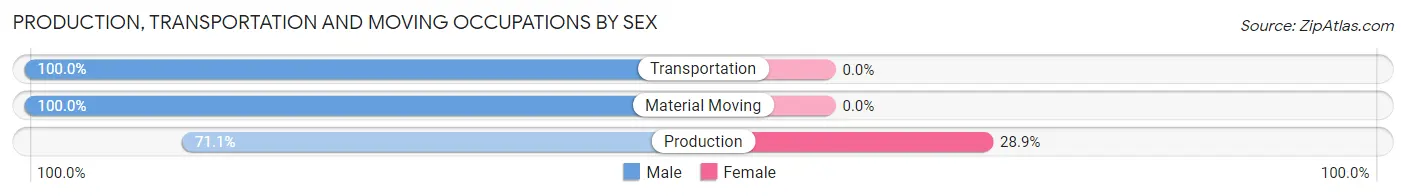
| Occupation | Male | Female |
| Production | 145 (71.1%) | 59 (28.9%) |
| Transportation | 72 (100.0%) | 0 (0.0%) |
| Material Moving | 24 (100.0%) | 0 (0.0%) |
| Total (Category) | 241 (80.3%) | 59 (19.7%) |
| Total (Overall) | 999 (53.2%) | 878 (46.8%) |
Employment Industries by Sex in Lake Lakengren
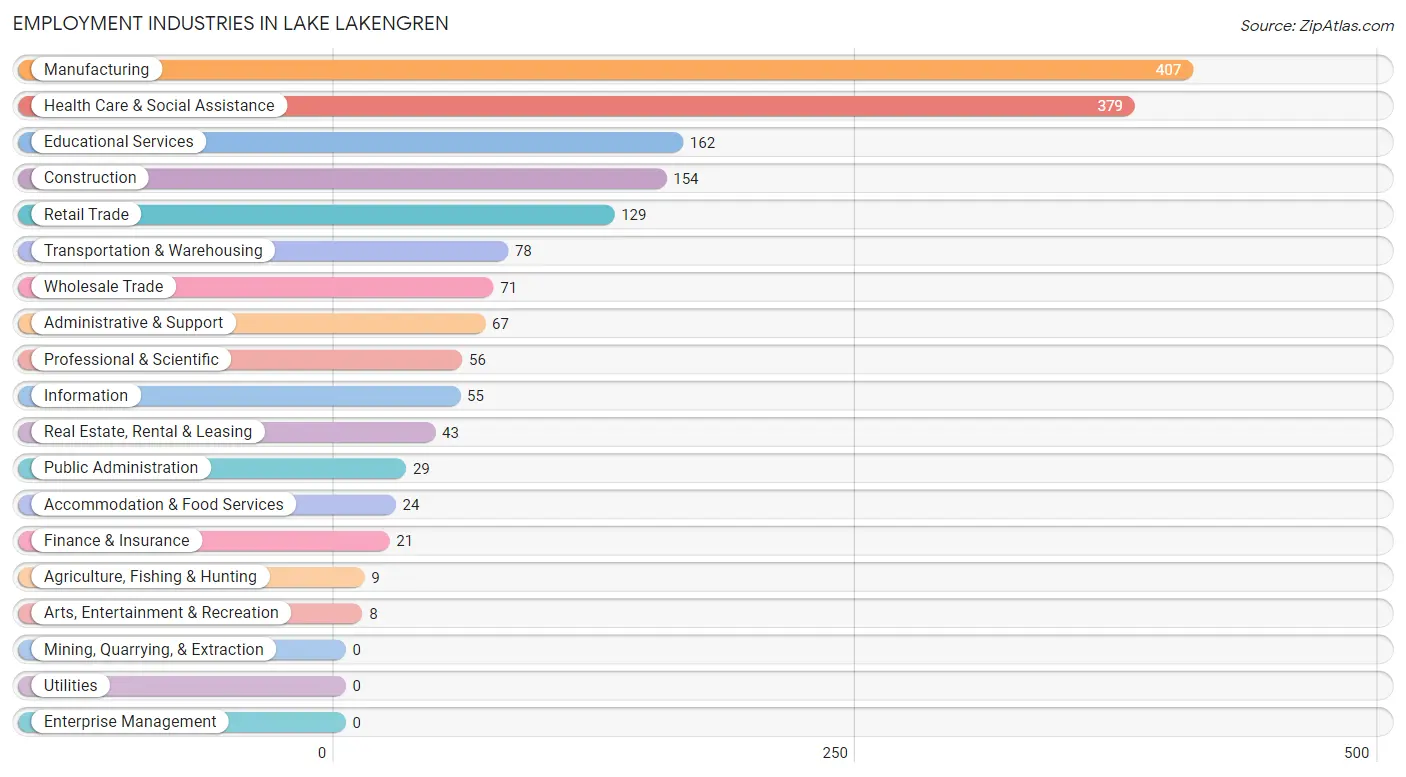
Employment Industries in Lake Lakengren
The major employment industries in Lake Lakengren include Manufacturing (407 | 21.7%), Health Care & Social Assistance (379 | 20.2%), Educational Services (162 | 8.6%), Construction (154 | 8.2%), and Retail Trade (129 | 6.9%).
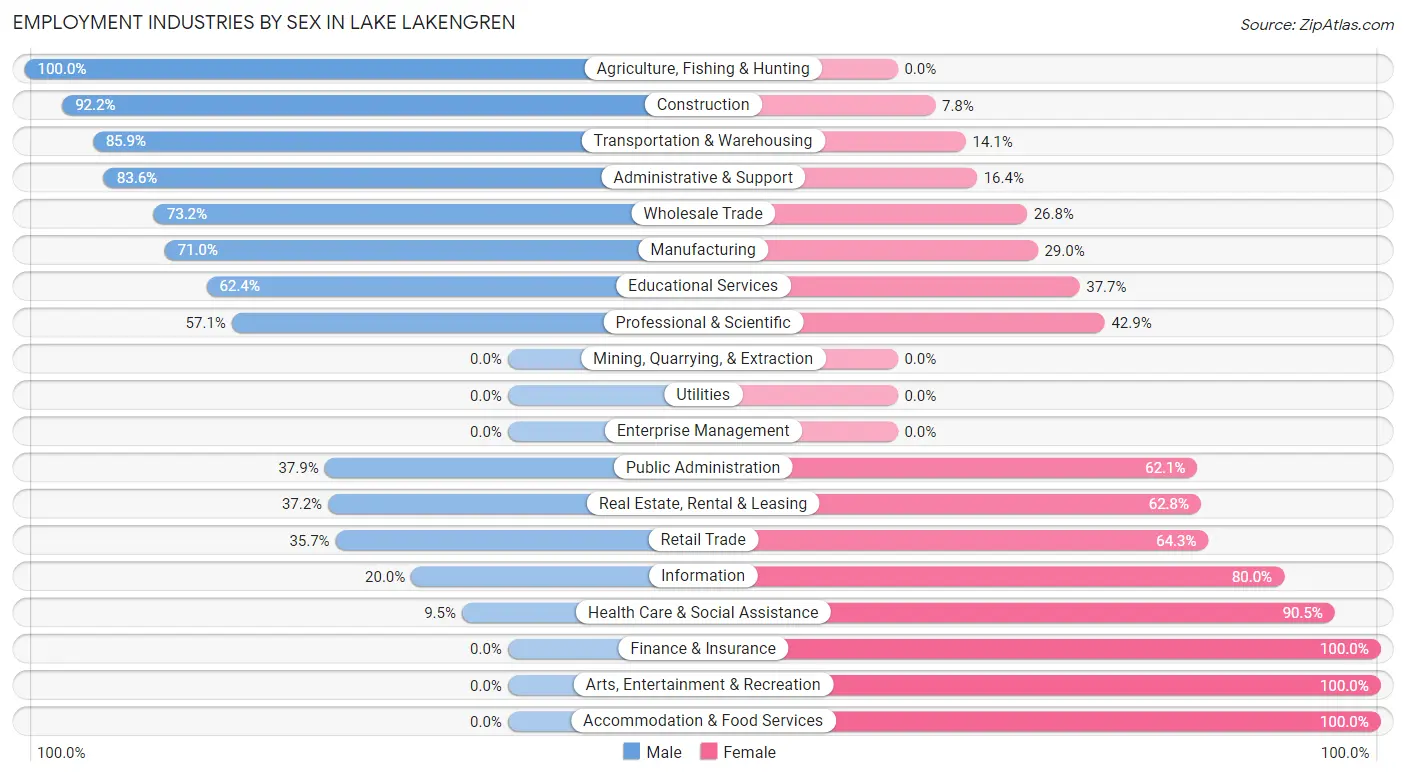
Employment Industries by Sex in Lake Lakengren
The Lake Lakengren industries that see more men than women are Agriculture, Fishing & Hunting (100.0%), Construction (92.2%), and Transportation & Warehousing (85.9%), whereas the industries that tend to have a higher number of women are Finance & Insurance (100.0%), Arts, Entertainment & Recreation (100.0%), and Accommodation & Food Services (100.0%).
| Industry | Male | Female |
| Agriculture, Fishing & Hunting | 9 (100.0%) | 0 (0.0%) |
| Mining, Quarrying, & Extraction | 0 (0.0%) | 0 (0.0%) |
| Construction | 142 (92.2%) | 12 (7.8%) |
| Manufacturing | 289 (71.0%) | 118 (29.0%) |
| Wholesale Trade | 52 (73.2%) | 19 (26.8%) |
| Retail Trade | 46 (35.7%) | 83 (64.3%) |
| Transportation & Warehousing | 67 (85.9%) | 11 (14.1%) |
| Utilities | 0 (0.0%) | 0 (0.0%) |
| Information | 11 (20.0%) | 44 (80.0%) |
| Finance & Insurance | 0 (0.0%) | 21 (100.0%) |
| Real Estate, Rental & Leasing | 16 (37.2%) | 27 (62.8%) |
| Professional & Scientific | 32 (57.1%) | 24 (42.9%) |
| Enterprise Management | 0 (0.0%) | 0 (0.0%) |
| Administrative & Support | 56 (83.6%) | 11 (16.4%) |
| Educational Services | 101 (62.4%) | 61 (37.7%) |
| Health Care & Social Assistance | 36 (9.5%) | 343 (90.5%) |
| Arts, Entertainment & Recreation | 0 (0.0%) | 8 (100.0%) |
| Accommodation & Food Services | 0 (0.0%) | 24 (100.0%) |
| Public Administration | 11 (37.9%) | 18 (62.1%) |
| Total | 999 (53.2%) | 878 (46.8%) |
Education in Lake Lakengren
School Enrollment in Lake Lakengren
The most common levels of schooling among the 744 students in Lake Lakengren are elementary school (337 | 45.3%), high school (125 | 16.8%), and middle school (113 | 15.2%).
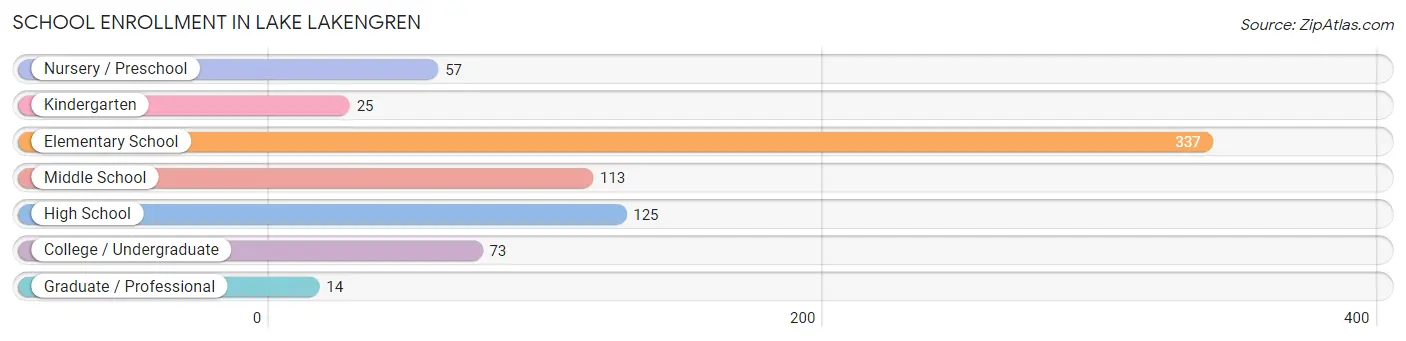
| School Level | # Students | % Students |
| Nursery / Preschool | 57 | 7.7% |
| Kindergarten | 25 | 3.4% |
| Elementary School | 337 | 45.3% |
| Middle School | 113 | 15.2% |
| High School | 125 | 16.8% |
| College / Undergraduate | 73 | 9.8% |
| Graduate / Professional | 14 | 1.9% |
| Total | 744 | 100.0% |
School Enrollment by Age by Funding Source in Lake Lakengren
Out of a total of 744 students who are enrolled in schools in Lake Lakengren, 47 (6.3%) attend a private institution, while the remaining 697 (93.7%) are enrolled in public schools. The age group of 25 to 34 year olds has the highest likelihood of being enrolled in private schools, with 14 (100.0% in the age bracket) enrolled. Conversely, the age group of 3 to 4 year olds has the lowest likelihood of being enrolled in a private school, with 57 (100.0% in the age bracket) attending a public institution.
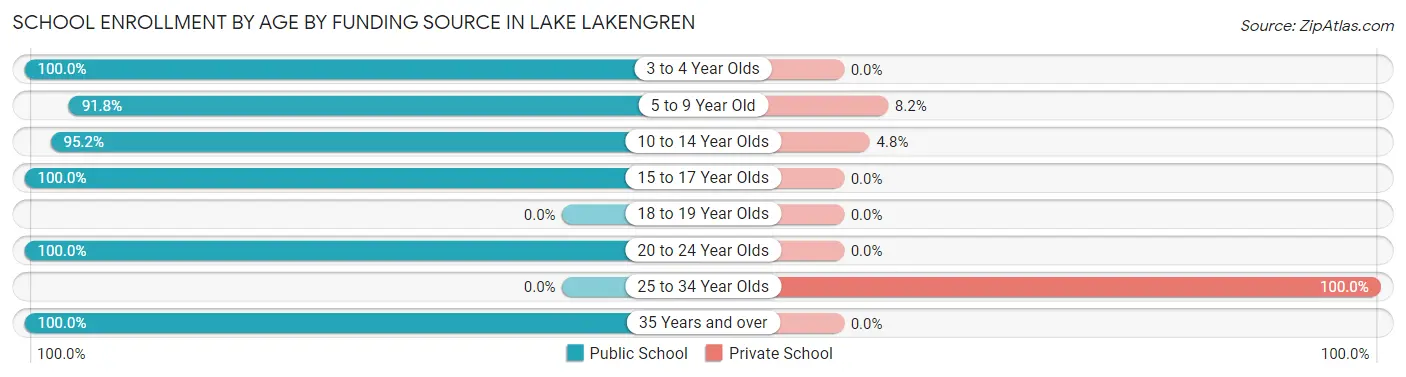
| Age Bracket | Public School | Private School |
| 3 to 4 Year Olds | 57 (100.0%) | 0 (0.0%) |
| 5 to 9 Year Old | 234 (91.8%) | 21 (8.2%) |
| 10 to 14 Year Olds | 236 (95.2%) | 12 (4.8%) |
| 15 to 17 Year Olds | 97 (100.0%) | 0 (0.0%) |
| 18 to 19 Year Olds | 0 (0.0%) | 0 (0.0%) |
| 20 to 24 Year Olds | 65 (100.0%) | 0 (0.0%) |
| 25 to 34 Year Olds | 0 (0.0%) | 14 (100.0%) |
| 35 Years and over | 8 (100.0%) | 0 (0.0%) |
| Total | 697 (93.7%) | 47 (6.3%) |
Educational Attainment by Field of Study in Lake Lakengren
Business (216 | 30.7%), science & technology (180 | 25.6%), education (105 | 14.9%), computers & mathematics (51 | 7.2%), and engineering (44 | 6.3%) are the most common fields of study among 703 individuals in Lake Lakengren who have obtained a bachelor's degree or higher.
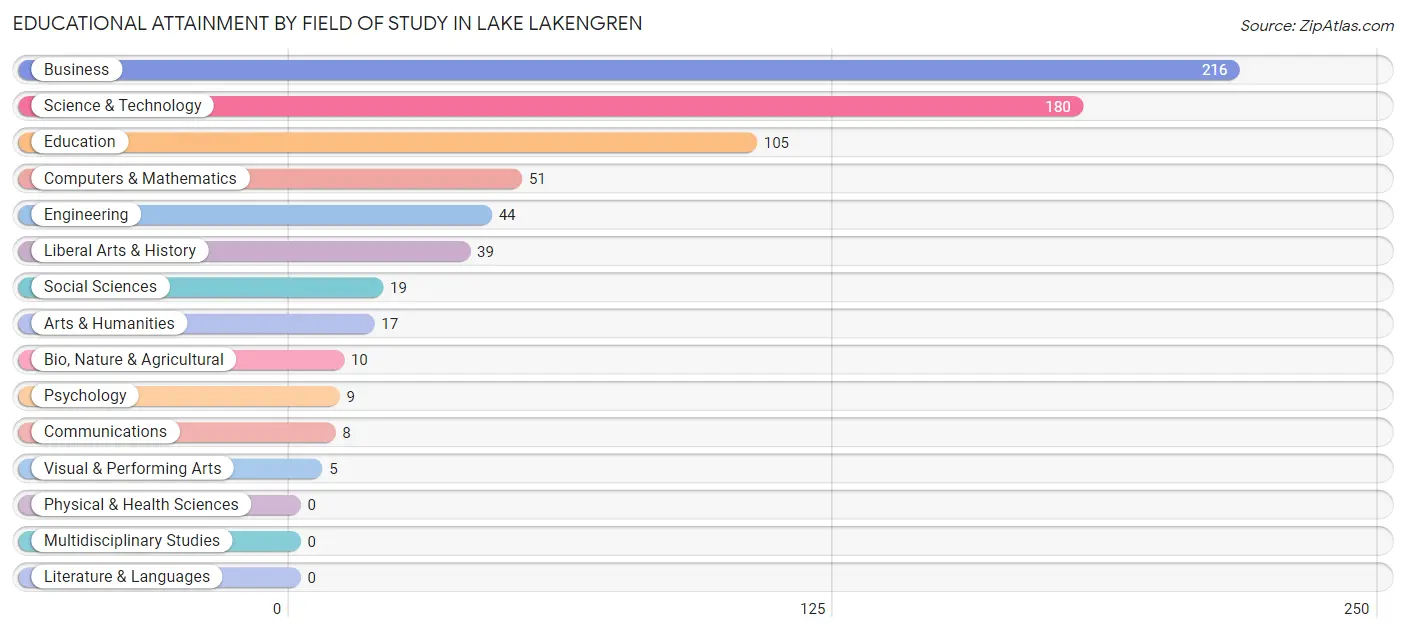
| Field of Study | # Graduates | % Graduates |
| Computers & Mathematics | 51 | 7.2% |
| Bio, Nature & Agricultural | 10 | 1.4% |
| Physical & Health Sciences | 0 | 0.0% |
| Psychology | 9 | 1.3% |
| Social Sciences | 19 | 2.7% |
| Engineering | 44 | 6.3% |
| Multidisciplinary Studies | 0 | 0.0% |
| Science & Technology | 180 | 25.6% |
| Business | 216 | 30.7% |
| Education | 105 | 14.9% |
| Literature & Languages | 0 | 0.0% |
| Liberal Arts & History | 39 | 5.6% |
| Visual & Performing Arts | 5 | 0.7% |
| Communications | 8 | 1.1% |
| Arts & Humanities | 17 | 2.4% |
| Total | 703 | 100.0% |
Transportation & Commute in Lake Lakengren
Vehicle Availability by Sex in Lake Lakengren
The most prevalent vehicle ownership categories in Lake Lakengren are males with 3 vehicles (358, accounting for 37.3%) and females with 3 vehicles (205, making up 41.2%).
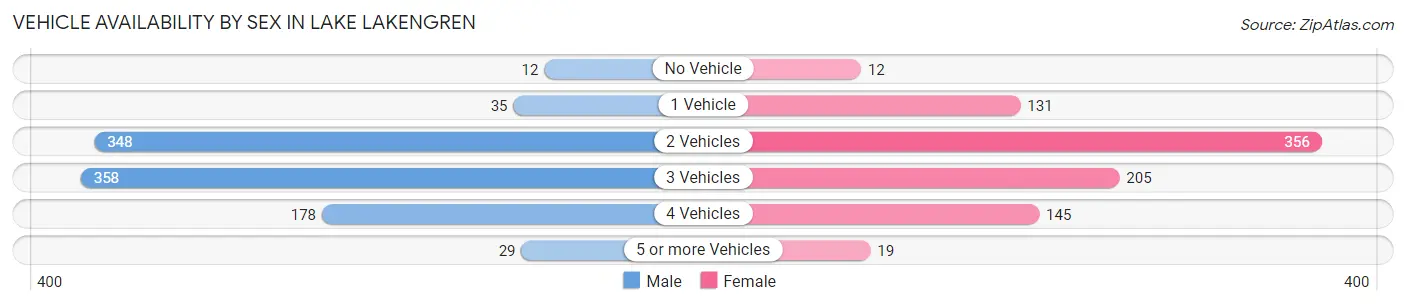
| Vehicles Available | Male | Female |
| No Vehicle | 12 (1.3%) | 12 (1.4%) |
| 1 Vehicle | 35 (3.6%) | 131 (15.1%) |
| 2 Vehicles | 348 (36.2%) | 356 (41.0%) |
| 3 Vehicles | 358 (37.3%) | 205 (23.6%) |
| 4 Vehicles | 178 (18.5%) | 145 (16.7%) |
| 5 or more Vehicles | 29 (3.0%) | 19 (2.2%) |
| Total | 960 (100.0%) | 868 (100.0%) |
Commute Time in Lake Lakengren
The most frequently occuring commute durations in Lake Lakengren are 10 to 14 minutes (331 commuters, 19.4%), 15 to 19 minutes (310 commuters, 18.1%), and 45 to 59 minutes (282 commuters, 16.5%).
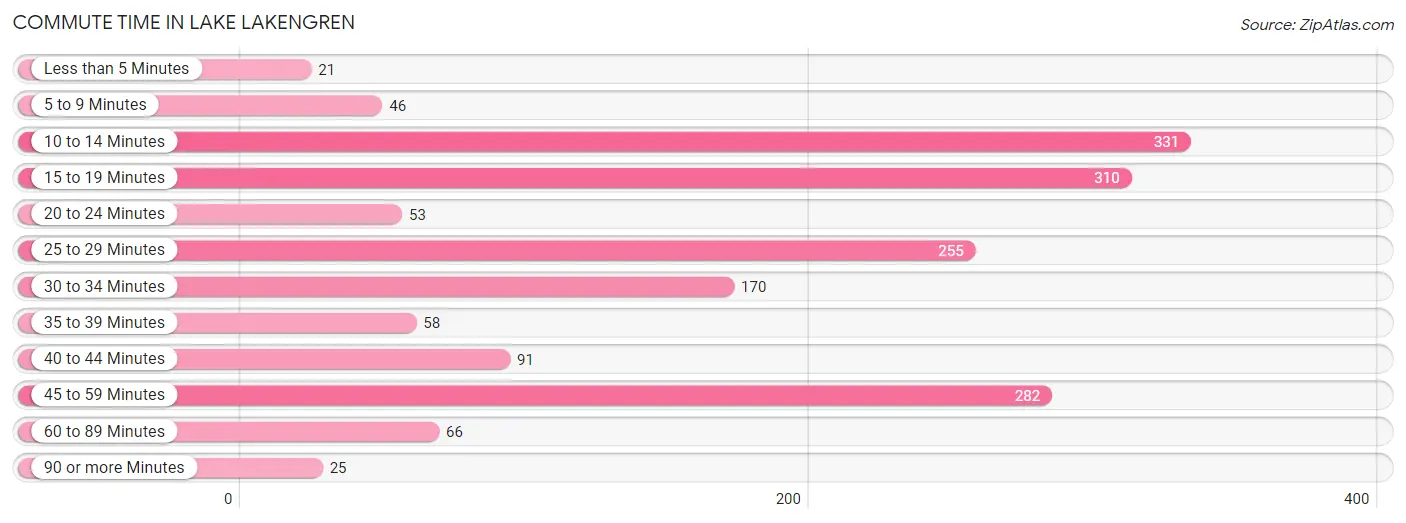
| Commute Time | # Commuters | % Commuters |
| Less than 5 Minutes | 21 | 1.2% |
| 5 to 9 Minutes | 46 | 2.7% |
| 10 to 14 Minutes | 331 | 19.4% |
| 15 to 19 Minutes | 310 | 18.1% |
| 20 to 24 Minutes | 53 | 3.1% |
| 25 to 29 Minutes | 255 | 14.9% |
| 30 to 34 Minutes | 170 | 10.0% |
| 35 to 39 Minutes | 58 | 3.4% |
| 40 to 44 Minutes | 91 | 5.3% |
| 45 to 59 Minutes | 282 | 16.5% |
| 60 to 89 Minutes | 66 | 3.9% |
| 90 or more Minutes | 25 | 1.5% |
Commute Time by Sex in Lake Lakengren
The most common commute times in Lake Lakengren are 25 to 29 minutes (189 commuters, 20.7%) for males and 10 to 14 minutes (208 commuters, 26.2%) for females.
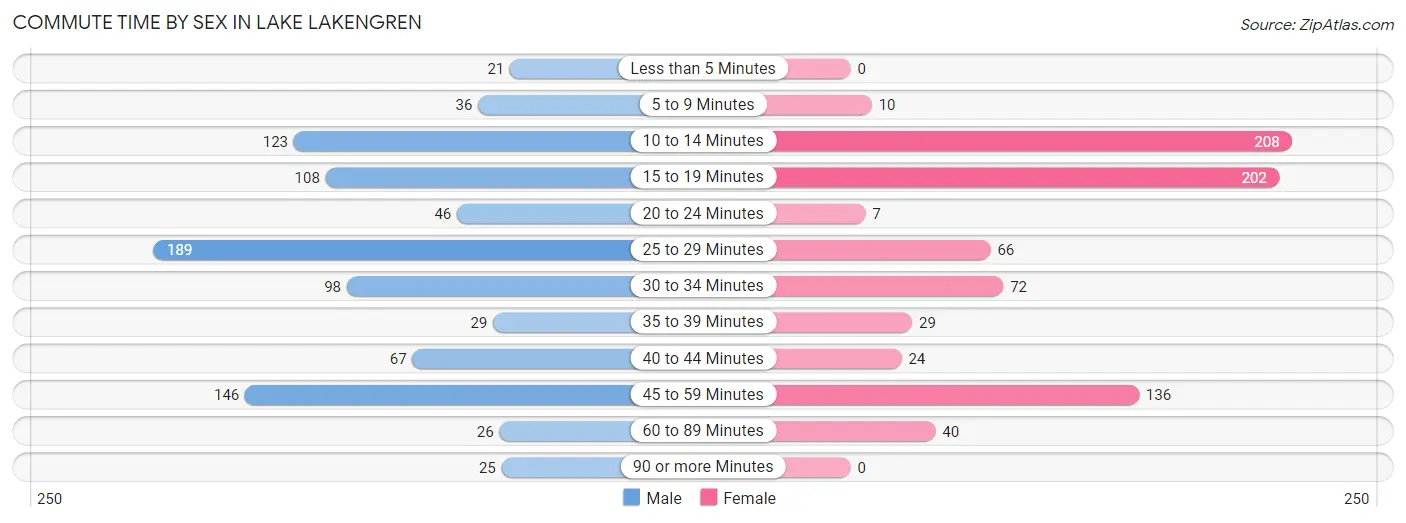
| Commute Time | Male | Female |
| Less than 5 Minutes | 21 (2.3%) | 0 (0.0%) |
| 5 to 9 Minutes | 36 (3.9%) | 10 (1.3%) |
| 10 to 14 Minutes | 123 (13.5%) | 208 (26.2%) |
| 15 to 19 Minutes | 108 (11.8%) | 202 (25.4%) |
| 20 to 24 Minutes | 46 (5.0%) | 7 (0.9%) |
| 25 to 29 Minutes | 189 (20.7%) | 66 (8.3%) |
| 30 to 34 Minutes | 98 (10.7%) | 72 (9.1%) |
| 35 to 39 Minutes | 29 (3.2%) | 29 (3.6%) |
| 40 to 44 Minutes | 67 (7.3%) | 24 (3.0%) |
| 45 to 59 Minutes | 146 (16.0%) | 136 (17.1%) |
| 60 to 89 Minutes | 26 (2.8%) | 40 (5.0%) |
| 90 or more Minutes | 25 (2.7%) | 0 (0.0%) |
Time of Departure to Work by Sex in Lake Lakengren
The most frequent times of departure to work in Lake Lakengren are 7:00 AM to 7:29 AM (187, 20.5%) for males and 7:00 AM to 7:29 AM (255, 32.1%) for females.
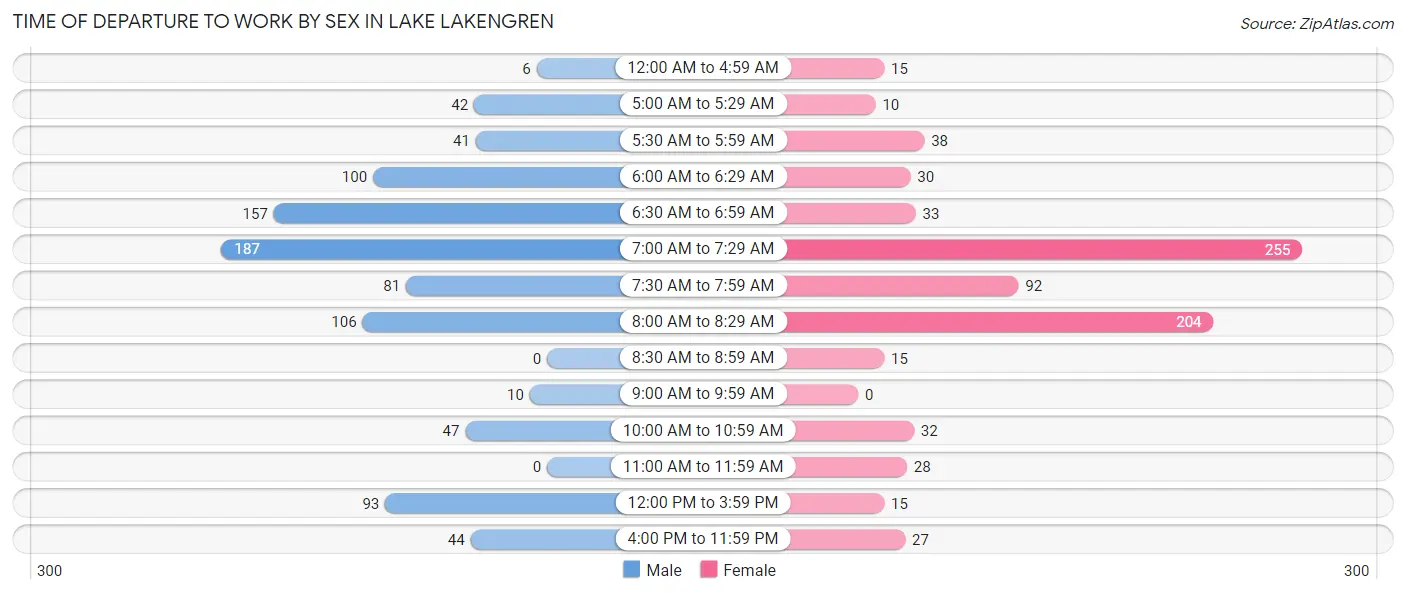
| Time of Departure | Male | Female |
| 12:00 AM to 4:59 AM | 6 (0.7%) | 15 (1.9%) |
| 5:00 AM to 5:29 AM | 42 (4.6%) | 10 (1.3%) |
| 5:30 AM to 5:59 AM | 41 (4.5%) | 38 (4.8%) |
| 6:00 AM to 6:29 AM | 100 (10.9%) | 30 (3.8%) |
| 6:30 AM to 6:59 AM | 157 (17.2%) | 33 (4.2%) |
| 7:00 AM to 7:29 AM | 187 (20.5%) | 255 (32.1%) |
| 7:30 AM to 7:59 AM | 81 (8.9%) | 92 (11.6%) |
| 8:00 AM to 8:29 AM | 106 (11.6%) | 204 (25.7%) |
| 8:30 AM to 8:59 AM | 0 (0.0%) | 15 (1.9%) |
| 9:00 AM to 9:59 AM | 10 (1.1%) | 0 (0.0%) |
| 10:00 AM to 10:59 AM | 47 (5.1%) | 32 (4.0%) |
| 11:00 AM to 11:59 AM | 0 (0.0%) | 28 (3.5%) |
| 12:00 PM to 3:59 PM | 93 (10.2%) | 15 (1.9%) |
| 4:00 PM to 11:59 PM | 44 (4.8%) | 27 (3.4%) |
| Total | 914 (100.0%) | 794 (100.0%) |
Housing Occupancy in Lake Lakengren
Occupancy by Ownership in Lake Lakengren
Of the total 1,409 dwellings in Lake Lakengren, owner-occupied units account for 1,324 (94.0%), while renter-occupied units make up 85 (6.0%).
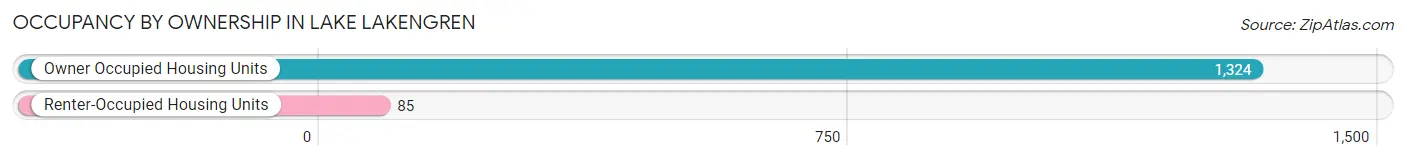
| Occupancy | # Housing Units | % Housing Units |
| Owner Occupied Housing Units | 1,324 | 94.0% |
| Renter-Occupied Housing Units | 85 | 6.0% |
| Total Occupied Housing Units | 1,409 | 100.0% |
Occupancy by Household Size in Lake Lakengren
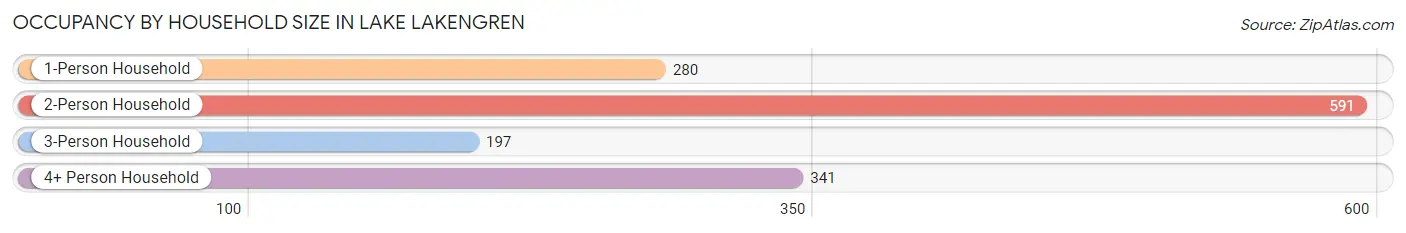
| Household Size | # Housing Units | % Housing Units |
| 1-Person Household | 280 | 19.9% |
| 2-Person Household | 591 | 41.9% |
| 3-Person Household | 197 | 14.0% |
| 4+ Person Household | 341 | 24.2% |
| Total Housing Units | 1,409 | 100.0% |
Occupancy by Ownership by Household Size in Lake Lakengren
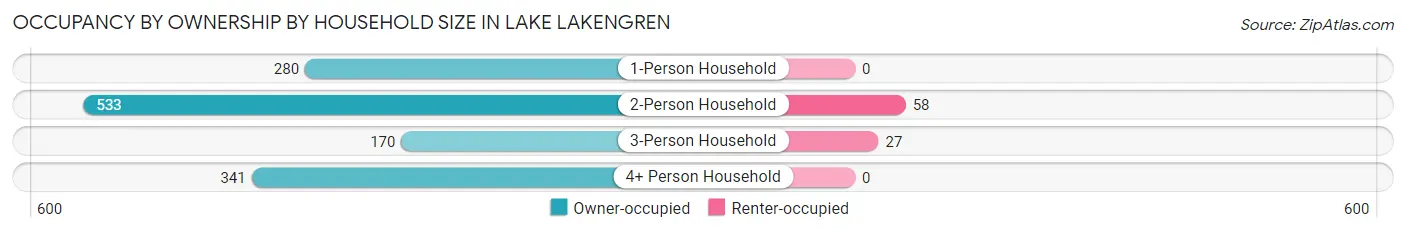
| Household Size | Owner-occupied | Renter-occupied |
| 1-Person Household | 280 (100.0%) | 0 (0.0%) |
| 2-Person Household | 533 (90.2%) | 58 (9.8%) |
| 3-Person Household | 170 (86.3%) | 27 (13.7%) |
| 4+ Person Household | 341 (100.0%) | 0 (0.0%) |
| Total Housing Units | 1,324 (94.0%) | 85 (6.0%) |
Occupancy by Educational Attainment in Lake Lakengren
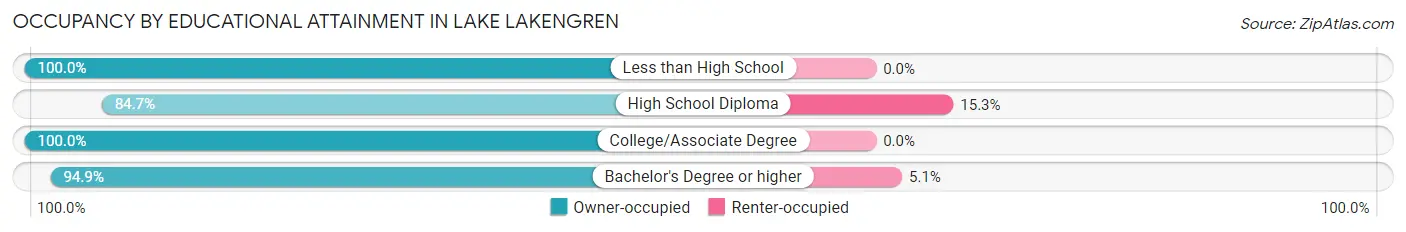
| Household Size | Owner-occupied | Renter-occupied |
| Less than High School | 100 (100.0%) | 0 (0.0%) |
| High School Diploma | 382 (84.7%) | 69 (15.3%) |
| College/Associate Degree | 547 (100.0%) | 0 (0.0%) |
| Bachelor's Degree or higher | 295 (94.9%) | 16 (5.1%) |
Occupancy by Age of Householder in Lake Lakengren
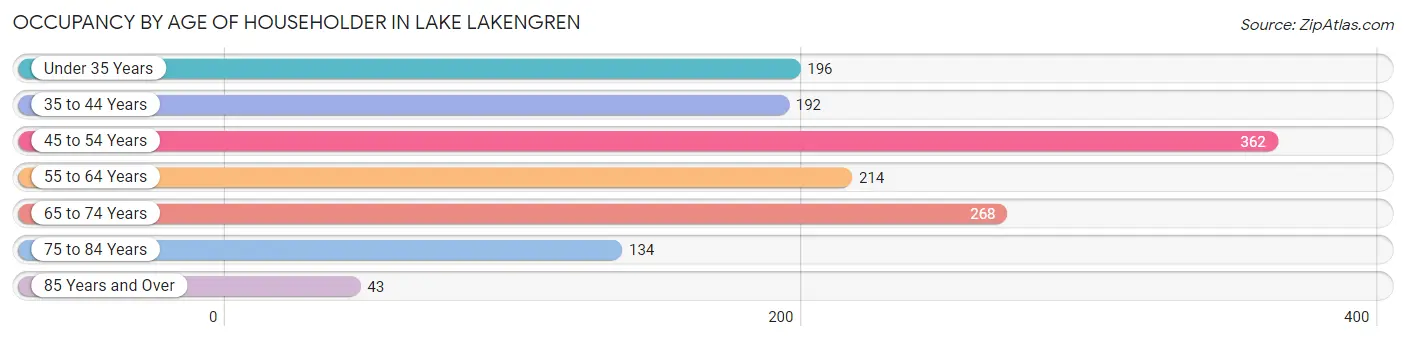
| Age Bracket | # Households | % Households |
| Under 35 Years | 196 | 13.9% |
| 35 to 44 Years | 192 | 13.6% |
| 45 to 54 Years | 362 | 25.7% |
| 55 to 64 Years | 214 | 15.2% |
| 65 to 74 Years | 268 | 19.0% |
| 75 to 84 Years | 134 | 9.5% |
| 85 Years and Over | 43 | 3.0% |
| Total | 1,409 | 100.0% |
Housing Finances in Lake Lakengren
Median Income by Occupancy in Lake Lakengren
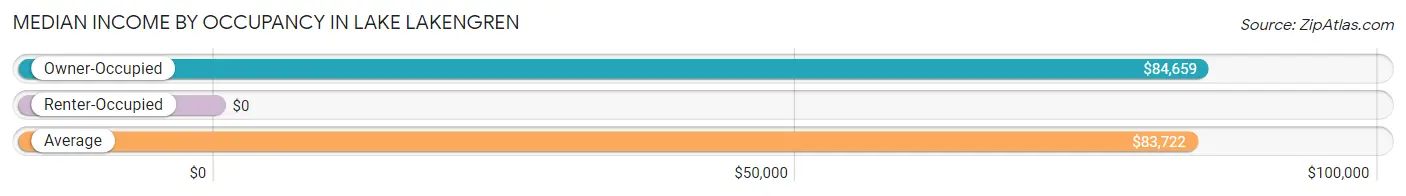
| Occupancy Type | # Households | Median Income |
| Owner-Occupied | 1,324 (94.0%) | $84,659 |
| Renter-Occupied | 85 (6.0%) | $0 |
| Average | 1,409 (100.0%) | $83,722 |
Occupancy by Householder Income Bracket in Lake Lakengren
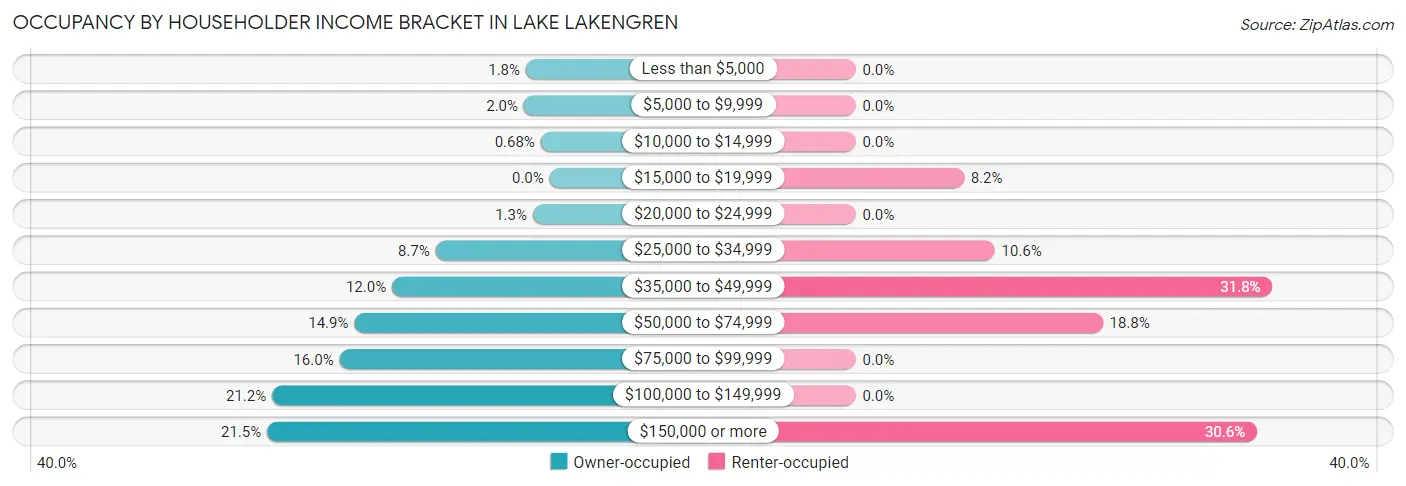
| Income Bracket | Owner-occupied | Renter-occupied |
| Less than $5,000 | 24 (1.8%) | 0 (0.0%) |
| $5,000 to $9,999 | 26 (2.0%) | 0 (0.0%) |
| $10,000 to $14,999 | 9 (0.7%) | 0 (0.0%) |
| $15,000 to $19,999 | 0 (0.0%) | 7 (8.2%) |
| $20,000 to $24,999 | 17 (1.3%) | 0 (0.0%) |
| $25,000 to $34,999 | 115 (8.7%) | 9 (10.6%) |
| $35,000 to $49,999 | 159 (12.0%) | 27 (31.8%) |
| $50,000 to $74,999 | 197 (14.9%) | 16 (18.8%) |
| $75,000 to $99,999 | 212 (16.0%) | 0 (0.0%) |
| $100,000 to $149,999 | 280 (21.1%) | 0 (0.0%) |
| $150,000 or more | 285 (21.5%) | 26 (30.6%) |
| Total | 1,324 (100.0%) | 85 (100.0%) |
Monthly Housing Cost Tiers in Lake Lakengren
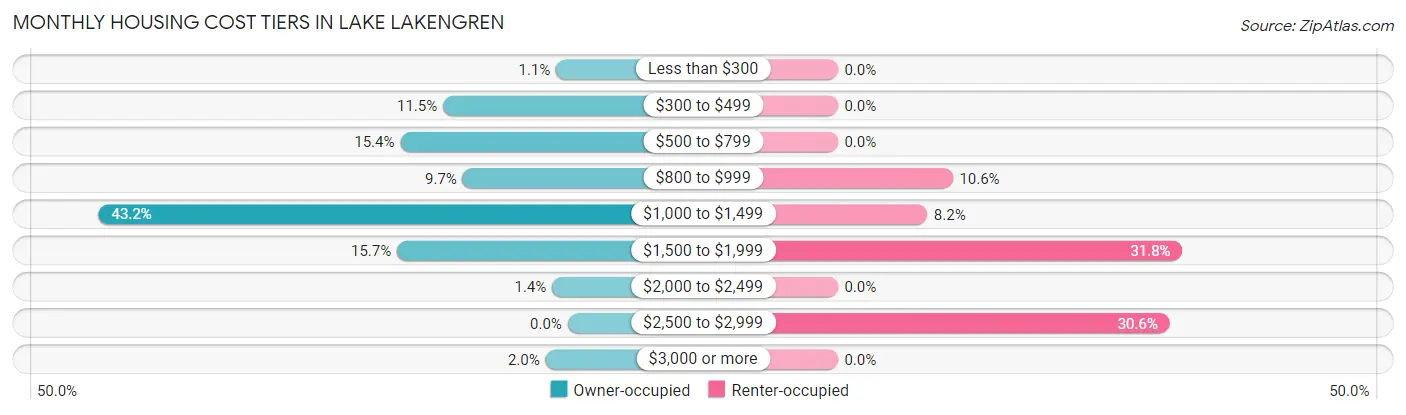
| Monthly Cost | Owner-occupied | Renter-occupied |
| Less than $300 | 14 (1.1%) | 0 (0.0%) |
| $300 to $499 | 152 (11.5%) | 0 (0.0%) |
| $500 to $799 | 204 (15.4%) | 0 (0.0%) |
| $800 to $999 | 128 (9.7%) | 9 (10.6%) |
| $1,000 to $1,499 | 572 (43.2%) | 7 (8.2%) |
| $1,500 to $1,999 | 208 (15.7%) | 27 (31.8%) |
| $2,000 to $2,499 | 19 (1.4%) | 0 (0.0%) |
| $2,500 to $2,999 | 0 (0.0%) | 26 (30.6%) |
| $3,000 or more | 27 (2.0%) | 0 (0.0%) |
| Total | 1,324 (100.0%) | 85 (100.0%) |
Physical Housing Characteristics in Lake Lakengren
Housing Structures in Lake Lakengren
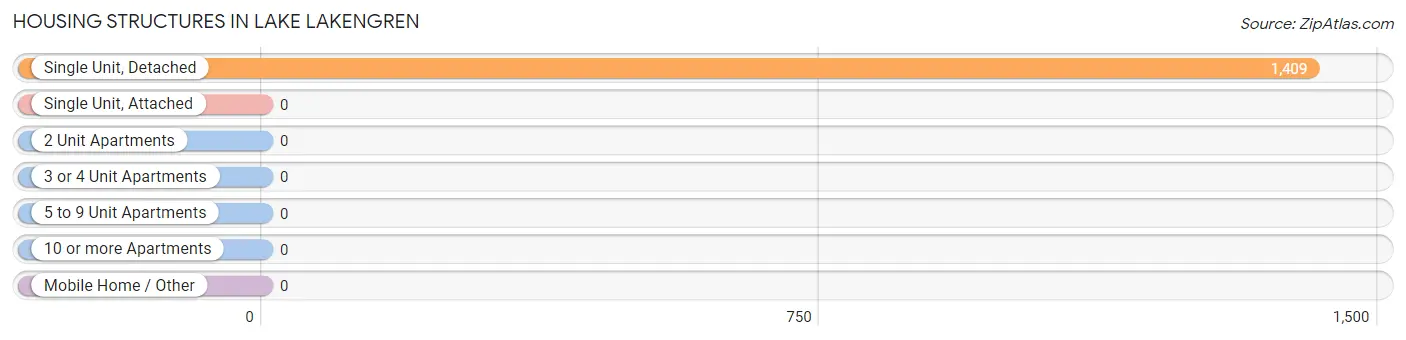
| Structure Type | # Housing Units | % Housing Units |
| Single Unit, Detached | 1,409 | 100.0% |
| Single Unit, Attached | 0 | 0.0% |
| 2 Unit Apartments | 0 | 0.0% |
| 3 or 4 Unit Apartments | 0 | 0.0% |
| 5 to 9 Unit Apartments | 0 | 0.0% |
| 10 or more Apartments | 0 | 0.0% |
| Mobile Home / Other | 0 | 0.0% |
| Total | 1,409 | 100.0% |
Housing Structures by Occupancy in Lake Lakengren
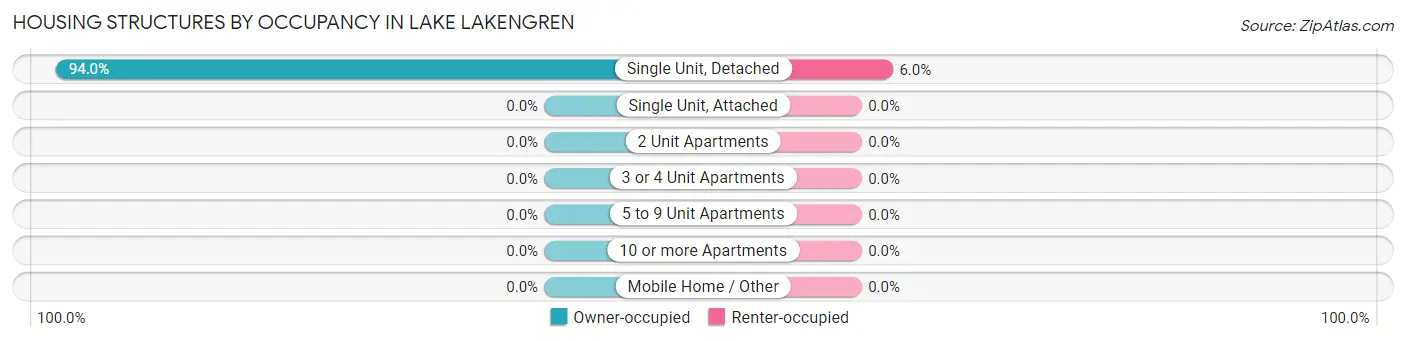
| Structure Type | Owner-occupied | Renter-occupied |
| Single Unit, Detached | 1,324 (94.0%) | 85 (6.0%) |
| Single Unit, Attached | 0 (0.0%) | 0 (0.0%) |
| 2 Unit Apartments | 0 (0.0%) | 0 (0.0%) |
| 3 or 4 Unit Apartments | 0 (0.0%) | 0 (0.0%) |
| 5 to 9 Unit Apartments | 0 (0.0%) | 0 (0.0%) |
| 10 or more Apartments | 0 (0.0%) | 0 (0.0%) |
| Mobile Home / Other | 0 (0.0%) | 0 (0.0%) |
| Total | 1,324 (94.0%) | 85 (6.0%) |
Housing Structures by Number of Rooms in Lake Lakengren
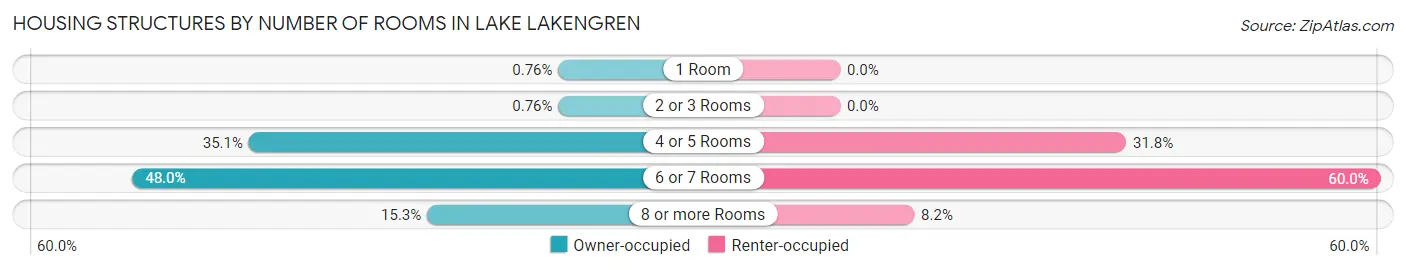
| Number of Rooms | Owner-occupied | Renter-occupied |
| 1 Room | 10 (0.8%) | 0 (0.0%) |
| 2 or 3 Rooms | 10 (0.8%) | 0 (0.0%) |
| 4 or 5 Rooms | 465 (35.1%) | 27 (31.8%) |
| 6 or 7 Rooms | 636 (48.0%) | 51 (60.0%) |
| 8 or more Rooms | 203 (15.3%) | 7 (8.2%) |
| Total | 1,324 (100.0%) | 85 (100.0%) |
Housing Structure by Heating Type in Lake Lakengren
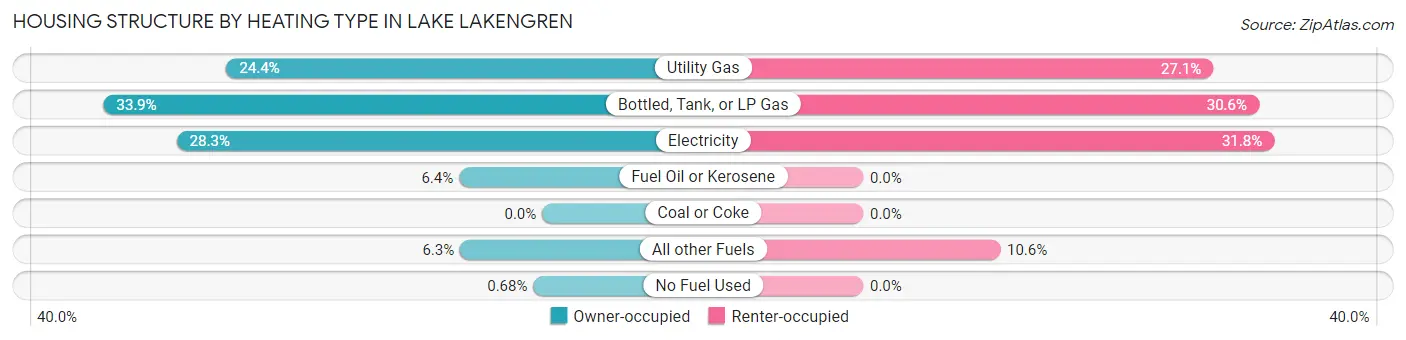
| Heating Type | Owner-occupied | Renter-occupied |
| Utility Gas | 323 (24.4%) | 23 (27.1%) |
| Bottled, Tank, or LP Gas | 449 (33.9%) | 26 (30.6%) |
| Electricity | 374 (28.2%) | 27 (31.8%) |
| Fuel Oil or Kerosene | 85 (6.4%) | 0 (0.0%) |
| Coal or Coke | 0 (0.0%) | 0 (0.0%) |
| All other Fuels | 84 (6.3%) | 9 (10.6%) |
| No Fuel Used | 9 (0.7%) | 0 (0.0%) |
| Total | 1,324 (100.0%) | 85 (100.0%) |
Household Vehicle Usage in Lake Lakengren
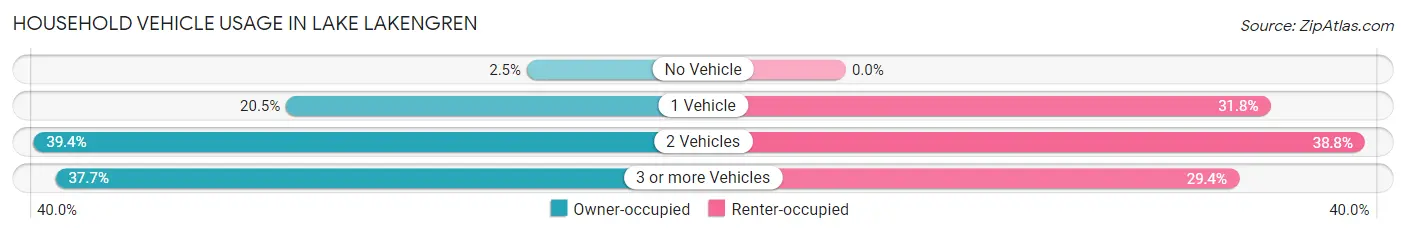
| Vehicles per Household | Owner-occupied | Renter-occupied |
| No Vehicle | 33 (2.5%) | 0 (0.0%) |
| 1 Vehicle | 271 (20.5%) | 27 (31.8%) |
| 2 Vehicles | 521 (39.4%) | 33 (38.8%) |
| 3 or more Vehicles | 499 (37.7%) | 25 (29.4%) |
| Total | 1,324 (100.0%) | 85 (100.0%) |
Real Estate & Mortgages in Lake Lakengren
Real Estate and Mortgage Overview in Lake Lakengren
| Characteristic | Without Mortgage | With Mortgage |
| Housing Units | 308 | 1,016 |
| Median Property Value | $163,300 | $168,800 |
| Median Household Income | $68,500 | $235 |
| Monthly Housing Costs | $486 | $27 |
| Real Estate Taxes | $1,980 | $20 |
Property Value by Mortgage Status in Lake Lakengren
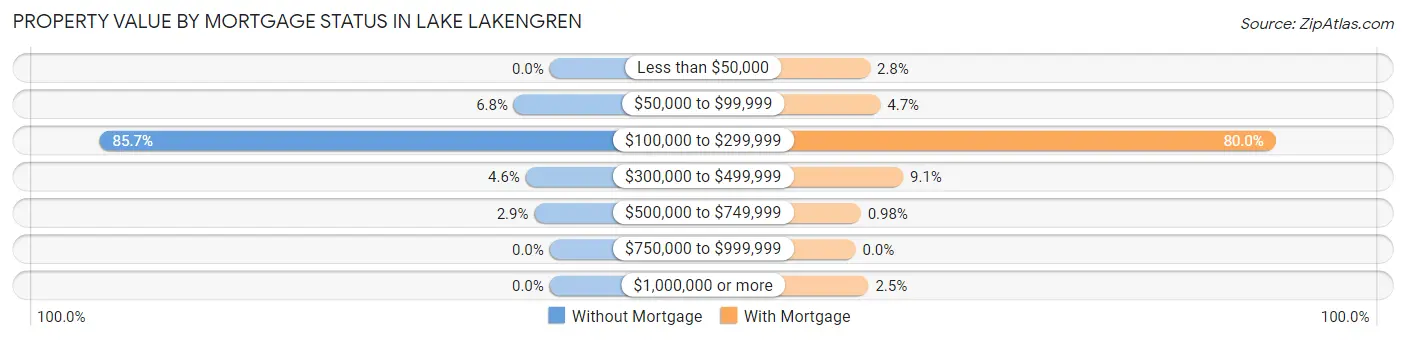
| Property Value | Without Mortgage | With Mortgage |
| Less than $50,000 | 0 (0.0%) | 28 (2.8%) |
| $50,000 to $99,999 | 21 (6.8%) | 48 (4.7%) |
| $100,000 to $299,999 | 264 (85.7%) | 813 (80.0%) |
| $300,000 to $499,999 | 14 (4.5%) | 92 (9.1%) |
| $500,000 to $749,999 | 9 (2.9%) | 10 (1.0%) |
| $750,000 to $999,999 | 0 (0.0%) | 0 (0.0%) |
| $1,000,000 or more | 0 (0.0%) | 25 (2.5%) |
| Total | 308 (100.0%) | 1,016 (100.0%) |
Household Income by Mortgage Status in Lake Lakengren
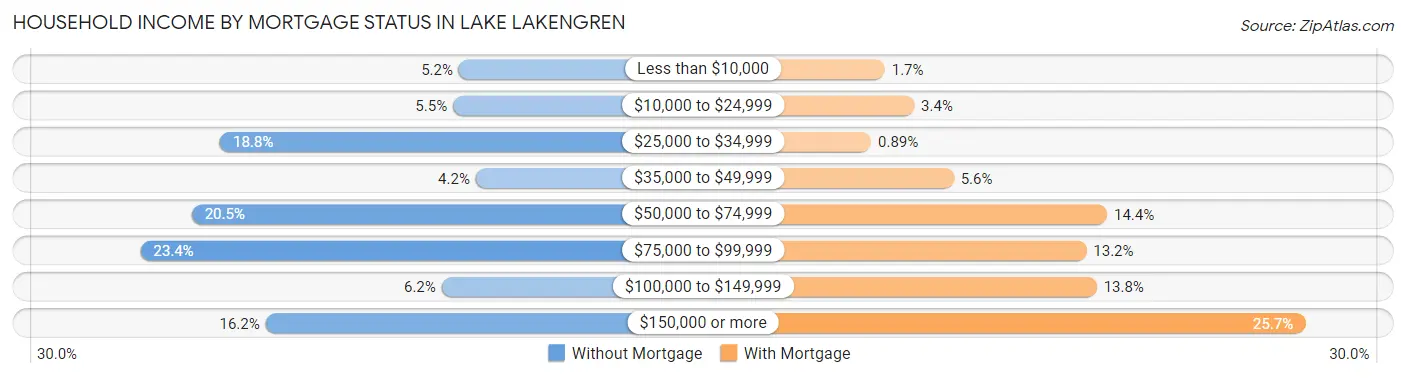
| Household Income | Without Mortgage | With Mortgage |
| Less than $10,000 | 16 (5.2%) | 17 (1.7%) |
| $10,000 to $24,999 | 17 (5.5%) | 34 (3.4%) |
| $25,000 to $34,999 | 58 (18.8%) | 9 (0.9%) |
| $35,000 to $49,999 | 13 (4.2%) | 57 (5.6%) |
| $50,000 to $74,999 | 63 (20.4%) | 146 (14.4%) |
| $75,000 to $99,999 | 72 (23.4%) | 134 (13.2%) |
| $100,000 to $149,999 | 19 (6.2%) | 140 (13.8%) |
| $150,000 or more | 50 (16.2%) | 261 (25.7%) |
| Total | 308 (100.0%) | 1,016 (100.0%) |
Property Value to Household Income Ratio in Lake Lakengren
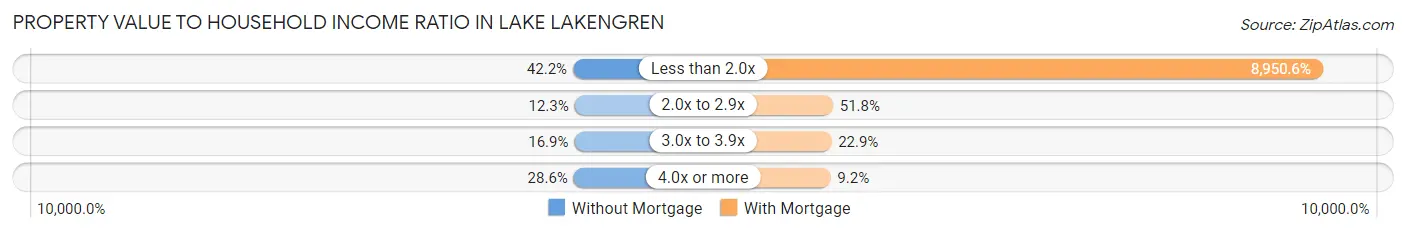
| Value-to-Income Ratio | Without Mortgage | With Mortgage |
| Less than 2.0x | 130 (42.2%) | 90,938 (8,950.6%) |
| 2.0x to 2.9x | 38 (12.3%) | 526 (51.8%) |
| 3.0x to 3.9x | 52 (16.9%) | 233 (22.9%) |
| 4.0x or more | 88 (28.6%) | 93 (9.1%) |
| Total | 308 (100.0%) | 1,016 (100.0%) |
Real Estate Taxes by Mortgage Status in Lake Lakengren
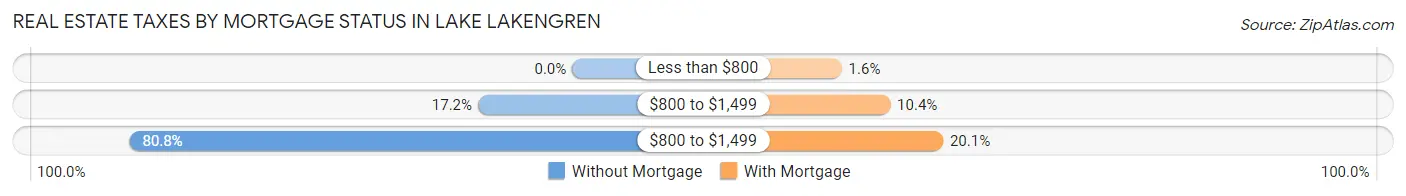
| Property Taxes | Without Mortgage | With Mortgage |
| Less than $800 | 0 (0.0%) | 16 (1.6%) |
| $800 to $1,499 | 53 (17.2%) | 106 (10.4%) |
| $800 to $1,499 | 249 (80.8%) | 204 (20.1%) |
| Total | 308 (100.0%) | 1,016 (100.0%) |
Health & Disability in Lake Lakengren
Health Insurance Coverage by Age in Lake Lakengren
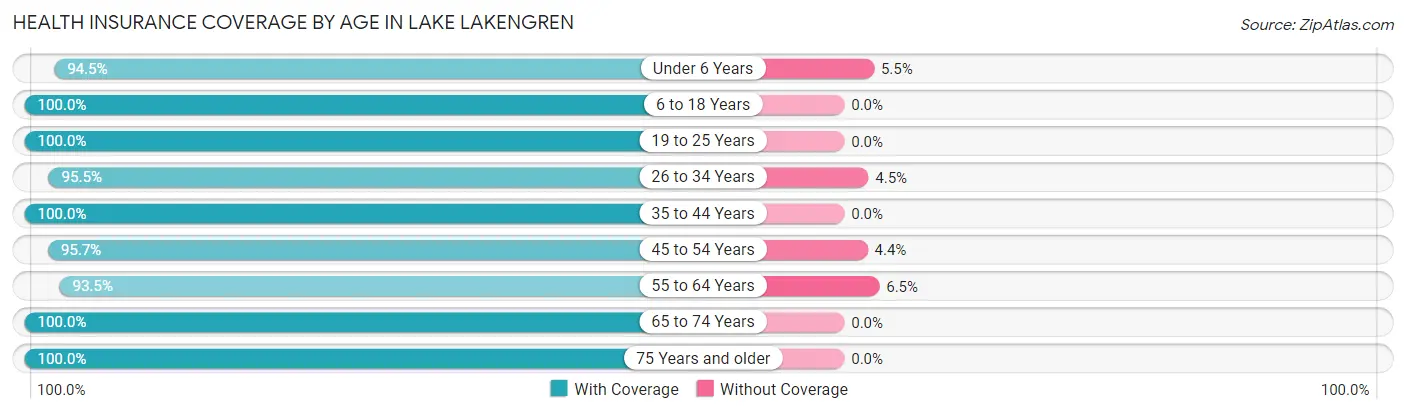
| Age Bracket | With Coverage | Without Coverage |
| Under 6 Years | 205 (94.5%) | 12 (5.5%) |
| 6 to 18 Years | 600 (100.0%) | 0 (0.0%) |
| 19 to 25 Years | 268 (100.0%) | 0 (0.0%) |
| 26 to 34 Years | 319 (95.5%) | 15 (4.5%) |
| 35 to 44 Years | 403 (100.0%) | 0 (0.0%) |
| 45 to 54 Years | 572 (95.7%) | 26 (4.3%) |
| 55 to 64 Years | 415 (93.5%) | 29 (6.5%) |
| 65 to 74 Years | 413 (100.0%) | 0 (0.0%) |
| 75 Years and older | 227 (100.0%) | 0 (0.0%) |
| Total | 3,422 (97.7%) | 82 (2.3%) |
Health Insurance Coverage by Citizenship Status in Lake Lakengren
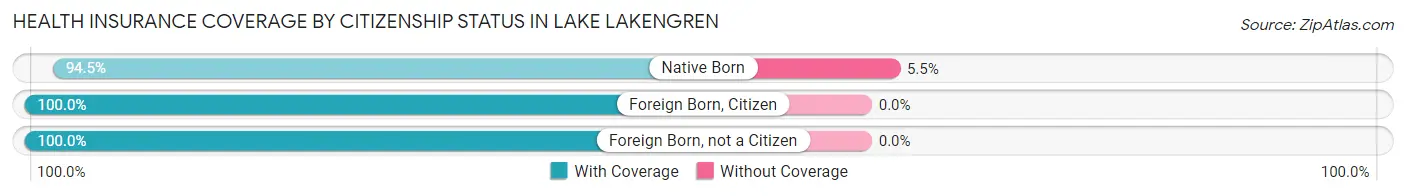
| Citizenship Status | With Coverage | Without Coverage |
| Native Born | 205 (94.5%) | 12 (5.5%) |
| Foreign Born, Citizen | 600 (100.0%) | 0 (0.0%) |
| Foreign Born, not a Citizen | 268 (100.0%) | 0 (0.0%) |
Health Insurance Coverage by Household Income in Lake Lakengren
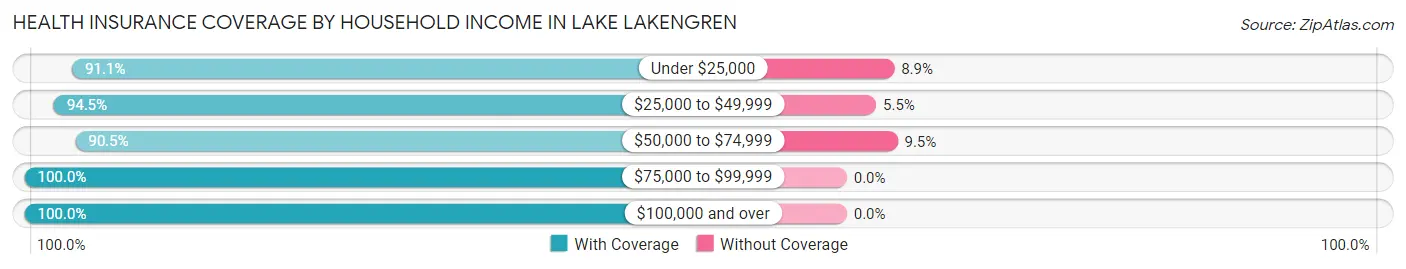
| Household Income | With Coverage | Without Coverage |
| Under $25,000 | 123 (91.1%) | 12 (8.9%) |
| $25,000 to $49,999 | 499 (94.5%) | 29 (5.5%) |
| $50,000 to $74,999 | 390 (90.5%) | 41 (9.5%) |
| $75,000 to $99,999 | 632 (100.0%) | 0 (0.0%) |
| $100,000 and over | 1,778 (100.0%) | 0 (0.0%) |
Public vs Private Health Insurance Coverage by Age in Lake Lakengren
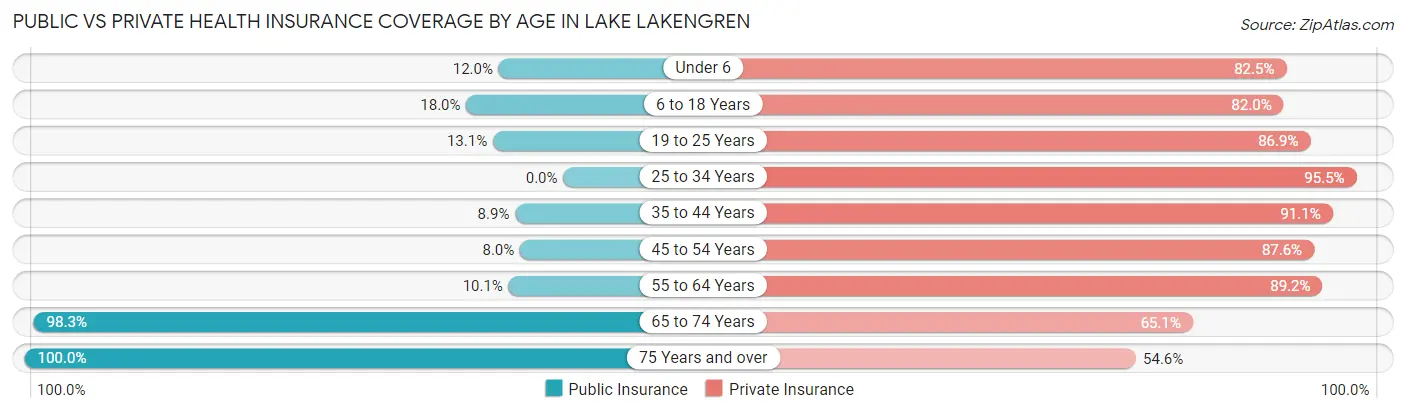
| Age Bracket | Public Insurance | Private Insurance |
| Under 6 | 26 (12.0%) | 179 (82.5%) |
| 6 to 18 Years | 108 (18.0%) | 492 (82.0%) |
| 19 to 25 Years | 35 (13.1%) | 233 (86.9%) |
| 25 to 34 Years | 0 (0.0%) | 319 (95.5%) |
| 35 to 44 Years | 36 (8.9%) | 367 (91.1%) |
| 45 to 54 Years | 48 (8.0%) | 524 (87.6%) |
| 55 to 64 Years | 45 (10.1%) | 396 (89.2%) |
| 65 to 74 Years | 406 (98.3%) | 269 (65.1%) |
| 75 Years and over | 227 (100.0%) | 124 (54.6%) |
| Total | 931 (26.6%) | 2,903 (82.9%) |
Disability Status by Sex by Age in Lake Lakengren
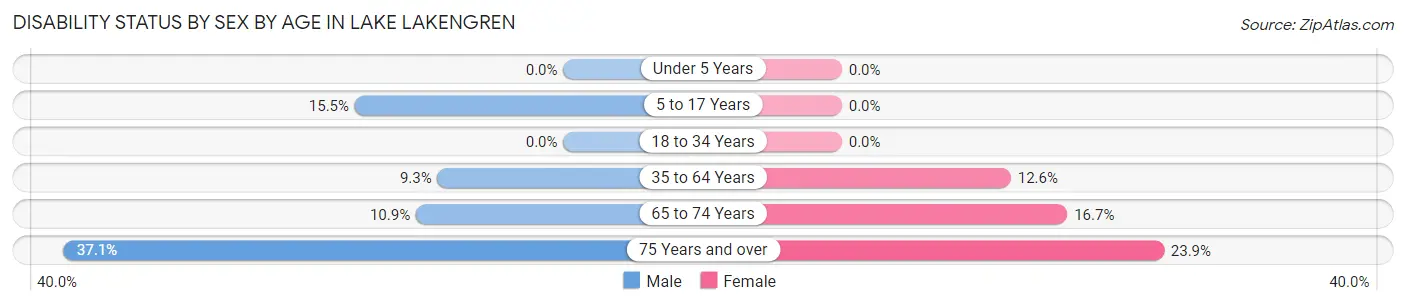
| Age Bracket | Male | Female |
| Under 5 Years | 0 (0.0%) | 0 (0.0%) |
| 5 to 17 Years | 52 (15.5%) | 0 (0.0%) |
| 18 to 34 Years | 0 (0.0%) | 0 (0.0%) |
| 35 to 64 Years | 71 (9.3%) | 86 (12.6%) |
| 65 to 74 Years | 21 (10.9%) | 37 (16.7%) |
| 75 Years and over | 33 (37.1%) | 33 (23.9%) |
Disability Class by Sex by Age in Lake Lakengren
Disability Class: Hearing Difficulty
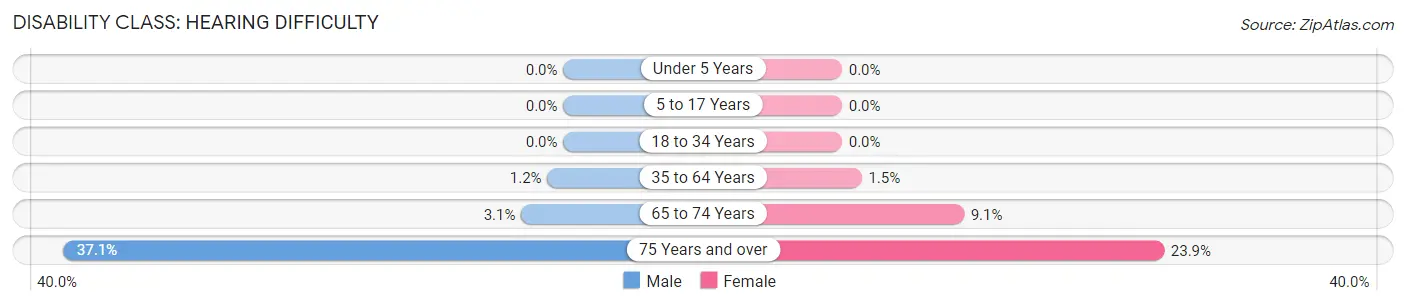
| Age Bracket | Male | Female |
| Under 5 Years | 0 (0.0%) | 0 (0.0%) |
| 5 to 17 Years | 0 (0.0%) | 0 (0.0%) |
| 18 to 34 Years | 0 (0.0%) | 0 (0.0%) |
| 35 to 64 Years | 9 (1.2%) | 10 (1.5%) |
| 65 to 74 Years | 6 (3.1%) | 20 (9.0%) |
| 75 Years and over | 33 (37.1%) | 33 (23.9%) |
Disability Class: Vision Difficulty
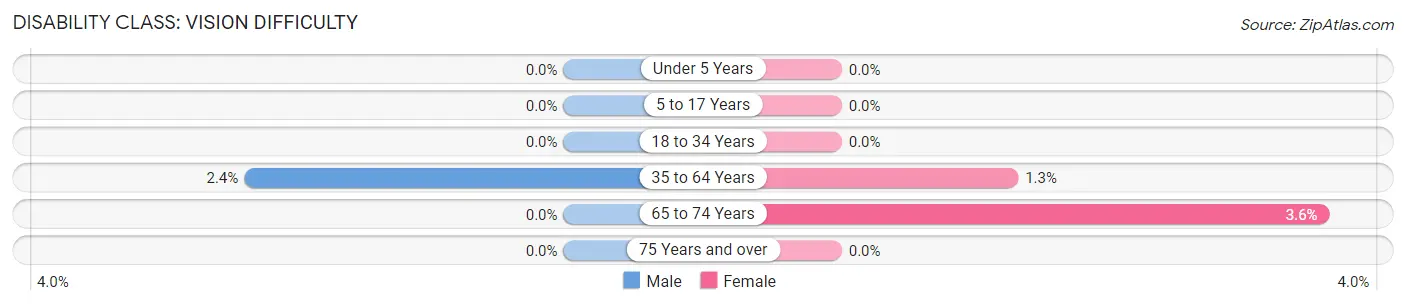
| Age Bracket | Male | Female |
| Under 5 Years | 0 (0.0%) | 0 (0.0%) |
| 5 to 17 Years | 0 (0.0%) | 0 (0.0%) |
| 18 to 34 Years | 0 (0.0%) | 0 (0.0%) |
| 35 to 64 Years | 18 (2.4%) | 9 (1.3%) |
| 65 to 74 Years | 0 (0.0%) | 8 (3.6%) |
| 75 Years and over | 0 (0.0%) | 0 (0.0%) |
Disability Class: Cognitive Difficulty
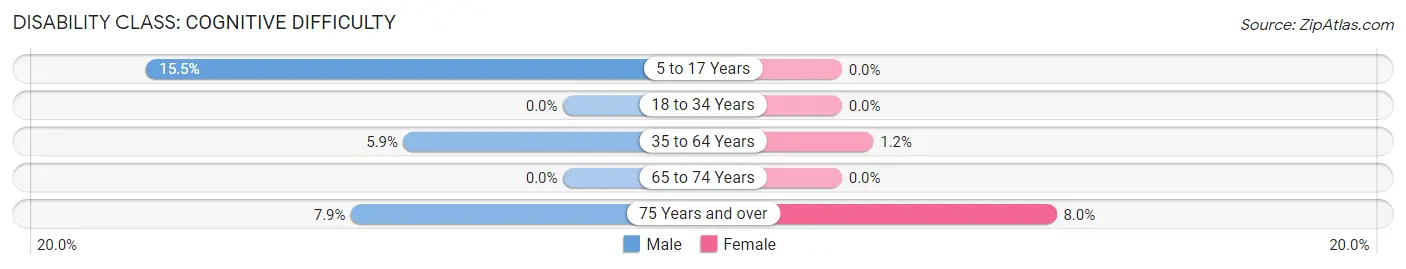
| Age Bracket | Male | Female |
| 5 to 17 Years | 52 (15.5%) | 0 (0.0%) |
| 18 to 34 Years | 0 (0.0%) | 0 (0.0%) |
| 35 to 64 Years | 45 (5.9%) | 8 (1.2%) |
| 65 to 74 Years | 0 (0.0%) | 0 (0.0%) |
| 75 Years and over | 7 (7.9%) | 11 (8.0%) |
Disability Class: Ambulatory Difficulty
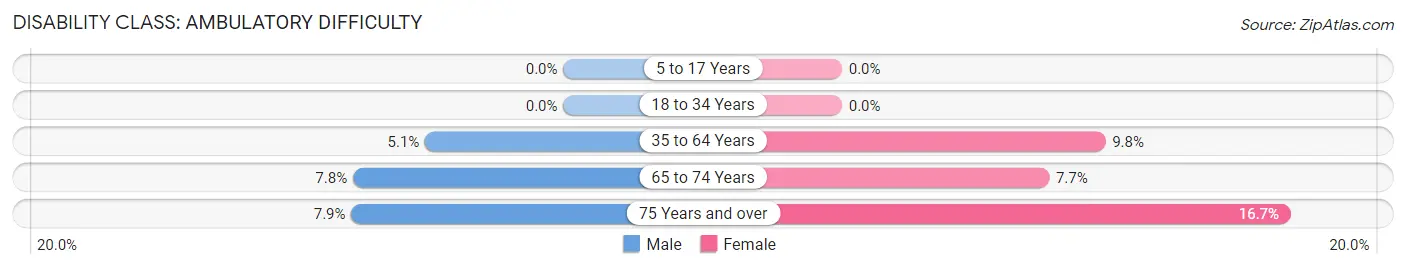
| Age Bracket | Male | Female |
| 5 to 17 Years | 0 (0.0%) | 0 (0.0%) |
| 18 to 34 Years | 0 (0.0%) | 0 (0.0%) |
| 35 to 64 Years | 39 (5.1%) | 67 (9.8%) |
| 65 to 74 Years | 15 (7.8%) | 17 (7.7%) |
| 75 Years and over | 7 (7.9%) | 23 (16.7%) |
Disability Class: Self-Care Difficulty
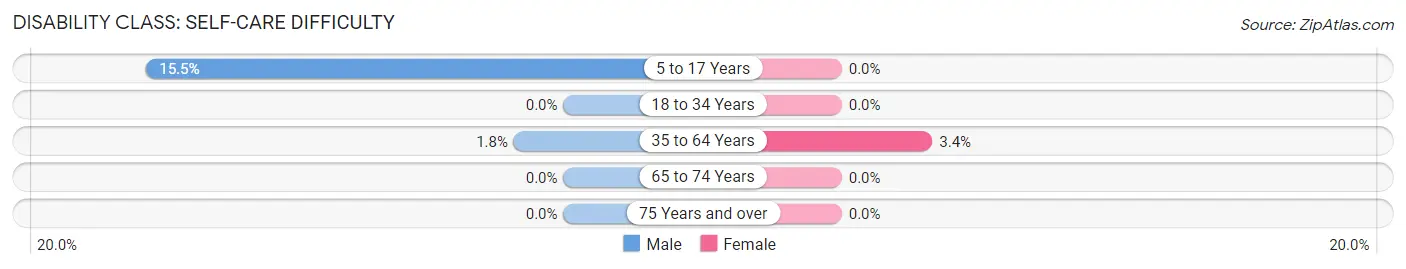
| Age Bracket | Male | Female |
| 5 to 17 Years | 52 (15.5%) | 0 (0.0%) |
| 18 to 34 Years | 0 (0.0%) | 0 (0.0%) |
| 35 to 64 Years | 14 (1.8%) | 23 (3.4%) |
| 65 to 74 Years | 0 (0.0%) | 0 (0.0%) |
| 75 Years and over | 0 (0.0%) | 0 (0.0%) |
Technology Access in Lake Lakengren
Computing Device Access in Lake Lakengren
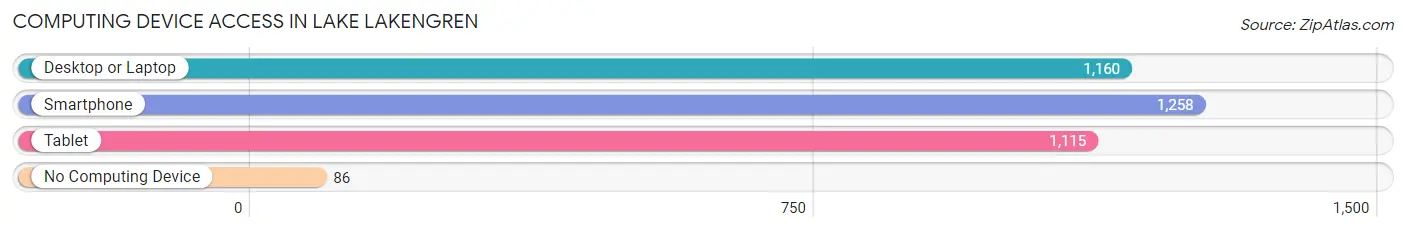
| Device Type | # Households | % Households |
| Desktop or Laptop | 1,160 | 82.3% |
| Smartphone | 1,258 | 89.3% |
| Tablet | 1,115 | 79.1% |
| No Computing Device | 86 | 6.1% |
| Total | 1,409 | 100.0% |
Internet Access in Lake Lakengren
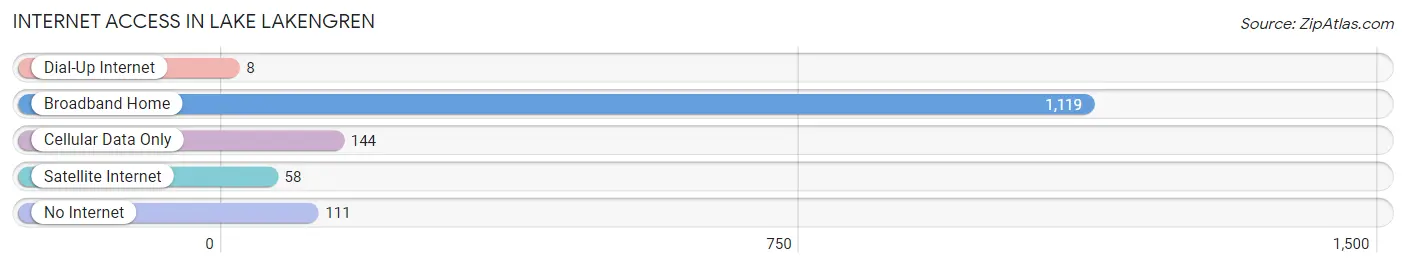
| Internet Type | # Households | % Households |
| Dial-Up Internet | 8 | 0.6% |
| Broadband Home | 1,119 | 79.4% |
| Cellular Data Only | 144 | 10.2% |
| Satellite Internet | 58 | 4.1% |
| No Internet | 111 | 7.9% |
| Total | 1,409 | 100.0% |
Lake Lakengren Summary
Lake Lakengren is a man-made lake located in Preble County, Ohio. It is the largest lake in the state of Ohio and is a popular destination for fishing, boating, and other recreational activities. The lake was created in the late 1960s by the U.S. Army Corps of Engineers as part of the Miami Conservancy District’s flood control project. The lake is located on the western edge of the Great Miami River and is surrounded by the towns of Eaton, West Alexandria, and Lewisburg.
Geography
Lake Lakengren is located in the western part of Preble County, Ohio. It is situated on the western edge of the Great Miami River and is surrounded by the towns of Eaton, West Alexandria, and Lewisburg. The lake covers an area of 1,890 acres and has a maximum depth of 40 feet. The lake is fed by the Great Miami River and is drained by the Twin Creek. The lake is also connected to the Twin Creek Reservoir, which is located to the north of the lake.
Economy
Lake Lakengren is a popular destination for fishing, boating, and other recreational activities. The lake is home to a variety of fish species, including largemouth bass, bluegill, crappie, and catfish. The lake also has a marina, which offers boat rentals, fishing supplies, and other services. The lake is also a popular destination for camping, swimming, and other outdoor activities.
Demographics
The population of Preble County was 42,270 in the year 2000, according to the U.S. Census Bureau. The median household income was $37,945 and the median family income was $45,945. The population of the towns surrounding Lake Lakengren was as follows: Eaton (4,845), West Alexandria (1,845), and Lewisburg (1,845).
Conclusion
Lake Lakengren is a man-made lake located in Preble County, Ohio. It is the largest lake in the state of Ohio and is a popular destination for fishing, boating, and other recreational activities. The lake was created in the late 1960s by the U.S. Army Corps of Engineers as part of the Miami Conservancy District’s flood control project. The lake is surrounded by the towns of Eaton, West Alexandria, and Lewisburg and has a population of 42,270. The lake is a popular destination for fishing, boating, camping, swimming, and other outdoor activities.
Common Questions
What is Per Capita Income in Lake Lakengren?
Per Capita income in Lake Lakengren is $38,748.
What is the Median Family Income in Lake Lakengren?
Median Family Income in Lake Lakengren is $93,906.
What is the Median Household income in Lake Lakengren?
Median Household Income in Lake Lakengren is $83,722.
What is Income or Wage Gap in Lake Lakengren?
Income or Wage Gap in Lake Lakengren is 24.8%.
Women in Lake Lakengren earn 75.2 cents for every dollar earned by a man.
What is Inequality or Gini Index in Lake Lakengren?
Inequality or Gini Index in Lake Lakengren is 0.36.
What is the Total Population of Lake Lakengren?
Total Population of Lake Lakengren is 3,504.
What is the Total Male Population of Lake Lakengren?
Total Male Population of Lake Lakengren is 1,870.
What is the Total Female Population of Lake Lakengren?
Total Female Population of Lake Lakengren is 1,634.
What is the Ratio of Males per 100 Females in Lake Lakengren?
There are 114.44 Males per 100 Females in Lake Lakengren.
What is the Ratio of Females per 100 Males in Lake Lakengren?
There are 87.38 Females per 100 Males in Lake Lakengren.
What is the Median Population Age in Lake Lakengren?
Median Population Age in Lake Lakengren is 44.0 Years.
What is the Average Family Size in Lake Lakengren
Average Family Size in Lake Lakengren is 2.9 People.
What is the Average Household Size in Lake Lakengren
Average Household Size in Lake Lakengren is 2.5 People.
How Large is the Labor Force in Lake Lakengren?
There are 1,899 People in the Labor Forcein in Lake Lakengren.
What is the Percentage of People in the Labor Force in Lake Lakengren?
68.2% of People are in the Labor Force in Lake Lakengren.
What is the Unemployment Rate in Lake Lakengren?
Unemployment Rate in Lake Lakengren is 1.2%.