Cinnamon Lake, OH Map & Demographics
Cinnamon Lake Map
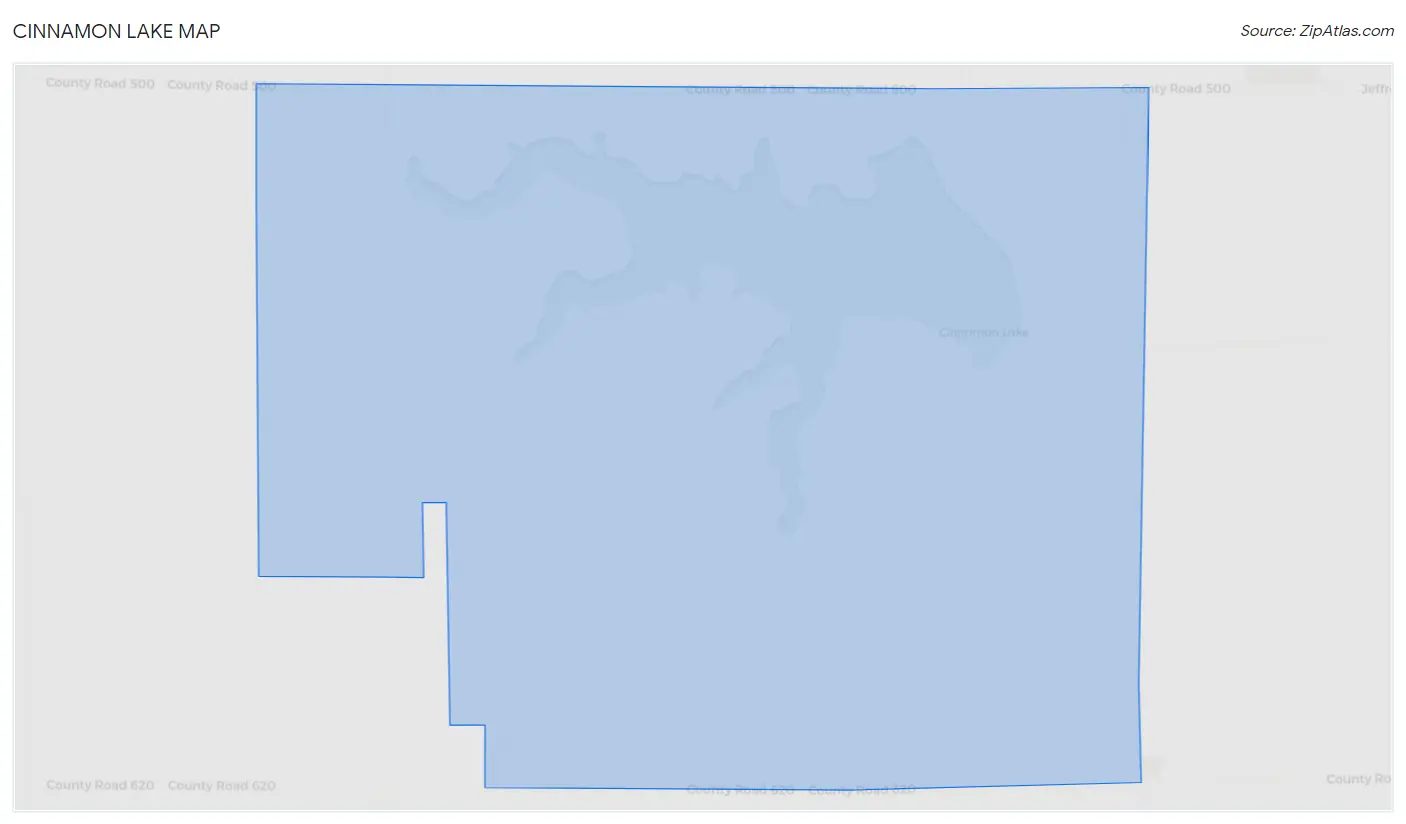
Cinnamon Lake Overview
$35,842
PER CAPITA INCOME
$83,788
AVG FAMILY INCOME
$83,673
AVG HOUSEHOLD INCOME
0.27
INEQUALITY / GINI INDEX
1,027
TOTAL POPULATION
505
MALE POPULATION
522
FEMALE POPULATION
96.74
MALES / 100 FEMALES
103.37
FEMALES / 100 MALES
52.3
MEDIAN AGE
2.3
AVG FAMILY SIZE
2.1
AVG HOUSEHOLD SIZE
473
LABOR FORCE [ PEOPLE ]
55.8%
PERCENT IN LABOR FORCE
2.1%
UNEMPLOYMENT RATE
Income in Cinnamon Lake
Income Overview in Cinnamon Lake
Per Capita Income in Cinnamon Lake is $35,842, while median incomes of families and households are $83,788 and $83,673 respectively.
| Characteristic | Number | Measure |
| Per Capita Income | 1,027 | $35,842 |
| Median Family Income | 357 | $83,788 |
| Mean Family Income | 357 | $83,386 |
| Median Household Income | 495 | $83,673 |
| Mean Household Income | 495 | $77,836 |
| Income Deficit | 357 | $0 |
| Wage / Income Gap (%) | 1,027 | 0.00% |
| Wage / Income Gap ($) | 1,027 | 100.00¢ per $1 |
| Gini / Inequality Index | 1,027 | 0.27 |
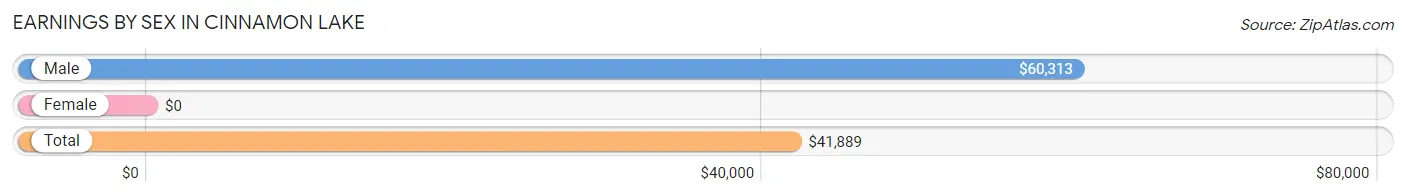
Earnings by Sex in Cinnamon Lake
| Sex | Number | Average Earnings |
| Male | 324 (62.0%) | $60,313 |
| Female | 199 (38.1%) | $0 |
| Total | 523 (100.0%) | $41,889 |
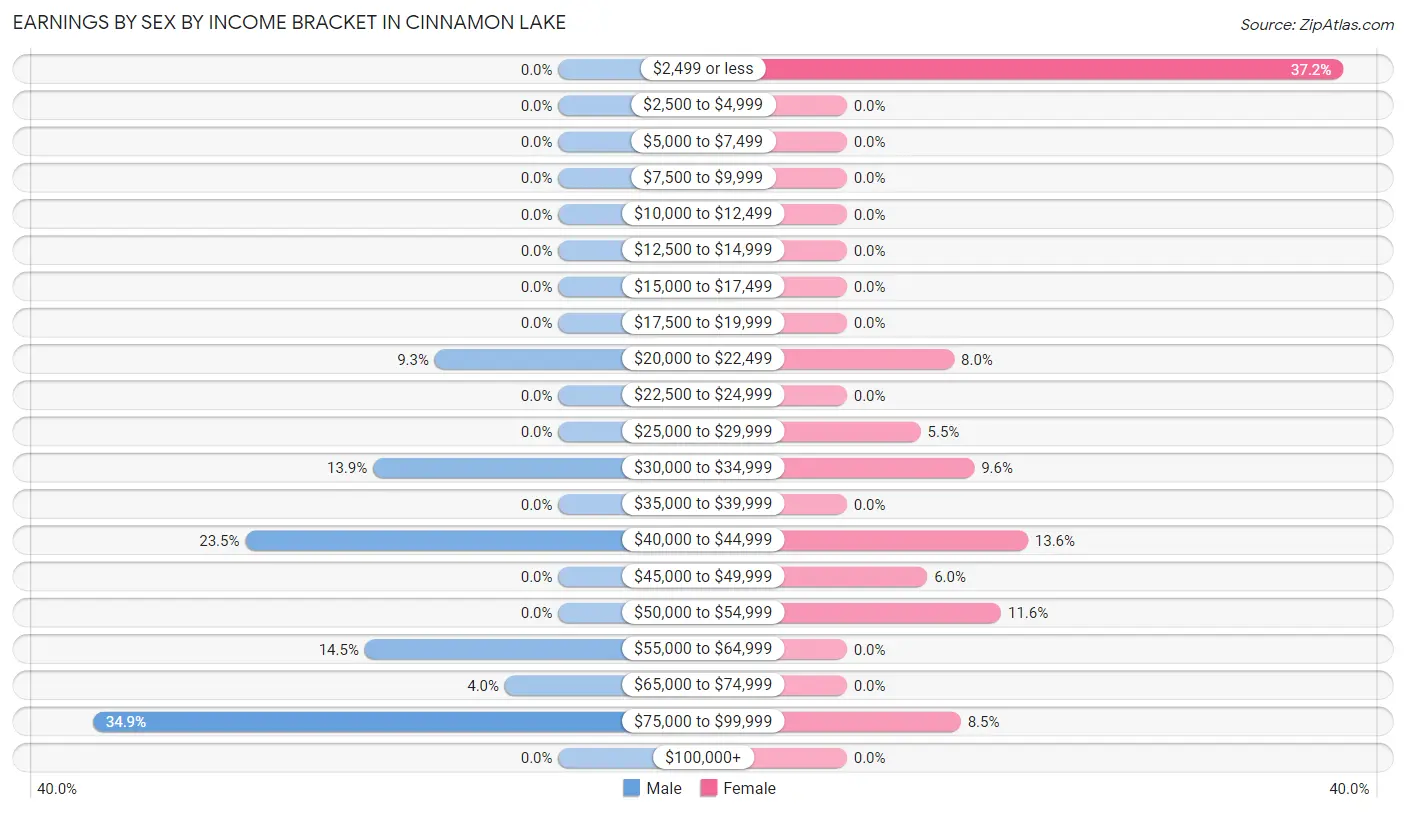
Earnings by Sex by Income Bracket in Cinnamon Lake
The most common earnings brackets in Cinnamon Lake are $75,000 to $99,999 for men (113 | 34.9%) and $2,499 or less for women (74 | 37.2%).
| Income | Male | Female |
| $2,499 or less | 0 (0.0%) | 74 (37.2%) |
| $2,500 to $4,999 | 0 (0.0%) | 0 (0.0%) |
| $5,000 to $7,499 | 0 (0.0%) | 0 (0.0%) |
| $7,500 to $9,999 | 0 (0.0%) | 0 (0.0%) |
| $10,000 to $12,499 | 0 (0.0%) | 0 (0.0%) |
| $12,500 to $14,999 | 0 (0.0%) | 0 (0.0%) |
| $15,000 to $17,499 | 0 (0.0%) | 0 (0.0%) |
| $17,500 to $19,999 | 0 (0.0%) | 0 (0.0%) |
| $20,000 to $22,499 | 30 (9.3%) | 16 (8.0%) |
| $22,500 to $24,999 | 0 (0.0%) | 0 (0.0%) |
| $25,000 to $29,999 | 0 (0.0%) | 11 (5.5%) |
| $30,000 to $34,999 | 45 (13.9%) | 19 (9.6%) |
| $35,000 to $39,999 | 0 (0.0%) | 0 (0.0%) |
| $40,000 to $44,999 | 76 (23.5%) | 27 (13.6%) |
| $45,000 to $49,999 | 0 (0.0%) | 12 (6.0%) |
| $50,000 to $54,999 | 0 (0.0%) | 23 (11.6%) |
| $55,000 to $64,999 | 47 (14.5%) | 0 (0.0%) |
| $65,000 to $74,999 | 13 (4.0%) | 0 (0.0%) |
| $75,000 to $99,999 | 113 (34.9%) | 17 (8.5%) |
| $100,000+ | 0 (0.0%) | 0 (0.0%) |
| Total | 324 (100.0%) | 199 (100.0%) |
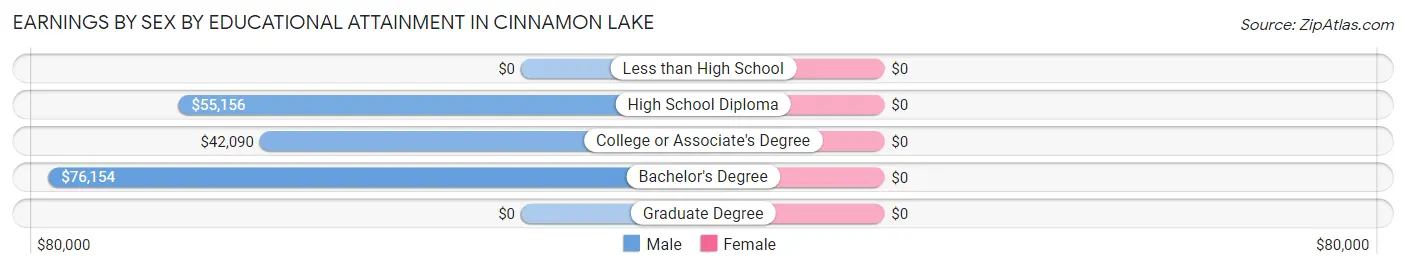
Earnings by Sex by Educational Attainment in Cinnamon Lake
| Educational Attainment | Male Income | Female Income |
| Less than High School | - | - |
| High School Diploma | $55,156 | $0 |
| College or Associate's Degree | $42,090 | $0 |
| Bachelor's Degree | $76,154 | $0 |
| Graduate Degree | - | - |
| Total | $60,313 | $0 |
Family Income in Cinnamon Lake
Family Income Brackets in Cinnamon Lake
According to the Cinnamon Lake family income data, there are 125 families falling into the $75,000 to $99,999 income range, which is the most common income bracket and makes up 35.0% of all families.
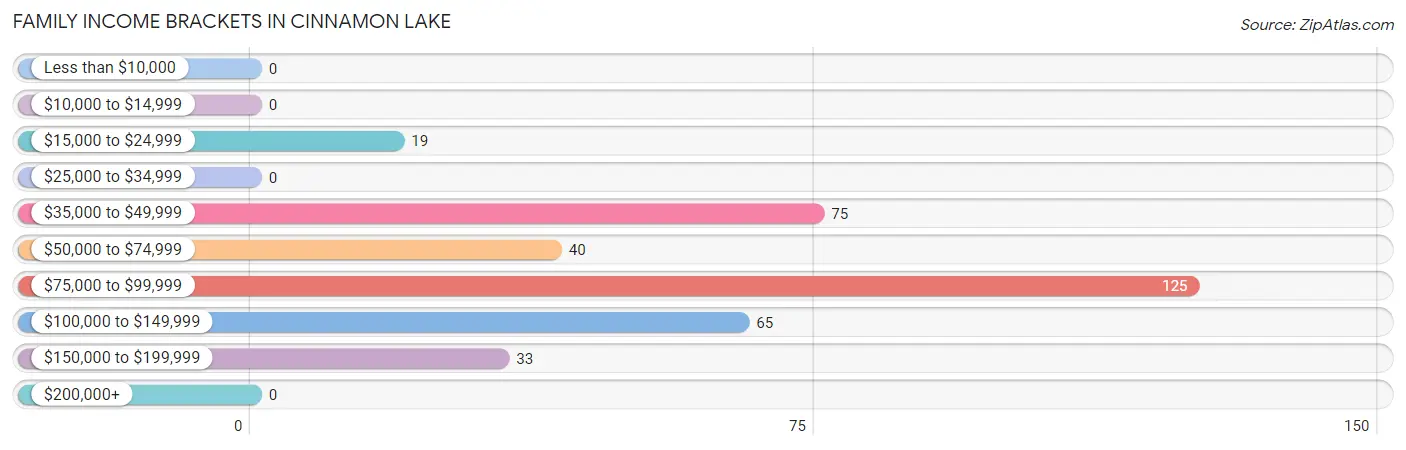
| Income Bracket | # Families | % Families |
| Less than $10,000 | 0 | 0.0% |
| $10,000 to $14,999 | 0 | 0.0% |
| $15,000 to $24,999 | 19 | 5.3% |
| $25,000 to $34,999 | 0 | 0.0% |
| $35,000 to $49,999 | 75 | 21.0% |
| $50,000 to $74,999 | 40 | 11.2% |
| $75,000 to $99,999 | 125 | 35.0% |
| $100,000 to $149,999 | 65 | 18.2% |
| $150,000 to $199,999 | 33 | 9.2% |
| $200,000+ | 0 | 0.0% |
Family Income by Famaliy Size in Cinnamon Lake
2-person families (268 | 75.1%) account for the highest median family income in Cinnamon Lake with $83,769 per family, while 2-person families (268 | 75.1%) have the highest median income of $41,884 per family member.
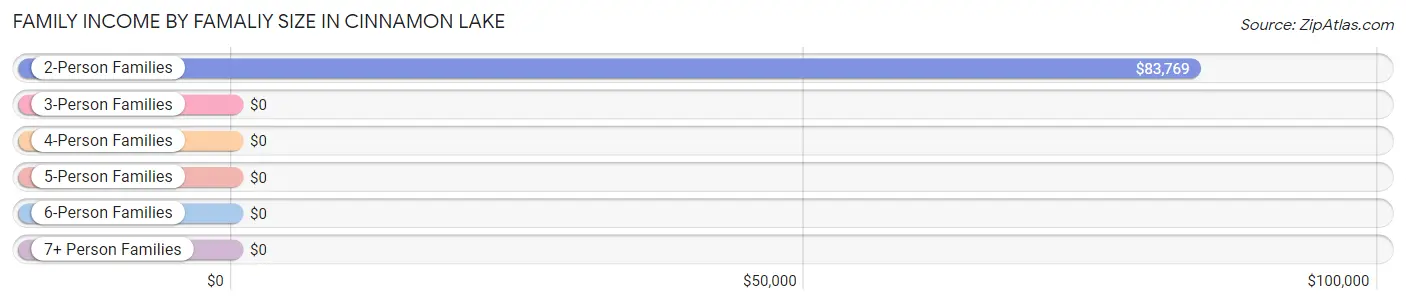
| Income Bracket | # Families | Median Income |
| 2-Person Families | 268 (75.1%) | $83,769 |
| 3-Person Families | 44 (12.3%) | $0 |
| 4-Person Families | 45 (12.6%) | $0 |
| 5-Person Families | 0 (0.0%) | $0 |
| 6-Person Families | 0 (0.0%) | $0 |
| 7+ Person Families | 0 (0.0%) | $0 |
| Total | 357 (100.0%) | $83,788 |
Family Income by Number of Earners in Cinnamon Lake
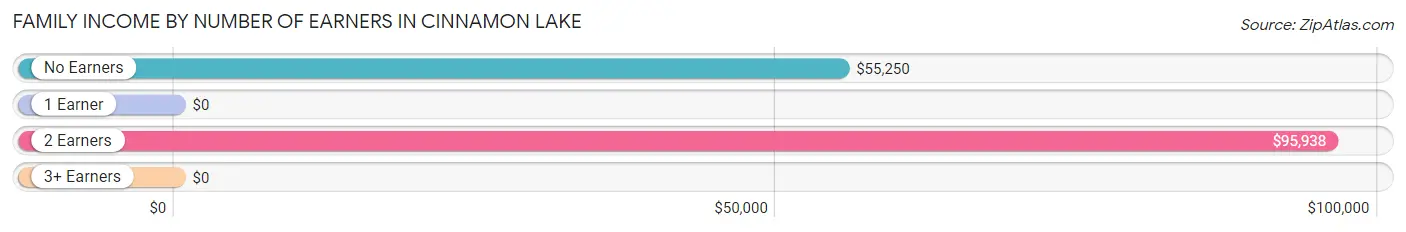
| Number of Earners | # Families | Median Income |
| No Earners | 74 (20.7%) | $55,250 |
| 1 Earner | 135 (37.8%) | $0 |
| 2 Earners | 134 (37.5%) | $95,938 |
| 3+ Earners | 14 (3.9%) | $0 |
| Total | 357 (100.0%) | $83,788 |
Household Income in Cinnamon Lake
Household Income Brackets in Cinnamon Lake
With 191 households falling in the category, the $75,000 to $99,999 income range is the most frequent in Cinnamon Lake, accounting for 38.6% of all households.
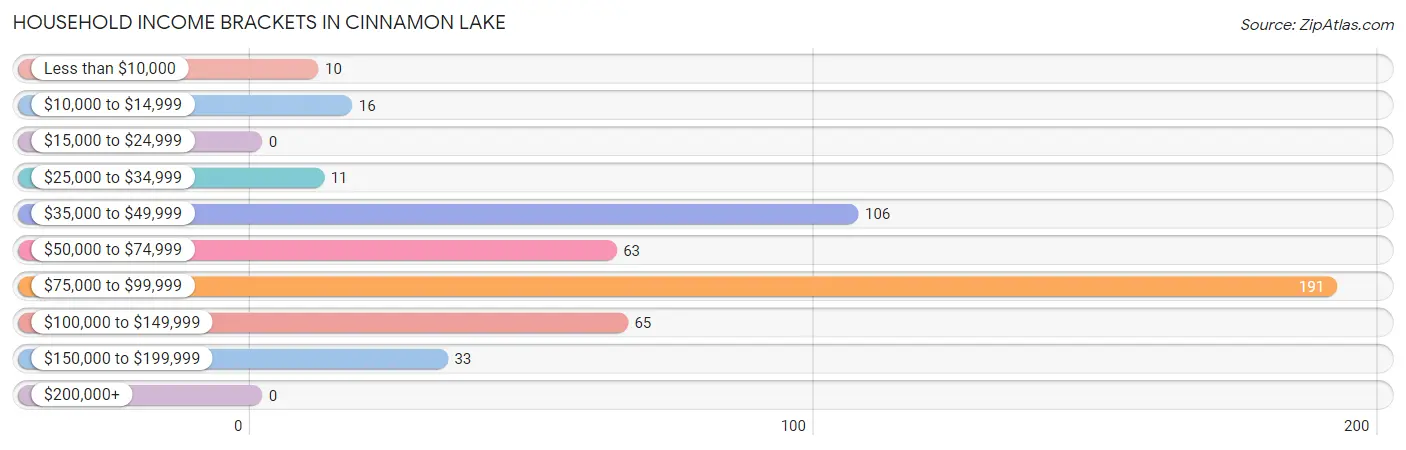
| Income Bracket | # Households | % Households |
| Less than $10,000 | 10 | 2.0% |
| $10,000 to $14,999 | 16 | 3.2% |
| $15,000 to $24,999 | 0 | 0.0% |
| $25,000 to $34,999 | 11 | 2.2% |
| $35,000 to $49,999 | 106 | 21.4% |
| $50,000 to $74,999 | 63 | 12.7% |
| $75,000 to $99,999 | 191 | 38.6% |
| $100,000 to $149,999 | 65 | 13.1% |
| $150,000 to $199,999 | 33 | 6.7% |
| $200,000+ | 0 | 0.0% |
Household Income by Householder Age in Cinnamon Lake
The median household income in Cinnamon Lake is $83,673, with the highest median household income of $90,677 found in the 25 to 44 years age bracket for the primary householder. A total of 89 households (18.0%) fall into this category.
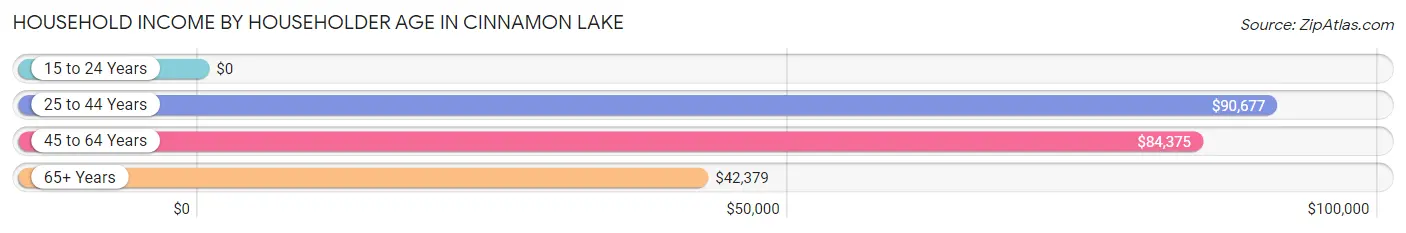
| Income Bracket | # Households | Median Income |
| 15 to 24 Years | 0 (0.0%) | $0 |
| 25 to 44 Years | 89 (18.0%) | $90,677 |
| 45 to 64 Years | 273 (55.1%) | $84,375 |
| 65+ Years | 133 (26.9%) | $42,379 |
| Total | 495 (100.0%) | $83,673 |
Poverty in Cinnamon Lake
Income Below Poverty by Sex and Age in Cinnamon Lake
With 6.7% poverty level for males and 9.0% for females among the residents of Cinnamon Lake, 6 to 11 year old males and 6 to 11 year old females are the most vulnerable to poverty, with 24 males (70.6%) and 28 females (36.4%) in their respective age groups living below the poverty level.
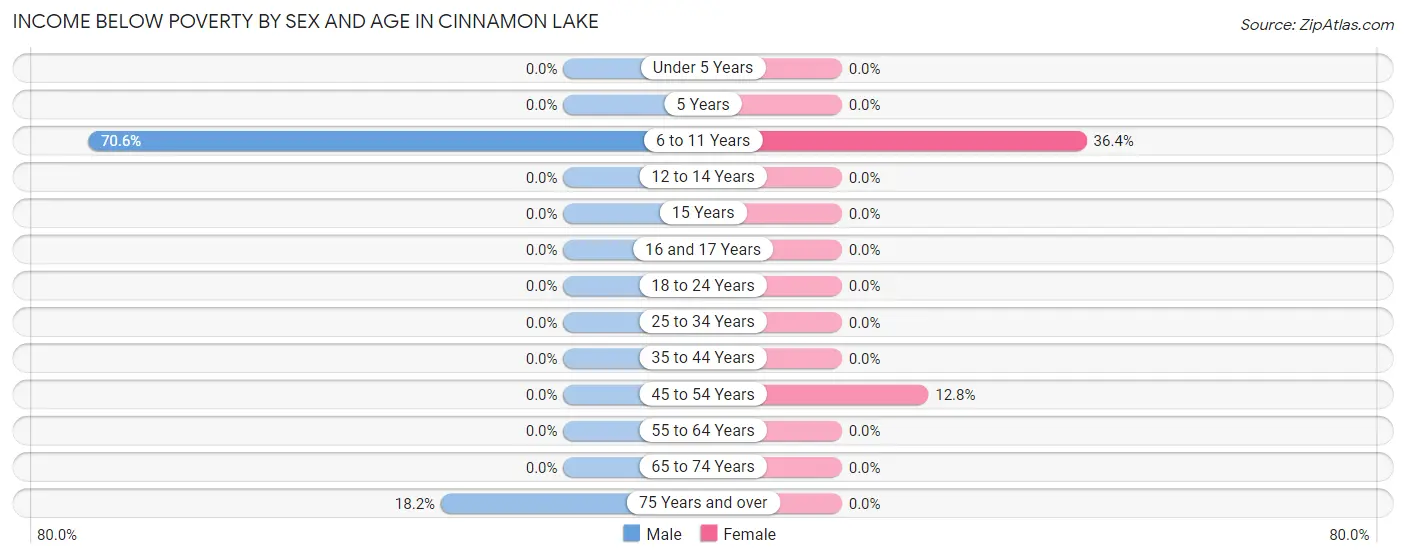
| Age Bracket | Male | Female |
| Under 5 Years | 0 (0.0%) | 0 (0.0%) |
| 5 Years | 0 (0.0%) | 0 (0.0%) |
| 6 to 11 Years | 24 (70.6%) | 28 (36.4%) |
| 12 to 14 Years | 0 (0.0%) | 0 (0.0%) |
| 15 Years | 0 (0.0%) | 0 (0.0%) |
| 16 and 17 Years | 0 (0.0%) | 0 (0.0%) |
| 18 to 24 Years | 0 (0.0%) | 0 (0.0%) |
| 25 to 34 Years | 0 (0.0%) | 0 (0.0%) |
| 35 to 44 Years | 0 (0.0%) | 0 (0.0%) |
| 45 to 54 Years | 0 (0.0%) | 19 (12.8%) |
| 55 to 64 Years | 0 (0.0%) | 0 (0.0%) |
| 65 to 74 Years | 0 (0.0%) | 0 (0.0%) |
| 75 Years and over | 10 (18.2%) | 0 (0.0%) |
| Total | 34 (6.7%) | 47 (9.0%) |
Income Above Poverty by Sex and Age in Cinnamon Lake
According to the poverty statistics in Cinnamon Lake, males aged under 5 years and females aged 12 to 14 years are the age groups that are most secure financially, with 100.0% of males and 100.0% of females in these age groups living above the poverty line.
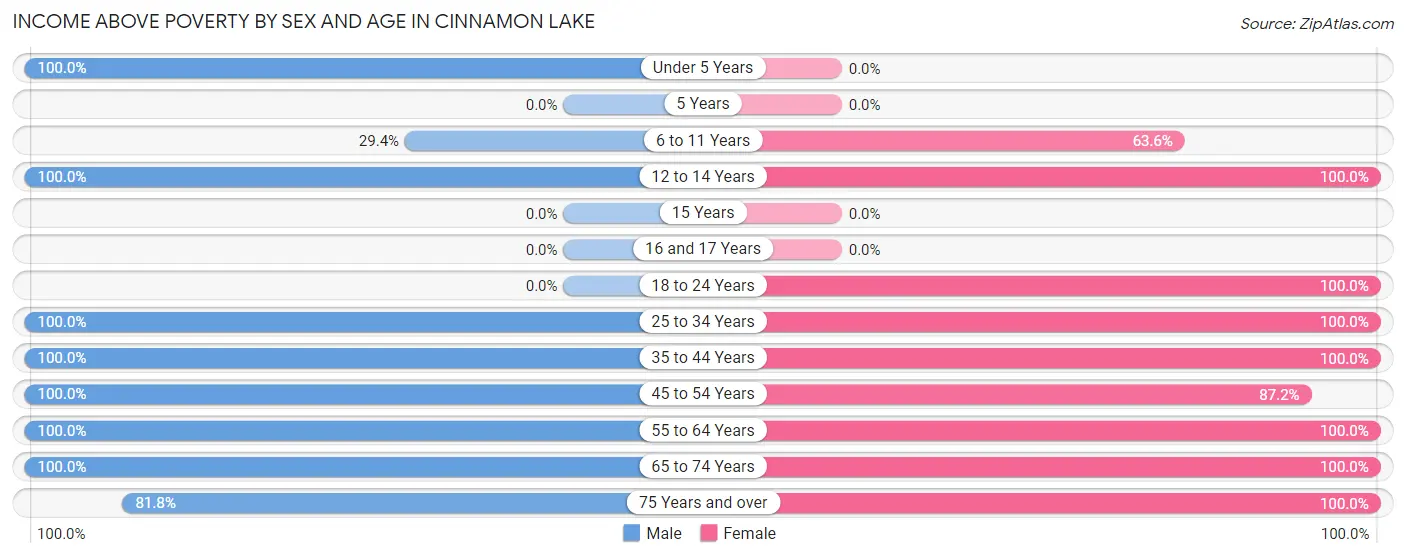
| Age Bracket | Male | Female |
| Under 5 Years | 25 (100.0%) | 0 (0.0%) |
| 5 Years | 0 (0.0%) | 0 (0.0%) |
| 6 to 11 Years | 10 (29.4%) | 49 (63.6%) |
| 12 to 14 Years | 21 (100.0%) | 23 (100.0%) |
| 15 Years | 0 (0.0%) | 0 (0.0%) |
| 16 and 17 Years | 0 (0.0%) | 0 (0.0%) |
| 18 to 24 Years | 0 (0.0%) | 29 (100.0%) |
| 25 to 34 Years | 40 (100.0%) | 23 (100.0%) |
| 35 to 44 Years | 87 (100.0%) | 27 (100.0%) |
| 45 to 54 Years | 63 (100.0%) | 129 (87.2%) |
| 55 to 64 Years | 117 (100.0%) | 113 (100.0%) |
| 65 to 74 Years | 63 (100.0%) | 28 (100.0%) |
| 75 Years and over | 45 (81.8%) | 54 (100.0%) |
| Total | 471 (93.3%) | 475 (91.0%) |
Income Below Poverty Among Married-Couple Families in Cinnamon Lake
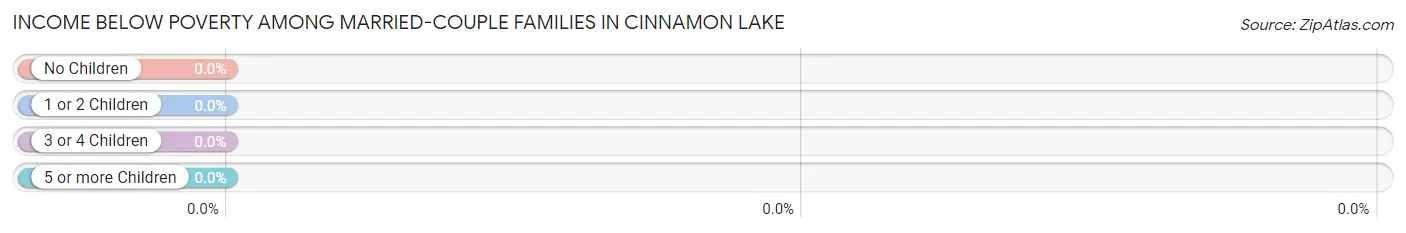
| Children | Above Poverty | Below Poverty |
| No Children | 251 (100.0%) | 0 (0.0%) |
| 1 or 2 Children | 56 (100.0%) | 0 (0.0%) |
| 3 or 4 Children | 0 (0.0%) | 0 (0.0%) |
| 5 or more Children | 0 (0.0%) | 0 (0.0%) |
| Total | 307 (100.0%) | 0 (0.0%) |
Income Below Poverty Among Single-Parent Households in Cinnamon Lake
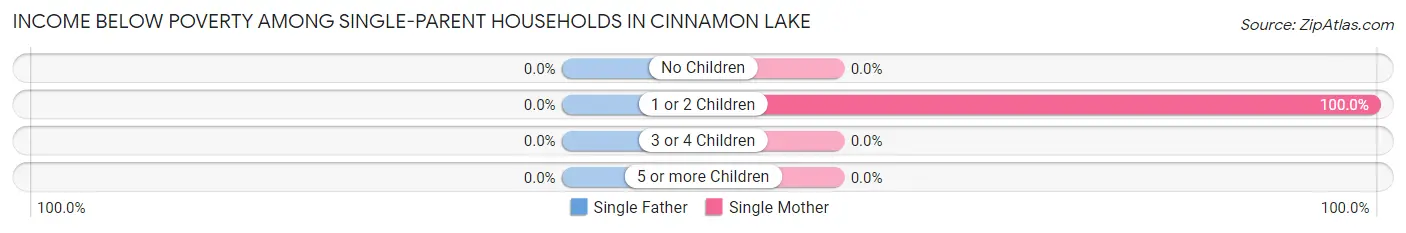
| Children | Single Father | Single Mother |
| No Children | 0 (0.0%) | 0 (0.0%) |
| 1 or 2 Children | 0 (0.0%) | 19 (100.0%) |
| 3 or 4 Children | 0 (0.0%) | 0 (0.0%) |
| 5 or more Children | 0 (0.0%) | 0 (0.0%) |
| Total | 0 (0.0%) | 19 (54.3%) |
Income Below Poverty Among Married-Couple vs Single-Parent Households in Cinnamon Lake
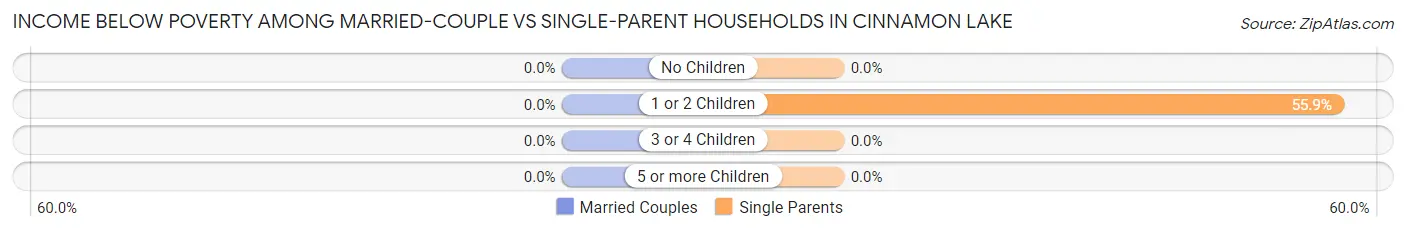
| Children | Married-Couple Families | Single-Parent Households |
| No Children | 0 (0.0%) | 0 (0.0%) |
| 1 or 2 Children | 0 (0.0%) | 19 (55.9%) |
| 3 or 4 Children | 0 (0.0%) | 0 (0.0%) |
| 5 or more Children | 0 (0.0%) | 0 (0.0%) |
| Total | 0 (0.0%) | 19 (38.0%) |
Race in Cinnamon Lake
The most populous races in Cinnamon Lake are White / Caucasian (997 | 97.1%), and Two or more Races (30 | 2.9%).
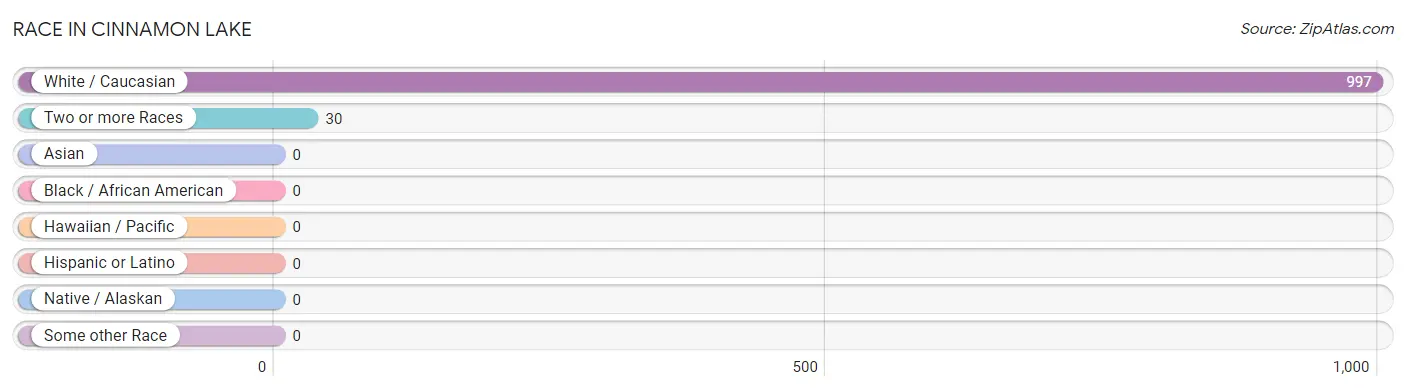
| Race | # Population | % Population |
| Asian | 0 | 0.0% |
| Black / African American | 0 | 0.0% |
| Hawaiian / Pacific | 0 | 0.0% |
| Hispanic or Latino | 0 | 0.0% |
| Native / Alaskan | 0 | 0.0% |
| White / Caucasian | 997 | 97.1% |
| Two or more Races | 30 | 2.9% |
| Some other Race | 0 | 0.0% |
| Total | 1,027 | 100.0% |
Ancestry in Cinnamon Lake
The most populous ancestries reported in Cinnamon Lake are German (336 | 32.7%), European (145 | 14.1%), Irish (138 | 13.4%), Polish (126 | 12.3%), and American (100 | 9.7%), together accounting for 82.3% of all Cinnamon Lake residents.
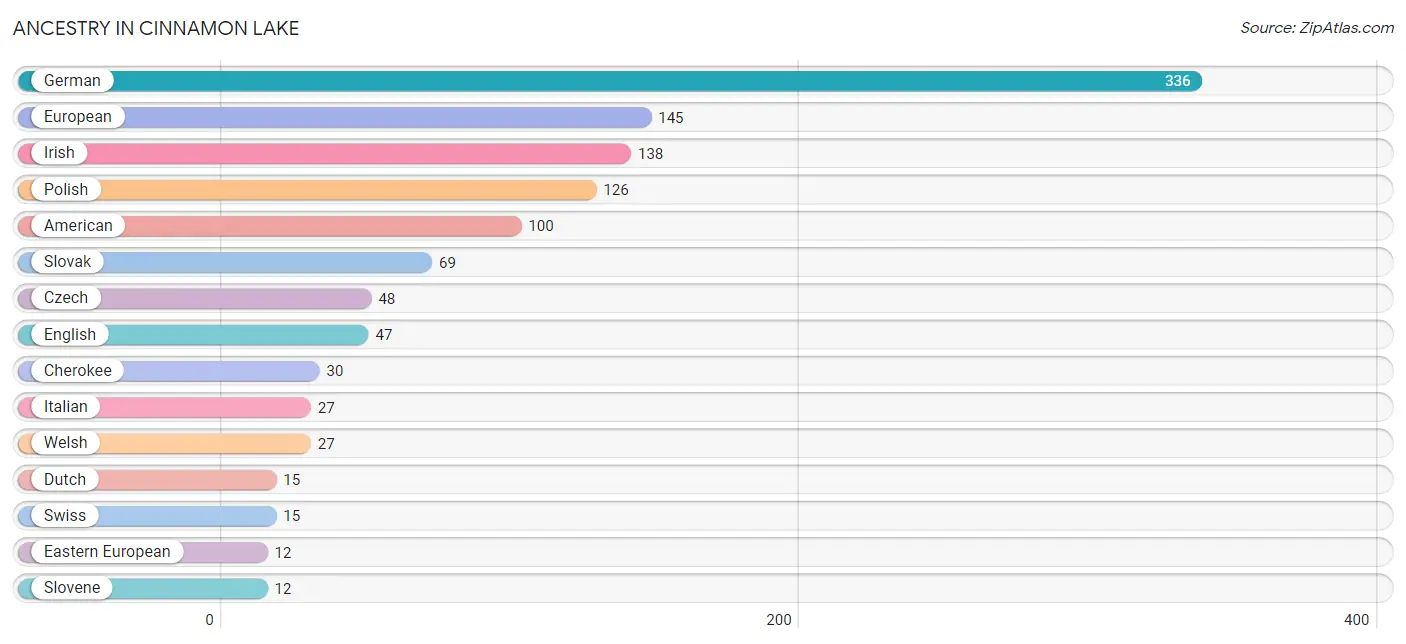
| Ancestry | # Population | % Population |
| American | 100 | 9.7% |
| Cherokee | 30 | 2.9% |
| Czech | 48 | 4.7% |
| Dutch | 15 | 1.5% |
| Eastern European | 12 | 1.2% |
| English | 47 | 4.6% |
| European | 145 | 14.1% |
| German | 336 | 32.7% |
| Irish | 138 | 13.4% |
| Italian | 27 | 2.6% |
| Polish | 126 | 12.3% |
| Scottish | 11 | 1.1% |
| Slovak | 69 | 6.7% |
| Slovene | 12 | 1.2% |
| Swiss | 15 | 1.5% |
| Welsh | 27 | 2.6% | View All 16 Rows |
Immigrants in Cinnamon Lake

| Immigration Origin | # Population | % Population | View All 0 Rows |
Sex and Age in Cinnamon Lake
Sex and Age in Cinnamon Lake
The most populous age groups in Cinnamon Lake are 60 to 64 Years (89 | 17.6%) for men and 45 to 49 Years (104 | 19.9%) for women.
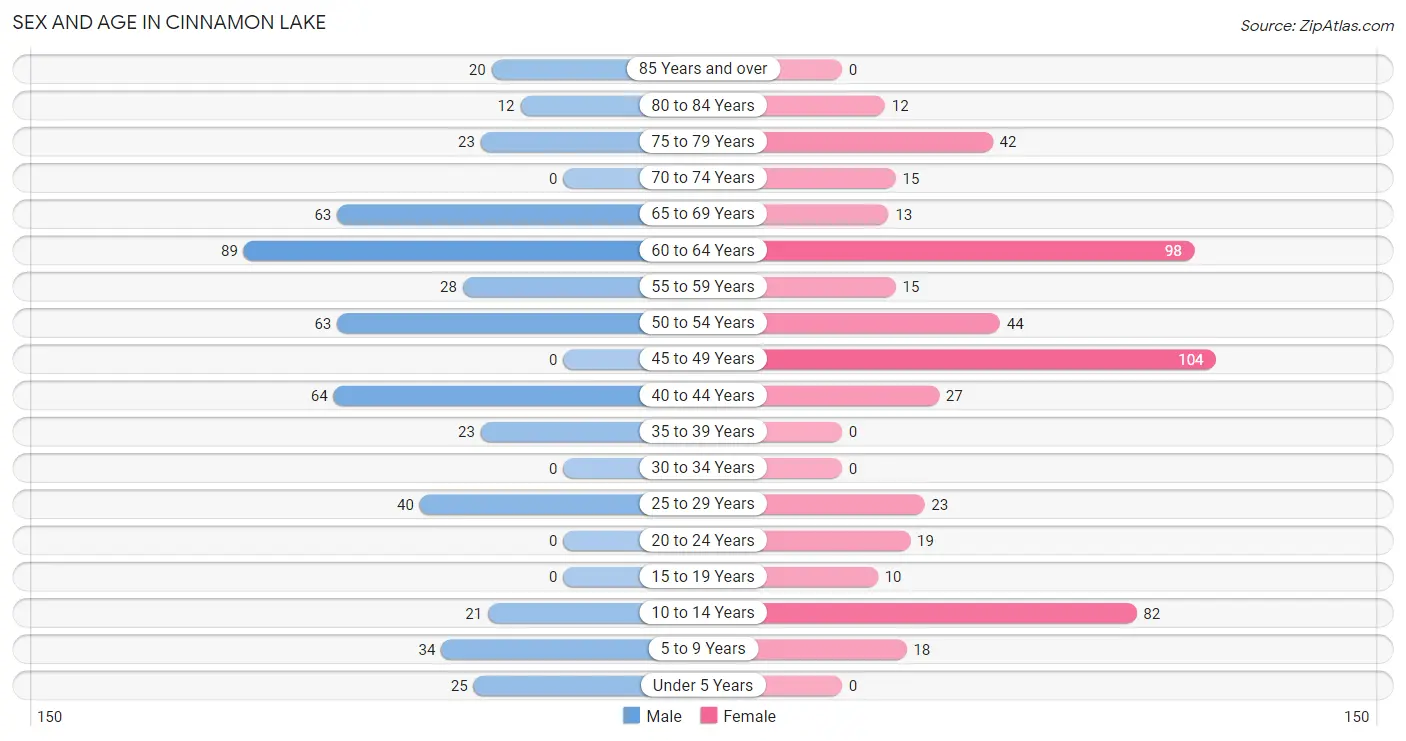
| Age Bracket | Male | Female |
| Under 5 Years | 25 (5.0%) | 0 (0.0%) |
| 5 to 9 Years | 34 (6.7%) | 18 (3.5%) |
| 10 to 14 Years | 21 (4.2%) | 82 (15.7%) |
| 15 to 19 Years | 0 (0.0%) | 10 (1.9%) |
| 20 to 24 Years | 0 (0.0%) | 19 (3.6%) |
| 25 to 29 Years | 40 (7.9%) | 23 (4.4%) |
| 30 to 34 Years | 0 (0.0%) | 0 (0.0%) |
| 35 to 39 Years | 23 (4.5%) | 0 (0.0%) |
| 40 to 44 Years | 64 (12.7%) | 27 (5.2%) |
| 45 to 49 Years | 0 (0.0%) | 104 (19.9%) |
| 50 to 54 Years | 63 (12.5%) | 44 (8.4%) |
| 55 to 59 Years | 28 (5.5%) | 15 (2.9%) |
| 60 to 64 Years | 89 (17.6%) | 98 (18.8%) |
| 65 to 69 Years | 63 (12.5%) | 13 (2.5%) |
| 70 to 74 Years | 0 (0.0%) | 15 (2.9%) |
| 75 to 79 Years | 23 (4.5%) | 42 (8.1%) |
| 80 to 84 Years | 12 (2.4%) | 12 (2.3%) |
| 85 Years and over | 20 (4.0%) | 0 (0.0%) |
| Total | 505 (100.0%) | 522 (100.0%) |
Families and Households in Cinnamon Lake
Median Family Size in Cinnamon Lake
The median family size in Cinnamon Lake is 2.33 persons per family, with single female/mother families (35 | 9.8%) accounting for the largest median family size of 2.91 persons per family. On the other hand, single male/father families (15 | 4.2%) represent the smallest median family size with 2.20 persons per family.
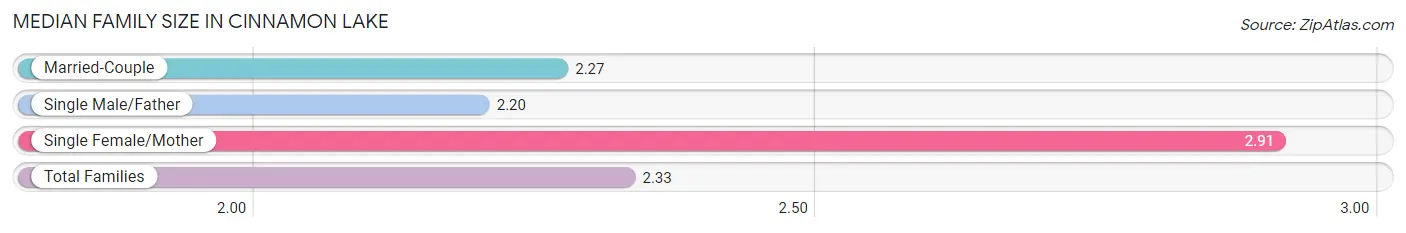
| Family Type | # Families | Family Size |
| Married-Couple | 307 (86.0%) | 2.27 |
| Single Male/Father | 15 (4.2%) | 2.20 |
| Single Female/Mother | 35 (9.8%) | 2.91 |
| Total Families | 357 (100.0%) | 2.33 |
Median Household Size in Cinnamon Lake
The median household size in Cinnamon Lake is 2.07 persons per household, with single female/mother households (35 | 7.1%) accounting for the largest median household size of 3.57 persons per household. non-family households (138 | 27.9%) represent the smallest median household size with 1.25 persons per household.
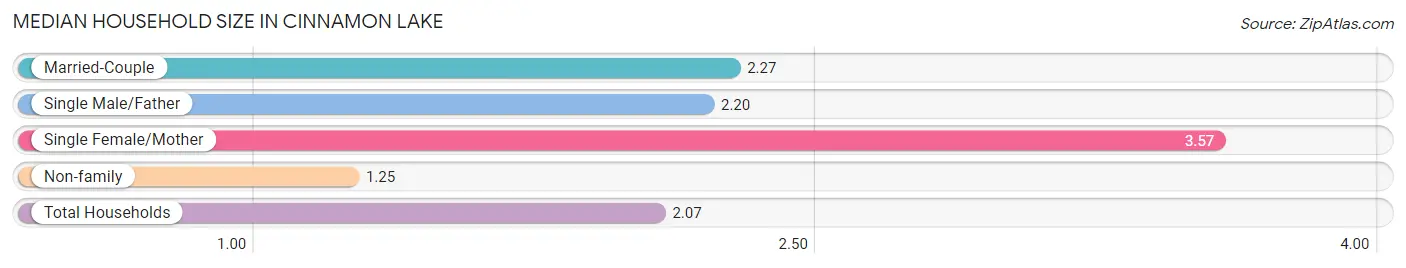
| Household Type | # Households | Household Size |
| Married-Couple | 307 (62.0%) | 2.27 |
| Single Male/Father | 15 (3.0%) | 2.20 |
| Single Female/Mother | 35 (7.1%) | 3.57 |
| Non-family | 138 (27.9%) | 1.25 |
| Total Households | 495 (100.0%) | 2.07 |
Household Size by Marriage Status in Cinnamon Lake
Out of a total of 495 households in Cinnamon Lake, 357 (72.1%) are family households, while 138 (27.9%) are nonfamily households. The most numerous type of family households are 2-person households, comprising 268, and the most common type of nonfamily households are 1-person households, comprising 91.
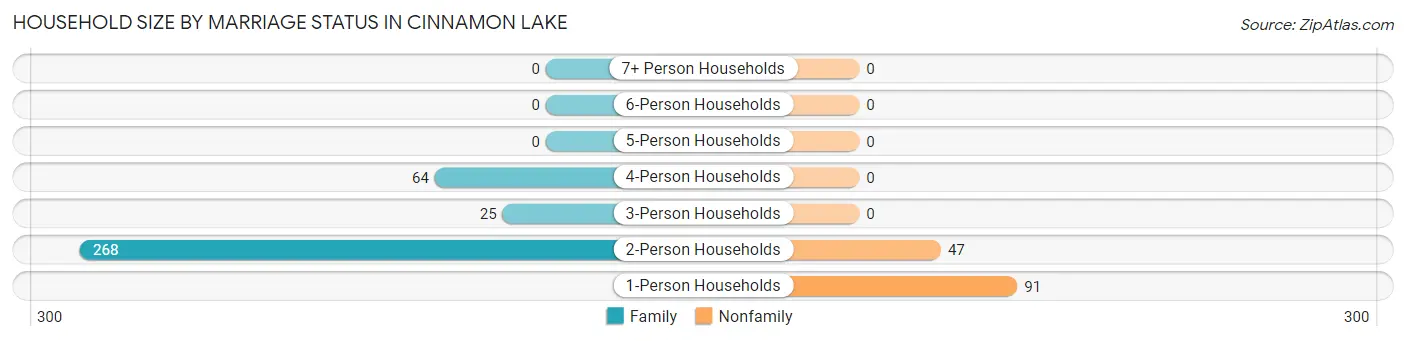
| Household Size | Family Households | Nonfamily Households |
| 1-Person Households | - | 91 (18.4%) |
| 2-Person Households | 268 (54.1%) | 47 (9.5%) |
| 3-Person Households | 25 (5.1%) | 0 (0.0%) |
| 4-Person Households | 64 (12.9%) | 0 (0.0%) |
| 5-Person Households | 0 (0.0%) | 0 (0.0%) |
| 6-Person Households | 0 (0.0%) | 0 (0.0%) |
| 7+ Person Households | 0 (0.0%) | 0 (0.0%) |
| Total | 357 (72.1%) | 138 (27.9%) |
Female Fertility in Cinnamon Lake
Fertility by Age in Cinnamon Lake
| Age Bracket | Women with Births | Births / 1,000 Women |
| 15 to 19 years | 0 (0.0%) | 0.0 |
| 20 to 34 years | 0 (0.0%) | 0.0 |
| 35 to 50 years | 0 (0.0%) | 0.0 |
| Total | 0 (0.0%) | 0.0 |
Fertility by Age by Marriage Status in Cinnamon Lake
| Age Bracket | Married | Unmarried |
| 15 to 19 years | 0 (0.0%) | 0 (0.0%) |
| 20 to 34 years | 0 (0.0%) | 0 (0.0%) |
| 35 to 50 years | 0 (0.0%) | 0 (0.0%) |
| Total | 0 (0.0%) | 0 (0.0%) |
Fertility by Education in Cinnamon Lake
| Educational Attainment | Women with Births | Births / 1,000 Women |
| Less than High School | 0 (0.0%) | 0.0 |
| High School Diploma | 0 (0.0%) | 0.0 |
| College or Associate's Degree | 0 (0.0%) | 0.0 |
| Bachelor's Degree | 0 (0.0%) | 0.0 |
| Graduate Degree | 0 (0.0%) | 0.0 |
| Total | 0 (0.0%) | 0.0 |
Fertility by Education by Marriage Status in Cinnamon Lake
| Educational Attainment | Married | Unmarried |
| Less than High School | 0 (0.0%) | 0 (0.0%) |
| High School Diploma | 0 (0.0%) | 0 (0.0%) |
| College or Associate's Degree | 0 (0.0%) | 0 (0.0%) |
| Bachelor's Degree | 0 (0.0%) | 0 (0.0%) |
| Graduate Degree | 0 (0.0%) | 0 (0.0%) |
| Total | 0 (0.0%) | 0 (0.0%) |
Employment Characteristics in Cinnamon Lake
Employment by Class of Employer in Cinnamon Lake
Among the 463 employed individuals in Cinnamon Lake, private company employees (338 | 73.0%), not-for-profit organizations (56 | 12.1%), and state government employees (35 | 7.6%) make up the most common classes of employment.
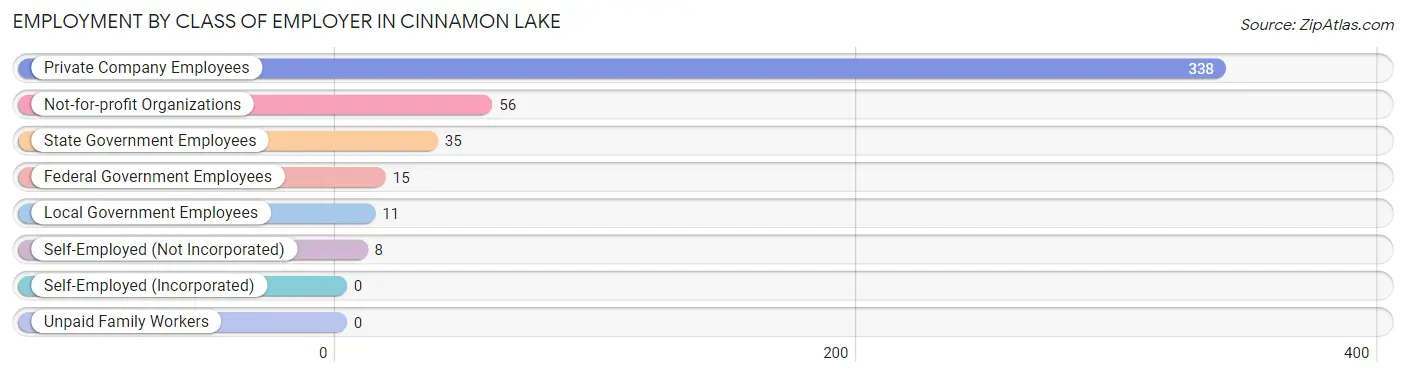
| Employer Class | # Employees | % Employees |
| Private Company Employees | 338 | 73.0% |
| Self-Employed (Incorporated) | 0 | 0.0% |
| Self-Employed (Not Incorporated) | 8 | 1.7% |
| Not-for-profit Organizations | 56 | 12.1% |
| Local Government Employees | 11 | 2.4% |
| State Government Employees | 35 | 7.6% |
| Federal Government Employees | 15 | 3.2% |
| Unpaid Family Workers | 0 | 0.0% |
| Total | 463 | 100.0% |
Employment Status by Age in Cinnamon Lake
According to the labor force statistics for Cinnamon Lake, out of the total population over 16 years of age (847), 55.8% or 473 individuals are in the labor force, with 2.1% or 10 of them unemployed. The age group with the highest labor force participation rate is 16 to 19 years, with 100.0% or 10 individuals in the labor force. Within the labor force, the 16 to 19 years age range has the highest percentage of unemployed individuals, with 100.0% or 10 of them being unemployed.
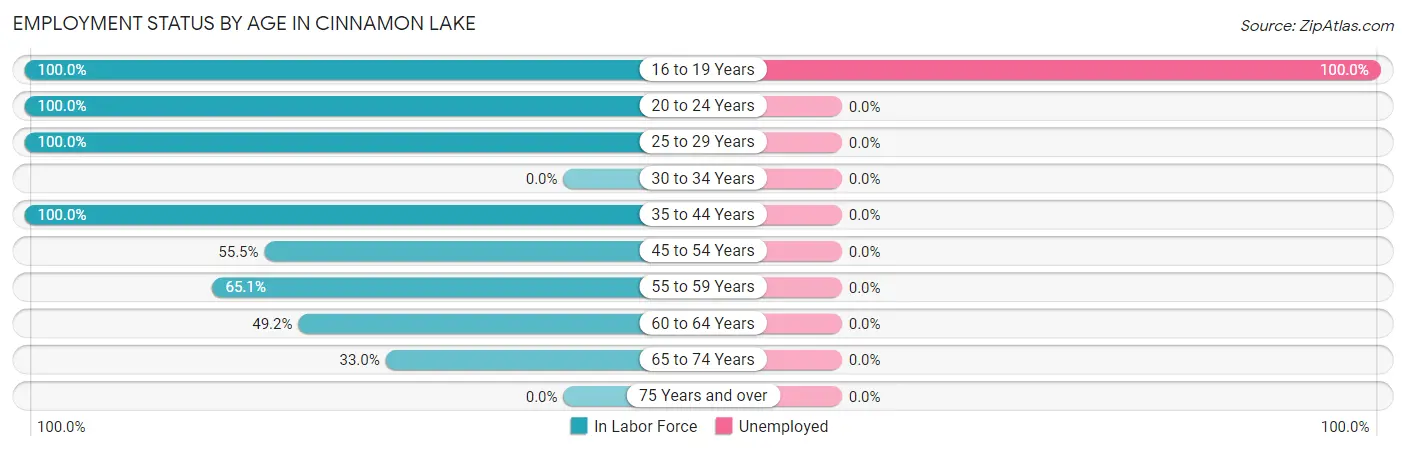
| Age Bracket | In Labor Force | Unemployed |
| 16 to 19 Years | 10 (100.0%) | 10 (100.0%) |
| 20 to 24 Years | 19 (100.0%) | 0 (0.0%) |
| 25 to 29 Years | 63 (100.0%) | 0 (0.0%) |
| 30 to 34 Years | 0 (0.0%) | 0 (0.0%) |
| 35 to 44 Years | 114 (100.0%) | 0 (0.0%) |
| 45 to 54 Years | 117 (55.5%) | 0 (0.0%) |
| 55 to 59 Years | 28 (65.1%) | 0 (0.0%) |
| 60 to 64 Years | 92 (49.2%) | 0 (0.0%) |
| 65 to 74 Years | 30 (33.0%) | 0 (0.0%) |
| 75 Years and over | 0 (0.0%) | 0 (0.0%) |
| Total | 473 (55.8%) | 10 (2.1%) |
Employment Status by Educational Attainment in Cinnamon Lake
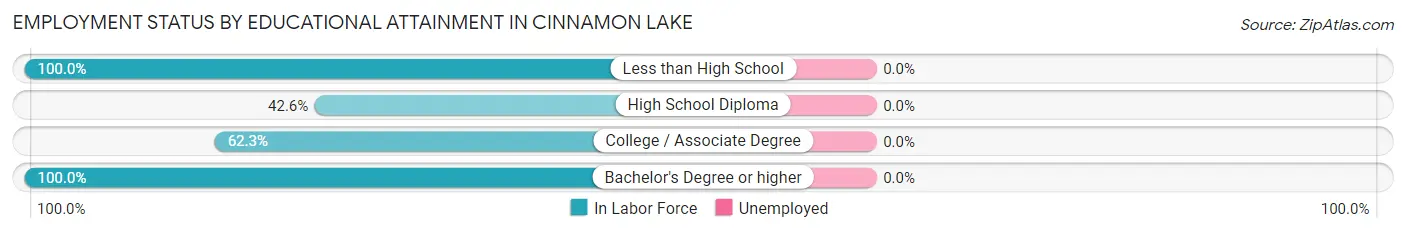
| Educational Attainment | In Labor Force | Unemployed |
| Less than High School | 28 (100.0%) | 0 (0.0%) |
| High School Diploma | 72 (42.6%) | 0 (0.0%) |
| College / Associate Degree | 177 (62.3%) | 0 (0.0%) |
| Bachelor's Degree or higher | 137 (100.0%) | 0 (0.0%) |
| Total | 414 (67.0%) | 0 (0.0%) |
Employment Occupations by Sex in Cinnamon Lake
Management, Business, Science and Arts Occupations
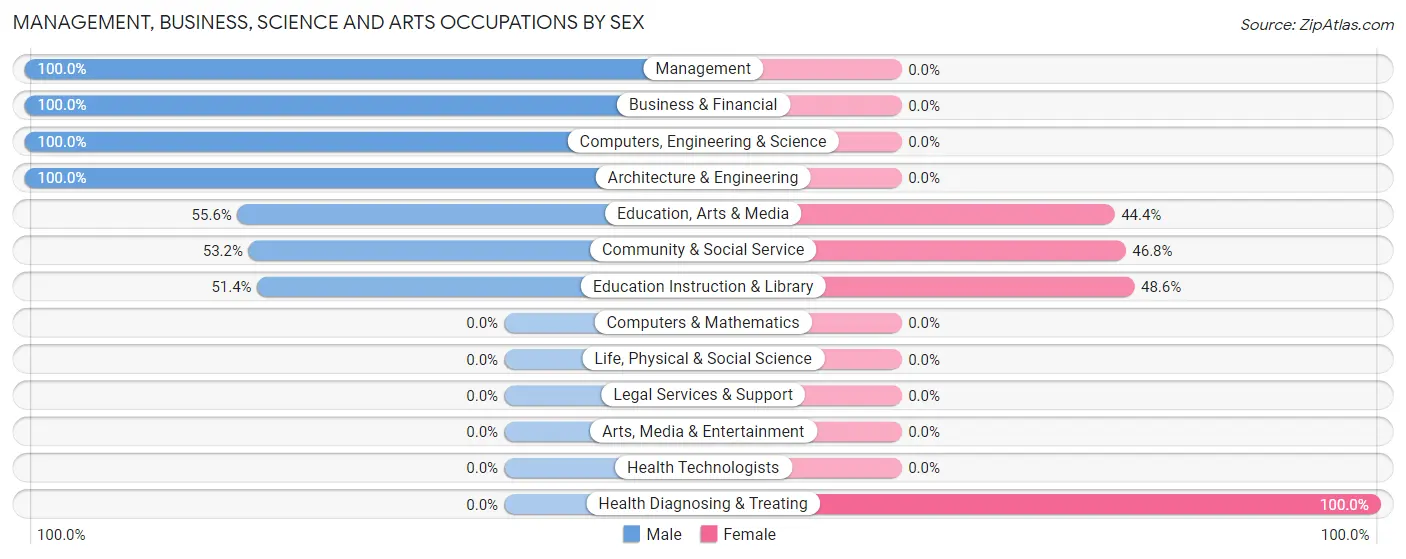
The most common Management, Business, Science and Arts occupations in Cinnamon Lake are Community & Social Service (62 | 13.4%), Computers, Engineering & Science (39 | 8.4%), Architecture & Engineering (39 | 8.4%), Education Instruction & Library (35 | 7.6%), and Management (31 | 6.7%).
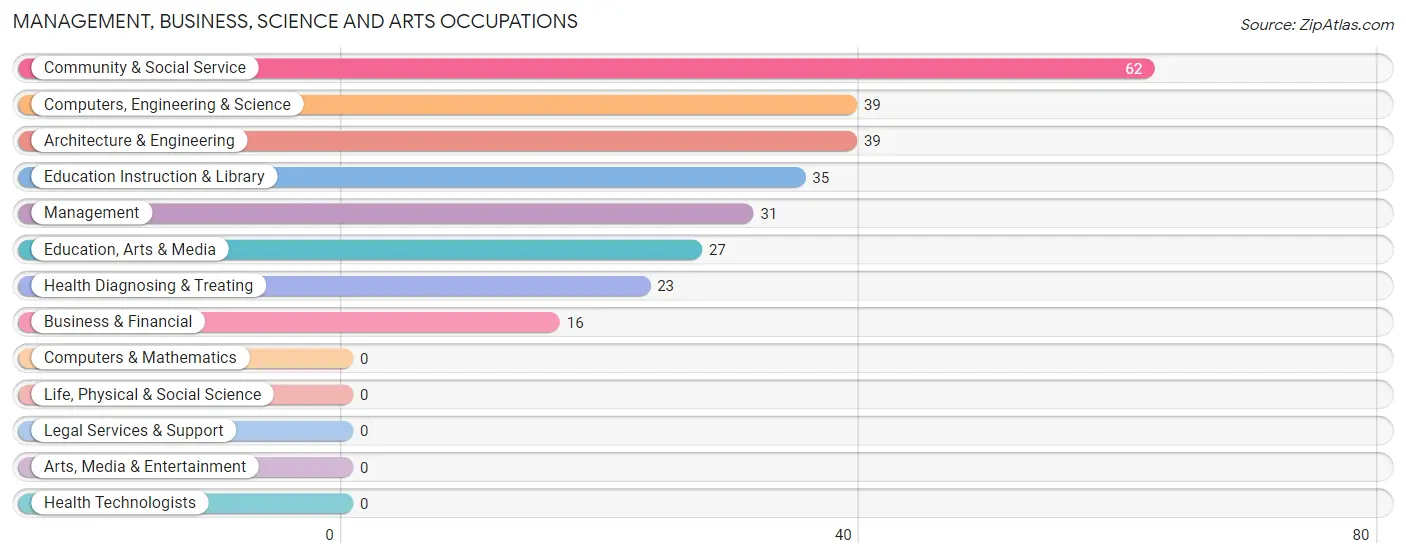
Management, Business, Science and Arts Occupations by Sex
Within the Management, Business, Science and Arts occupations in Cinnamon Lake, the most male-oriented occupations are Management (100.0%), Business & Financial (100.0%), and Computers, Engineering & Science (100.0%), while the most female-oriented occupations are Health Diagnosing & Treating (100.0%), Education Instruction & Library (48.6%), and Community & Social Service (46.8%).
| Occupation | Male | Female |
| Management | 31 (100.0%) | 0 (0.0%) |
| Business & Financial | 16 (100.0%) | 0 (0.0%) |
| Computers, Engineering & Science | 39 (100.0%) | 0 (0.0%) |
| Computers & Mathematics | 0 (0.0%) | 0 (0.0%) |
| Architecture & Engineering | 39 (100.0%) | 0 (0.0%) |
| Life, Physical & Social Science | 0 (0.0%) | 0 (0.0%) |
| Community & Social Service | 33 (53.2%) | 29 (46.8%) |
| Education, Arts & Media | 15 (55.6%) | 12 (44.4%) |
| Legal Services & Support | 0 (0.0%) | 0 (0.0%) |
| Education Instruction & Library | 18 (51.4%) | 17 (48.6%) |
| Arts, Media & Entertainment | 0 (0.0%) | 0 (0.0%) |
| Health Diagnosing & Treating | 0 (0.0%) | 23 (100.0%) |
| Health Technologists | 0 (0.0%) | 0 (0.0%) |
| Total (Category) | 119 (69.6%) | 52 (30.4%) |
| Total (Overall) | 324 (70.0%) | 139 (30.0%) |
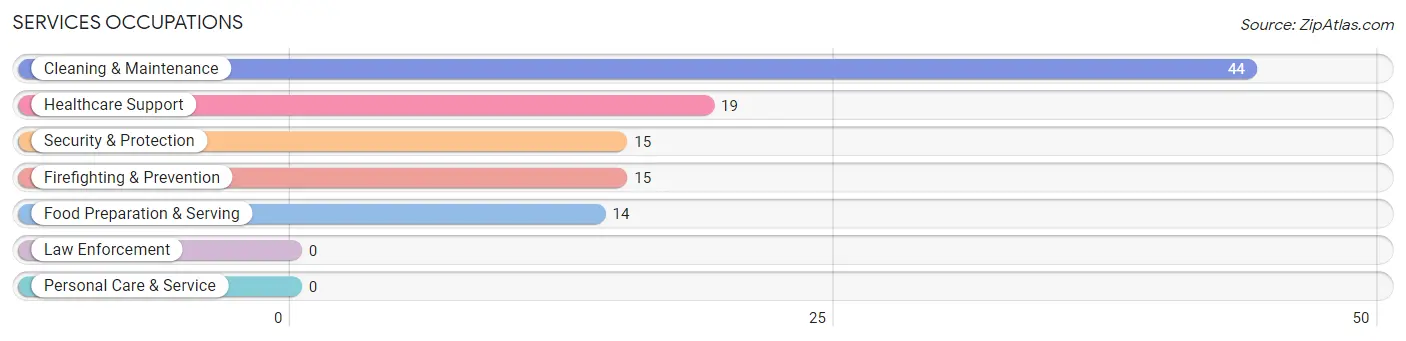
Services Occupations
The most common Services occupations in Cinnamon Lake are Cleaning & Maintenance (44 | 9.5%), Healthcare Support (19 | 4.1%), Security & Protection (15 | 3.2%), Firefighting & Prevention (15 | 3.2%), and Food Preparation & Serving (14 | 3.0%).
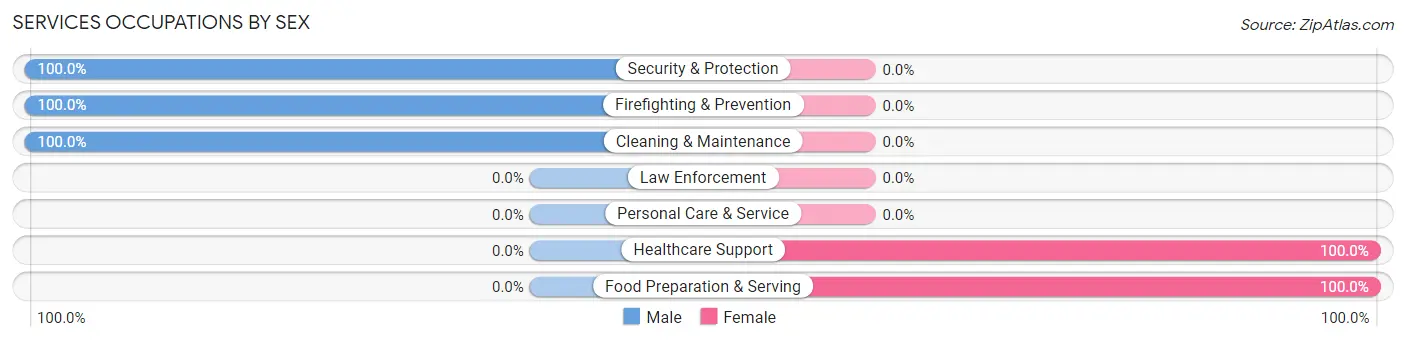
Services Occupations by Sex
Within the Services occupations in Cinnamon Lake, the most male-oriented occupations are Security & Protection (100.0%), Firefighting & Prevention (100.0%), and Cleaning & Maintenance (100.0%), while the most female-oriented occupations are Healthcare Support (100.0%), and Food Preparation & Serving (100.0%).
| Occupation | Male | Female |
| Healthcare Support | 0 (0.0%) | 19 (100.0%) |
| Security & Protection | 15 (100.0%) | 0 (0.0%) |
| Firefighting & Prevention | 15 (100.0%) | 0 (0.0%) |
| Law Enforcement | 0 (0.0%) | 0 (0.0%) |
| Food Preparation & Serving | 0 (0.0%) | 14 (100.0%) |
| Cleaning & Maintenance | 44 (100.0%) | 0 (0.0%) |
| Personal Care & Service | 0 (0.0%) | 0 (0.0%) |
| Total (Category) | 59 (64.1%) | 33 (35.9%) |
| Total (Overall) | 324 (70.0%) | 139 (30.0%) |
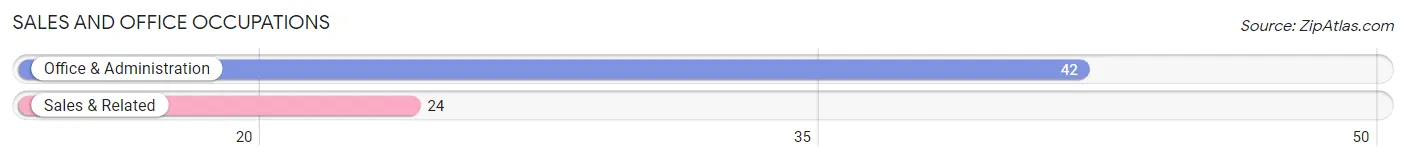
Sales and Office Occupations
The most common Sales and Office occupations in Cinnamon Lake are Office & Administration (42 | 9.1%), and Sales & Related (24 | 5.2%).
Sales and Office Occupations by Sex
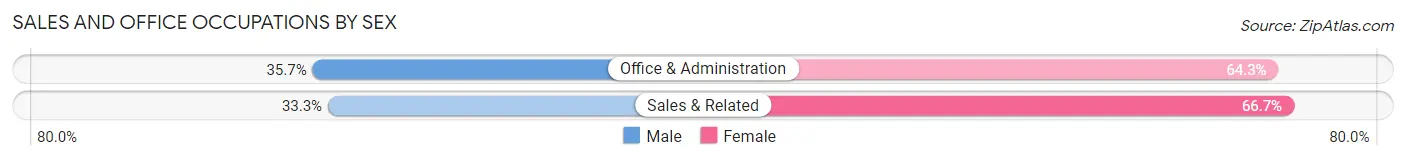
| Occupation | Male | Female |
| Sales & Related | 8 (33.3%) | 16 (66.7%) |
| Office & Administration | 15 (35.7%) | 27 (64.3%) |
| Total (Category) | 23 (34.8%) | 43 (65.1%) |
| Total (Overall) | 324 (70.0%) | 139 (30.0%) |
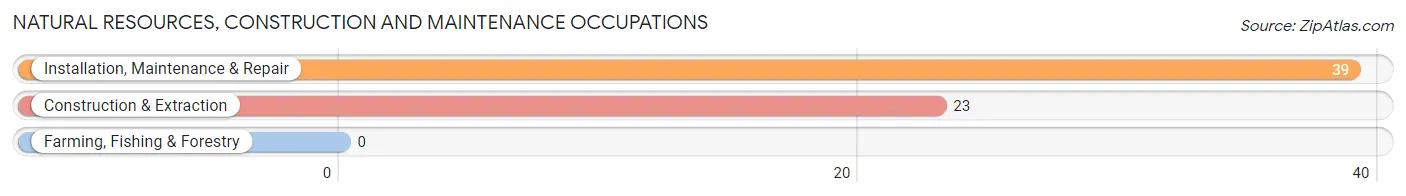
Natural Resources, Construction and Maintenance Occupations
The most common Natural Resources, Construction and Maintenance occupations in Cinnamon Lake are Installation, Maintenance & Repair (39 | 8.4%), and Construction & Extraction (23 | 5.0%).
Natural Resources, Construction and Maintenance Occupations by Sex
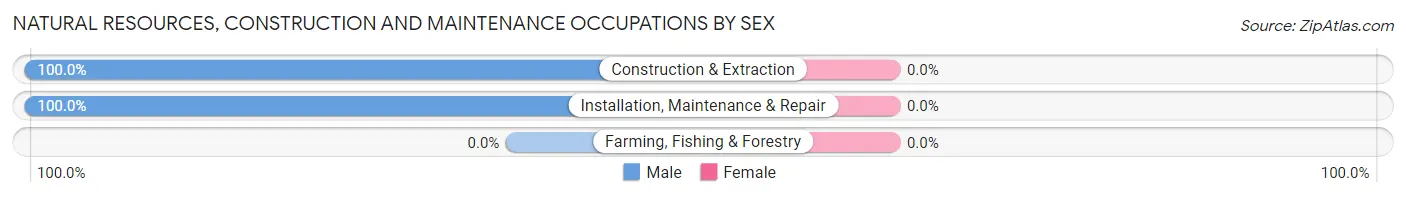
| Occupation | Male | Female |
| Farming, Fishing & Forestry | 0 (0.0%) | 0 (0.0%) |
| Construction & Extraction | 23 (100.0%) | 0 (0.0%) |
| Installation, Maintenance & Repair | 39 (100.0%) | 0 (0.0%) |
| Total (Category) | 62 (100.0%) | 0 (0.0%) |
| Total (Overall) | 324 (70.0%) | 139 (30.0%) |
Production, Transportation and Moving Occupations
The most common Production, Transportation and Moving occupations in Cinnamon Lake are , and Transportation (72 | 15.5%).
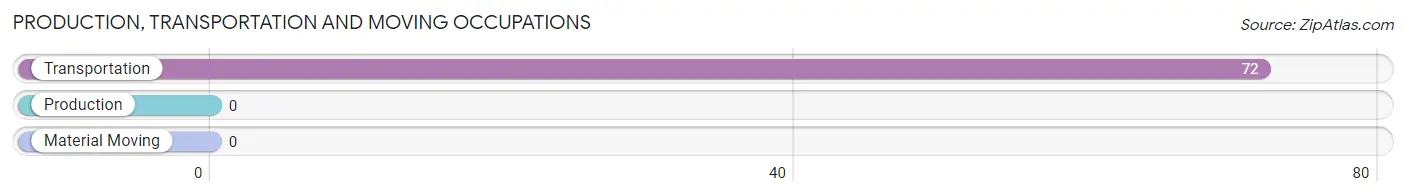
Production, Transportation and Moving Occupations by Sex
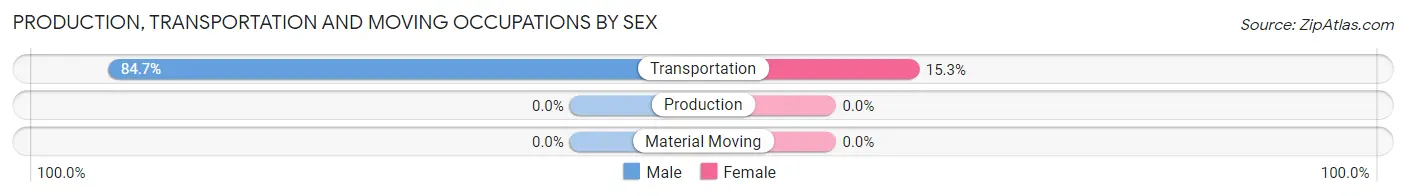
| Occupation | Male | Female |
| Production | 0 (0.0%) | 0 (0.0%) |
| Transportation | 61 (84.7%) | 11 (15.3%) |
| Material Moving | 0 (0.0%) | 0 (0.0%) |
| Total (Category) | 61 (84.7%) | 11 (15.3%) |
| Total (Overall) | 324 (70.0%) | 139 (30.0%) |
Employment Industries by Sex in Cinnamon Lake
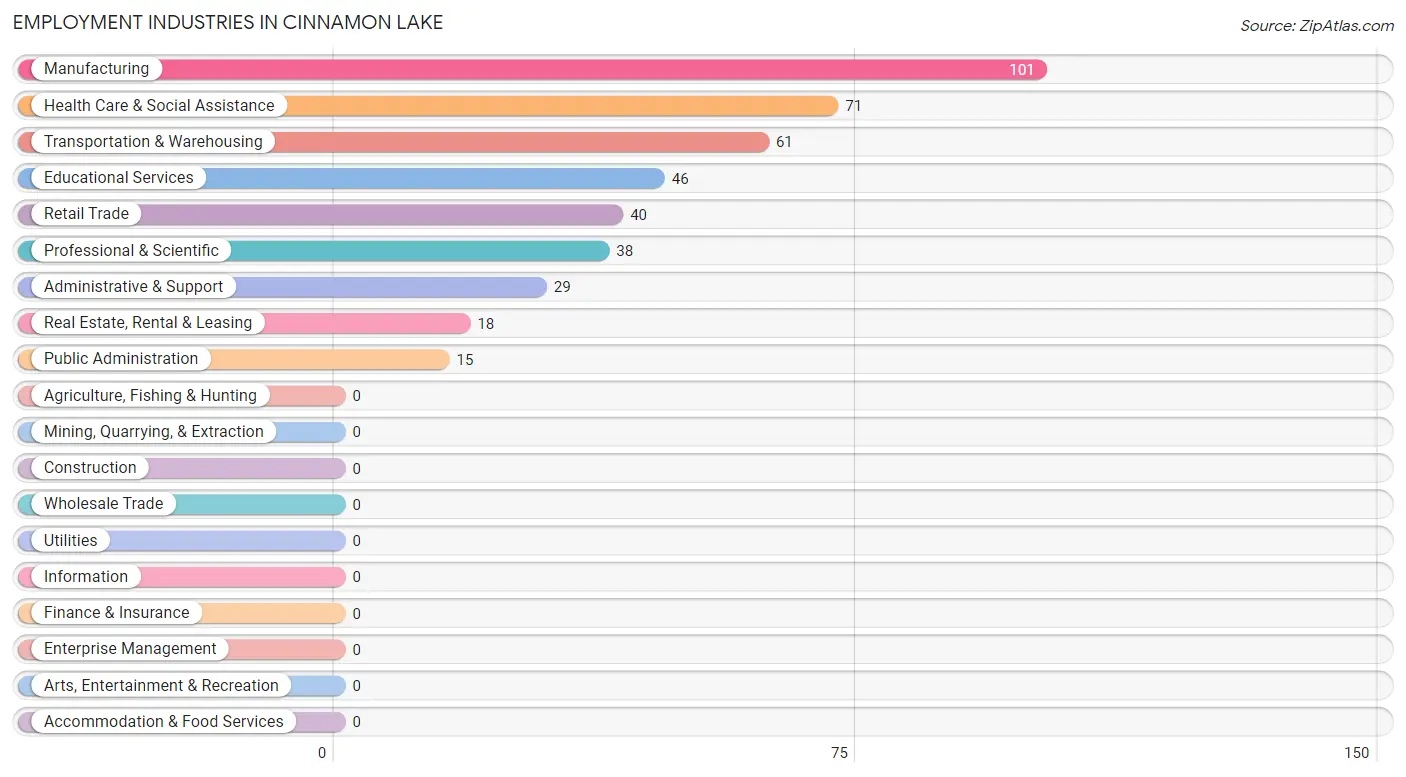
Employment Industries in Cinnamon Lake
The major employment industries in Cinnamon Lake include Manufacturing (101 | 21.8%), Health Care & Social Assistance (71 | 15.3%), Transportation & Warehousing (61 | 13.2%), Educational Services (46 | 9.9%), and Retail Trade (40 | 8.6%).
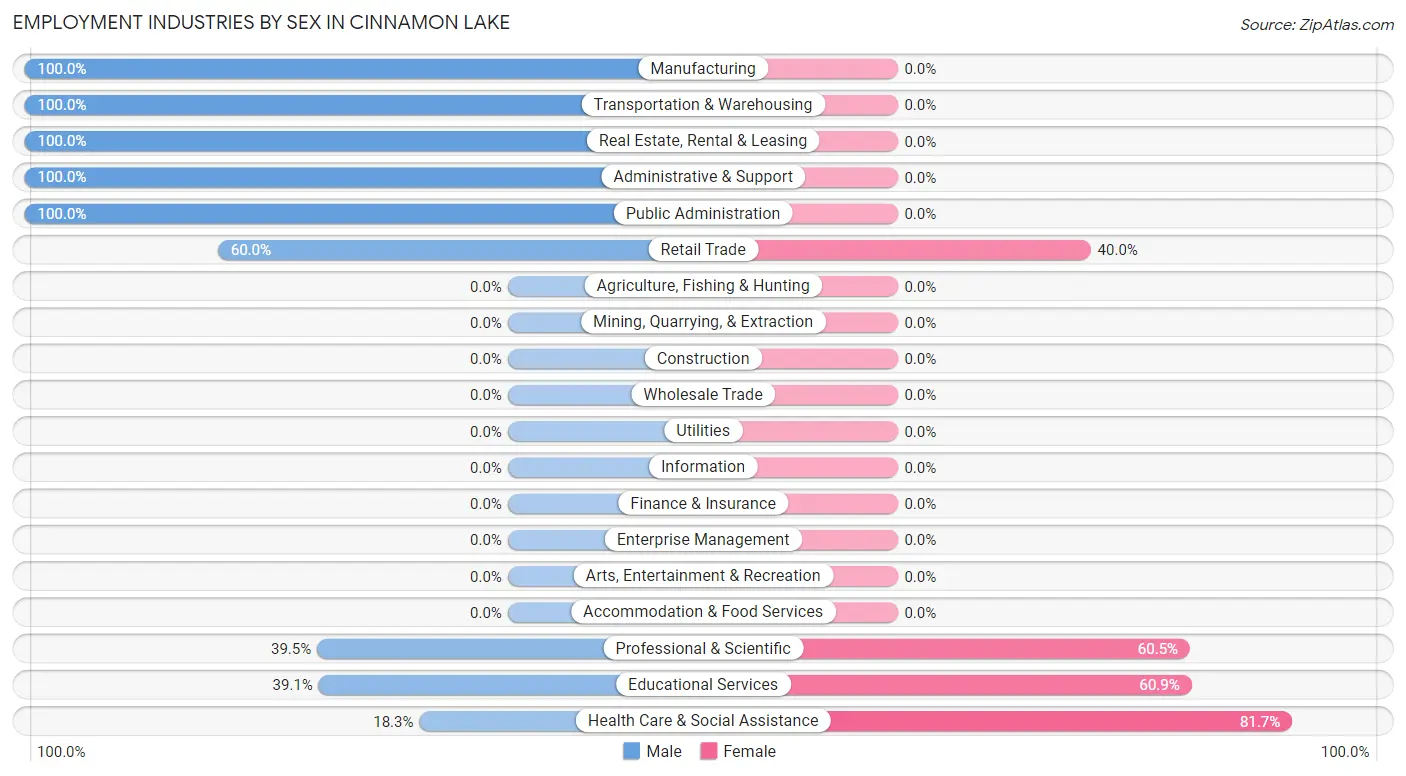
Employment Industries by Sex in Cinnamon Lake
The Cinnamon Lake industries that see more men than women are Manufacturing (100.0%), Transportation & Warehousing (100.0%), and Real Estate, Rental & Leasing (100.0%), whereas the industries that tend to have a higher number of women are Health Care & Social Assistance (81.7%), Educational Services (60.9%), and Professional & Scientific (60.5%).
| Industry | Male | Female |
| Agriculture, Fishing & Hunting | 0 (0.0%) | 0 (0.0%) |
| Mining, Quarrying, & Extraction | 0 (0.0%) | 0 (0.0%) |
| Construction | 0 (0.0%) | 0 (0.0%) |
| Manufacturing | 101 (100.0%) | 0 (0.0%) |
| Wholesale Trade | 0 (0.0%) | 0 (0.0%) |
| Retail Trade | 24 (60.0%) | 16 (40.0%) |
| Transportation & Warehousing | 61 (100.0%) | 0 (0.0%) |
| Utilities | 0 (0.0%) | 0 (0.0%) |
| Information | 0 (0.0%) | 0 (0.0%) |
| Finance & Insurance | 0 (0.0%) | 0 (0.0%) |
| Real Estate, Rental & Leasing | 18 (100.0%) | 0 (0.0%) |
| Professional & Scientific | 15 (39.5%) | 23 (60.5%) |
| Enterprise Management | 0 (0.0%) | 0 (0.0%) |
| Administrative & Support | 29 (100.0%) | 0 (0.0%) |
| Educational Services | 18 (39.1%) | 28 (60.9%) |
| Health Care & Social Assistance | 13 (18.3%) | 58 (81.7%) |
| Arts, Entertainment & Recreation | 0 (0.0%) | 0 (0.0%) |
| Accommodation & Food Services | 0 (0.0%) | 0 (0.0%) |
| Public Administration | 15 (100.0%) | 0 (0.0%) |
| Total | 324 (70.0%) | 139 (30.0%) |
Education in Cinnamon Lake
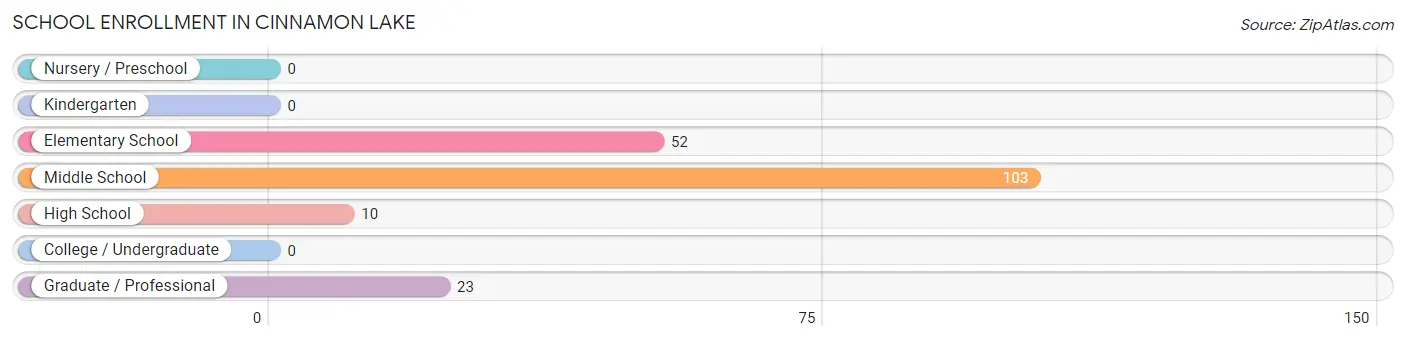
School Enrollment in Cinnamon Lake
The most common levels of schooling among the 188 students in Cinnamon Lake are middle school (103 | 54.8%), elementary school (52 | 27.7%), and graduate / professional (23 | 12.2%).
| School Level | # Students | % Students |
| Nursery / Preschool | 0 | 0.0% |
| Kindergarten | 0 | 0.0% |
| Elementary School | 52 | 27.7% |
| Middle School | 103 | 54.8% |
| High School | 10 | 5.3% |
| College / Undergraduate | 0 | 0.0% |
| Graduate / Professional | 23 | 12.2% |
| Total | 188 | 100.0% |
School Enrollment by Age by Funding Source in Cinnamon Lake
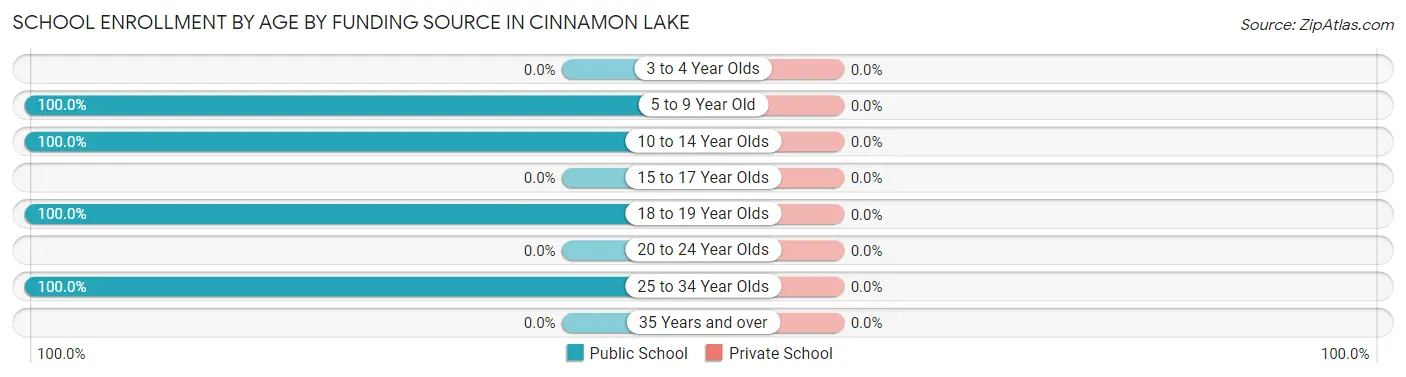
| Age Bracket | Public School | Private School |
| 3 to 4 Year Olds | 0 (0.0%) | 0 (0.0%) |
| 5 to 9 Year Old | 52 (100.0%) | 0 (0.0%) |
| 10 to 14 Year Olds | 103 (100.0%) | 0 (0.0%) |
| 15 to 17 Year Olds | 0 (0.0%) | 0 (0.0%) |
| 18 to 19 Year Olds | 10 (100.0%) | 0 (0.0%) |
| 20 to 24 Year Olds | 0 (0.0%) | 0 (0.0%) |
| 25 to 34 Year Olds | 23 (100.0%) | 0 (0.0%) |
| 35 Years and over | 0 (0.0%) | 0 (0.0%) |
| Total | 188 (100.0%) | 0 (0.0%) |
Educational Attainment by Field of Study in Cinnamon Lake
Business (67 | 35.8%), education (32 | 17.1%), engineering (25 | 13.4%), arts & humanities (23 | 12.3%), and social sciences (15 | 8.0%) are the most common fields of study among 187 individuals in Cinnamon Lake who have obtained a bachelor's degree or higher.
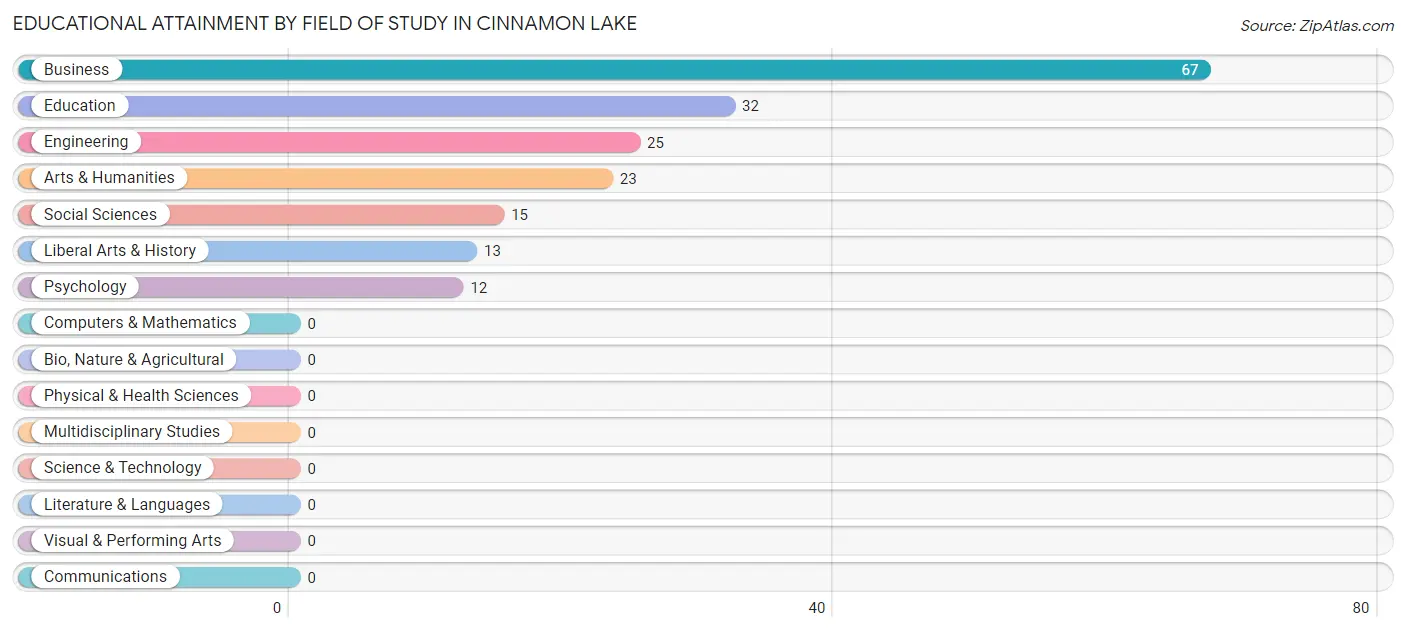
| Field of Study | # Graduates | % Graduates |
| Computers & Mathematics | 0 | 0.0% |
| Bio, Nature & Agricultural | 0 | 0.0% |
| Physical & Health Sciences | 0 | 0.0% |
| Psychology | 12 | 6.4% |
| Social Sciences | 15 | 8.0% |
| Engineering | 25 | 13.4% |
| Multidisciplinary Studies | 0 | 0.0% |
| Science & Technology | 0 | 0.0% |
| Business | 67 | 35.8% |
| Education | 32 | 17.1% |
| Literature & Languages | 0 | 0.0% |
| Liberal Arts & History | 13 | 7.0% |
| Visual & Performing Arts | 0 | 0.0% |
| Communications | 0 | 0.0% |
| Arts & Humanities | 23 | 12.3% |
| Total | 187 | 100.0% |
Transportation & Commute in Cinnamon Lake
Vehicle Availability by Sex in Cinnamon Lake
The most prevalent vehicle ownership categories in Cinnamon Lake are males with 2 vehicles (139, accounting for 42.9%) and females with 2 vehicles (97, making up 100.0%).
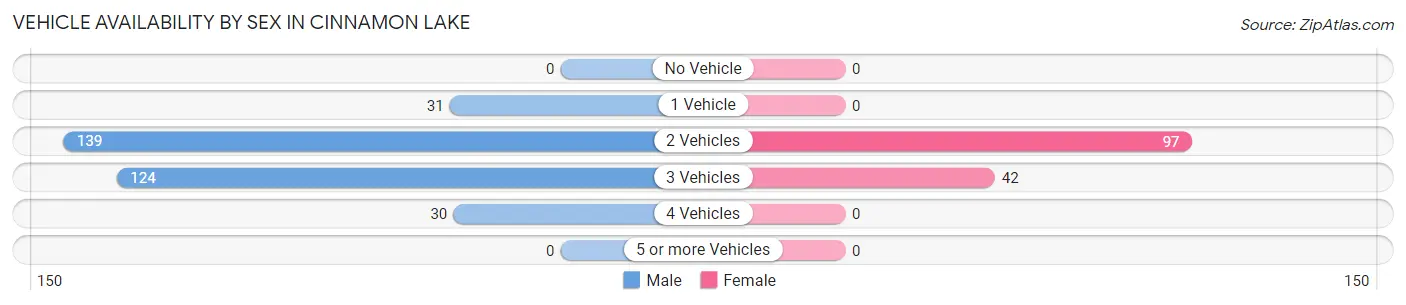
| Vehicles Available | Male | Female |
| No Vehicle | 0 (0.0%) | 0 (0.0%) |
| 1 Vehicle | 31 (9.6%) | 0 (0.0%) |
| 2 Vehicles | 139 (42.9%) | 97 (69.8%) |
| 3 Vehicles | 124 (38.3%) | 42 (30.2%) |
| 4 Vehicles | 30 (9.3%) | 0 (0.0%) |
| 5 or more Vehicles | 0 (0.0%) | 0 (0.0%) |
| Total | 324 (100.0%) | 139 (100.0%) |
Commute Time in Cinnamon Lake
The most frequently occuring commute durations in Cinnamon Lake are 20 to 24 minutes (105 commuters, 22.7%), 5 to 9 minutes (91 commuters, 19.7%), and 10 to 14 minutes (53 commuters, 11.5%).
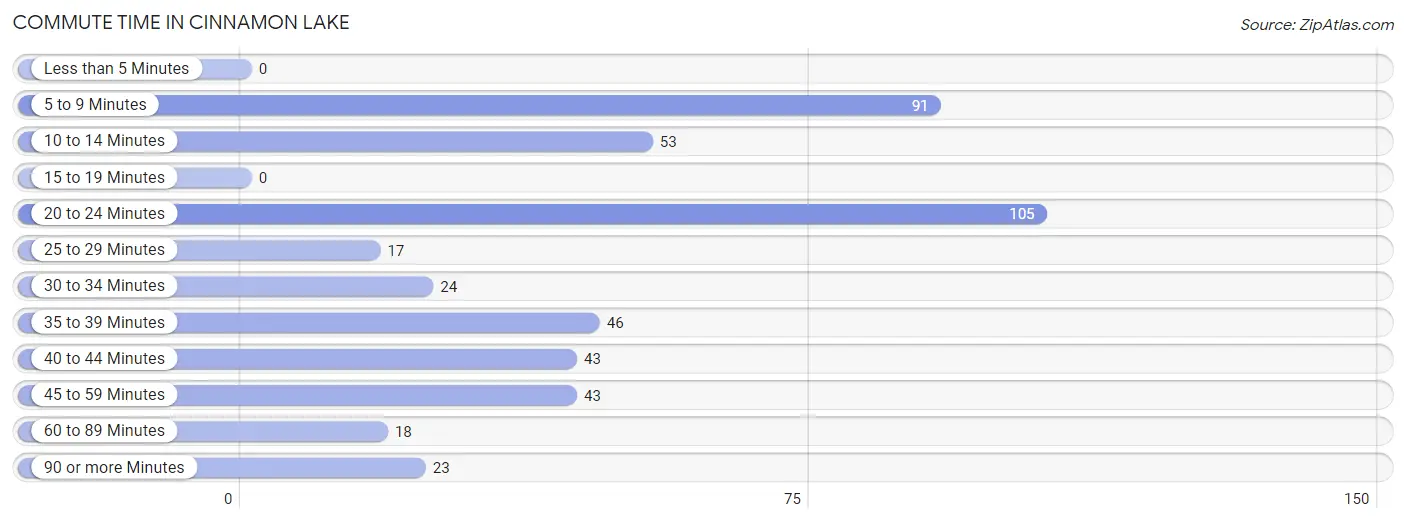
| Commute Time | # Commuters | % Commuters |
| Less than 5 Minutes | 0 | 0.0% |
| 5 to 9 Minutes | 91 | 19.7% |
| 10 to 14 Minutes | 53 | 11.5% |
| 15 to 19 Minutes | 0 | 0.0% |
| 20 to 24 Minutes | 105 | 22.7% |
| 25 to 29 Minutes | 17 | 3.7% |
| 30 to 34 Minutes | 24 | 5.2% |
| 35 to 39 Minutes | 46 | 9.9% |
| 40 to 44 Minutes | 43 | 9.3% |
| 45 to 59 Minutes | 43 | 9.3% |
| 60 to 89 Minutes | 18 | 3.9% |
| 90 or more Minutes | 23 | 5.0% |
Commute Time by Sex in Cinnamon Lake
The most common commute times in Cinnamon Lake are 5 to 9 minutes (91 commuters, 28.1%) for males and 35 to 39 minutes (46 commuters, 33.1%) for females.
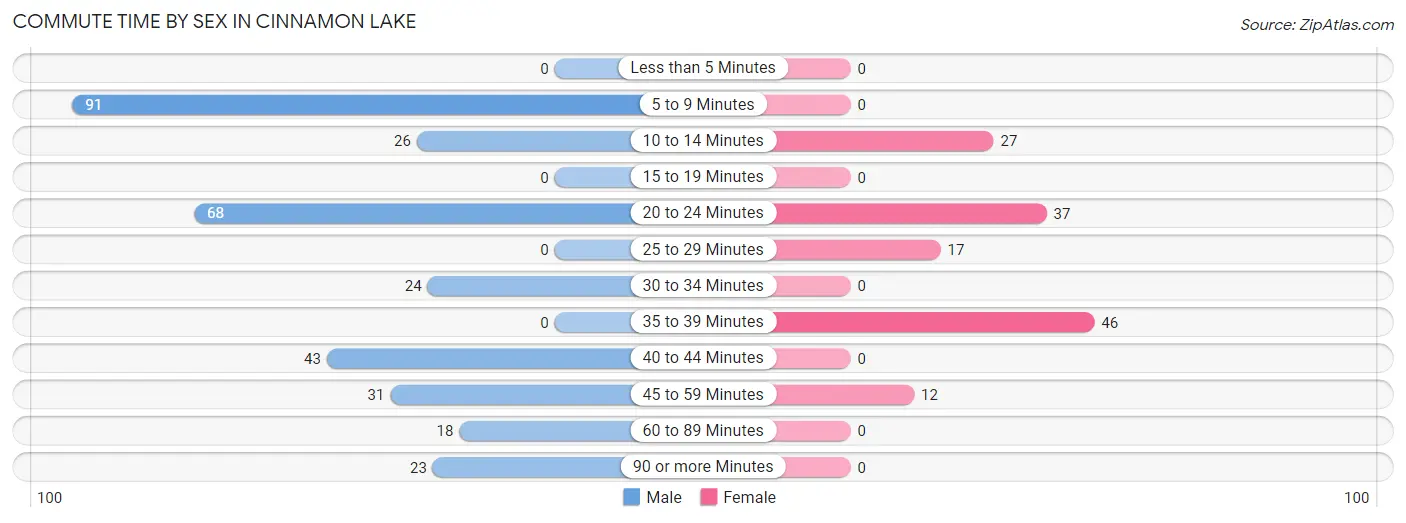
| Commute Time | Male | Female |
| Less than 5 Minutes | 0 (0.0%) | 0 (0.0%) |
| 5 to 9 Minutes | 91 (28.1%) | 0 (0.0%) |
| 10 to 14 Minutes | 26 (8.0%) | 27 (19.4%) |
| 15 to 19 Minutes | 0 (0.0%) | 0 (0.0%) |
| 20 to 24 Minutes | 68 (21.0%) | 37 (26.6%) |
| 25 to 29 Minutes | 0 (0.0%) | 17 (12.2%) |
| 30 to 34 Minutes | 24 (7.4%) | 0 (0.0%) |
| 35 to 39 Minutes | 0 (0.0%) | 46 (33.1%) |
| 40 to 44 Minutes | 43 (13.3%) | 0 (0.0%) |
| 45 to 59 Minutes | 31 (9.6%) | 12 (8.6%) |
| 60 to 89 Minutes | 18 (5.6%) | 0 (0.0%) |
| 90 or more Minutes | 23 (7.1%) | 0 (0.0%) |
Time of Departure to Work by Sex in Cinnamon Lake
The most frequent times of departure to work in Cinnamon Lake are 7:30 AM to 7:59 AM (162, 50.0%) for males and 11:00 AM to 11:59 AM (37, 26.6%) for females.
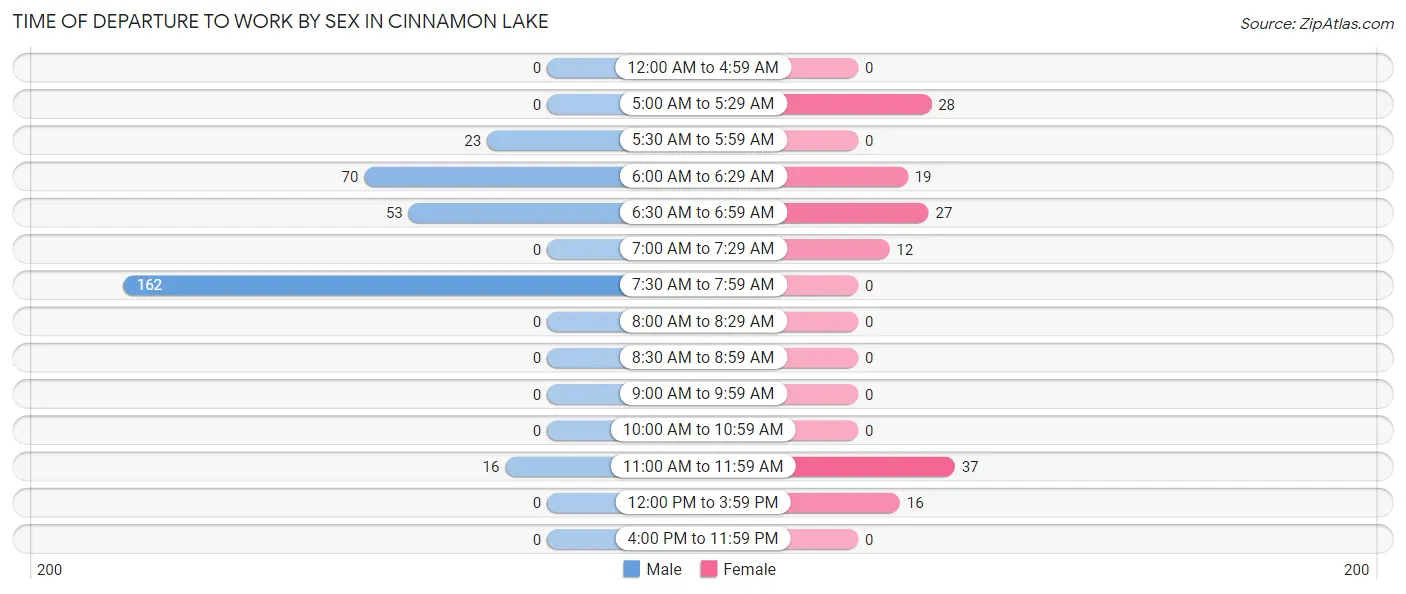
| Time of Departure | Male | Female |
| 12:00 AM to 4:59 AM | 0 (0.0%) | 0 (0.0%) |
| 5:00 AM to 5:29 AM | 0 (0.0%) | 28 (20.1%) |
| 5:30 AM to 5:59 AM | 23 (7.1%) | 0 (0.0%) |
| 6:00 AM to 6:29 AM | 70 (21.6%) | 19 (13.7%) |
| 6:30 AM to 6:59 AM | 53 (16.4%) | 27 (19.4%) |
| 7:00 AM to 7:29 AM | 0 (0.0%) | 12 (8.6%) |
| 7:30 AM to 7:59 AM | 162 (50.0%) | 0 (0.0%) |
| 8:00 AM to 8:29 AM | 0 (0.0%) | 0 (0.0%) |
| 8:30 AM to 8:59 AM | 0 (0.0%) | 0 (0.0%) |
| 9:00 AM to 9:59 AM | 0 (0.0%) | 0 (0.0%) |
| 10:00 AM to 10:59 AM | 0 (0.0%) | 0 (0.0%) |
| 11:00 AM to 11:59 AM | 16 (4.9%) | 37 (26.6%) |
| 12:00 PM to 3:59 PM | 0 (0.0%) | 16 (11.5%) |
| 4:00 PM to 11:59 PM | 0 (0.0%) | 0 (0.0%) |
| Total | 324 (100.0%) | 139 (100.0%) |
Housing Occupancy in Cinnamon Lake
Occupancy by Ownership in Cinnamon Lake
Of the total 495 dwellings in Cinnamon Lake, owner-occupied units account for 465 (93.9%), while renter-occupied units make up 30 (6.1%).
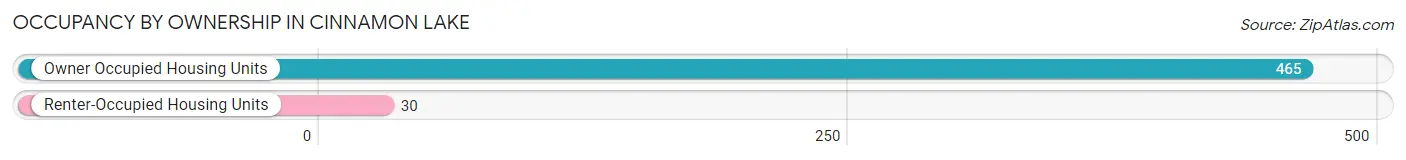
| Occupancy | # Housing Units | % Housing Units |
| Owner Occupied Housing Units | 465 | 93.9% |
| Renter-Occupied Housing Units | 30 | 6.1% |
| Total Occupied Housing Units | 495 | 100.0% |
Occupancy by Household Size in Cinnamon Lake
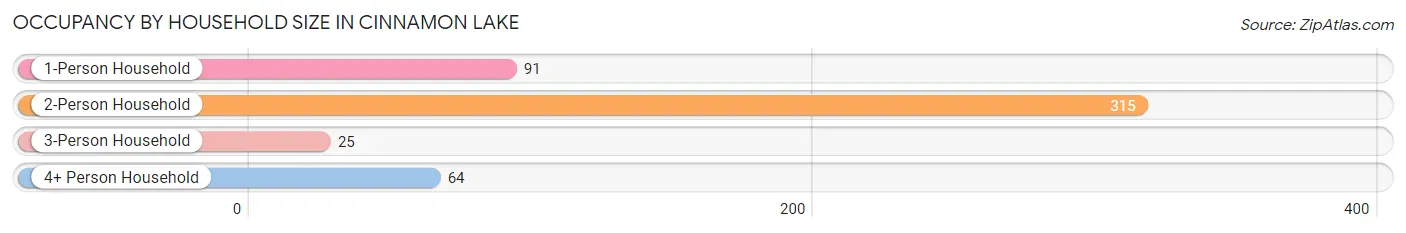
| Household Size | # Housing Units | % Housing Units |
| 1-Person Household | 91 | 18.4% |
| 2-Person Household | 315 | 63.6% |
| 3-Person Household | 25 | 5.1% |
| 4+ Person Household | 64 | 12.9% |
| Total Housing Units | 495 | 100.0% |
Occupancy by Ownership by Household Size in Cinnamon Lake
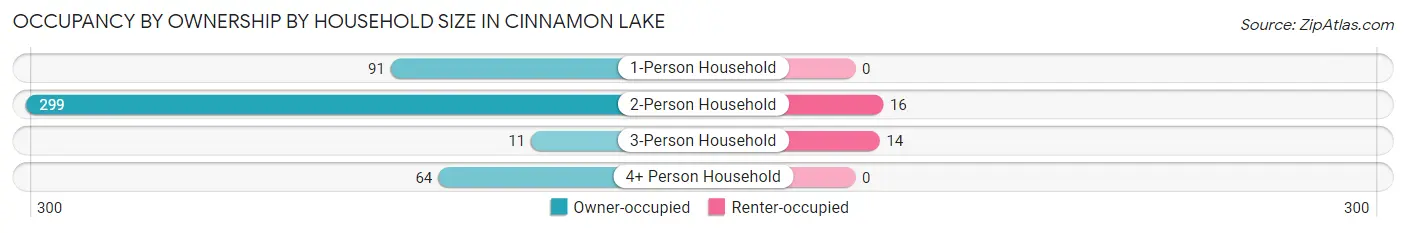
| Household Size | Owner-occupied | Renter-occupied |
| 1-Person Household | 91 (100.0%) | 0 (0.0%) |
| 2-Person Household | 299 (94.9%) | 16 (5.1%) |
| 3-Person Household | 11 (44.0%) | 14 (56.0%) |
| 4+ Person Household | 64 (100.0%) | 0 (0.0%) |
| Total Housing Units | 465 (93.9%) | 30 (6.1%) |
Occupancy by Educational Attainment in Cinnamon Lake
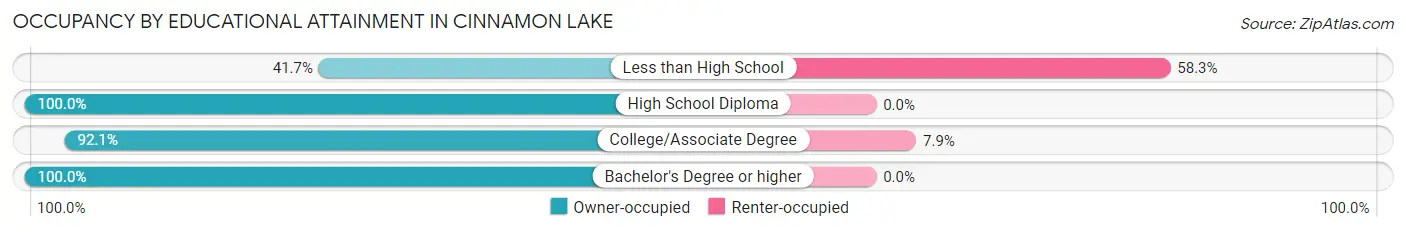
| Household Size | Owner-occupied | Renter-occupied |
| Less than High School | 10 (41.7%) | 14 (58.3%) |
| High School Diploma | 163 (100.0%) | 0 (0.0%) |
| College/Associate Degree | 186 (92.1%) | 16 (7.9%) |
| Bachelor's Degree or higher | 106 (100.0%) | 0 (0.0%) |
Occupancy by Age of Householder in Cinnamon Lake
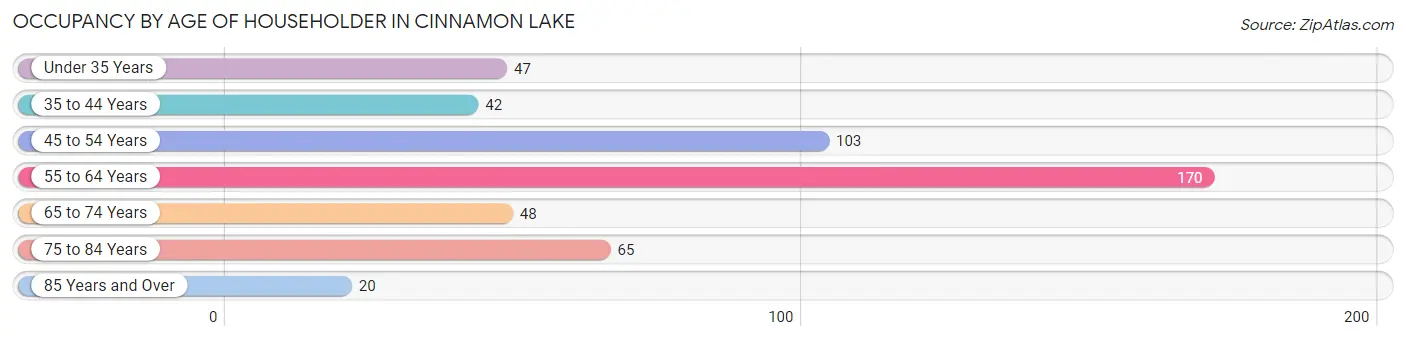
| Age Bracket | # Households | % Households |
| Under 35 Years | 47 | 9.5% |
| 35 to 44 Years | 42 | 8.5% |
| 45 to 54 Years | 103 | 20.8% |
| 55 to 64 Years | 170 | 34.3% |
| 65 to 74 Years | 48 | 9.7% |
| 75 to 84 Years | 65 | 13.1% |
| 85 Years and Over | 20 | 4.0% |
| Total | 495 | 100.0% |
Housing Finances in Cinnamon Lake
Median Income by Occupancy in Cinnamon Lake
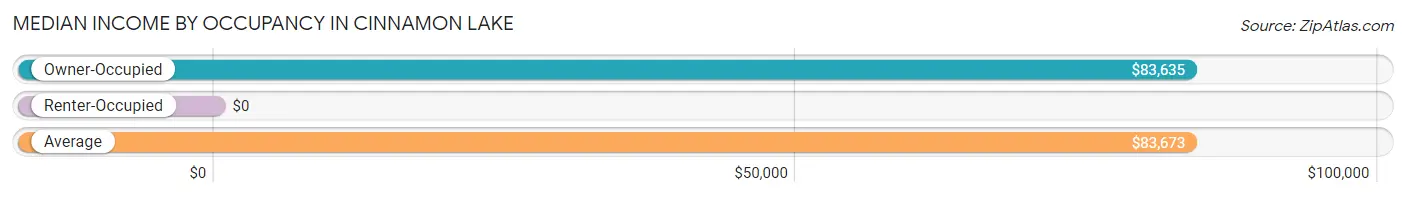
| Occupancy Type | # Households | Median Income |
| Owner-Occupied | 465 (93.9%) | $83,635 |
| Renter-Occupied | 30 (6.1%) | $0 |
| Average | 495 (100.0%) | $83,673 |
Occupancy by Householder Income Bracket in Cinnamon Lake
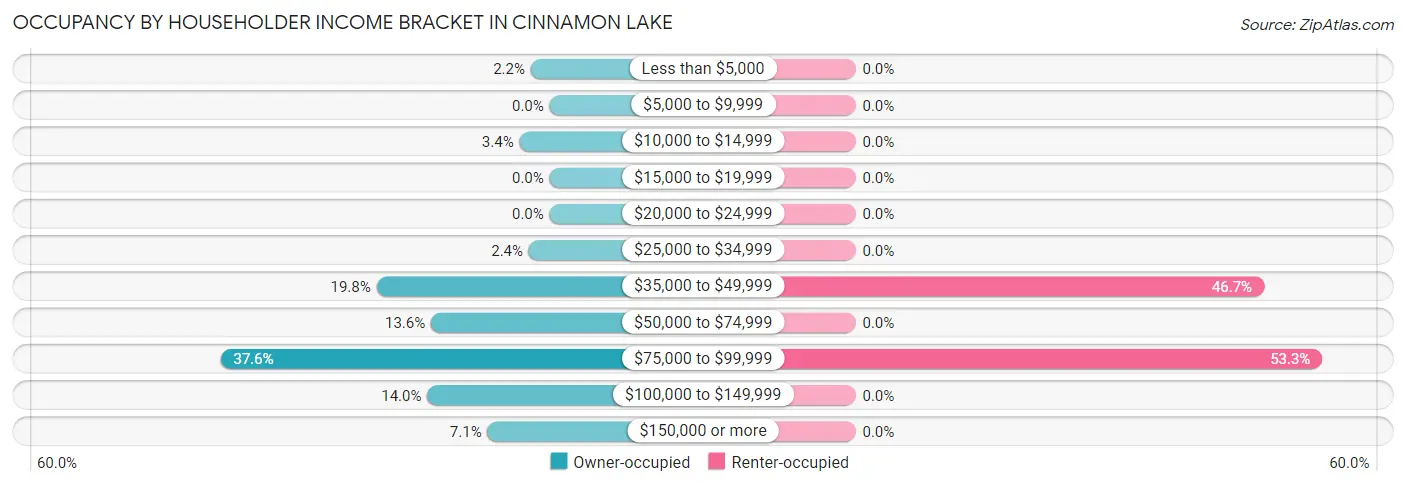
| Income Bracket | Owner-occupied | Renter-occupied |
| Less than $5,000 | 10 (2.1%) | 0 (0.0%) |
| $5,000 to $9,999 | 0 (0.0%) | 0 (0.0%) |
| $10,000 to $14,999 | 16 (3.4%) | 0 (0.0%) |
| $15,000 to $19,999 | 0 (0.0%) | 0 (0.0%) |
| $20,000 to $24,999 | 0 (0.0%) | 0 (0.0%) |
| $25,000 to $34,999 | 11 (2.4%) | 0 (0.0%) |
| $35,000 to $49,999 | 92 (19.8%) | 14 (46.7%) |
| $50,000 to $74,999 | 63 (13.6%) | 0 (0.0%) |
| $75,000 to $99,999 | 175 (37.6%) | 16 (53.3%) |
| $100,000 to $149,999 | 65 (14.0%) | 0 (0.0%) |
| $150,000 or more | 33 (7.1%) | 0 (0.0%) |
| Total | 465 (100.0%) | 30 (100.0%) |
Monthly Housing Cost Tiers in Cinnamon Lake
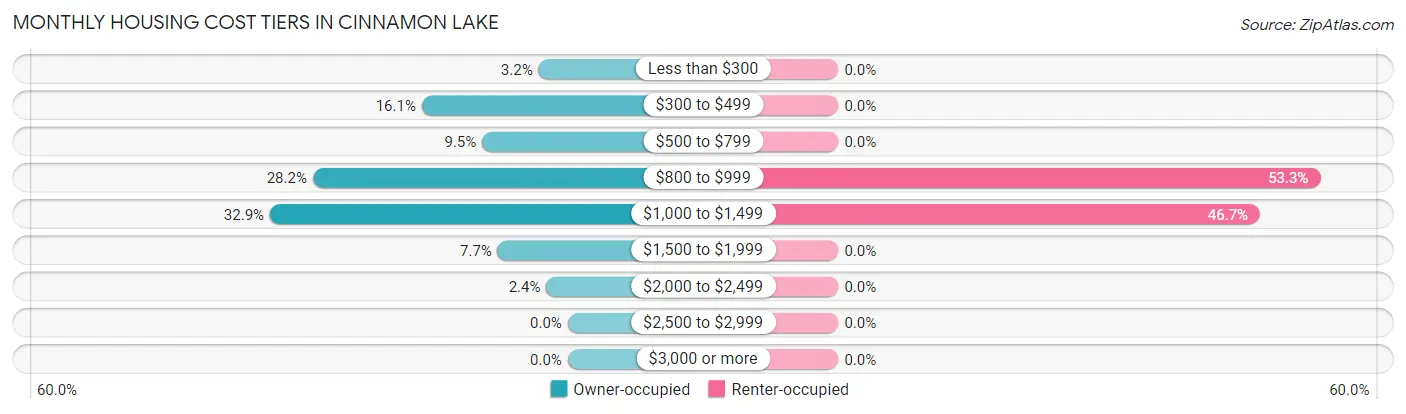
| Monthly Cost | Owner-occupied | Renter-occupied |
| Less than $300 | 15 (3.2%) | 0 (0.0%) |
| $300 to $499 | 75 (16.1%) | 0 (0.0%) |
| $500 to $799 | 44 (9.5%) | 0 (0.0%) |
| $800 to $999 | 131 (28.2%) | 16 (53.3%) |
| $1,000 to $1,499 | 153 (32.9%) | 14 (46.7%) |
| $1,500 to $1,999 | 36 (7.7%) | 0 (0.0%) |
| $2,000 to $2,499 | 11 (2.4%) | 0 (0.0%) |
| $2,500 to $2,999 | 0 (0.0%) | 0 (0.0%) |
| $3,000 or more | 0 (0.0%) | 0 (0.0%) |
| Total | 465 (100.0%) | 30 (100.0%) |
Physical Housing Characteristics in Cinnamon Lake
Housing Structures in Cinnamon Lake
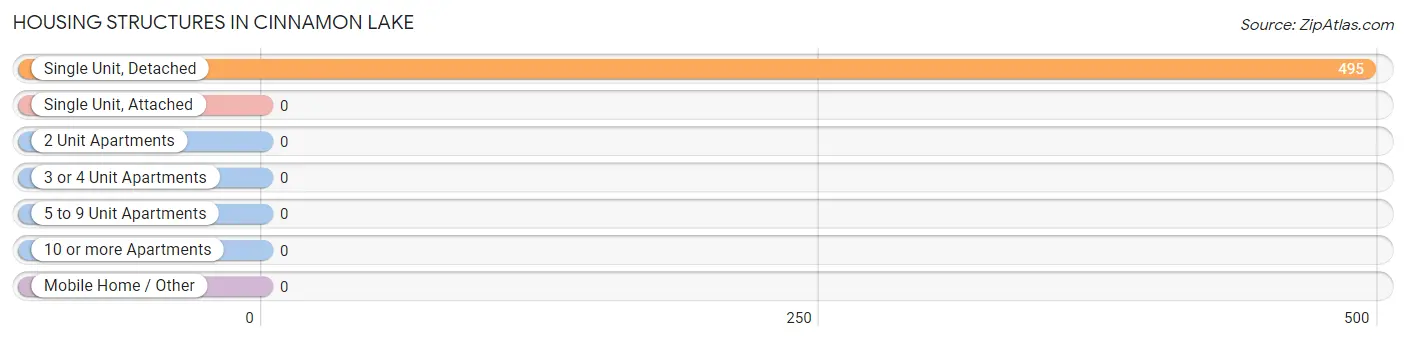
| Structure Type | # Housing Units | % Housing Units |
| Single Unit, Detached | 495 | 100.0% |
| Single Unit, Attached | 0 | 0.0% |
| 2 Unit Apartments | 0 | 0.0% |
| 3 or 4 Unit Apartments | 0 | 0.0% |
| 5 to 9 Unit Apartments | 0 | 0.0% |
| 10 or more Apartments | 0 | 0.0% |
| Mobile Home / Other | 0 | 0.0% |
| Total | 495 | 100.0% |
Housing Structures by Occupancy in Cinnamon Lake
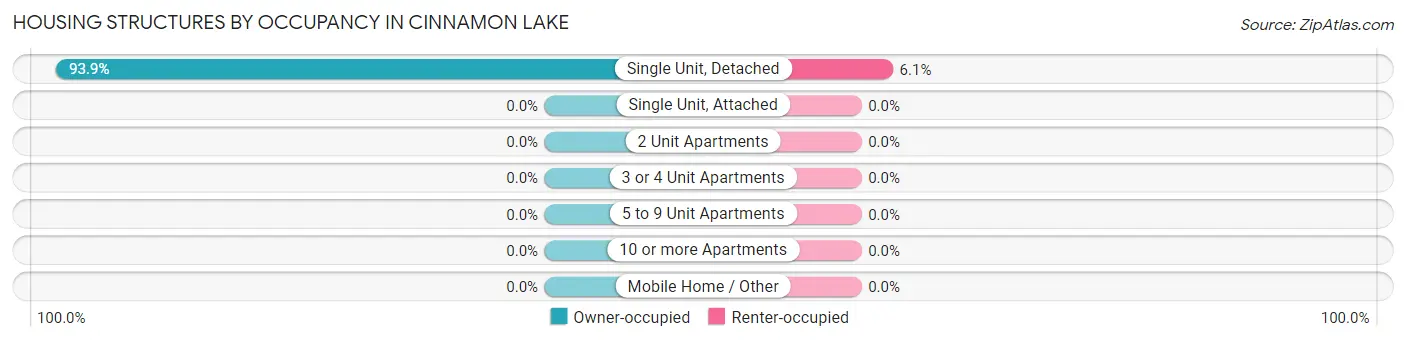
| Structure Type | Owner-occupied | Renter-occupied |
| Single Unit, Detached | 465 (93.9%) | 30 (6.1%) |
| Single Unit, Attached | 0 (0.0%) | 0 (0.0%) |
| 2 Unit Apartments | 0 (0.0%) | 0 (0.0%) |
| 3 or 4 Unit Apartments | 0 (0.0%) | 0 (0.0%) |
| 5 to 9 Unit Apartments | 0 (0.0%) | 0 (0.0%) |
| 10 or more Apartments | 0 (0.0%) | 0 (0.0%) |
| Mobile Home / Other | 0 (0.0%) | 0 (0.0%) |
| Total | 465 (93.9%) | 30 (6.1%) |
Housing Structures by Number of Rooms in Cinnamon Lake
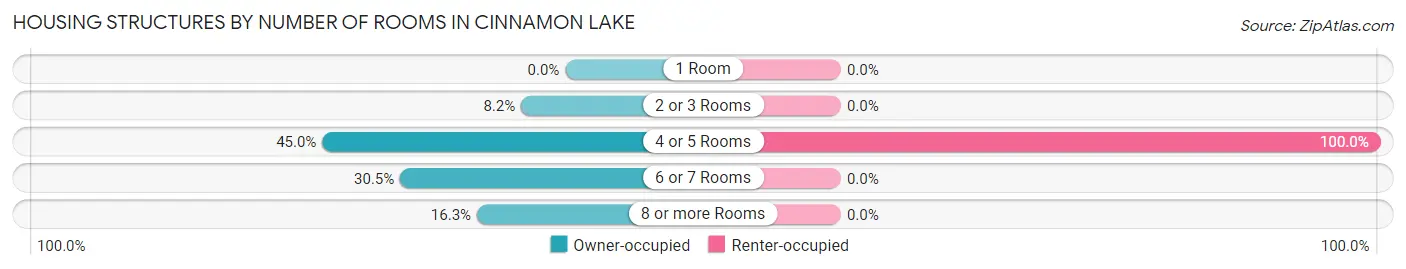
| Number of Rooms | Owner-occupied | Renter-occupied |
| 1 Room | 0 (0.0%) | 0 (0.0%) |
| 2 or 3 Rooms | 38 (8.2%) | 0 (0.0%) |
| 4 or 5 Rooms | 209 (45.0%) | 30 (100.0%) |
| 6 or 7 Rooms | 142 (30.5%) | 0 (0.0%) |
| 8 or more Rooms | 76 (16.3%) | 0 (0.0%) |
| Total | 465 (100.0%) | 30 (100.0%) |
Housing Structure by Heating Type in Cinnamon Lake
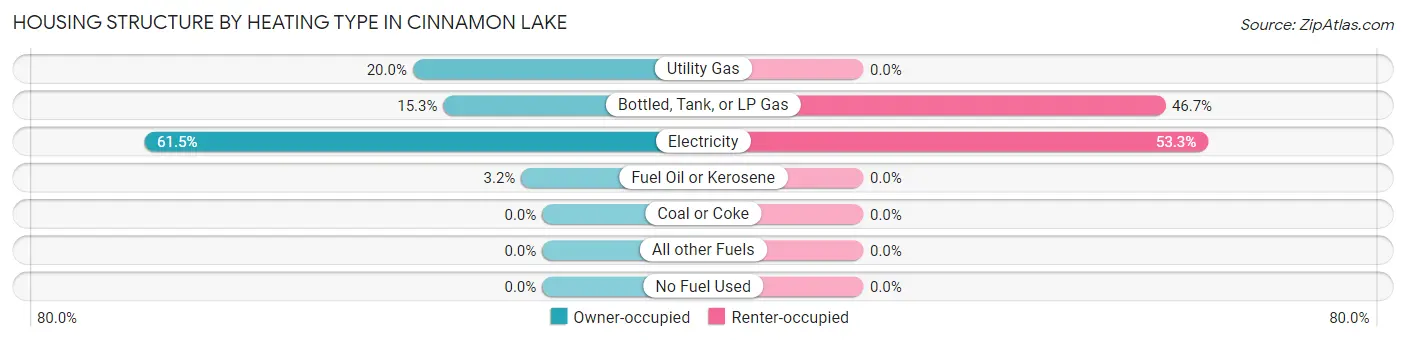
| Heating Type | Owner-occupied | Renter-occupied |
| Utility Gas | 93 (20.0%) | 0 (0.0%) |
| Bottled, Tank, or LP Gas | 71 (15.3%) | 14 (46.7%) |
| Electricity | 286 (61.5%) | 16 (53.3%) |
| Fuel Oil or Kerosene | 15 (3.2%) | 0 (0.0%) |
| Coal or Coke | 0 (0.0%) | 0 (0.0%) |
| All other Fuels | 0 (0.0%) | 0 (0.0%) |
| No Fuel Used | 0 (0.0%) | 0 (0.0%) |
| Total | 465 (100.0%) | 30 (100.0%) |
Household Vehicle Usage in Cinnamon Lake
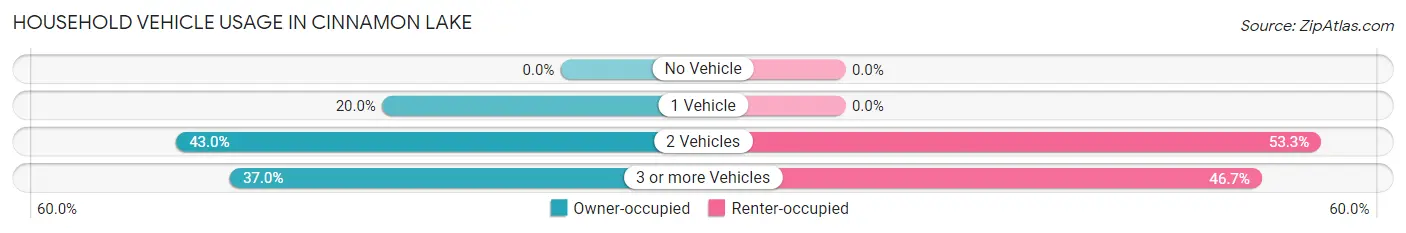
| Vehicles per Household | Owner-occupied | Renter-occupied |
| No Vehicle | 0 (0.0%) | 0 (0.0%) |
| 1 Vehicle | 93 (20.0%) | 0 (0.0%) |
| 2 Vehicles | 200 (43.0%) | 16 (53.3%) |
| 3 or more Vehicles | 172 (37.0%) | 14 (46.7%) |
| Total | 465 (100.0%) | 30 (100.0%) |
Real Estate & Mortgages in Cinnamon Lake
Real Estate and Mortgage Overview in Cinnamon Lake
| Characteristic | Without Mortgage | With Mortgage |
| Housing Units | 134 | 331 |
| Median Property Value | $191,900 | $135,500 |
| Median Household Income | $51,207 | $33 |
| Monthly Housing Costs | $451 | $0 |
| Real Estate Taxes | $1,815 | $0 |
Property Value by Mortgage Status in Cinnamon Lake
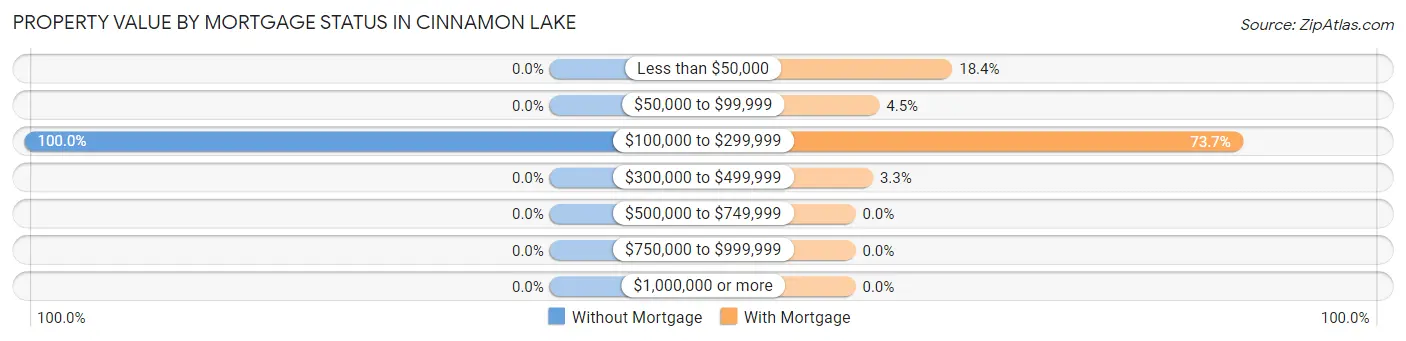
| Property Value | Without Mortgage | With Mortgage |
| Less than $50,000 | 0 (0.0%) | 61 (18.4%) |
| $50,000 to $99,999 | 0 (0.0%) | 15 (4.5%) |
| $100,000 to $299,999 | 134 (100.0%) | 244 (73.7%) |
| $300,000 to $499,999 | 0 (0.0%) | 11 (3.3%) |
| $500,000 to $749,999 | 0 (0.0%) | 0 (0.0%) |
| $750,000 to $999,999 | 0 (0.0%) | 0 (0.0%) |
| $1,000,000 or more | 0 (0.0%) | 0 (0.0%) |
| Total | 134 (100.0%) | 331 (100.0%) |
Household Income by Mortgage Status in Cinnamon Lake
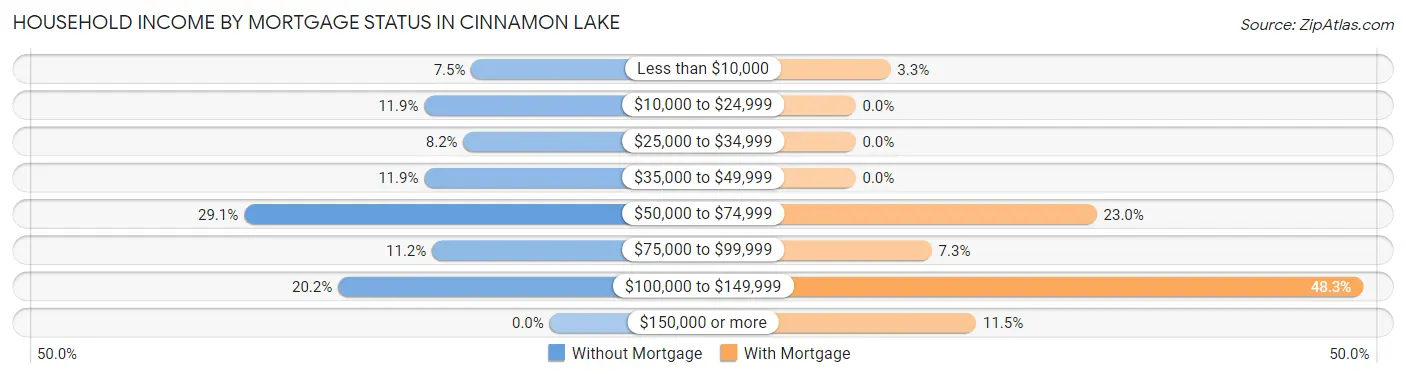
| Household Income | Without Mortgage | With Mortgage |
| Less than $10,000 | 10 (7.5%) | 11 (3.3%) |
| $10,000 to $24,999 | 16 (11.9%) | 0 (0.0%) |
| $25,000 to $34,999 | 11 (8.2%) | 0 (0.0%) |
| $35,000 to $49,999 | 16 (11.9%) | 0 (0.0%) |
| $50,000 to $74,999 | 39 (29.1%) | 76 (23.0%) |
| $75,000 to $99,999 | 15 (11.2%) | 24 (7.2%) |
| $100,000 to $149,999 | 27 (20.2%) | 160 (48.3%) |
| $150,000 or more | 0 (0.0%) | 38 (11.5%) |
| Total | 134 (100.0%) | 331 (100.0%) |
Property Value to Household Income Ratio in Cinnamon Lake
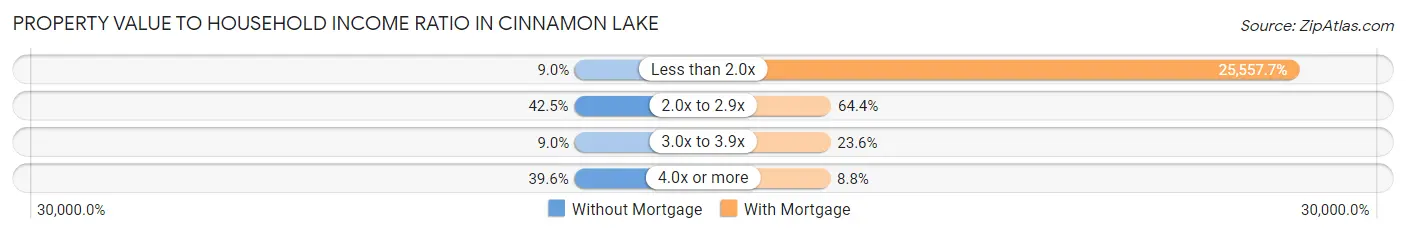
| Value-to-Income Ratio | Without Mortgage | With Mortgage |
| Less than 2.0x | 12 (9.0%) | 84,596 (25,557.7%) |
| 2.0x to 2.9x | 57 (42.5%) | 213 (64.3%) |
| 3.0x to 3.9x | 12 (9.0%) | 78 (23.6%) |
| 4.0x or more | 53 (39.6%) | 29 (8.8%) |
| Total | 134 (100.0%) | 331 (100.0%) |
Real Estate Taxes by Mortgage Status in Cinnamon Lake
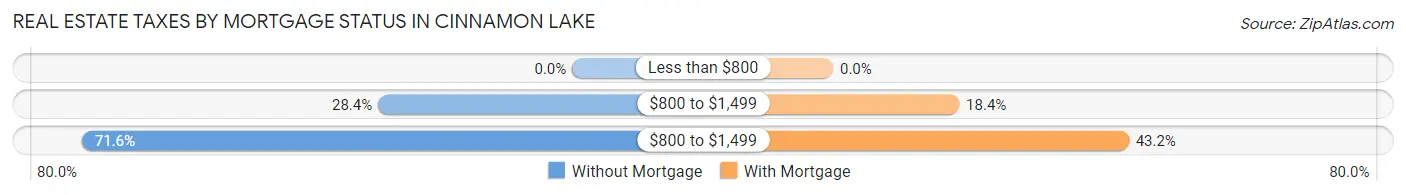
| Property Taxes | Without Mortgage | With Mortgage |
| Less than $800 | 0 (0.0%) | 0 (0.0%) |
| $800 to $1,499 | 38 (28.4%) | 61 (18.4%) |
| $800 to $1,499 | 96 (71.6%) | 143 (43.2%) |
| Total | 134 (100.0%) | 331 (100.0%) |
Health & Disability in Cinnamon Lake
Health Insurance Coverage by Age in Cinnamon Lake
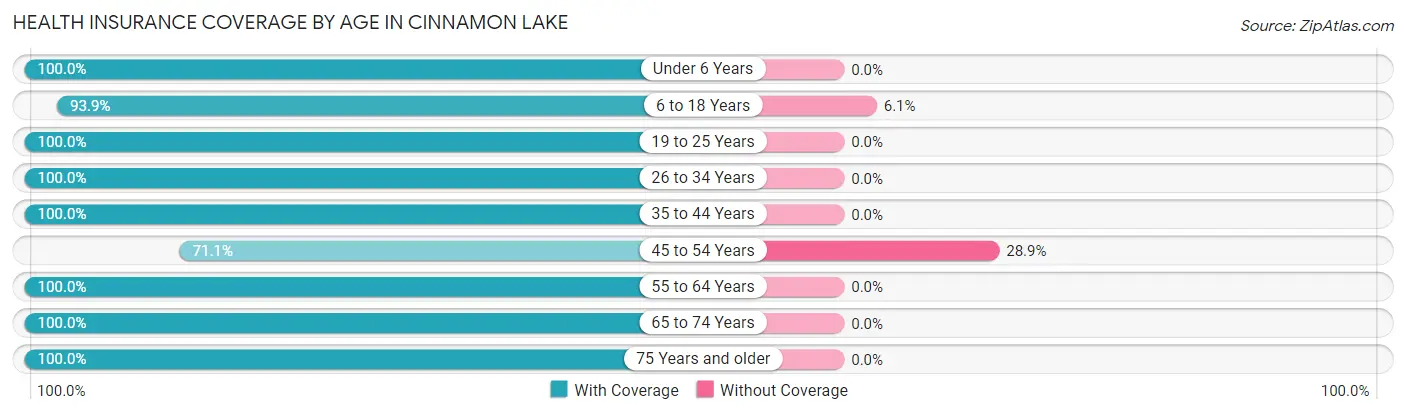
| Age Bracket | With Coverage | Without Coverage |
| Under 6 Years | 25 (100.0%) | 0 (0.0%) |
| 6 to 18 Years | 155 (93.9%) | 10 (6.1%) |
| 19 to 25 Years | 43 (100.0%) | 0 (0.0%) |
| 26 to 34 Years | 39 (100.0%) | 0 (0.0%) |
| 35 to 44 Years | 114 (100.0%) | 0 (0.0%) |
| 45 to 54 Years | 150 (71.1%) | 61 (28.9%) |
| 55 to 64 Years | 230 (100.0%) | 0 (0.0%) |
| 65 to 74 Years | 91 (100.0%) | 0 (0.0%) |
| 75 Years and older | 109 (100.0%) | 0 (0.0%) |
| Total | 956 (93.1%) | 71 (6.9%) |
Health Insurance Coverage by Citizenship Status in Cinnamon Lake
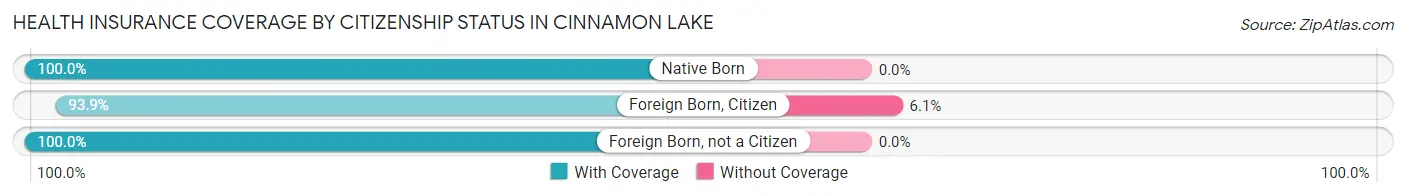
| Citizenship Status | With Coverage | Without Coverage |
| Native Born | 25 (100.0%) | 0 (0.0%) |
| Foreign Born, Citizen | 155 (93.9%) | 10 (6.1%) |
| Foreign Born, not a Citizen | 43 (100.0%) | 0 (0.0%) |
Health Insurance Coverage by Household Income in Cinnamon Lake
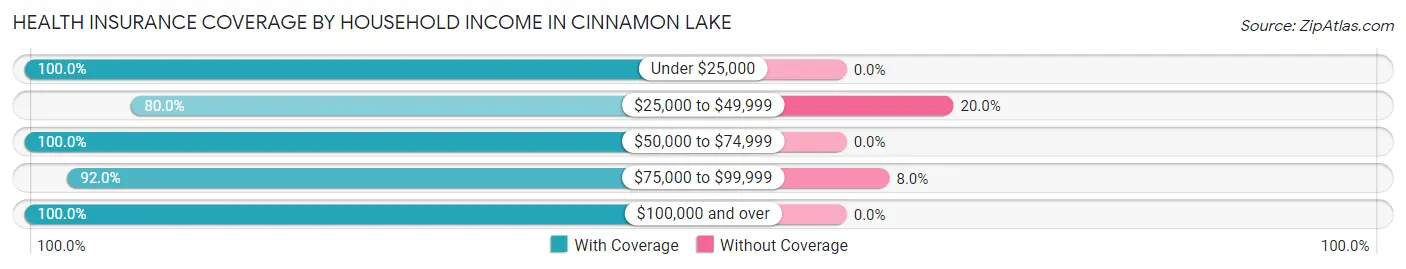
| Household Income | With Coverage | Without Coverage |
| Under $25,000 | 26 (100.0%) | 0 (0.0%) |
| $25,000 to $49,999 | 152 (80.0%) | 38 (20.0%) |
| $50,000 to $74,999 | 105 (100.0%) | 0 (0.0%) |
| $75,000 to $99,999 | 379 (92.0%) | 33 (8.0%) |
| $100,000 and over | 294 (100.0%) | 0 (0.0%) |
Public vs Private Health Insurance Coverage by Age in Cinnamon Lake
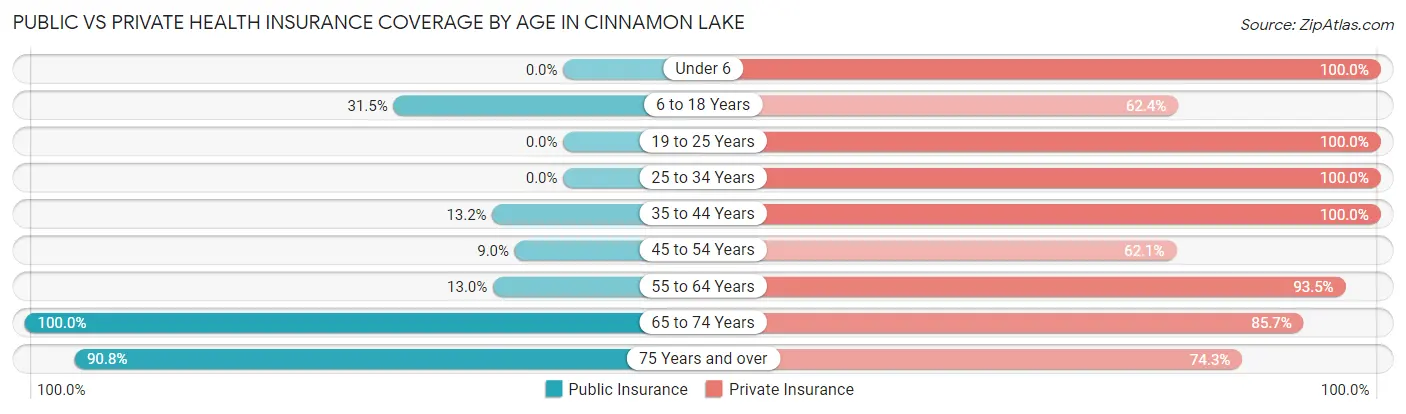
| Age Bracket | Public Insurance | Private Insurance |
| Under 6 | 0 (0.0%) | 25 (100.0%) |
| 6 to 18 Years | 52 (31.5%) | 103 (62.4%) |
| 19 to 25 Years | 0 (0.0%) | 43 (100.0%) |
| 25 to 34 Years | 0 (0.0%) | 39 (100.0%) |
| 35 to 44 Years | 15 (13.2%) | 114 (100.0%) |
| 45 to 54 Years | 19 (9.0%) | 131 (62.1%) |
| 55 to 64 Years | 30 (13.0%) | 215 (93.5%) |
| 65 to 74 Years | 91 (100.0%) | 78 (85.7%) |
| 75 Years and over | 99 (90.8%) | 81 (74.3%) |
| Total | 306 (29.8%) | 829 (80.7%) |
Disability Status by Sex by Age in Cinnamon Lake
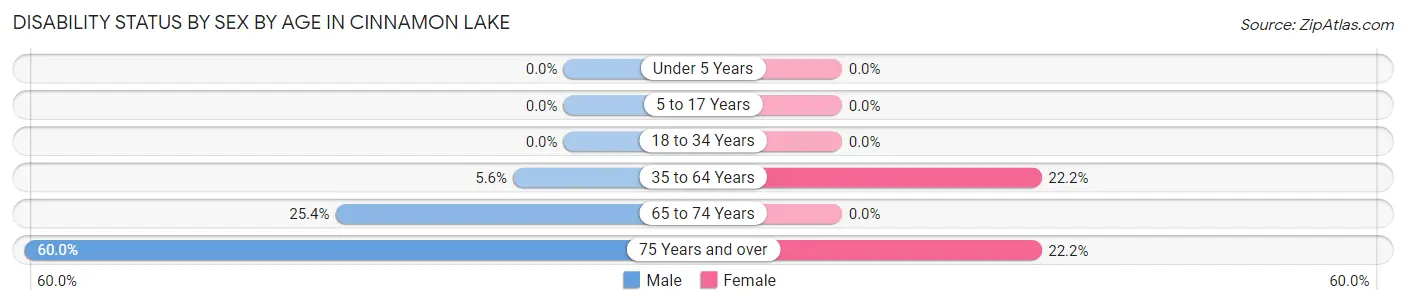
| Age Bracket | Male | Female |
| Under 5 Years | 0 (0.0%) | 0 (0.0%) |
| 5 to 17 Years | 0 (0.0%) | 0 (0.0%) |
| 18 to 34 Years | 0 (0.0%) | 0 (0.0%) |
| 35 to 64 Years | 15 (5.6%) | 64 (22.2%) |
| 65 to 74 Years | 16 (25.4%) | 0 (0.0%) |
| 75 Years and over | 33 (60.0%) | 12 (22.2%) |
Disability Class by Sex by Age in Cinnamon Lake
Disability Class: Hearing Difficulty
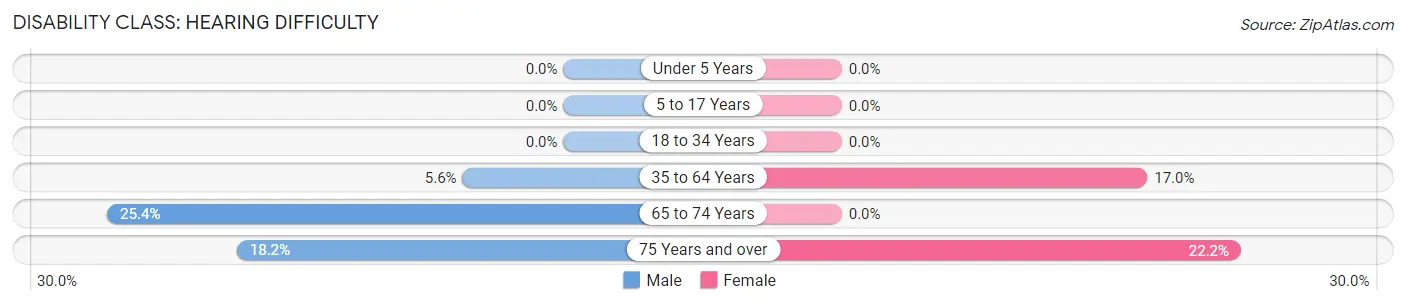
| Age Bracket | Male | Female |
| Under 5 Years | 0 (0.0%) | 0 (0.0%) |
| 5 to 17 Years | 0 (0.0%) | 0 (0.0%) |
| 18 to 34 Years | 0 (0.0%) | 0 (0.0%) |
| 35 to 64 Years | 15 (5.6%) | 49 (17.0%) |
| 65 to 74 Years | 16 (25.4%) | 0 (0.0%) |
| 75 Years and over | 10 (18.2%) | 12 (22.2%) |
Disability Class: Vision Difficulty
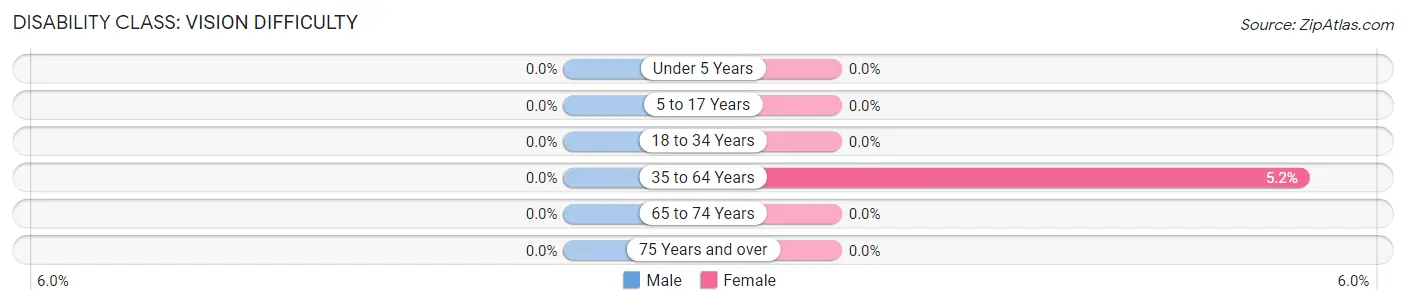
| Age Bracket | Male | Female |
| Under 5 Years | 0 (0.0%) | 0 (0.0%) |
| 5 to 17 Years | 0 (0.0%) | 0 (0.0%) |
| 18 to 34 Years | 0 (0.0%) | 0 (0.0%) |
| 35 to 64 Years | 0 (0.0%) | 15 (5.2%) |
| 65 to 74 Years | 0 (0.0%) | 0 (0.0%) |
| 75 Years and over | 0 (0.0%) | 0 (0.0%) |
Disability Class: Cognitive Difficulty
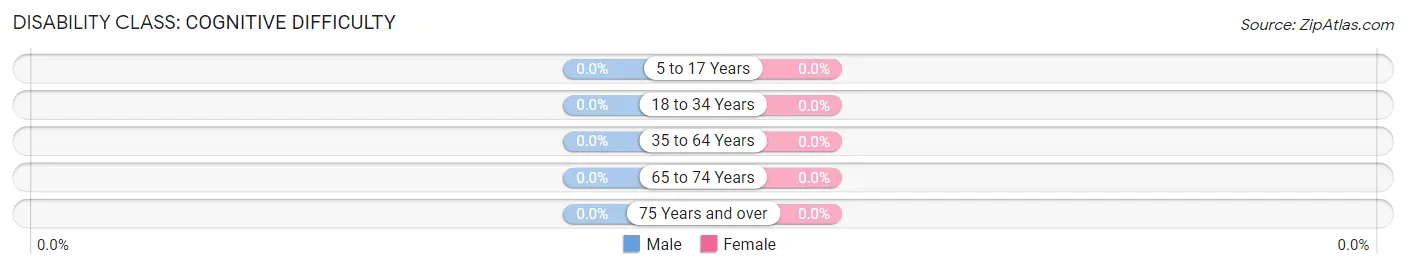
| Age Bracket | Male | Female |
| 5 to 17 Years | 0 (0.0%) | 0 (0.0%) |
| 18 to 34 Years | 0 (0.0%) | 0 (0.0%) |
| 35 to 64 Years | 0 (0.0%) | 0 (0.0%) |
| 65 to 74 Years | 0 (0.0%) | 0 (0.0%) |
| 75 Years and over | 0 (0.0%) | 0 (0.0%) |
Disability Class: Ambulatory Difficulty
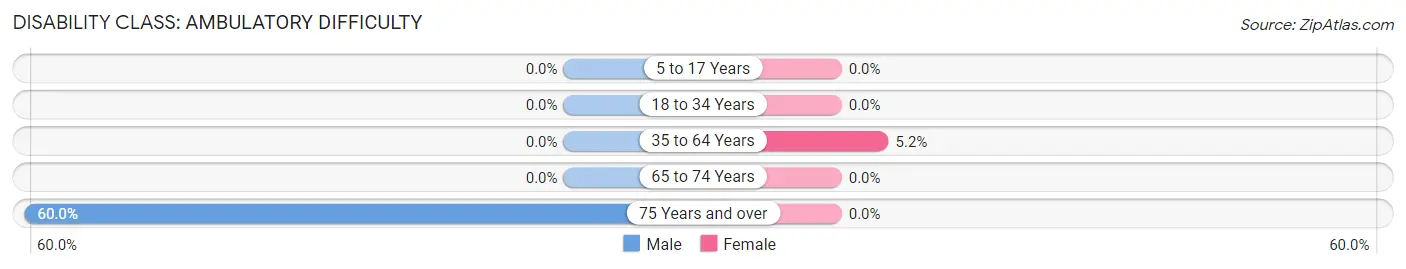
| Age Bracket | Male | Female |
| 5 to 17 Years | 0 (0.0%) | 0 (0.0%) |
| 18 to 34 Years | 0 (0.0%) | 0 (0.0%) |
| 35 to 64 Years | 0 (0.0%) | 15 (5.2%) |
| 65 to 74 Years | 0 (0.0%) | 0 (0.0%) |
| 75 Years and over | 33 (60.0%) | 0 (0.0%) |
Disability Class: Self-Care Difficulty
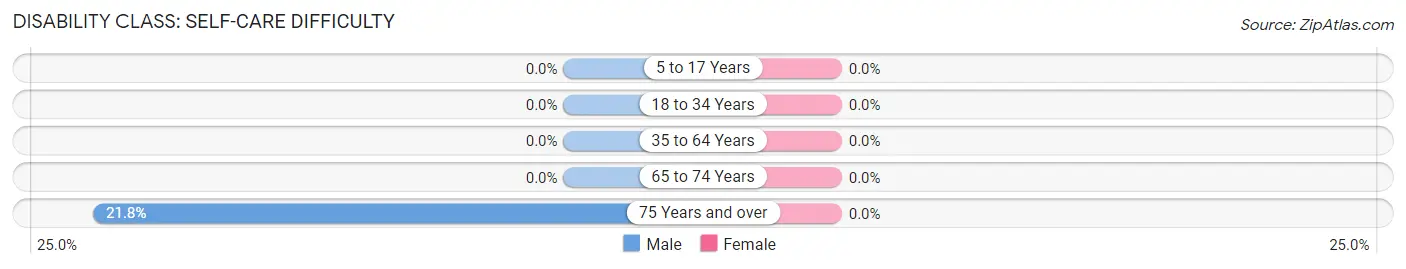
| Age Bracket | Male | Female |
| 5 to 17 Years | 0 (0.0%) | 0 (0.0%) |
| 18 to 34 Years | 0 (0.0%) | 0 (0.0%) |
| 35 to 64 Years | 0 (0.0%) | 0 (0.0%) |
| 65 to 74 Years | 0 (0.0%) | 0 (0.0%) |
| 75 Years and over | 12 (21.8%) | 0 (0.0%) |
Technology Access in Cinnamon Lake
Computing Device Access in Cinnamon Lake
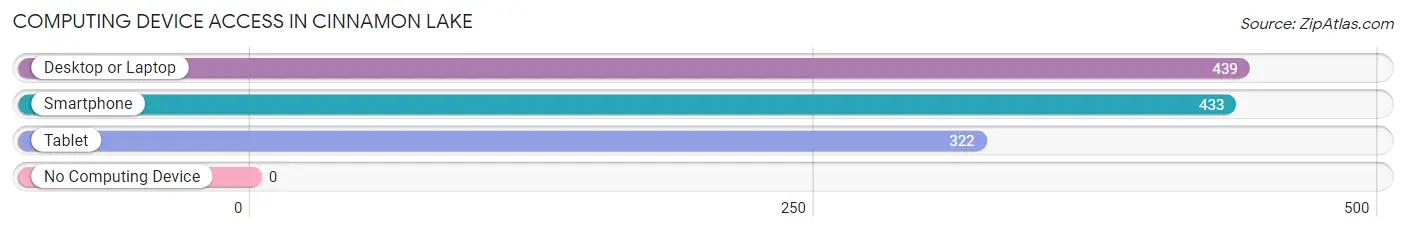
| Device Type | # Households | % Households |
| Desktop or Laptop | 439 | 88.7% |
| Smartphone | 433 | 87.5% |
| Tablet | 322 | 65.0% |
| No Computing Device | 0 | 0.0% |
| Total | 495 | 100.0% |
Internet Access in Cinnamon Lake
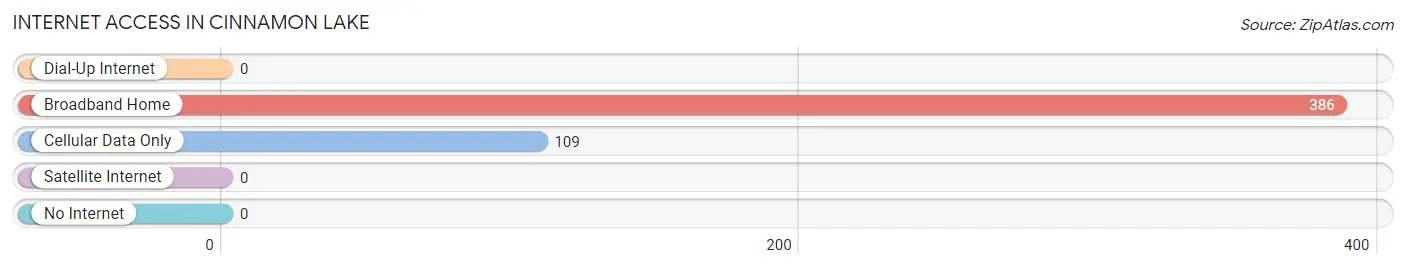
| Internet Type | # Households | % Households |
| Dial-Up Internet | 0 | 0.0% |
| Broadband Home | 386 | 78.0% |
| Cellular Data Only | 109 | 22.0% |
| Satellite Internet | 0 | 0.0% |
| No Internet | 0 | 0.0% |
| Total | 495 | 100.0% |
Cinnamon Lake Summary
Cinnamon Lake is a small village located in the northeastern part of Ohio, United States. It is situated in the county of Wayne, and is part of the Wooster Metropolitan Statistical Area. The village has a population of approximately 1,000 people, and is located on the shores of the Cinnamon Lake.
History
Cinnamon Lake was first settled in 1820 by a group of settlers from Pennsylvania. The settlers were attracted to the area due to its abundance of natural resources, including timber, fish, and game. The village was originally known as “Cinnamon”, but the name was changed to “Cinnamon Lake” in 1845.
The village was incorporated in 1848, and the first mayor was elected in 1849. The village grew slowly over the years, and by the turn of the century, it had a population of around 500 people.
In the early 1900s, the village began to experience a period of growth and development. The village was connected to the outside world by the construction of a railroad line in 1906. This allowed for the transportation of goods and services to and from the village.
In the 1920s, the village experienced a period of economic prosperity. The village was home to several businesses, including a sawmill, a grist mill, and a general store. The village also had a post office, a bank, and a hotel.
Geography
Cinnamon Lake is located in the northeastern part of Ohio, in Wayne County. The village is situated on the shores of the Cinnamon Lake, which is a small lake that is part of the larger Lake Erie watershed. The village is located approximately 25 miles east of Cleveland and 40 miles west of Akron.
The village is surrounded by rolling hills and farmland. The terrain is mostly flat, with some areas of higher elevation. The village is located in a temperate climate, with hot summers and cold winters.
Economy
The economy of Cinnamon Lake is largely based on agriculture and tourism. The village is home to several farms, which produce a variety of crops, including corn, soybeans, and wheat. The village also has several small businesses, including a general store, a post office, and a bank.
The village is also a popular tourist destination. The village is home to several parks, including the Cinnamon Lake State Park, which offers camping, fishing, and other recreational activities. The village also has several restaurants, bars, and other attractions.
Demographics
As of the 2010 census, the population of Cinnamon Lake was 1,000 people. The population is predominantly white, with a small percentage of African Americans and Hispanics. The median household income is $45,000, and the median age is 40 years.
Conclusion
Cinnamon Lake is a small village located in the northeastern part of Ohio. The village has a population of approximately 1,000 people, and is situated on the shores of the Cinnamon Lake. The village has a long history, and has experienced periods of growth and development. The economy of the village is largely based on agriculture and tourism, and the village is a popular tourist destination. The population of the village is predominantly white, with a small percentage of African Americans and Hispanics.
Common Questions
What is Per Capita Income in Cinnamon Lake?
Per Capita income in Cinnamon Lake is $35,842.
What is the Median Family Income in Cinnamon Lake?
Median Family Income in Cinnamon Lake is $83,788.
What is the Median Household income in Cinnamon Lake?
Median Household Income in Cinnamon Lake is $83,673.
What is Inequality or Gini Index in Cinnamon Lake?
Inequality or Gini Index in Cinnamon Lake is 0.27.
What is the Total Population of Cinnamon Lake?
Total Population of Cinnamon Lake is 1,027.
What is the Total Male Population of Cinnamon Lake?
Total Male Population of Cinnamon Lake is 505.
What is the Total Female Population of Cinnamon Lake?
Total Female Population of Cinnamon Lake is 522.
What is the Ratio of Males per 100 Females in Cinnamon Lake?
There are 96.74 Males per 100 Females in Cinnamon Lake.
What is the Ratio of Females per 100 Males in Cinnamon Lake?
There are 103.37 Females per 100 Males in Cinnamon Lake.
What is the Median Population Age in Cinnamon Lake?
Median Population Age in Cinnamon Lake is 52.3 Years.
What is the Average Family Size in Cinnamon Lake
Average Family Size in Cinnamon Lake is 2.3 People.
What is the Average Household Size in Cinnamon Lake
Average Household Size in Cinnamon Lake is 2.1 People.
How Large is the Labor Force in Cinnamon Lake?
There are 473 People in the Labor Forcein in Cinnamon Lake.
What is the Percentage of People in the Labor Force in Cinnamon Lake?
55.8% of People are in the Labor Force in Cinnamon Lake.
What is the Unemployment Rate in Cinnamon Lake?
Unemployment Rate in Cinnamon Lake is 2.1%.