Beloit, OH Map & Demographics
Beloit Map
Beloit Overview
$31,055
PER CAPITA INCOME
$54,000
AVG FAMILY INCOME
$50,682
AVG HOUSEHOLD INCOME
52.5%
WAGE / INCOME GAP [ % ]
47.5¢/ $1
WAGE / INCOME GAP [ $ ]
0.44
INEQUALITY / GINI INDEX
1,140
TOTAL POPULATION
555
MALE POPULATION
585
FEMALE POPULATION
94.87
MALES / 100 FEMALES
105.41
FEMALES / 100 MALES
49.0
MEDIAN AGE
2.7
AVG FAMILY SIZE
2.2
AVG HOUSEHOLD SIZE
643
LABOR FORCE [ PEOPLE ]
66.1%
PERCENT IN LABOR FORCE
4.0%
UNEMPLOYMENT RATE
Beloit Zip Codes
Beloit Area Codes
Income in Beloit
Income Overview in Beloit
Per Capita Income in Beloit is $31,055, while median incomes of families and households are $54,000 and $50,682 respectively.
| Characteristic | Number | Measure |
| Per Capita Income | 1,140 | $31,055 |
| Median Family Income | 308 | $54,000 |
| Mean Family Income | 308 | $75,244 |
| Median Household Income | 520 | $50,682 |
| Mean Household Income | 520 | $68,035 |
| Income Deficit | 308 | $0 |
| Wage / Income Gap (%) | 1,140 | 52.47% |
| Wage / Income Gap ($) | 1,140 | 47.53¢ per $1 |
| Gini / Inequality Index | 1,140 | 0.44 |
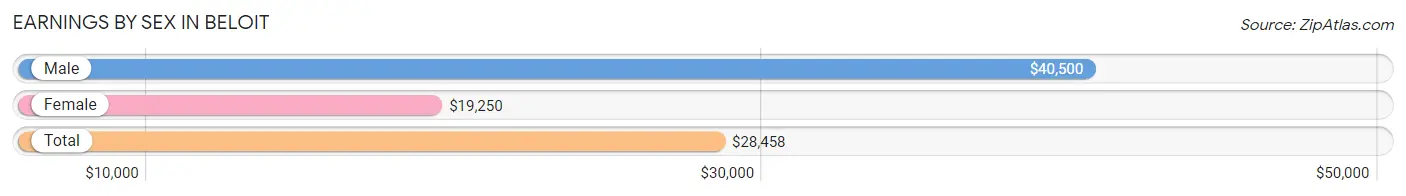
Earnings by Sex in Beloit
Average Earnings in Beloit are $28,458, $40,500 for men and $19,250 for women, a difference of 52.5%.
| Sex | Number | Average Earnings |
| Male | 352 (53.6%) | $40,500 |
| Female | 305 (46.4%) | $19,250 |
| Total | 657 (100.0%) | $28,458 |
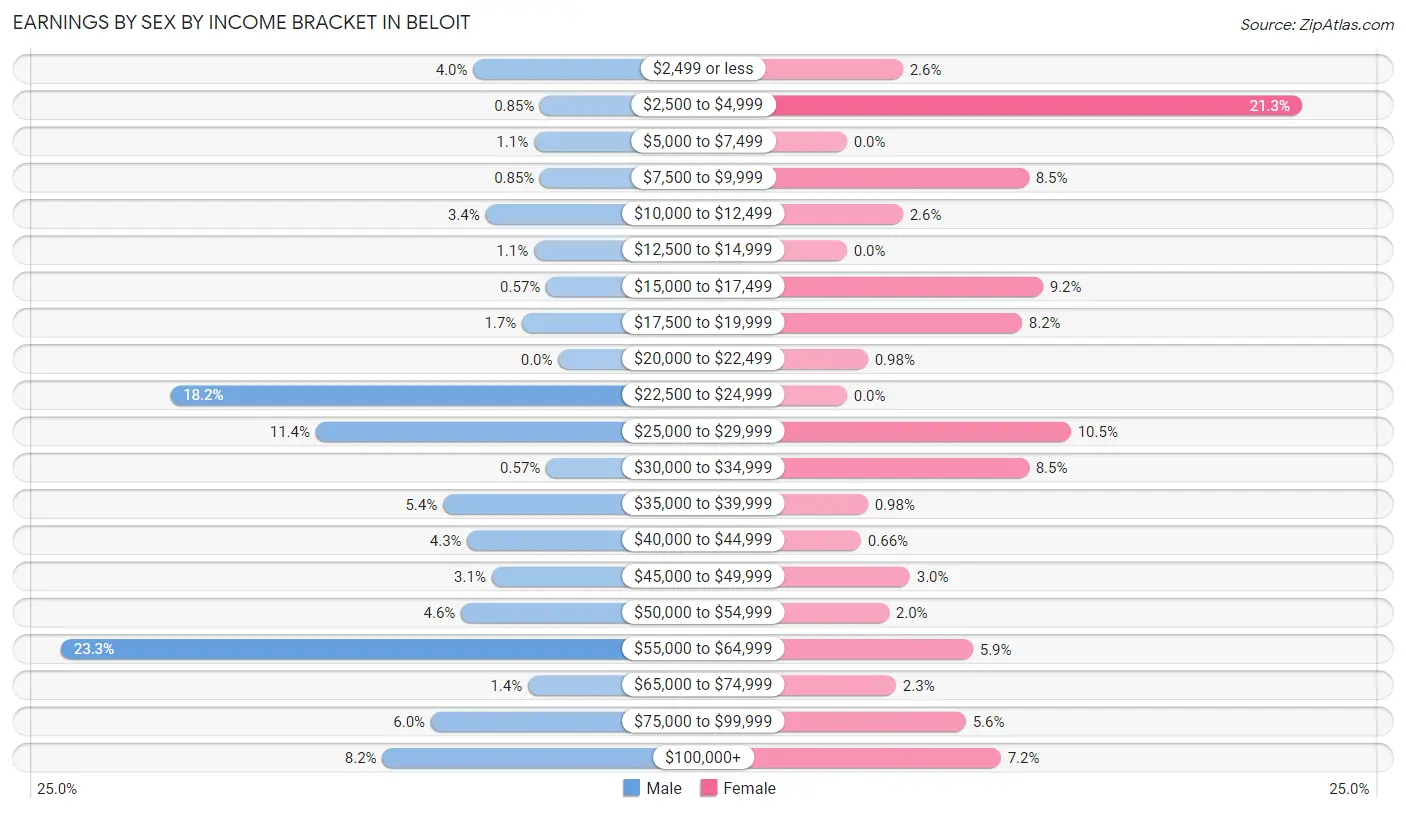
Earnings by Sex by Income Bracket in Beloit
The most common earnings brackets in Beloit are $55,000 to $64,999 for men (82 | 23.3%) and $2,500 to $4,999 for women (65 | 21.3%).
| Income | Male | Female |
| $2,499 or less | 14 (4.0%) | 8 (2.6%) |
| $2,500 to $4,999 | 3 (0.9%) | 65 (21.3%) |
| $5,000 to $7,499 | 4 (1.1%) | 0 (0.0%) |
| $7,500 to $9,999 | 3 (0.9%) | 26 (8.5%) |
| $10,000 to $12,499 | 12 (3.4%) | 8 (2.6%) |
| $12,500 to $14,999 | 4 (1.1%) | 0 (0.0%) |
| $15,000 to $17,499 | 2 (0.6%) | 28 (9.2%) |
| $17,500 to $19,999 | 6 (1.7%) | 25 (8.2%) |
| $20,000 to $22,499 | 0 (0.0%) | 3 (1.0%) |
| $22,500 to $24,999 | 64 (18.2%) | 0 (0.0%) |
| $25,000 to $29,999 | 40 (11.4%) | 32 (10.5%) |
| $30,000 to $34,999 | 2 (0.6%) | 26 (8.5%) |
| $35,000 to $39,999 | 19 (5.4%) | 3 (1.0%) |
| $40,000 to $44,999 | 15 (4.3%) | 2 (0.7%) |
| $45,000 to $49,999 | 11 (3.1%) | 9 (2.9%) |
| $50,000 to $54,999 | 16 (4.5%) | 6 (2.0%) |
| $55,000 to $64,999 | 82 (23.3%) | 18 (5.9%) |
| $65,000 to $74,999 | 5 (1.4%) | 7 (2.3%) |
| $75,000 to $99,999 | 21 (6.0%) | 17 (5.6%) |
| $100,000+ | 29 (8.2%) | 22 (7.2%) |
| Total | 352 (100.0%) | 305 (100.0%) |
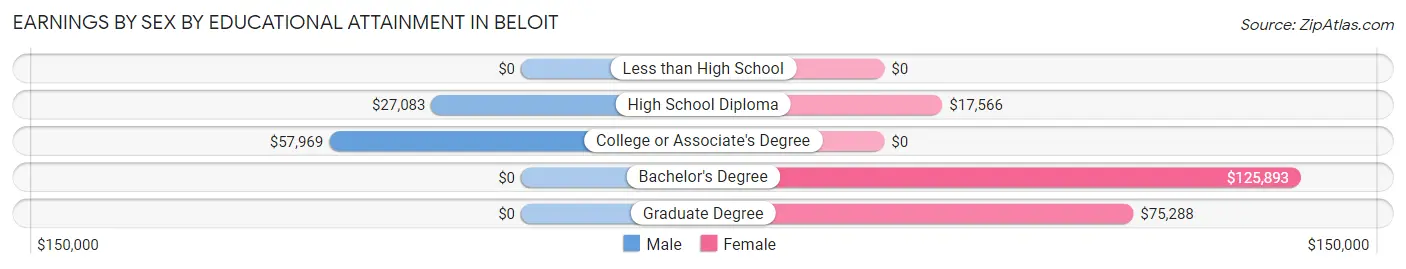
Earnings by Sex by Educational Attainment in Beloit
Average earnings in Beloit are $42,000 for men and $18,950 for women, a difference of 54.9%. Men with an educational attainment of college or associate's degree enjoy the highest average annual earnings of $57,969, while those with high school diploma education earn the least with $27,083. Women with an educational attainment of bachelor's degree earn the most with the average annual earnings of $125,893, while those with high school diploma education have the smallest earnings of $17,566.
| Educational Attainment | Male Income | Female Income |
| Less than High School | - | - |
| High School Diploma | $27,083 | $17,566 |
| College or Associate's Degree | $57,969 | $0 |
| Bachelor's Degree | - | - |
| Graduate Degree | - | - |
| Total | $42,000 | $18,950 |
Family Income in Beloit
Family Income Brackets in Beloit
According to the Beloit family income data, there are 77 families falling into the $35,000 to $49,999 income range, which is the most common income bracket and makes up 25.0% of all families.
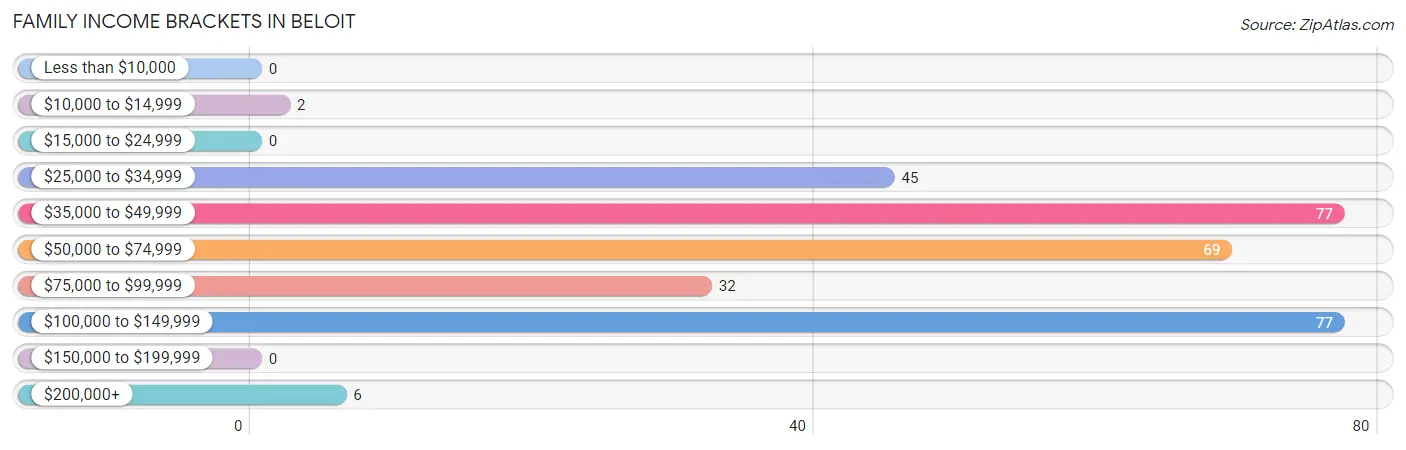
| Income Bracket | # Families | % Families |
| Less than $10,000 | 0 | 0.0% |
| $10,000 to $14,999 | 2 | 0.6% |
| $15,000 to $24,999 | 0 | 0.0% |
| $25,000 to $34,999 | 45 | 14.6% |
| $35,000 to $49,999 | 77 | 25.0% |
| $50,000 to $74,999 | 69 | 22.4% |
| $75,000 to $99,999 | 32 | 10.4% |
| $100,000 to $149,999 | 77 | 25.0% |
| $150,000 to $199,999 | 0 | 0.0% |
| $200,000+ | 6 | 1.9% |
Family Income by Famaliy Size in Beloit
3-person families (87 | 28.2%) account for the highest median family income in Beloit with $132,642 per family, while 3-person families (87 | 28.2%) have the highest median income of $44,214 per family member.
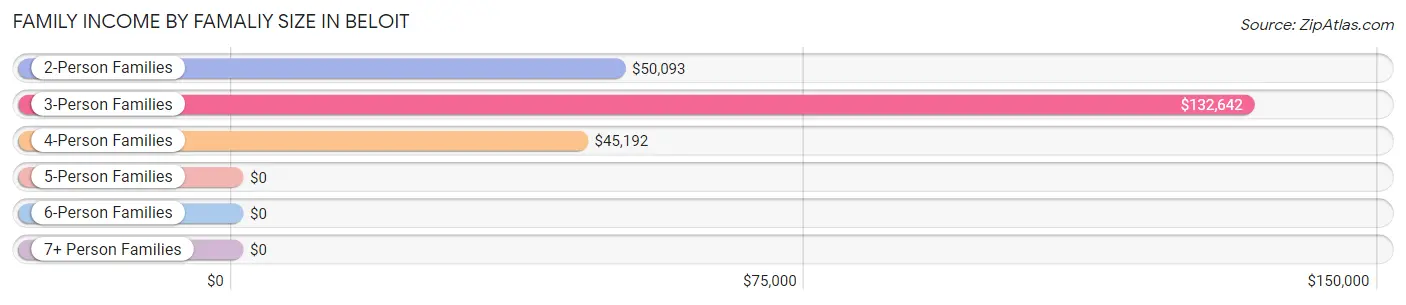
| Income Bracket | # Families | Median Income |
| 2-Person Families | 152 (49.3%) | $50,093 |
| 3-Person Families | 87 (28.2%) | $132,642 |
| 4-Person Families | 54 (17.5%) | $45,192 |
| 5-Person Families | 15 (4.9%) | $0 |
| 6-Person Families | 0 (0.0%) | $0 |
| 7+ Person Families | 0 (0.0%) | $0 |
| Total | 308 (100.0%) | $54,000 |
Family Income by Number of Earners in Beloit
The median family income in Beloit is $54,000, with families comprising 3+ earners (64) having the highest median family income of $133,636, while families with no earners (57) have the lowest median family income of $40,547, accounting for 20.8% and 18.5% of families, respectively.
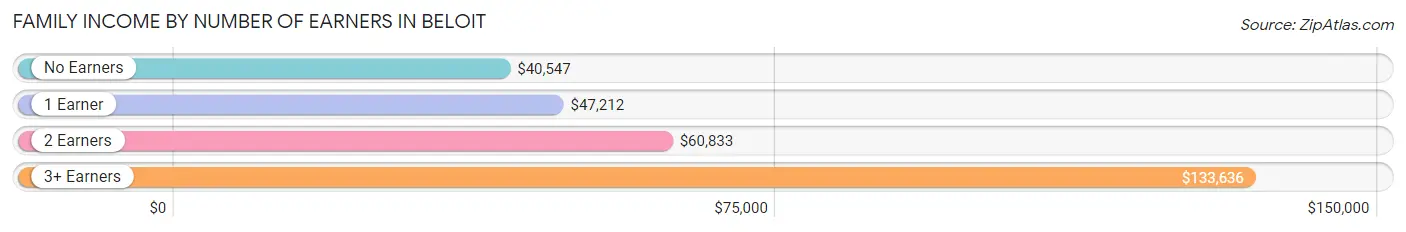
| Number of Earners | # Families | Median Income |
| No Earners | 57 (18.5%) | $40,547 |
| 1 Earner | 67 (21.7%) | $47,212 |
| 2 Earners | 120 (39.0%) | $60,833 |
| 3+ Earners | 64 (20.8%) | $133,636 |
| Total | 308 (100.0%) | $54,000 |
Household Income in Beloit
Household Income Brackets in Beloit
With 97 households falling in the category, the $50,000 to $74,999 income range is the most frequent in Beloit, accounting for 18.6% of all households. In contrast, only 11 households (2.1%) fall into the $10,000 to $14,999 income bracket, making it the least populous group.
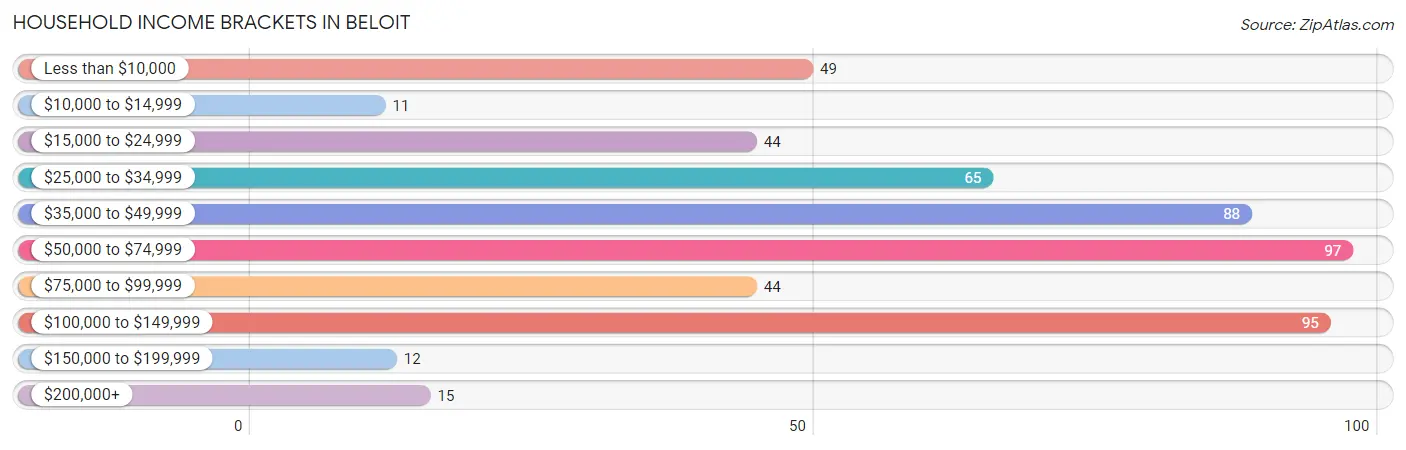
| Income Bracket | # Households | % Households |
| Less than $10,000 | 49 | 9.4% |
| $10,000 to $14,999 | 11 | 2.1% |
| $15,000 to $24,999 | 44 | 8.5% |
| $25,000 to $34,999 | 65 | 12.5% |
| $35,000 to $49,999 | 88 | 16.9% |
| $50,000 to $74,999 | 97 | 18.7% |
| $75,000 to $99,999 | 44 | 8.5% |
| $100,000 to $149,999 | 95 | 18.3% |
| $150,000 to $199,999 | 12 | 2.3% |
| $200,000+ | 15 | 2.9% |
Household Income by Householder Age in Beloit
The median household income in Beloit is $50,682, with the highest median household income of $77,708 found in the 45 to 64 years age bracket for the primary householder. A total of 190 households (36.5%) fall into this category.
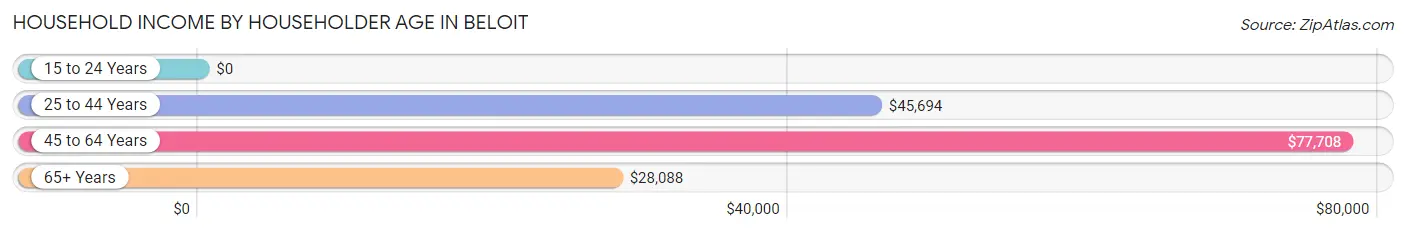
| Income Bracket | # Households | Median Income |
| 15 to 24 Years | 0 (0.0%) | $0 |
| 25 to 44 Years | 126 (24.2%) | $45,694 |
| 45 to 64 Years | 190 (36.5%) | $77,708 |
| 65+ Years | 204 (39.2%) | $28,088 |
| Total | 520 (100.0%) | $50,682 |
Poverty in Beloit
Income Below Poverty by Sex and Age in Beloit
With 2.2% poverty level for males and 12.8% for females among the residents of Beloit, 75 year old and over males and 75 year old and over females are the most vulnerable to poverty, with 4 males (8.7%) and 42 females (39.6%) in their respective age groups living below the poverty level.
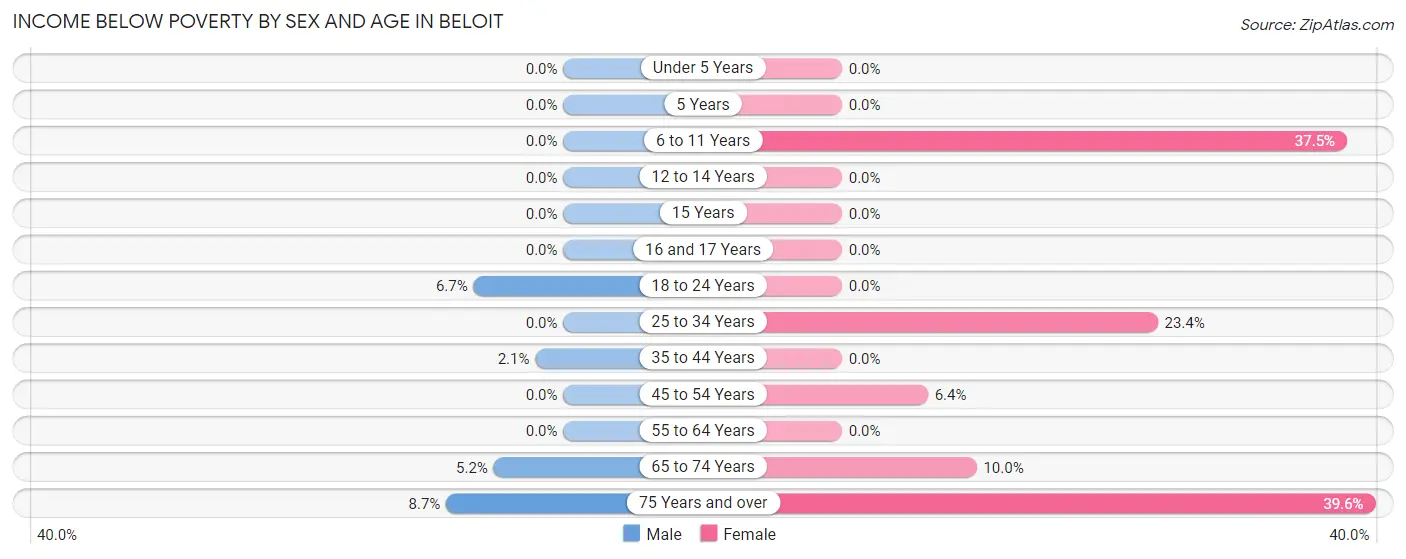
| Age Bracket | Male | Female |
| Under 5 Years | 0 (0.0%) | 0 (0.0%) |
| 5 Years | 0 (0.0%) | 0 (0.0%) |
| 6 to 11 Years | 0 (0.0%) | 3 (37.5%) |
| 12 to 14 Years | 0 (0.0%) | 0 (0.0%) |
| 15 Years | 0 (0.0%) | 0 (0.0%) |
| 16 and 17 Years | 0 (0.0%) | 0 (0.0%) |
| 18 to 24 Years | 3 (6.7%) | 0 (0.0%) |
| 25 to 34 Years | 0 (0.0%) | 15 (23.4%) |
| 35 to 44 Years | 2 (2.1%) | 0 (0.0%) |
| 45 to 54 Years | 0 (0.0%) | 6 (6.4%) |
| 55 to 64 Years | 0 (0.0%) | 0 (0.0%) |
| 65 to 74 Years | 3 (5.2%) | 8 (10.0%) |
| 75 Years and over | 4 (8.7%) | 42 (39.6%) |
| Total | 12 (2.2%) | 74 (12.8%) |
Income Above Poverty by Sex and Age in Beloit
According to the poverty statistics in Beloit, males aged under 5 years and females aged under 5 years are the age groups that are most secure financially, with 100.0% of males and 100.0% of females in these age groups living above the poverty line.
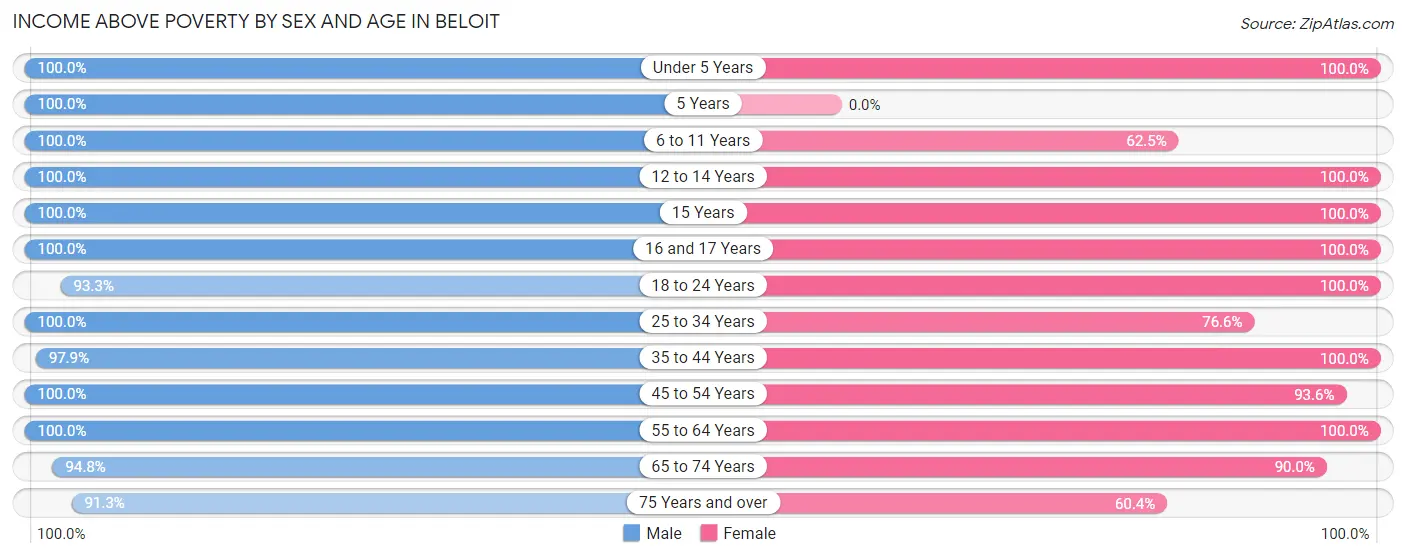
| Age Bracket | Male | Female |
| Under 5 Years | 7 (100.0%) | 29 (100.0%) |
| 5 Years | 6 (100.0%) | 0 (0.0%) |
| 6 to 11 Years | 17 (100.0%) | 5 (62.5%) |
| 12 to 14 Years | 29 (100.0%) | 32 (100.0%) |
| 15 Years | 6 (100.0%) | 11 (100.0%) |
| 16 and 17 Years | 6 (100.0%) | 6 (100.0%) |
| 18 to 24 Years | 42 (93.3%) | 36 (100.0%) |
| 25 to 34 Years | 63 (100.0%) | 49 (76.6%) |
| 35 to 44 Years | 94 (97.9%) | 61 (100.0%) |
| 45 to 54 Years | 59 (100.0%) | 88 (93.6%) |
| 55 to 64 Years | 100 (100.0%) | 53 (100.0%) |
| 65 to 74 Years | 55 (94.8%) | 72 (90.0%) |
| 75 Years and over | 42 (91.3%) | 64 (60.4%) |
| Total | 526 (97.8%) | 506 (87.2%) |
Income Below Poverty Among Married-Couple Families in Beloit
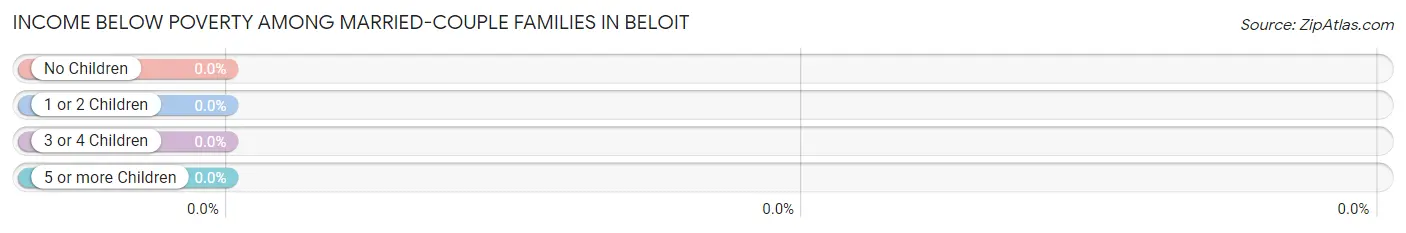
| Children | Above Poverty | Below Poverty |
| No Children | 154 (100.0%) | 0 (0.0%) |
| 1 or 2 Children | 77 (100.0%) | 0 (0.0%) |
| 3 or 4 Children | 5 (100.0%) | 0 (0.0%) |
| 5 or more Children | 0 (0.0%) | 0 (0.0%) |
| Total | 236 (100.0%) | 0 (0.0%) |
Income Below Poverty Among Single-Parent Households in Beloit
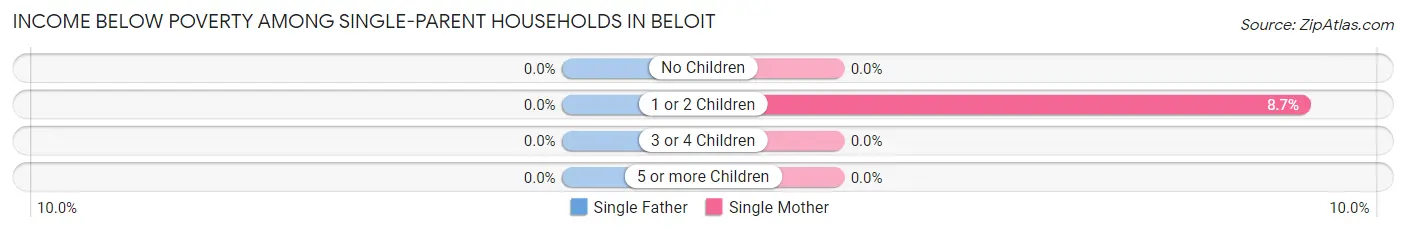
| Children | Single Father | Single Mother |
| No Children | 0 (0.0%) | 0 (0.0%) |
| 1 or 2 Children | 0 (0.0%) | 2 (8.7%) |
| 3 or 4 Children | 0 (0.0%) | 0 (0.0%) |
| 5 or more Children | 0 (0.0%) | 0 (0.0%) |
| Total | 0 (0.0%) | 2 (5.9%) |
Income Below Poverty Among Married-Couple vs Single-Parent Households in Beloit
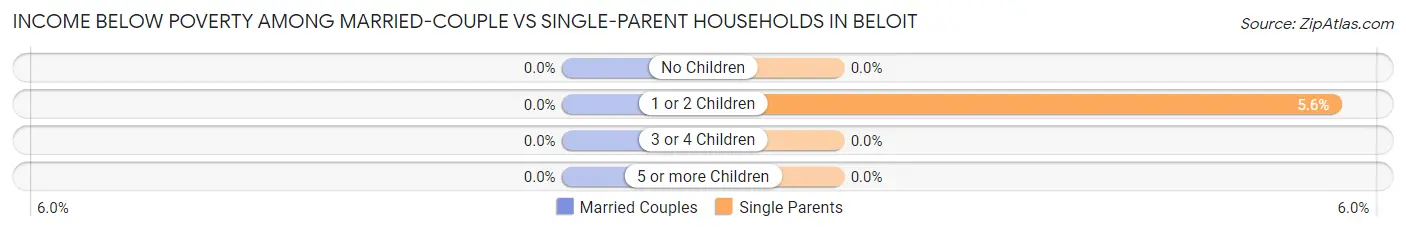
| Children | Married-Couple Families | Single-Parent Households |
| No Children | 0 (0.0%) | 0 (0.0%) |
| 1 or 2 Children | 0 (0.0%) | 2 (5.6%) |
| 3 or 4 Children | 0 (0.0%) | 0 (0.0%) |
| 5 or more Children | 0 (0.0%) | 0 (0.0%) |
| Total | 0 (0.0%) | 2 (2.8%) |
Race in Beloit
The most populous races in Beloit are White / Caucasian (1,099 | 96.4%), Hispanic or Latino (41 | 3.6%), and Two or more Races (36 | 3.2%).
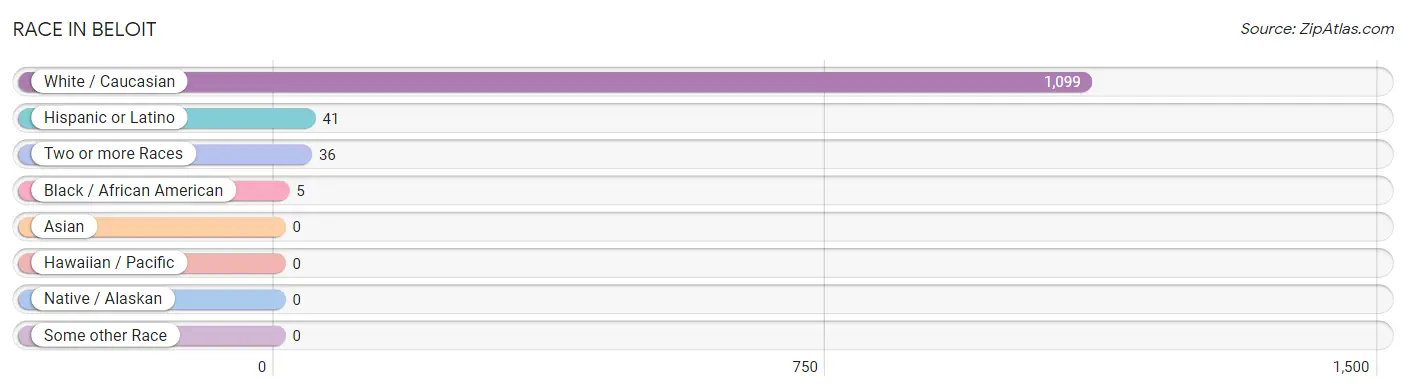
| Race | # Population | % Population |
| Asian | 0 | 0.0% |
| Black / African American | 5 | 0.4% |
| Hawaiian / Pacific | 0 | 0.0% |
| Hispanic or Latino | 41 | 3.6% |
| Native / Alaskan | 0 | 0.0% |
| White / Caucasian | 1,099 | 96.4% |
| Two or more Races | 36 | 3.2% |
| Some other Race | 0 | 0.0% |
| Total | 1,140 | 100.0% |
Ancestry in Beloit
The most populous ancestries reported in Beloit are English (317 | 27.8%), German (179 | 15.7%), Irish (121 | 10.6%), Swiss (57 | 5.0%), and Scottish (48 | 4.2%), together accounting for 63.3% of all Beloit residents.
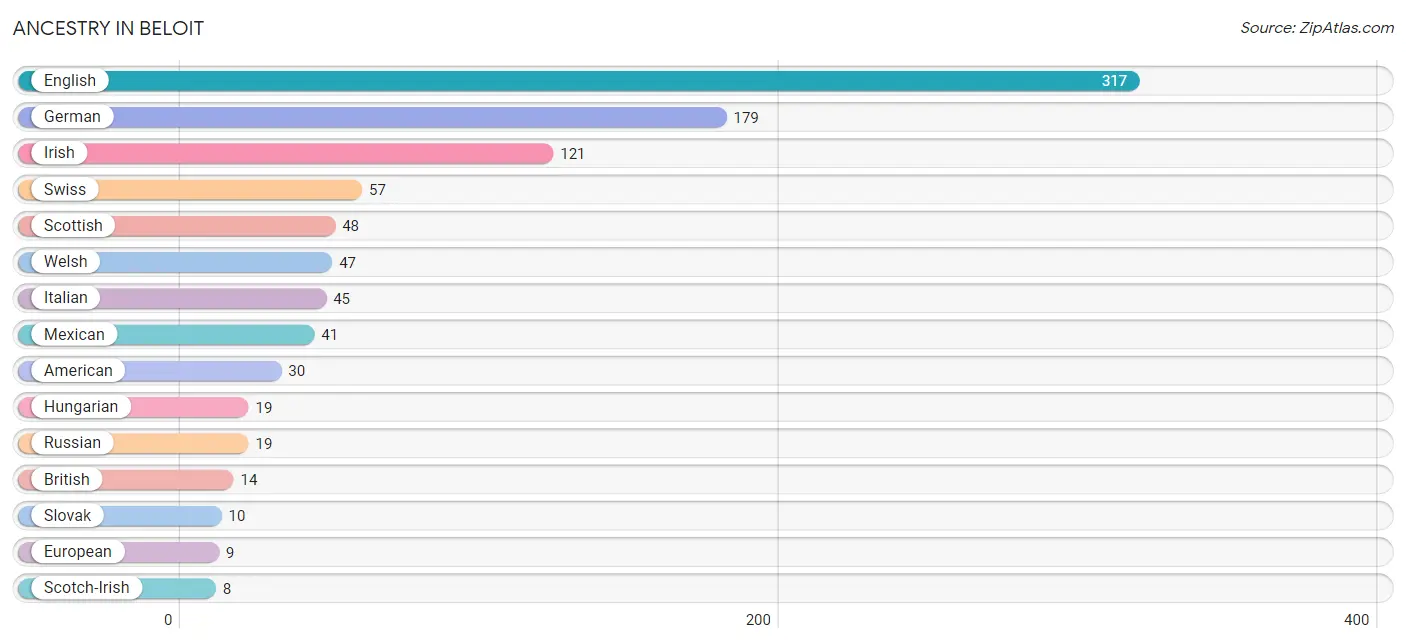
| Ancestry | # Population | % Population |
| American | 30 | 2.6% |
| British | 14 | 1.2% |
| Cherokee | 4 | 0.4% |
| Dutch | 5 | 0.4% |
| English | 317 | 27.8% |
| European | 9 | 0.8% |
| French | 6 | 0.5% |
| German | 179 | 15.7% |
| Greek | 6 | 0.5% |
| Hungarian | 19 | 1.7% |
| Irish | 121 | 10.6% |
| Italian | 45 | 4.0% |
| Mexican | 41 | 3.6% |
| Northern European | 3 | 0.3% |
| Norwegian | 3 | 0.3% |
| Russian | 19 | 1.7% |
| Scotch-Irish | 8 | 0.7% |
| Scottish | 48 | 4.2% |
| Slovak | 10 | 0.9% |
| Swiss | 57 | 5.0% |
| Welsh | 47 | 4.1% | View All 21 Rows |
Immigrants in Beloit

| Immigration Origin | # Population | % Population | View All 0 Rows |
Sex and Age in Beloit
Sex and Age in Beloit
The most populous age groups in Beloit are 40 to 44 Years (87 | 15.7%) for men and 65 to 69 Years (63 | 10.8%) for women.
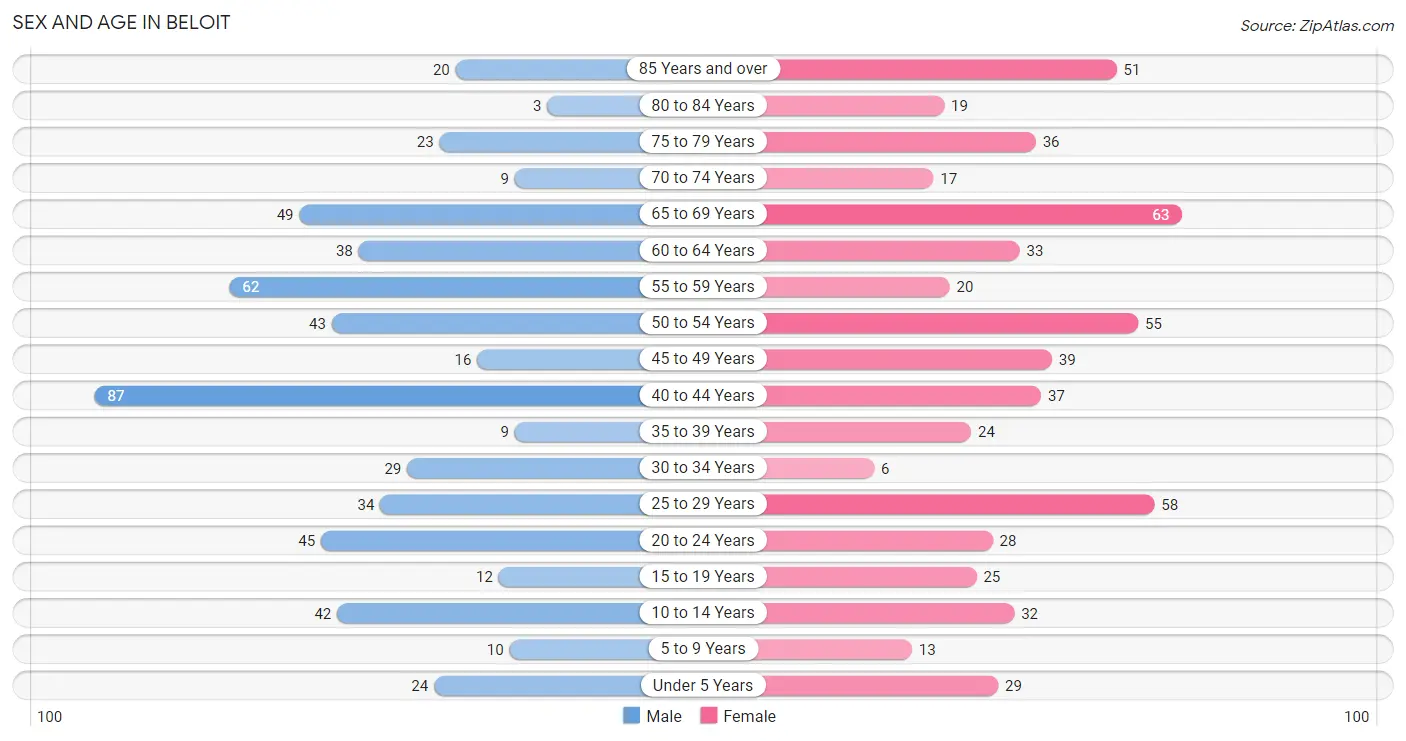
| Age Bracket | Male | Female |
| Under 5 Years | 24 (4.3%) | 29 (5.0%) |
| 5 to 9 Years | 10 (1.8%) | 13 (2.2%) |
| 10 to 14 Years | 42 (7.6%) | 32 (5.5%) |
| 15 to 19 Years | 12 (2.2%) | 25 (4.3%) |
| 20 to 24 Years | 45 (8.1%) | 28 (4.8%) |
| 25 to 29 Years | 34 (6.1%) | 58 (9.9%) |
| 30 to 34 Years | 29 (5.2%) | 6 (1.0%) |
| 35 to 39 Years | 9 (1.6%) | 24 (4.1%) |
| 40 to 44 Years | 87 (15.7%) | 37 (6.3%) |
| 45 to 49 Years | 16 (2.9%) | 39 (6.7%) |
| 50 to 54 Years | 43 (7.7%) | 55 (9.4%) |
| 55 to 59 Years | 62 (11.2%) | 20 (3.4%) |
| 60 to 64 Years | 38 (6.9%) | 33 (5.6%) |
| 65 to 69 Years | 49 (8.8%) | 63 (10.8%) |
| 70 to 74 Years | 9 (1.6%) | 17 (2.9%) |
| 75 to 79 Years | 23 (4.1%) | 36 (6.1%) |
| 80 to 84 Years | 3 (0.5%) | 19 (3.3%) |
| 85 Years and over | 20 (3.6%) | 51 (8.7%) |
| Total | 555 (100.0%) | 585 (100.0%) |
Families and Households in Beloit
Median Family Size in Beloit
The median family size in Beloit is 2.67 persons per family, with single male/father families (38 | 12.3%) accounting for the largest median family size of 2.87 persons per family. On the other hand, single female/mother families (34 | 11.0%) represent the smallest median family size with 2.15 persons per family.
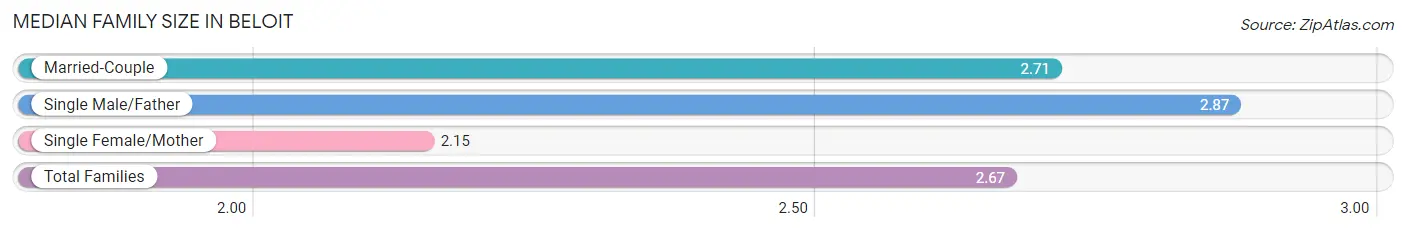
| Family Type | # Families | Family Size |
| Married-Couple | 236 (76.6%) | 2.71 |
| Single Male/Father | 38 (12.3%) | 2.87 |
| Single Female/Mother | 34 (11.0%) | 2.15 |
| Total Families | 308 (100.0%) | 2.67 |
Median Household Size in Beloit
The median household size in Beloit is 2.19 persons per household, with single male/father households (38 | 7.3%) accounting for the largest median household size of 4.24 persons per household. non-family households (212 | 40.8%) represent the smallest median household size with 1.22 persons per household.
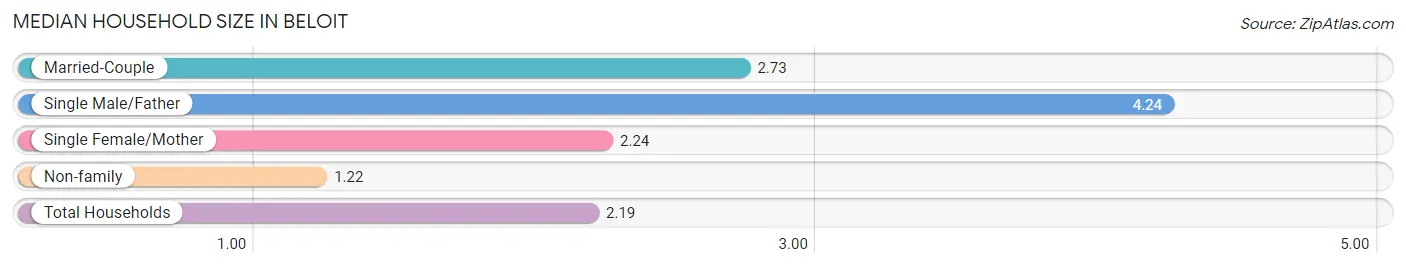
| Household Type | # Households | Household Size |
| Married-Couple | 236 (45.4%) | 2.73 |
| Single Male/Father | 38 (7.3%) | 4.24 |
| Single Female/Mother | 34 (6.5%) | 2.24 |
| Non-family | 212 (40.8%) | 1.22 |
| Total Households | 520 (100.0%) | 2.19 |
Household Size by Marriage Status in Beloit
Out of a total of 520 households in Beloit, 308 (59.2%) are family households, while 212 (40.8%) are nonfamily households. The most numerous type of family households are 2-person households, comprising 121, and the most common type of nonfamily households are 1-person households, comprising 165.
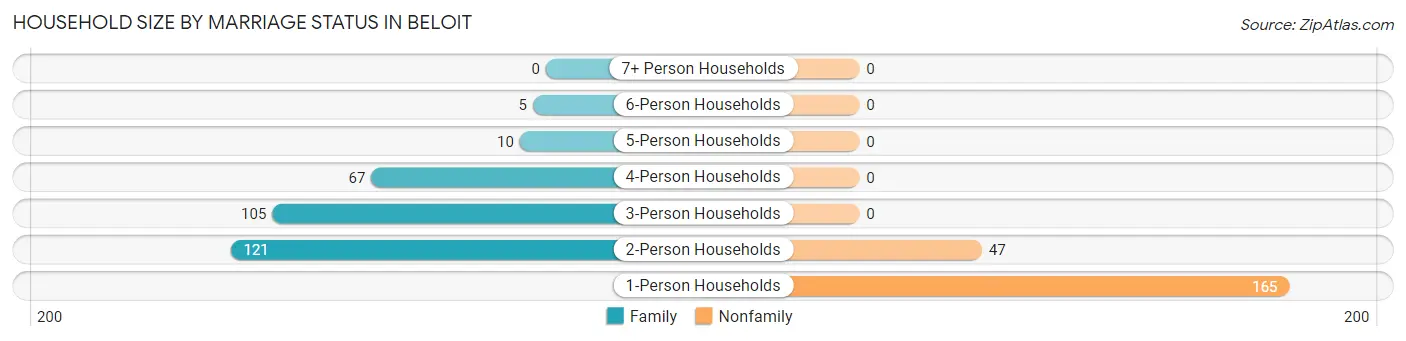
| Household Size | Family Households | Nonfamily Households |
| 1-Person Households | - | 165 (31.7%) |
| 2-Person Households | 121 (23.3%) | 47 (9.0%) |
| 3-Person Households | 105 (20.2%) | 0 (0.0%) |
| 4-Person Households | 67 (12.9%) | 0 (0.0%) |
| 5-Person Households | 10 (1.9%) | 0 (0.0%) |
| 6-Person Households | 5 (1.0%) | 0 (0.0%) |
| 7+ Person Households | 0 (0.0%) | 0 (0.0%) |
| Total | 308 (59.2%) | 212 (40.8%) |
Female Fertility in Beloit
Fertility by Age in Beloit
Average fertility rate in Beloit is 112.0 births per 1,000 women. Women in the age bracket of 20 to 34 years have the highest fertility rate with 283.0 births per 1,000 women. Women in the age bracket of 20 to 34 years acount for 100.0% of all women with births.
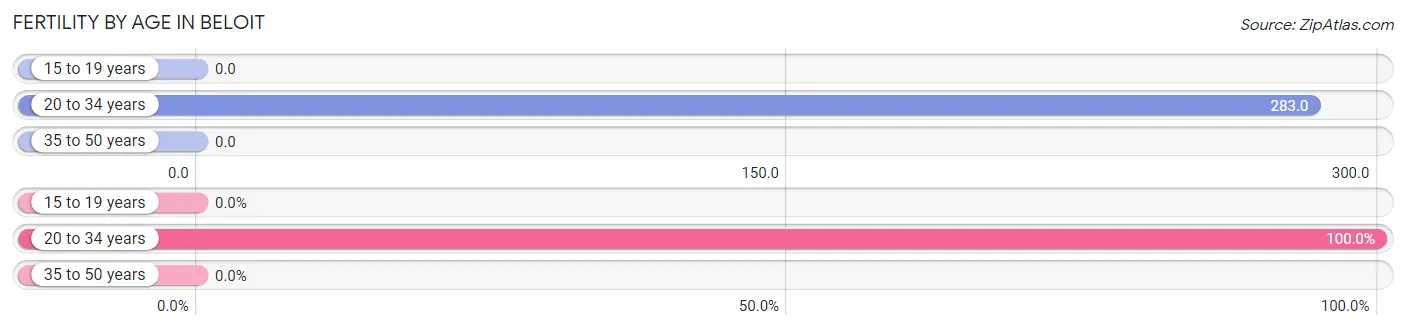
| Age Bracket | Women with Births | Births / 1,000 Women |
| 15 to 19 years | 0 (0.0%) | 0.0 |
| 20 to 34 years | 26 (100.0%) | 283.0 |
| 35 to 50 years | 0 (0.0%) | 0.0 |
| Total | 26 (100.0%) | 112.0 |
Fertility by Age by Marriage Status in Beloit
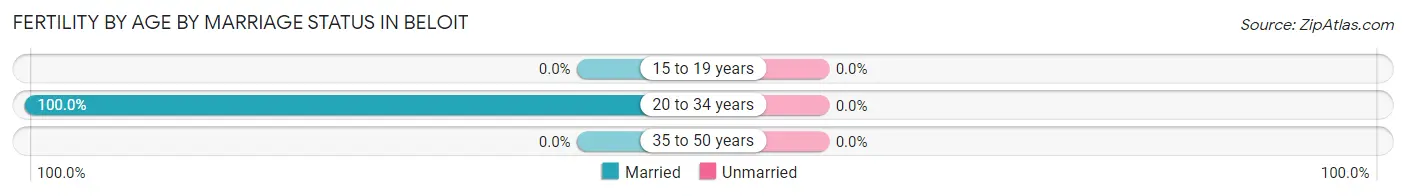
| Age Bracket | Married | Unmarried |
| 15 to 19 years | 0 (0.0%) | 0 (0.0%) |
| 20 to 34 years | 26 (100.0%) | 0 (0.0%) |
| 35 to 50 years | 0 (0.0%) | 0 (0.0%) |
| Total | 26 (100.0%) | 0 (0.0%) |
Fertility by Education in Beloit
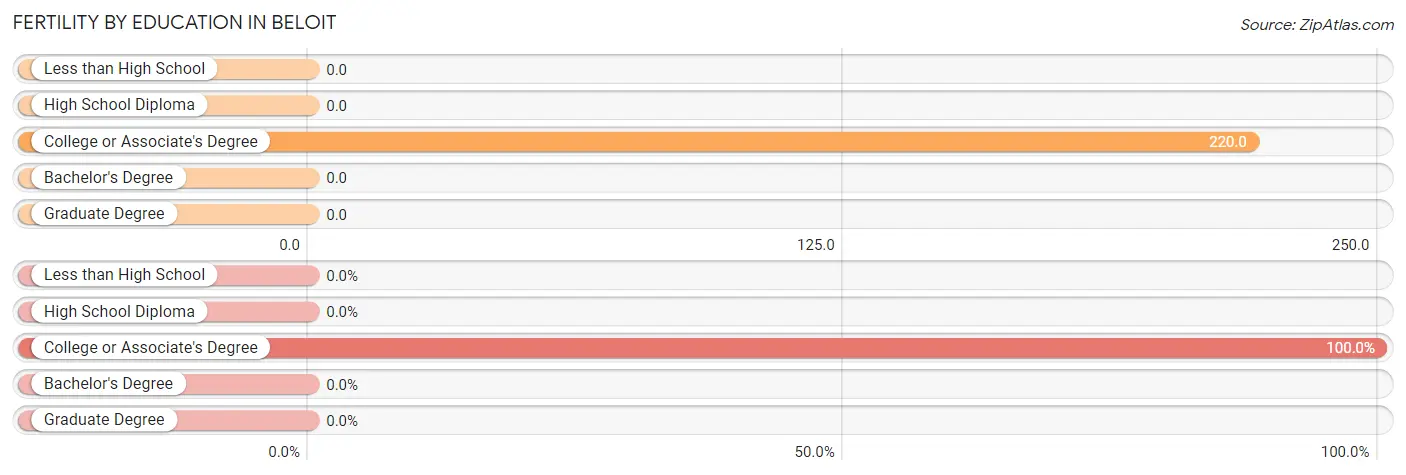
| Educational Attainment | Women with Births | Births / 1,000 Women |
| Less than High School | 0 (0.0%) | 0.0 |
| High School Diploma | 0 (0.0%) | 0.0 |
| College or Associate's Degree | 26 (100.0%) | 220.0 |
| Bachelor's Degree | 0 (0.0%) | 0.0 |
| Graduate Degree | 0 (0.0%) | 0.0 |
| Total | 26 (100.0%) | 112.0 |
Fertility by Education by Marriage Status in Beloit
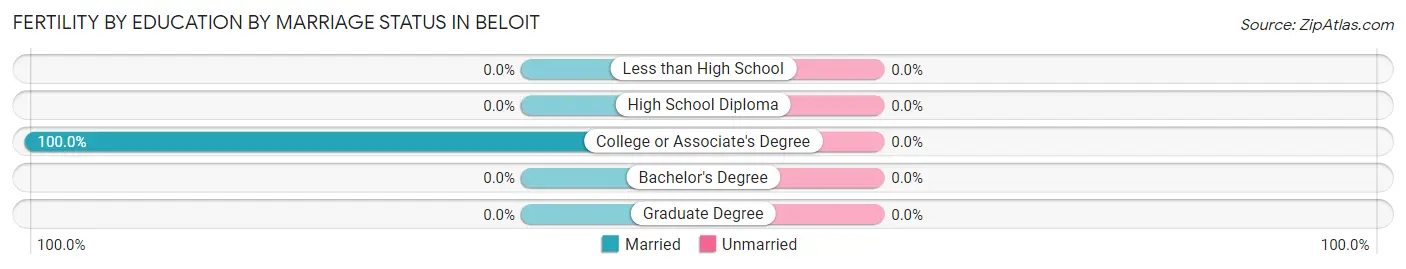
| Educational Attainment | Married | Unmarried |
| Less than High School | 0 (0.0%) | 0 (0.0%) |
| High School Diploma | 0 (0.0%) | 0 (0.0%) |
| College or Associate's Degree | 26 (100.0%) | 0 (0.0%) |
| Bachelor's Degree | 0 (0.0%) | 0 (0.0%) |
| Graduate Degree | 0 (0.0%) | 0 (0.0%) |
| Total | 26 (100.0%) | 0 (0.0%) |
Employment Characteristics in Beloit
Employment by Class of Employer in Beloit
Among the 600 employed individuals in Beloit, private company employees (407 | 67.8%), not-for-profit organizations (120 | 20.0%), and local government employees (29 | 4.8%) make up the most common classes of employment.
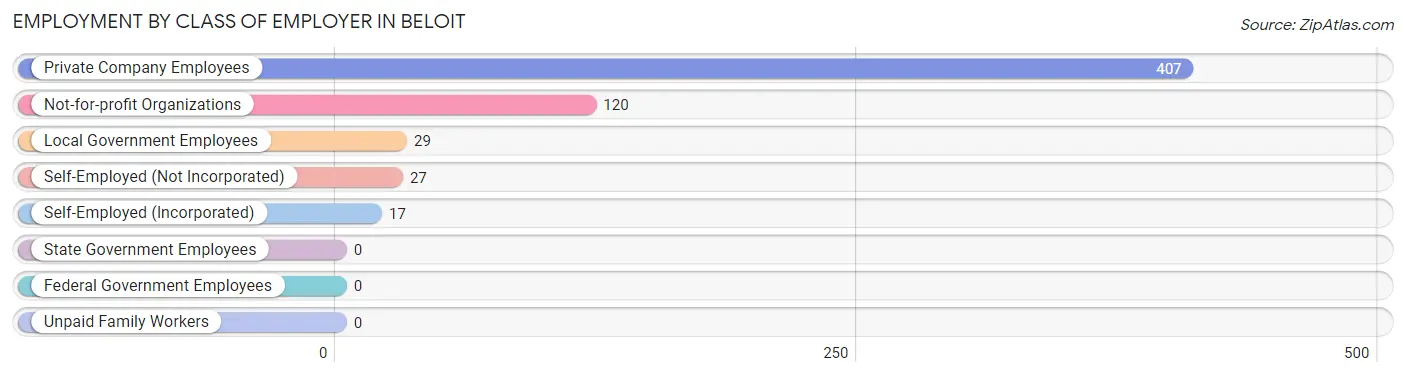
| Employer Class | # Employees | % Employees |
| Private Company Employees | 407 | 67.8% |
| Self-Employed (Incorporated) | 17 | 2.8% |
| Self-Employed (Not Incorporated) | 27 | 4.5% |
| Not-for-profit Organizations | 120 | 20.0% |
| Local Government Employees | 29 | 4.8% |
| State Government Employees | 0 | 0.0% |
| Federal Government Employees | 0 | 0.0% |
| Unpaid Family Workers | 0 | 0.0% |
| Total | 600 | 100.0% |
Employment Status by Age in Beloit
According to the labor force statistics for Beloit, out of the total population over 16 years of age (973), 66.1% or 643 individuals are in the labor force, with 4.0% or 26 of them unemployed. The age group with the highest labor force participation rate is 25 to 29 years, with 100.0% or 92 individuals in the labor force. Within the labor force, the 20 to 24 years age range has the highest percentage of unemployed individuals, with 30.0% or 9 of them being unemployed.
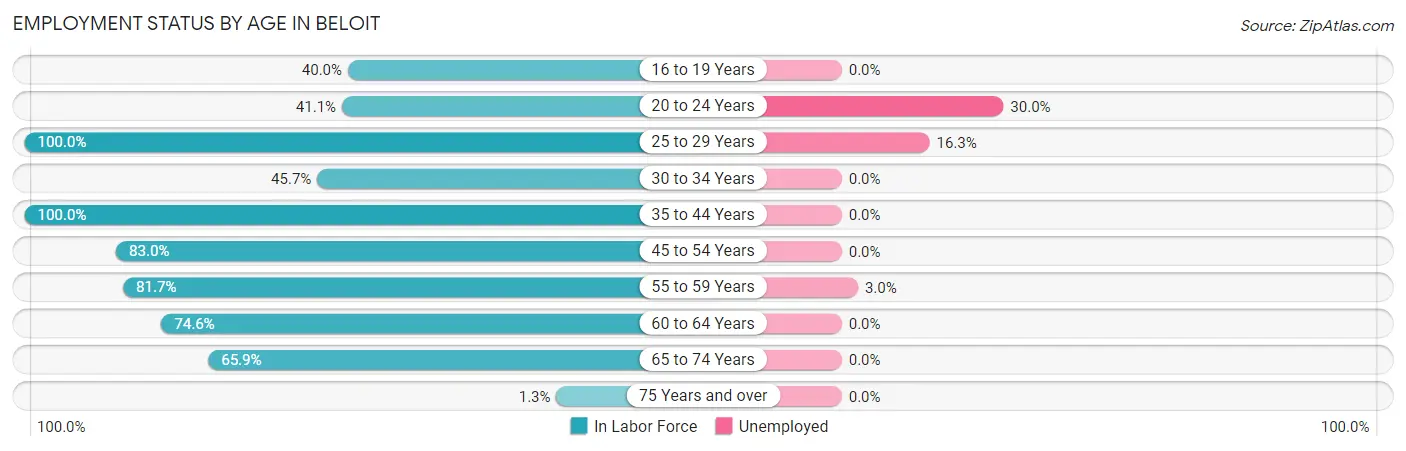
| Age Bracket | In Labor Force | Unemployed |
| 16 to 19 Years | 8 (40.0%) | 0 (0.0%) |
| 20 to 24 Years | 30 (41.1%) | 9 (30.0%) |
| 25 to 29 Years | 92 (100.0%) | 15 (16.3%) |
| 30 to 34 Years | 16 (45.7%) | 0 (0.0%) |
| 35 to 44 Years | 157 (100.0%) | 0 (0.0%) |
| 45 to 54 Years | 127 (83.0%) | 0 (0.0%) |
| 55 to 59 Years | 67 (81.7%) | 2 (3.0%) |
| 60 to 64 Years | 53 (74.6%) | 0 (0.0%) |
| 65 to 74 Years | 91 (65.9%) | 0 (0.0%) |
| 75 Years and over | 2 (1.3%) | 0 (0.0%) |
| Total | 643 (66.1%) | 26 (4.0%) |
Employment Status by Educational Attainment in Beloit
According to labor force statistics for Beloit, 86.8% of individuals (512) out of the total population between 25 and 64 years of age (590) are in the labor force, with 3.3% or 17 of them being unemployed. The group with the highest labor force participation rate are those with the educational attainment of college / associate degree, with 100.0% or 203 individuals in the labor force. Within the labor force, individuals with college / associate degree education have the highest percentage of unemployment, with 7.4% or 15 of them being unemployed.
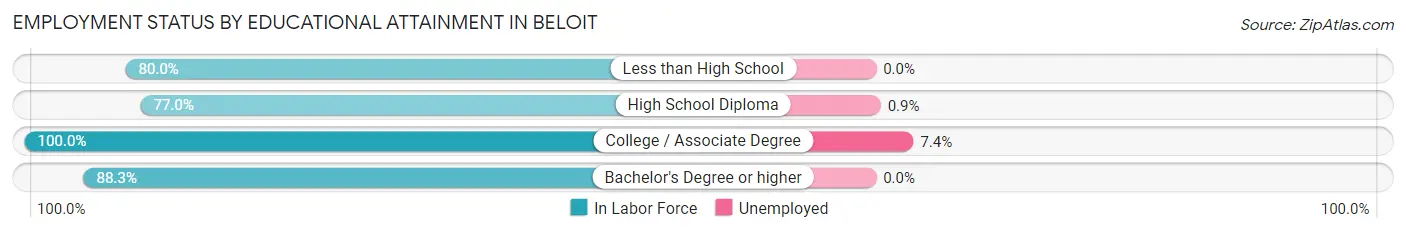
| Educational Attainment | In Labor Force | Unemployed |
| Less than High School | 12 (80.0%) | 0 (0.0%) |
| High School Diploma | 214 (77.0%) | 3 (0.9%) |
| College / Associate Degree | 203 (100.0%) | 15 (7.4%) |
| Bachelor's Degree or higher | 83 (88.3%) | 0 (0.0%) |
| Total | 512 (86.8%) | 19 (3.3%) |
Employment Occupations by Sex in Beloit
Management, Business, Science and Arts Occupations
The most common Management, Business, Science and Arts occupations in Beloit are Community & Social Service (47 | 7.6%), Computers, Engineering & Science (44 | 7.1%), Architecture & Engineering (44 | 7.1%), Management (37 | 6.0%), and Health Diagnosing & Treating (31 | 5.0%).
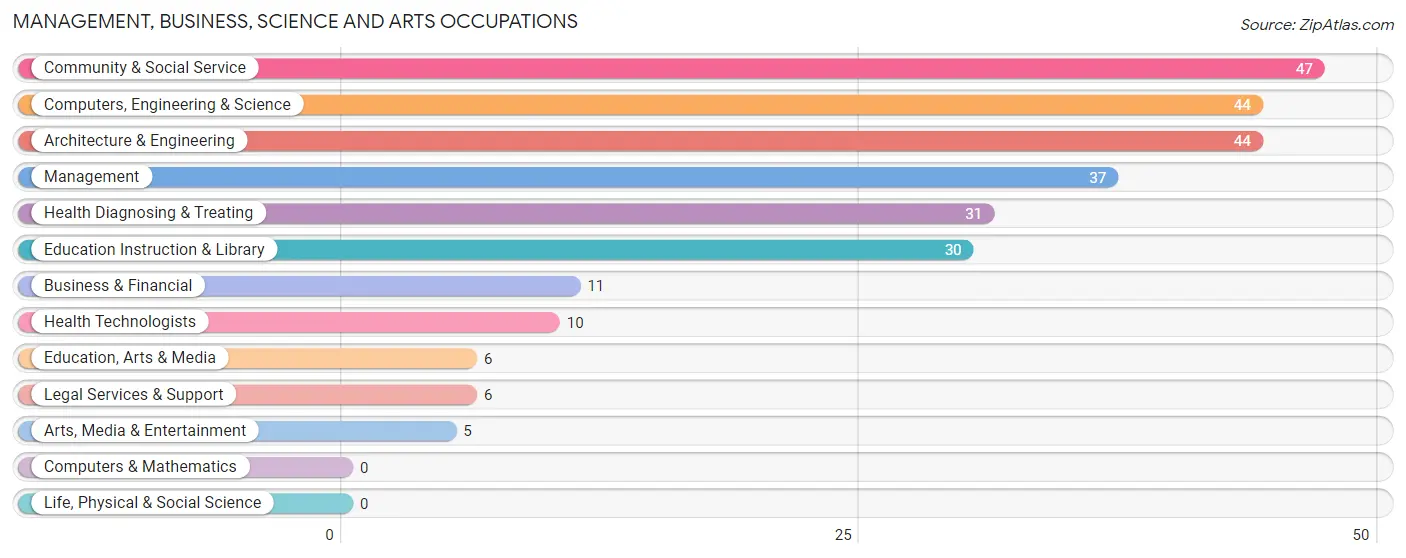
Management, Business, Science and Arts Occupations by Sex
Within the Management, Business, Science and Arts occupations in Beloit, the most male-oriented occupations are Computers, Engineering & Science (100.0%), Architecture & Engineering (100.0%), and Legal Services & Support (100.0%), while the most female-oriented occupations are Education Instruction & Library (100.0%), Arts, Media & Entertainment (100.0%), and Health Technologists (100.0%).
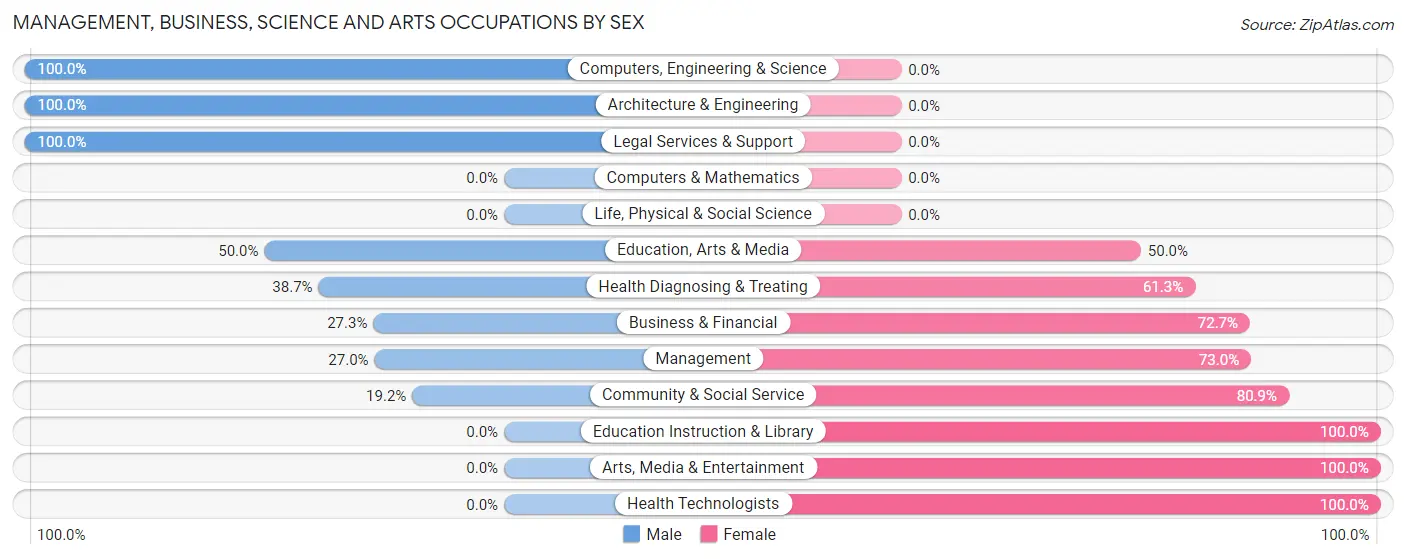
| Occupation | Male | Female |
| Management | 10 (27.0%) | 27 (73.0%) |
| Business & Financial | 3 (27.3%) | 8 (72.7%) |
| Computers, Engineering & Science | 44 (100.0%) | 0 (0.0%) |
| Computers & Mathematics | 0 (0.0%) | 0 (0.0%) |
| Architecture & Engineering | 44 (100.0%) | 0 (0.0%) |
| Life, Physical & Social Science | 0 (0.0%) | 0 (0.0%) |
| Community & Social Service | 9 (19.2%) | 38 (80.8%) |
| Education, Arts & Media | 3 (50.0%) | 3 (50.0%) |
| Legal Services & Support | 6 (100.0%) | 0 (0.0%) |
| Education Instruction & Library | 0 (0.0%) | 30 (100.0%) |
| Arts, Media & Entertainment | 0 (0.0%) | 5 (100.0%) |
| Health Diagnosing & Treating | 12 (38.7%) | 19 (61.3%) |
| Health Technologists | 0 (0.0%) | 10 (100.0%) |
| Total (Category) | 78 (45.9%) | 92 (54.1%) |
| Total (Overall) | 332 (53.8%) | 285 (46.2%) |
Services Occupations
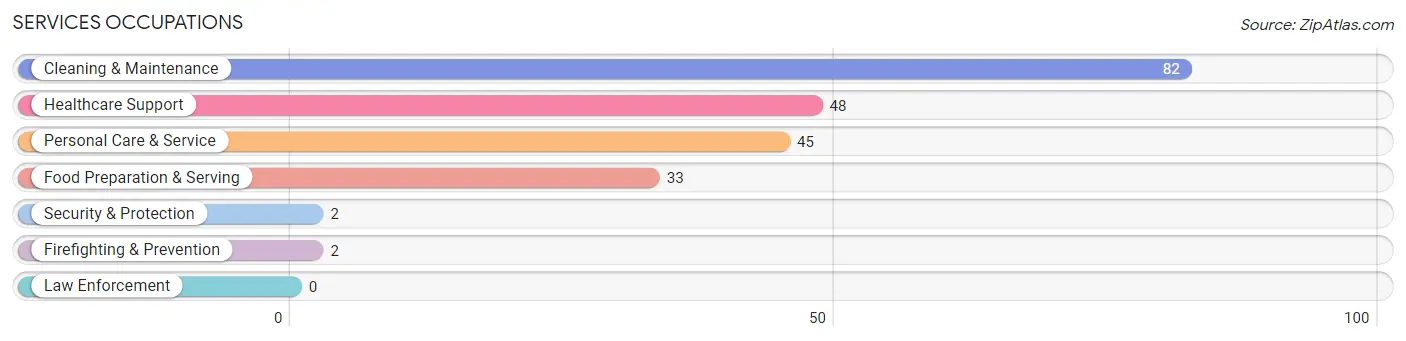
The most common Services occupations in Beloit are Cleaning & Maintenance (82 | 13.3%), Healthcare Support (48 | 7.8%), Personal Care & Service (45 | 7.3%), Food Preparation & Serving (33 | 5.3%), and Security & Protection (2 | 0.3%).
Services Occupations by Sex
Within the Services occupations in Beloit, the most male-oriented occupations are Security & Protection (100.0%), Firefighting & Prevention (100.0%), and Cleaning & Maintenance (96.3%), while the most female-oriented occupations are Healthcare Support (100.0%), Personal Care & Service (100.0%), and Food Preparation & Serving (81.8%).
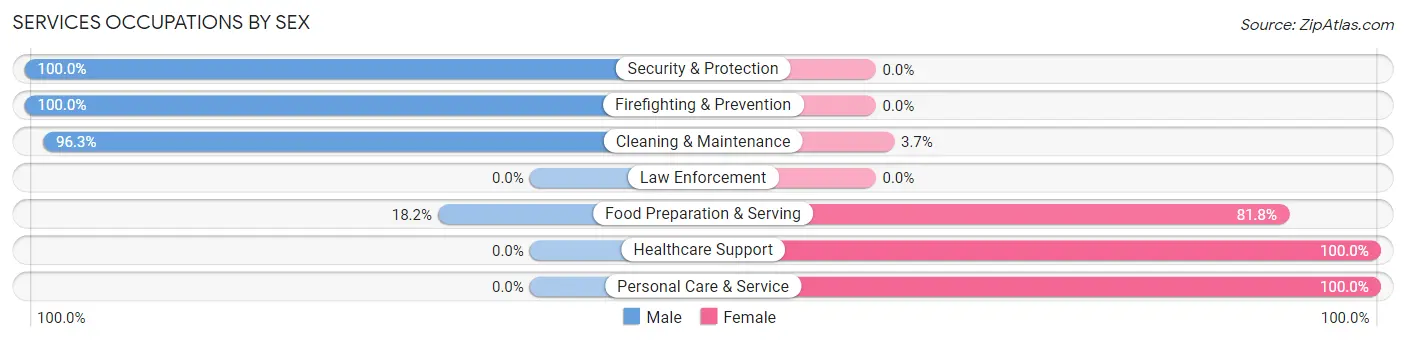
| Occupation | Male | Female |
| Healthcare Support | 0 (0.0%) | 48 (100.0%) |
| Security & Protection | 2 (100.0%) | 0 (0.0%) |
| Firefighting & Prevention | 2 (100.0%) | 0 (0.0%) |
| Law Enforcement | 0 (0.0%) | 0 (0.0%) |
| Food Preparation & Serving | 6 (18.2%) | 27 (81.8%) |
| Cleaning & Maintenance | 79 (96.3%) | 3 (3.7%) |
| Personal Care & Service | 0 (0.0%) | 45 (100.0%) |
| Total (Category) | 87 (41.4%) | 123 (58.6%) |
| Total (Overall) | 332 (53.8%) | 285 (46.2%) |
Sales and Office Occupations
The most common Sales and Office occupations in Beloit are Sales & Related (32 | 5.2%), and Office & Administration (21 | 3.4%).
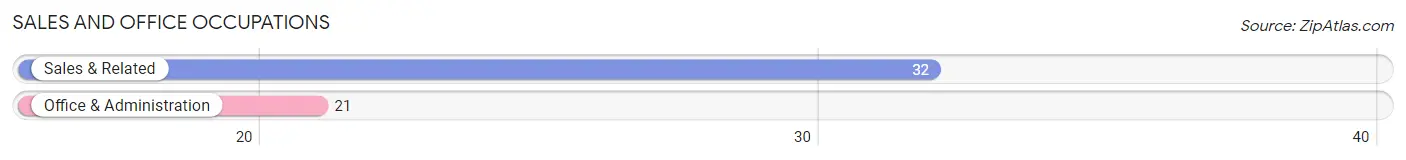
Sales and Office Occupations by Sex
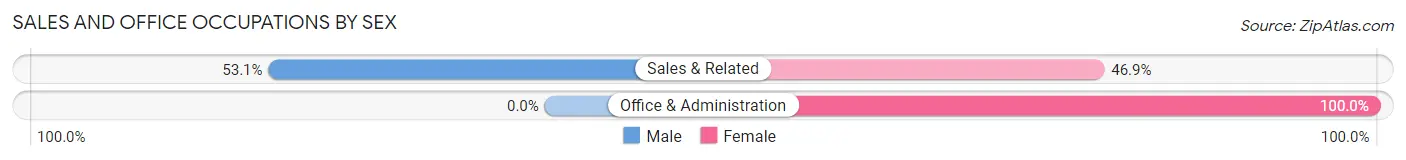
| Occupation | Male | Female |
| Sales & Related | 17 (53.1%) | 15 (46.9%) |
| Office & Administration | 0 (0.0%) | 21 (100.0%) |
| Total (Category) | 17 (32.1%) | 36 (67.9%) |
| Total (Overall) | 332 (53.8%) | 285 (46.2%) |
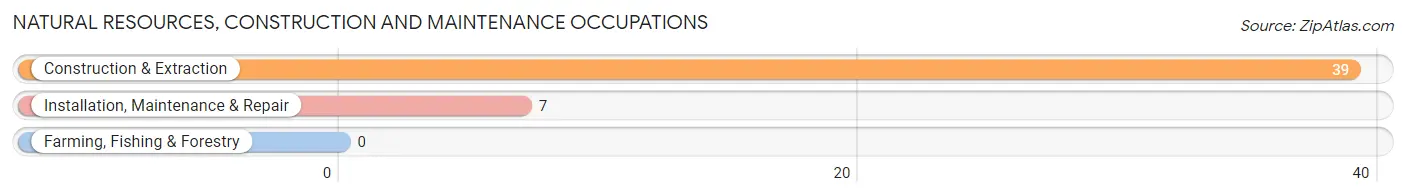
Natural Resources, Construction and Maintenance Occupations
The most common Natural Resources, Construction and Maintenance occupations in Beloit are Construction & Extraction (39 | 6.3%), and Installation, Maintenance & Repair (7 | 1.1%).
Natural Resources, Construction and Maintenance Occupations by Sex
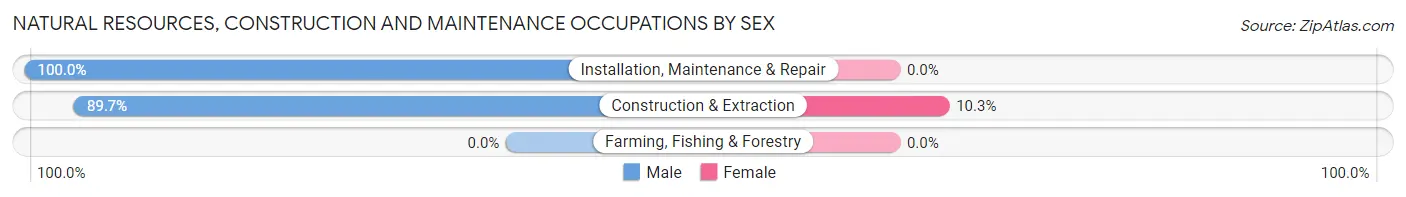
| Occupation | Male | Female |
| Farming, Fishing & Forestry | 0 (0.0%) | 0 (0.0%) |
| Construction & Extraction | 35 (89.7%) | 4 (10.3%) |
| Installation, Maintenance & Repair | 7 (100.0%) | 0 (0.0%) |
| Total (Category) | 42 (91.3%) | 4 (8.7%) |
| Total (Overall) | 332 (53.8%) | 285 (46.2%) |
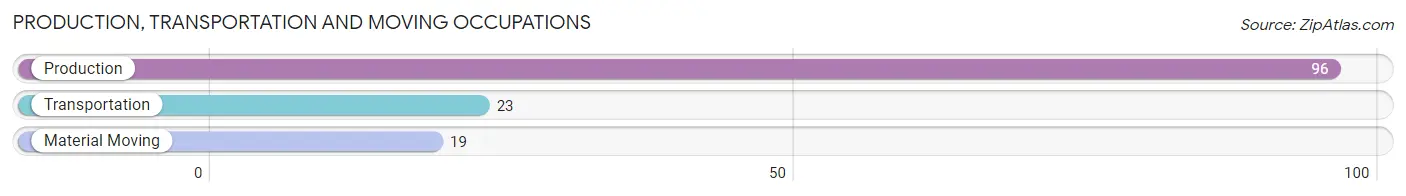
Production, Transportation and Moving Occupations
The most common Production, Transportation and Moving occupations in Beloit are Production (96 | 15.6%), Transportation (23 | 3.7%), and Material Moving (19 | 3.1%).
Production, Transportation and Moving Occupations by Sex
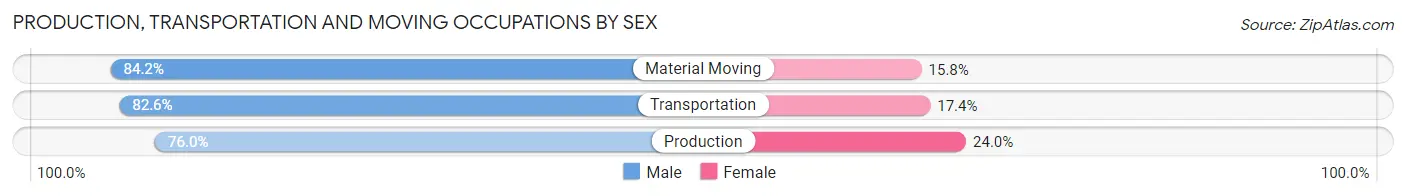
| Occupation | Male | Female |
| Production | 73 (76.0%) | 23 (24.0%) |
| Transportation | 19 (82.6%) | 4 (17.4%) |
| Material Moving | 16 (84.2%) | 3 (15.8%) |
| Total (Category) | 108 (78.3%) | 30 (21.7%) |
| Total (Overall) | 332 (53.8%) | 285 (46.2%) |
Employment Industries by Sex in Beloit
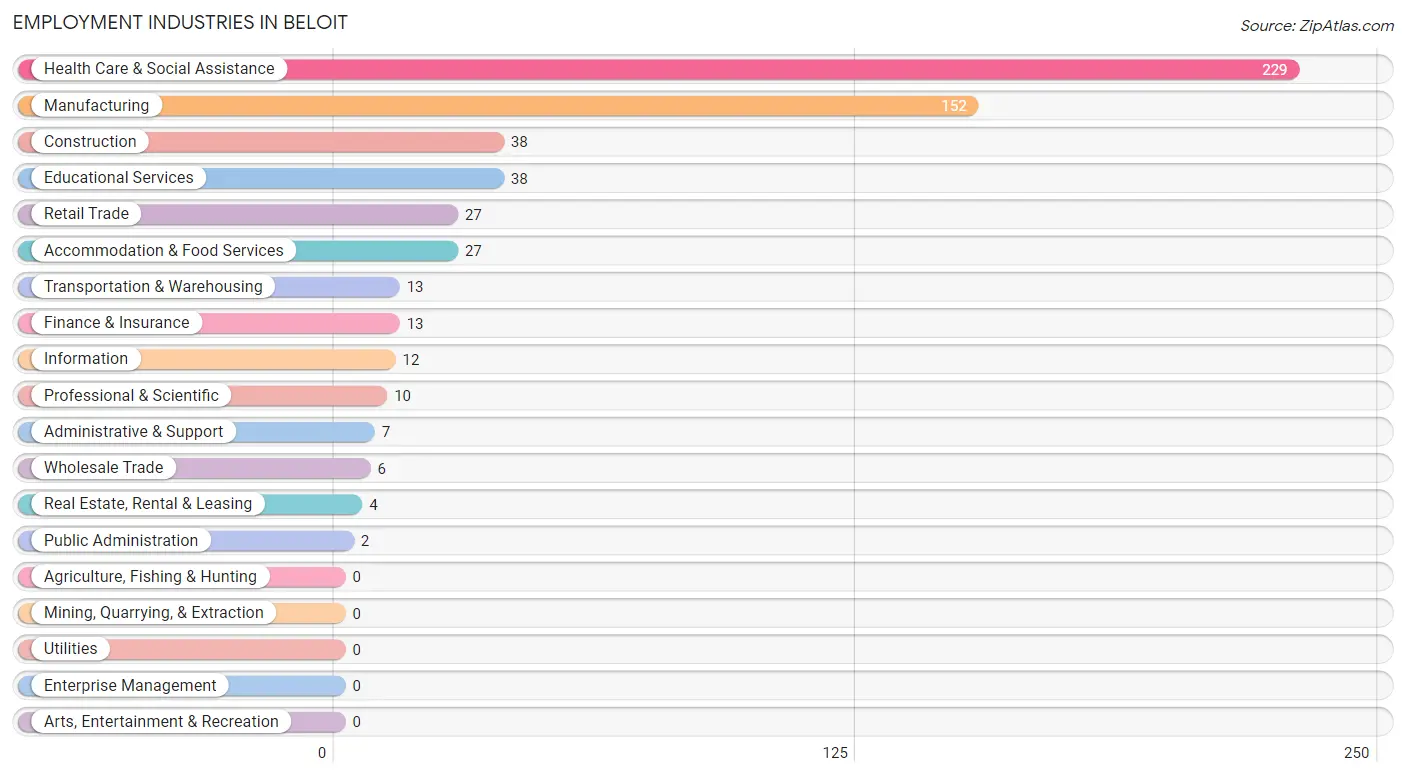
Employment Industries in Beloit
The major employment industries in Beloit include Health Care & Social Assistance (229 | 37.1%), Manufacturing (152 | 24.6%), Construction (38 | 6.2%), Educational Services (38 | 6.2%), and Retail Trade (27 | 4.4%).
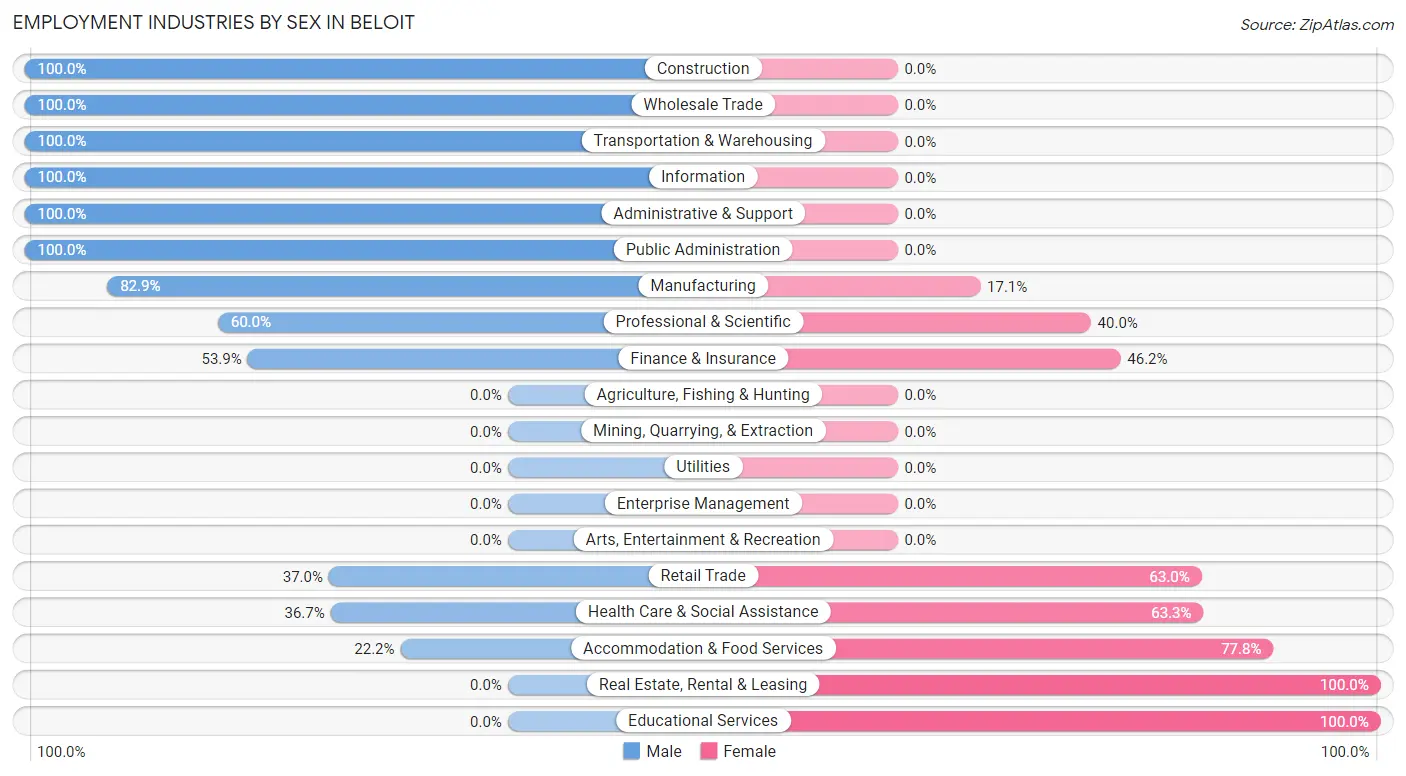
Employment Industries by Sex in Beloit
The Beloit industries that see more men than women are Construction (100.0%), Wholesale Trade (100.0%), and Transportation & Warehousing (100.0%), whereas the industries that tend to have a higher number of women are Real Estate, Rental & Leasing (100.0%), Educational Services (100.0%), and Accommodation & Food Services (77.8%).
| Industry | Male | Female |
| Agriculture, Fishing & Hunting | 0 (0.0%) | 0 (0.0%) |
| Mining, Quarrying, & Extraction | 0 (0.0%) | 0 (0.0%) |
| Construction | 38 (100.0%) | 0 (0.0%) |
| Manufacturing | 126 (82.9%) | 26 (17.1%) |
| Wholesale Trade | 6 (100.0%) | 0 (0.0%) |
| Retail Trade | 10 (37.0%) | 17 (63.0%) |
| Transportation & Warehousing | 13 (100.0%) | 0 (0.0%) |
| Utilities | 0 (0.0%) | 0 (0.0%) |
| Information | 12 (100.0%) | 0 (0.0%) |
| Finance & Insurance | 7 (53.8%) | 6 (46.2%) |
| Real Estate, Rental & Leasing | 0 (0.0%) | 4 (100.0%) |
| Professional & Scientific | 6 (60.0%) | 4 (40.0%) |
| Enterprise Management | 0 (0.0%) | 0 (0.0%) |
| Administrative & Support | 7 (100.0%) | 0 (0.0%) |
| Educational Services | 0 (0.0%) | 38 (100.0%) |
| Health Care & Social Assistance | 84 (36.7%) | 145 (63.3%) |
| Arts, Entertainment & Recreation | 0 (0.0%) | 0 (0.0%) |
| Accommodation & Food Services | 6 (22.2%) | 21 (77.8%) |
| Public Administration | 2 (100.0%) | 0 (0.0%) |
| Total | 332 (53.8%) | 285 (46.2%) |
Education in Beloit
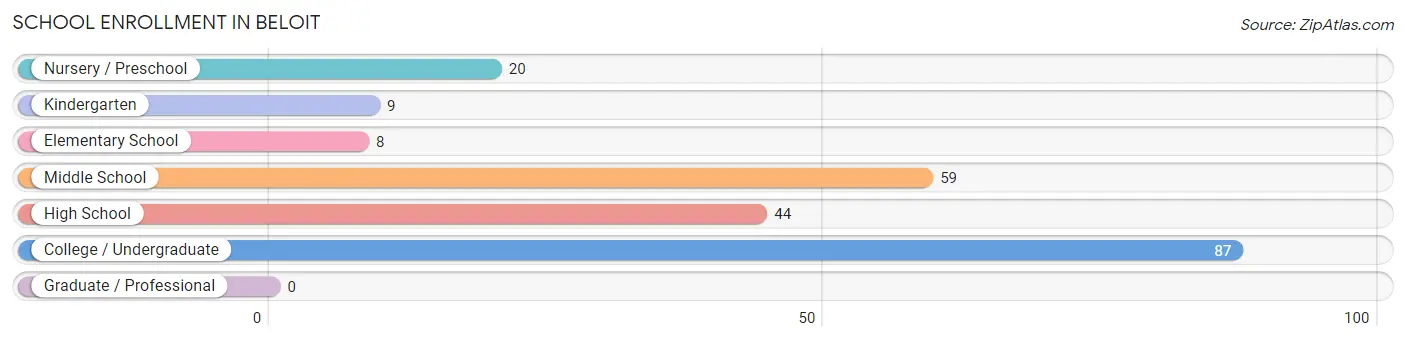
School Enrollment in Beloit
The most common levels of schooling among the 227 students in Beloit are college / undergraduate (87 | 38.3%), middle school (59 | 26.0%), and high school (44 | 19.4%).
| School Level | # Students | % Students |
| Nursery / Preschool | 20 | 8.8% |
| Kindergarten | 9 | 4.0% |
| Elementary School | 8 | 3.5% |
| Middle School | 59 | 26.0% |
| High School | 44 | 19.4% |
| College / Undergraduate | 87 | 38.3% |
| Graduate / Professional | 0 | 0.0% |
| Total | 227 | 100.0% |
School Enrollment by Age by Funding Source in Beloit
Out of a total of 227 students who are enrolled in schools in Beloit, 71 (31.3%) attend a private institution, while the remaining 156 (68.7%) are enrolled in public schools. The age group of 25 to 34 year olds has the highest likelihood of being enrolled in private schools, with 26 (100.0% in the age bracket) enrolled. Conversely, the age group of 10 to 14 year olds has the lowest likelihood of being enrolled in a private school, with 74 (100.0% in the age bracket) attending a public institution.
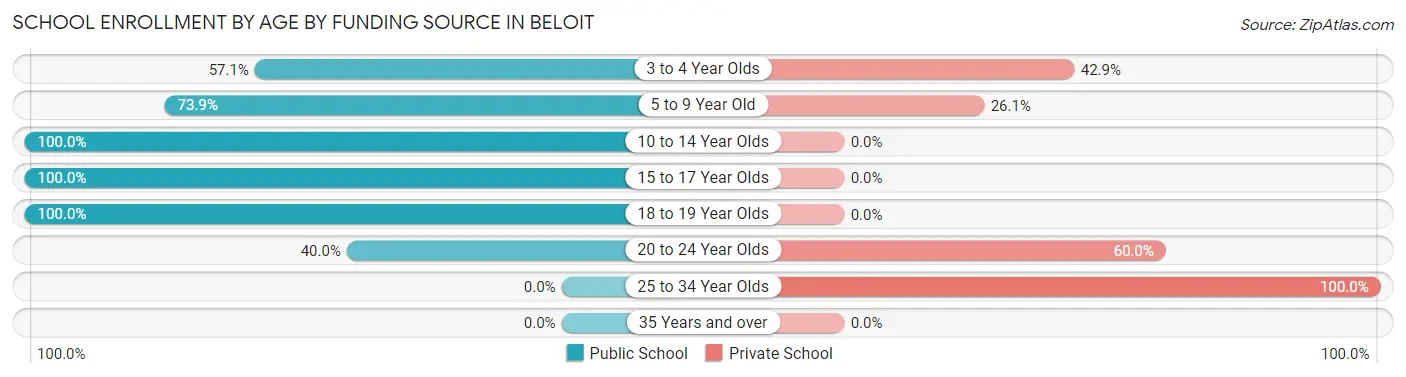
| Age Bracket | Public School | Private School |
| 3 to 4 Year Olds | 8 (57.1%) | 6 (42.9%) |
| 5 to 9 Year Old | 17 (73.9%) | 6 (26.1%) |
| 10 to 14 Year Olds | 74 (100.0%) | 0 (0.0%) |
| 15 to 17 Year Olds | 29 (100.0%) | 0 (0.0%) |
| 18 to 19 Year Olds | 6 (100.0%) | 0 (0.0%) |
| 20 to 24 Year Olds | 22 (40.0%) | 33 (60.0%) |
| 25 to 34 Year Olds | 0 (0.0%) | 26 (100.0%) |
| 35 Years and over | 0 (0.0%) | 0 (0.0%) |
| Total | 156 (68.7%) | 71 (31.3%) |
Educational Attainment by Field of Study in Beloit
Business (35 | 28.5%), education (31 | 25.2%), psychology (14 | 11.4%), arts & humanities (11 | 8.9%), and bio, nature & agricultural (10 | 8.1%) are the most common fields of study among 123 individuals in Beloit who have obtained a bachelor's degree or higher.
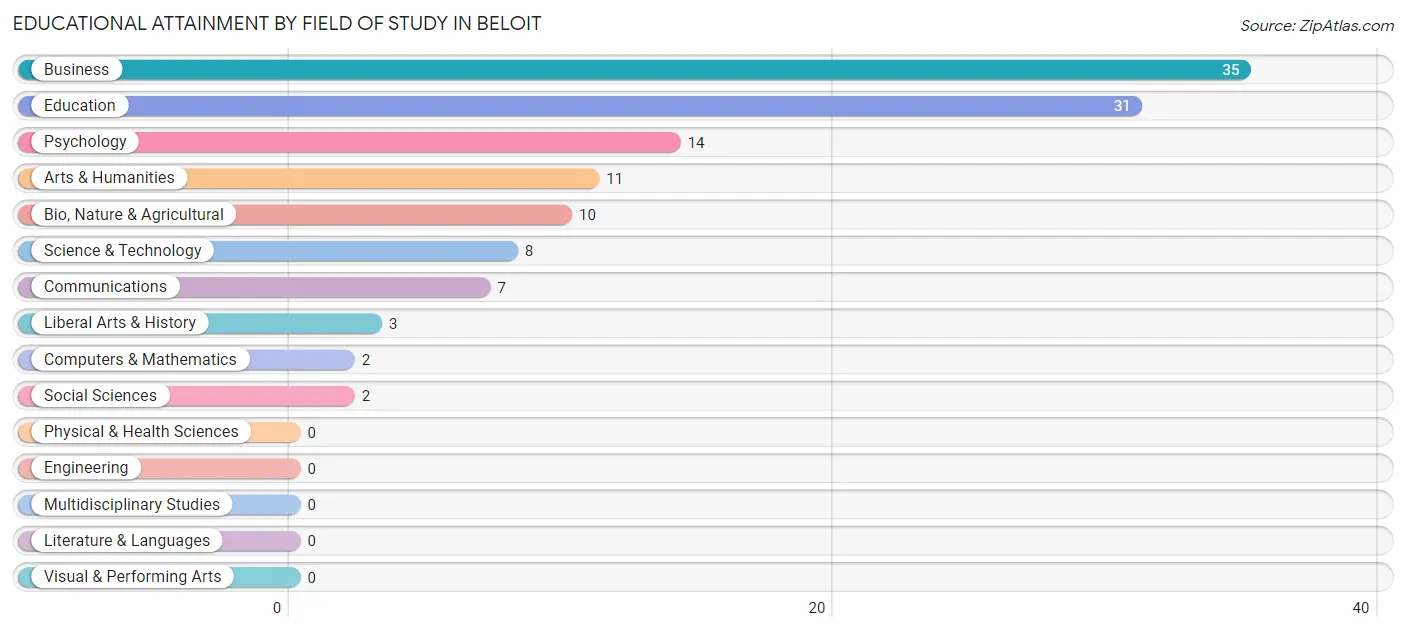
| Field of Study | # Graduates | % Graduates |
| Computers & Mathematics | 2 | 1.6% |
| Bio, Nature & Agricultural | 10 | 8.1% |
| Physical & Health Sciences | 0 | 0.0% |
| Psychology | 14 | 11.4% |
| Social Sciences | 2 | 1.6% |
| Engineering | 0 | 0.0% |
| Multidisciplinary Studies | 0 | 0.0% |
| Science & Technology | 8 | 6.5% |
| Business | 35 | 28.5% |
| Education | 31 | 25.2% |
| Literature & Languages | 0 | 0.0% |
| Liberal Arts & History | 3 | 2.4% |
| Visual & Performing Arts | 0 | 0.0% |
| Communications | 7 | 5.7% |
| Arts & Humanities | 11 | 8.9% |
| Total | 123 | 100.0% |
Transportation & Commute in Beloit
Vehicle Availability by Sex in Beloit
The most prevalent vehicle ownership categories in Beloit are males with 3 vehicles (174, accounting for 53.4%) and females with 3 vehicles (94, making up 63.5%).
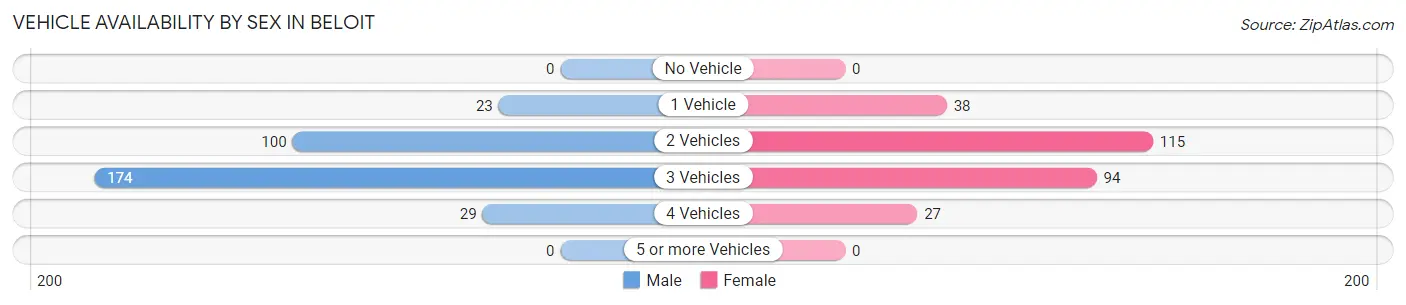
| Vehicles Available | Male | Female |
| No Vehicle | 0 (0.0%) | 0 (0.0%) |
| 1 Vehicle | 23 (7.1%) | 38 (13.9%) |
| 2 Vehicles | 100 (30.7%) | 115 (42.0%) |
| 3 Vehicles | 174 (53.4%) | 94 (34.3%) |
| 4 Vehicles | 29 (8.9%) | 27 (9.9%) |
| 5 or more Vehicles | 0 (0.0%) | 0 (0.0%) |
| Total | 326 (100.0%) | 274 (100.0%) |
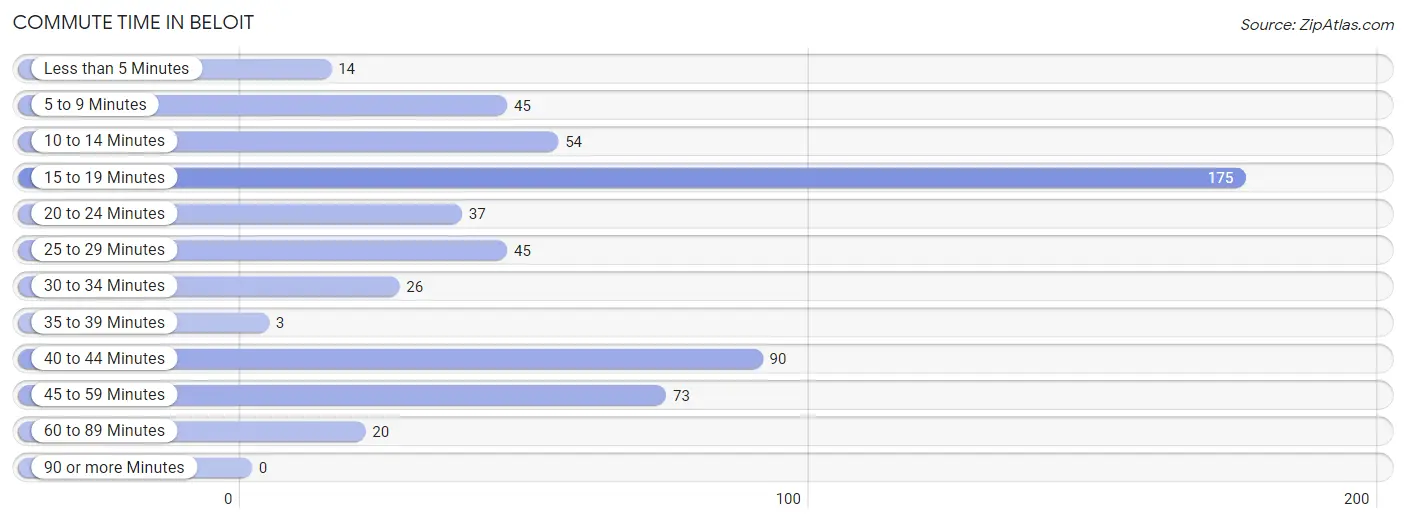
Commute Time in Beloit
The most frequently occuring commute durations in Beloit are 15 to 19 minutes (175 commuters, 30.1%), 40 to 44 minutes (90 commuters, 15.5%), and 45 to 59 minutes (73 commuters, 12.5%).
| Commute Time | # Commuters | % Commuters |
| Less than 5 Minutes | 14 | 2.4% |
| 5 to 9 Minutes | 45 | 7.7% |
| 10 to 14 Minutes | 54 | 9.3% |
| 15 to 19 Minutes | 175 | 30.1% |
| 20 to 24 Minutes | 37 | 6.4% |
| 25 to 29 Minutes | 45 | 7.7% |
| 30 to 34 Minutes | 26 | 4.5% |
| 35 to 39 Minutes | 3 | 0.5% |
| 40 to 44 Minutes | 90 | 15.5% |
| 45 to 59 Minutes | 73 | 12.5% |
| 60 to 89 Minutes | 20 | 3.4% |
| 90 or more Minutes | 0 | 0.0% |
Commute Time by Sex in Beloit
The most common commute times in Beloit are 15 to 19 minutes (152 commuters, 47.5%) for males and 40 to 44 minutes (62 commuters, 23.7%) for females.
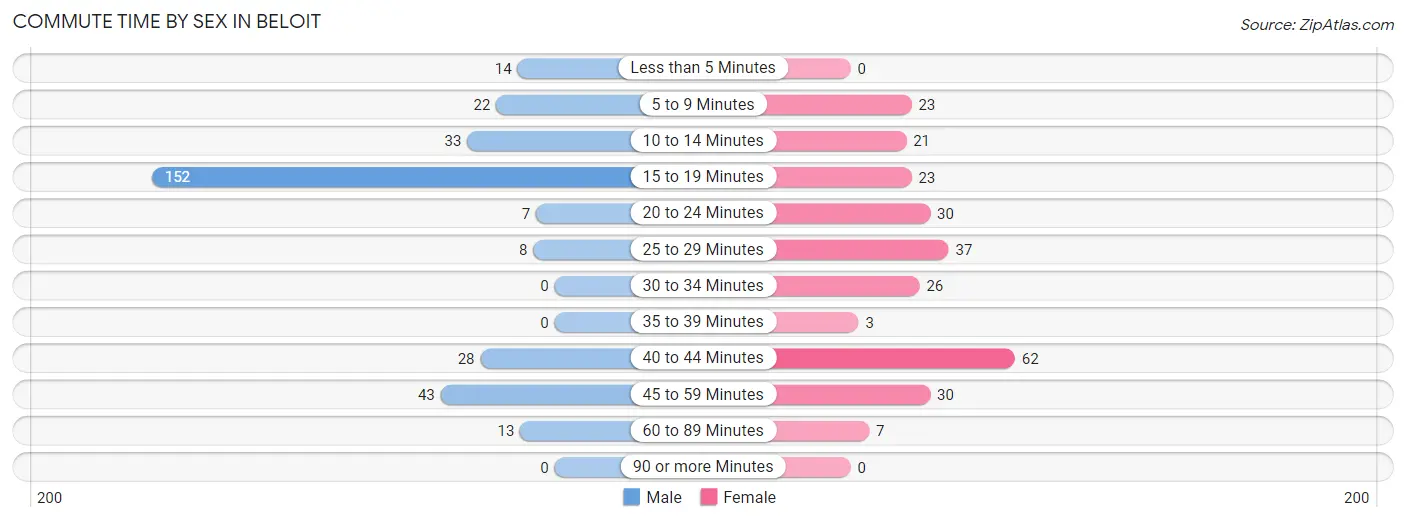
| Commute Time | Male | Female |
| Less than 5 Minutes | 14 (4.4%) | 0 (0.0%) |
| 5 to 9 Minutes | 22 (6.9%) | 23 (8.8%) |
| 10 to 14 Minutes | 33 (10.3%) | 21 (8.0%) |
| 15 to 19 Minutes | 152 (47.5%) | 23 (8.8%) |
| 20 to 24 Minutes | 7 (2.2%) | 30 (11.5%) |
| 25 to 29 Minutes | 8 (2.5%) | 37 (14.1%) |
| 30 to 34 Minutes | 0 (0.0%) | 26 (9.9%) |
| 35 to 39 Minutes | 0 (0.0%) | 3 (1.1%) |
| 40 to 44 Minutes | 28 (8.7%) | 62 (23.7%) |
| 45 to 59 Minutes | 43 (13.4%) | 30 (11.5%) |
| 60 to 89 Minutes | 13 (4.1%) | 7 (2.7%) |
| 90 or more Minutes | 0 (0.0%) | 0 (0.0%) |
Time of Departure to Work by Sex in Beloit
The most frequent times of departure to work in Beloit are 12:00 PM to 3:59 PM (87, 27.2%) for males and 8:00 AM to 8:29 AM (64, 24.4%) for females.
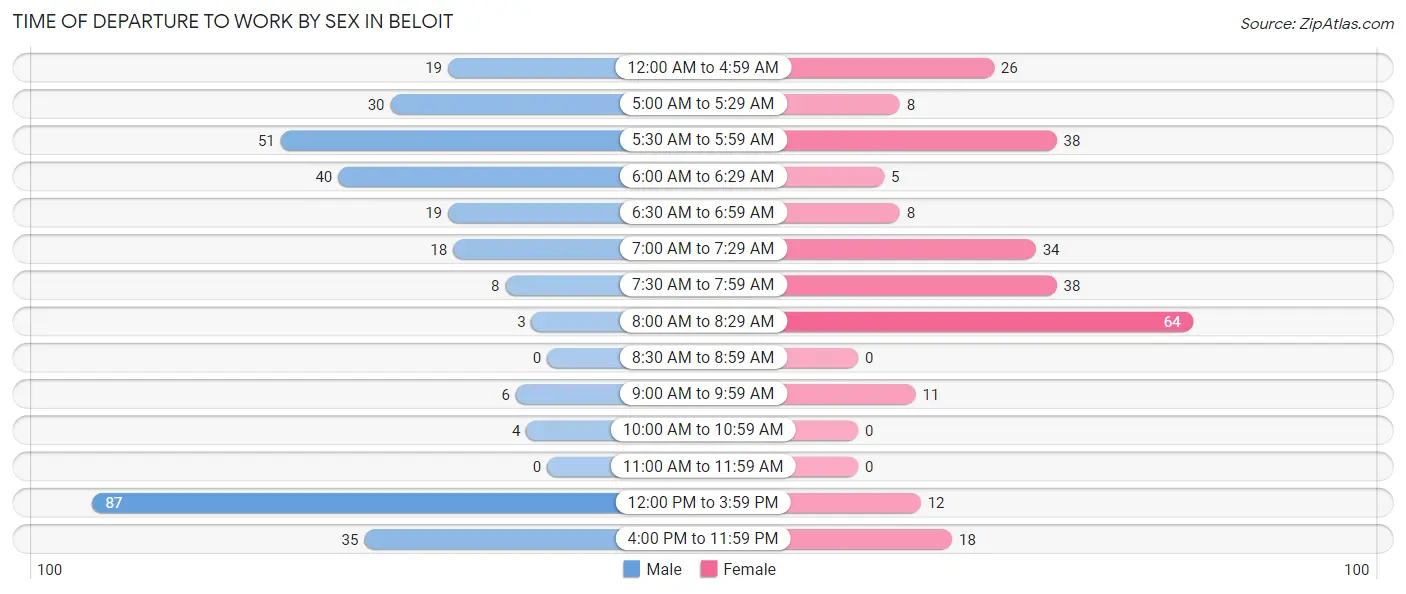
| Time of Departure | Male | Female |
| 12:00 AM to 4:59 AM | 19 (5.9%) | 26 (9.9%) |
| 5:00 AM to 5:29 AM | 30 (9.4%) | 8 (3.0%) |
| 5:30 AM to 5:59 AM | 51 (15.9%) | 38 (14.5%) |
| 6:00 AM to 6:29 AM | 40 (12.5%) | 5 (1.9%) |
| 6:30 AM to 6:59 AM | 19 (5.9%) | 8 (3.0%) |
| 7:00 AM to 7:29 AM | 18 (5.6%) | 34 (13.0%) |
| 7:30 AM to 7:59 AM | 8 (2.5%) | 38 (14.5%) |
| 8:00 AM to 8:29 AM | 3 (0.9%) | 64 (24.4%) |
| 8:30 AM to 8:59 AM | 0 (0.0%) | 0 (0.0%) |
| 9:00 AM to 9:59 AM | 6 (1.9%) | 11 (4.2%) |
| 10:00 AM to 10:59 AM | 4 (1.3%) | 0 (0.0%) |
| 11:00 AM to 11:59 AM | 0 (0.0%) | 0 (0.0%) |
| 12:00 PM to 3:59 PM | 87 (27.2%) | 12 (4.6%) |
| 4:00 PM to 11:59 PM | 35 (10.9%) | 18 (6.9%) |
| Total | 320 (100.0%) | 262 (100.0%) |
Housing Occupancy in Beloit
Occupancy by Ownership in Beloit
Of the total 520 dwellings in Beloit, owner-occupied units account for 400 (76.9%), while renter-occupied units make up 120 (23.1%).
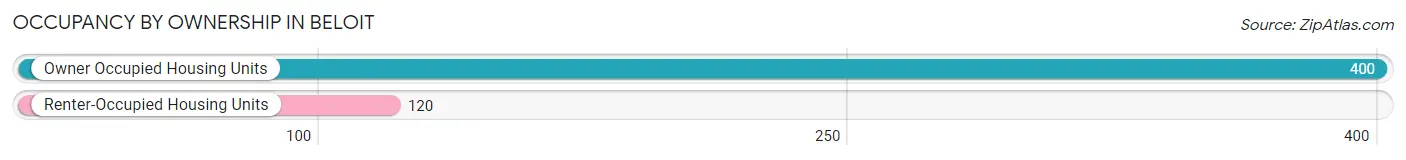
| Occupancy | # Housing Units | % Housing Units |
| Owner Occupied Housing Units | 400 | 76.9% |
| Renter-Occupied Housing Units | 120 | 23.1% |
| Total Occupied Housing Units | 520 | 100.0% |
Occupancy by Household Size in Beloit
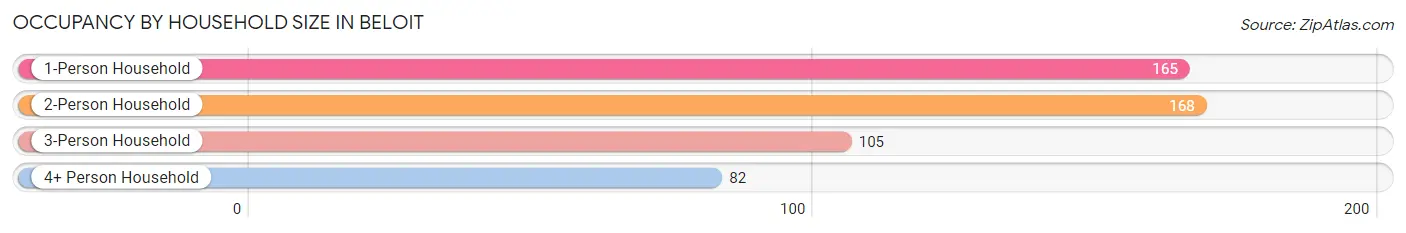
| Household Size | # Housing Units | % Housing Units |
| 1-Person Household | 165 | 31.7% |
| 2-Person Household | 168 | 32.3% |
| 3-Person Household | 105 | 20.2% |
| 4+ Person Household | 82 | 15.8% |
| Total Housing Units | 520 | 100.0% |
Occupancy by Ownership by Household Size in Beloit
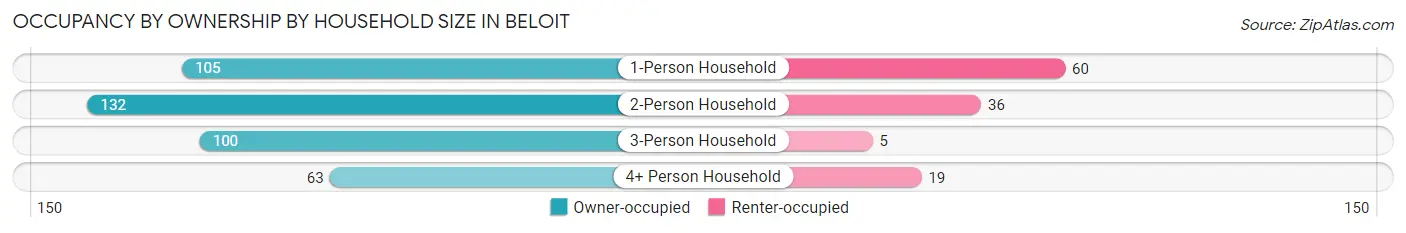
| Household Size | Owner-occupied | Renter-occupied |
| 1-Person Household | 105 (63.6%) | 60 (36.4%) |
| 2-Person Household | 132 (78.6%) | 36 (21.4%) |
| 3-Person Household | 100 (95.2%) | 5 (4.8%) |
| 4+ Person Household | 63 (76.8%) | 19 (23.2%) |
| Total Housing Units | 400 (76.9%) | 120 (23.1%) |
Occupancy by Educational Attainment in Beloit
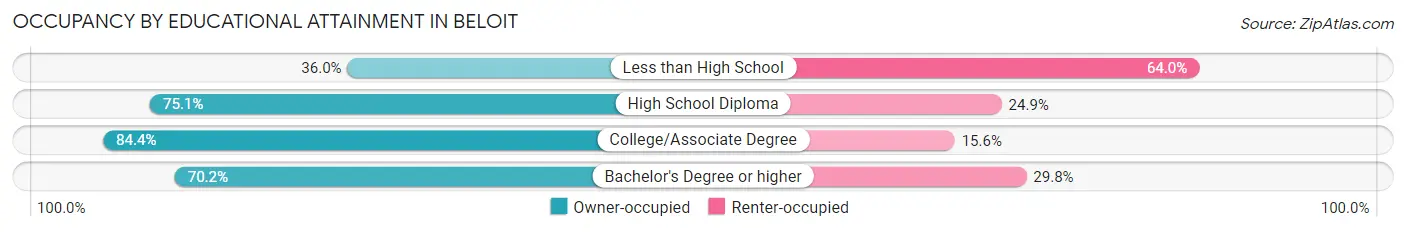
| Household Size | Owner-occupied | Renter-occupied |
| Less than High School | 9 (36.0%) | 16 (64.0%) |
| High School Diploma | 163 (75.1%) | 54 (24.9%) |
| College/Associate Degree | 195 (84.4%) | 36 (15.6%) |
| Bachelor's Degree or higher | 33 (70.2%) | 14 (29.8%) |
Occupancy by Age of Householder in Beloit
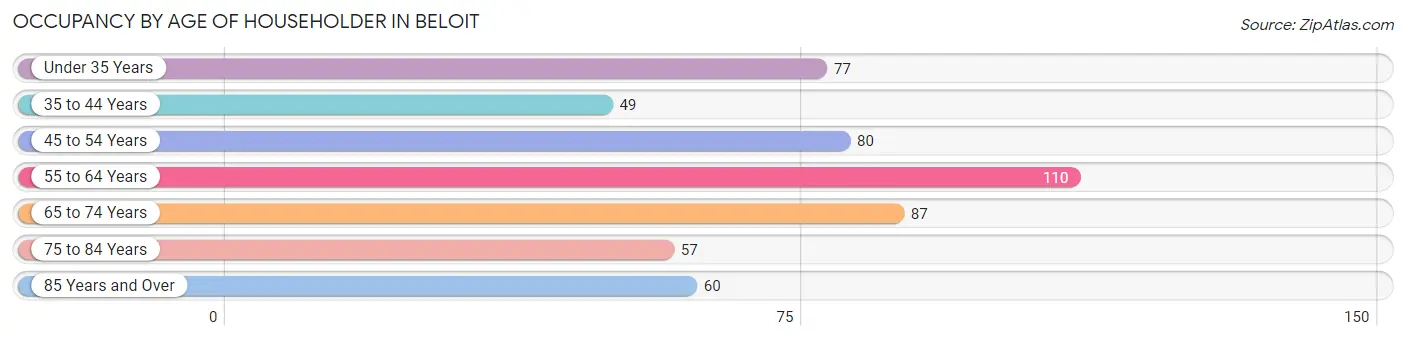
| Age Bracket | # Households | % Households |
| Under 35 Years | 77 | 14.8% |
| 35 to 44 Years | 49 | 9.4% |
| 45 to 54 Years | 80 | 15.4% |
| 55 to 64 Years | 110 | 21.1% |
| 65 to 74 Years | 87 | 16.7% |
| 75 to 84 Years | 57 | 11.0% |
| 85 Years and Over | 60 | 11.5% |
| Total | 520 | 100.0% |
Housing Finances in Beloit
Median Income by Occupancy in Beloit
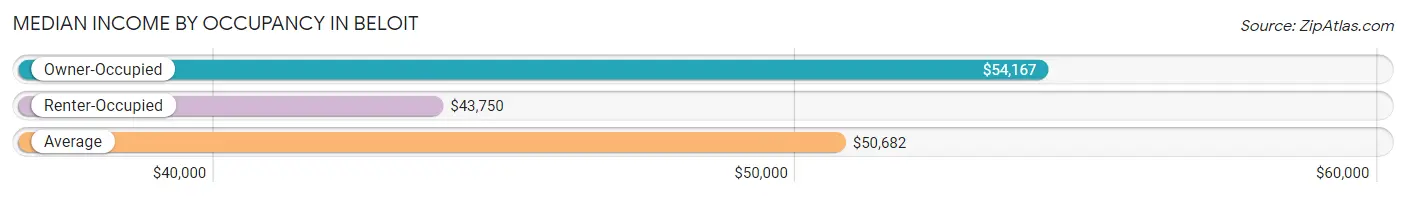
| Occupancy Type | # Households | Median Income |
| Owner-Occupied | 400 (76.9%) | $54,167 |
| Renter-Occupied | 120 (23.1%) | $43,750 |
| Average | 520 (100.0%) | $50,682 |
Occupancy by Householder Income Bracket in Beloit
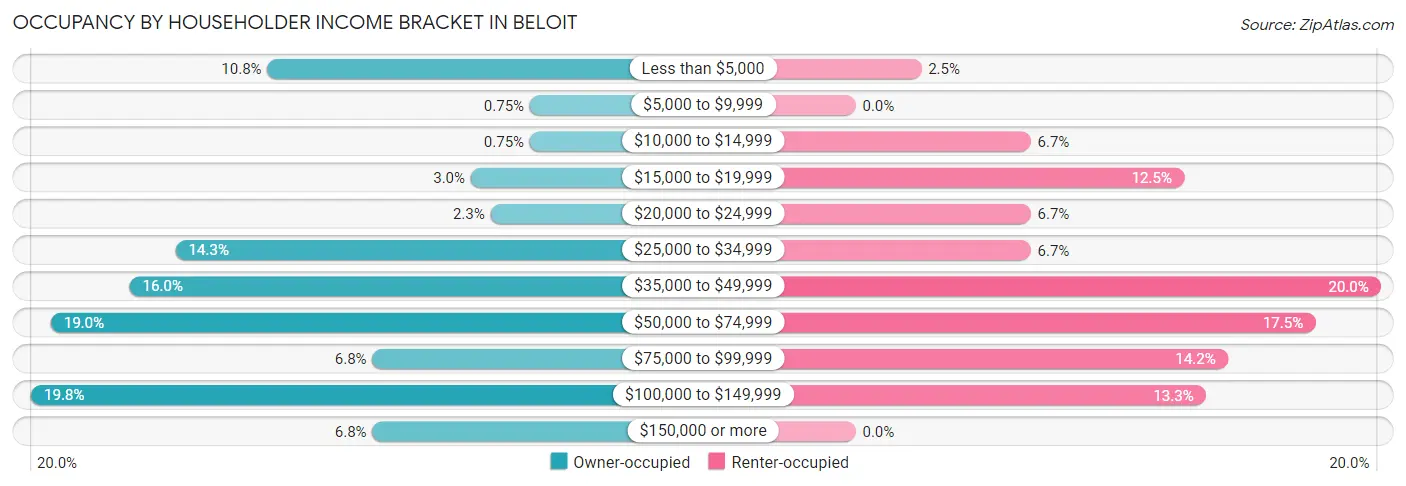
| Income Bracket | Owner-occupied | Renter-occupied |
| Less than $5,000 | 43 (10.7%) | 3 (2.5%) |
| $5,000 to $9,999 | 3 (0.7%) | 0 (0.0%) |
| $10,000 to $14,999 | 3 (0.7%) | 8 (6.7%) |
| $15,000 to $19,999 | 12 (3.0%) | 15 (12.5%) |
| $20,000 to $24,999 | 9 (2.2%) | 8 (6.7%) |
| $25,000 to $34,999 | 57 (14.2%) | 8 (6.7%) |
| $35,000 to $49,999 | 64 (16.0%) | 24 (20.0%) |
| $50,000 to $74,999 | 76 (19.0%) | 21 (17.5%) |
| $75,000 to $99,999 | 27 (6.8%) | 17 (14.2%) |
| $100,000 to $149,999 | 79 (19.8%) | 16 (13.3%) |
| $150,000 or more | 27 (6.8%) | 0 (0.0%) |
| Total | 400 (100.0%) | 120 (100.0%) |
Monthly Housing Cost Tiers in Beloit
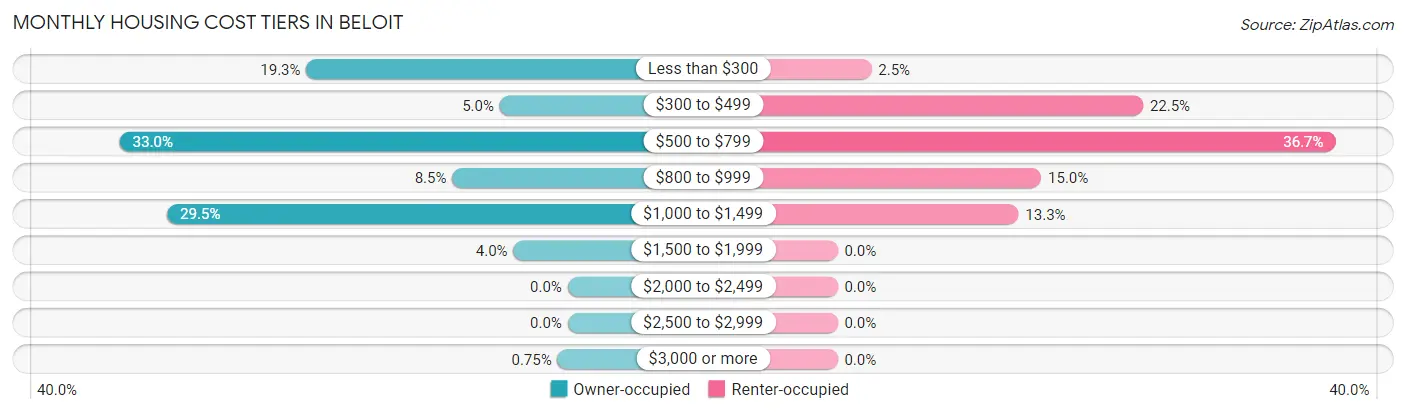
| Monthly Cost | Owner-occupied | Renter-occupied |
| Less than $300 | 77 (19.3%) | 3 (2.5%) |
| $300 to $499 | 20 (5.0%) | 27 (22.5%) |
| $500 to $799 | 132 (33.0%) | 44 (36.7%) |
| $800 to $999 | 34 (8.5%) | 18 (15.0%) |
| $1,000 to $1,499 | 118 (29.5%) | 16 (13.3%) |
| $1,500 to $1,999 | 16 (4.0%) | 0 (0.0%) |
| $2,000 to $2,499 | 0 (0.0%) | 0 (0.0%) |
| $2,500 to $2,999 | 0 (0.0%) | 0 (0.0%) |
| $3,000 or more | 3 (0.7%) | 0 (0.0%) |
| Total | 400 (100.0%) | 120 (100.0%) |
Physical Housing Characteristics in Beloit
Housing Structures in Beloit
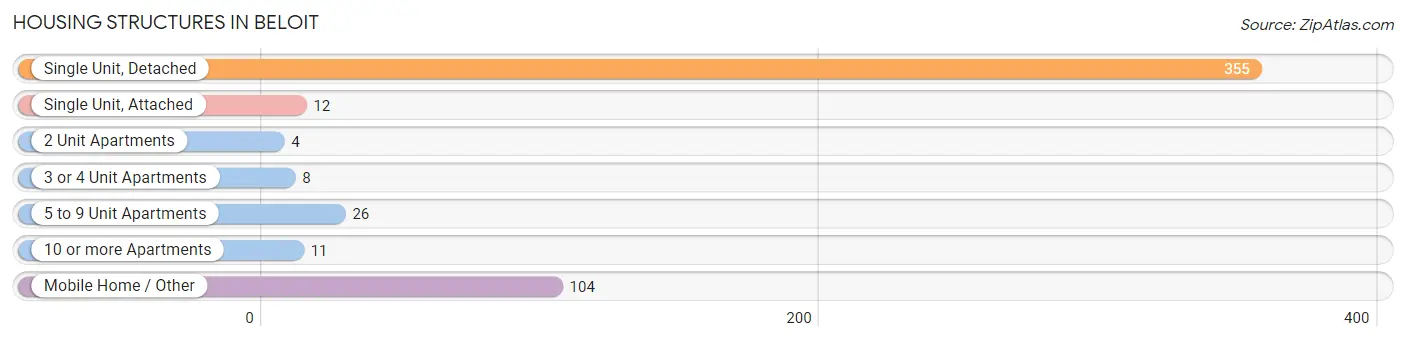
| Structure Type | # Housing Units | % Housing Units |
| Single Unit, Detached | 355 | 68.3% |
| Single Unit, Attached | 12 | 2.3% |
| 2 Unit Apartments | 4 | 0.8% |
| 3 or 4 Unit Apartments | 8 | 1.5% |
| 5 to 9 Unit Apartments | 26 | 5.0% |
| 10 or more Apartments | 11 | 2.1% |
| Mobile Home / Other | 104 | 20.0% |
| Total | 520 | 100.0% |
Housing Structures by Occupancy in Beloit
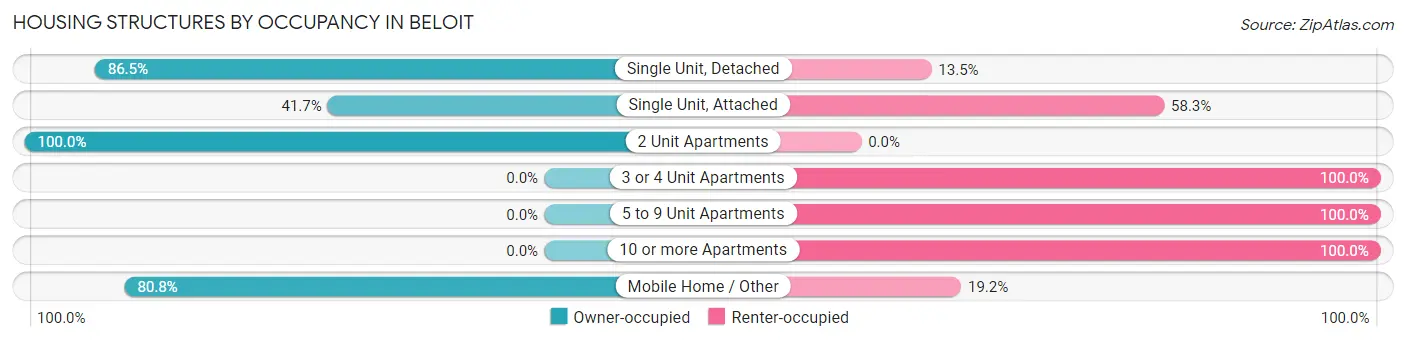
| Structure Type | Owner-occupied | Renter-occupied |
| Single Unit, Detached | 307 (86.5%) | 48 (13.5%) |
| Single Unit, Attached | 5 (41.7%) | 7 (58.3%) |
| 2 Unit Apartments | 4 (100.0%) | 0 (0.0%) |
| 3 or 4 Unit Apartments | 0 (0.0%) | 8 (100.0%) |
| 5 to 9 Unit Apartments | 0 (0.0%) | 26 (100.0%) |
| 10 or more Apartments | 0 (0.0%) | 11 (100.0%) |
| Mobile Home / Other | 84 (80.8%) | 20 (19.2%) |
| Total | 400 (76.9%) | 120 (23.1%) |
Housing Structures by Number of Rooms in Beloit
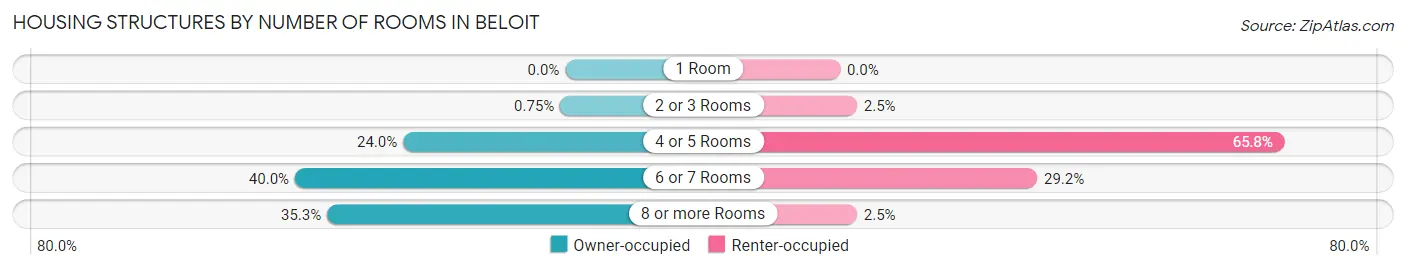
| Number of Rooms | Owner-occupied | Renter-occupied |
| 1 Room | 0 (0.0%) | 0 (0.0%) |
| 2 or 3 Rooms | 3 (0.7%) | 3 (2.5%) |
| 4 or 5 Rooms | 96 (24.0%) | 79 (65.8%) |
| 6 or 7 Rooms | 160 (40.0%) | 35 (29.2%) |
| 8 or more Rooms | 141 (35.2%) | 3 (2.5%) |
| Total | 400 (100.0%) | 120 (100.0%) |
Housing Structure by Heating Type in Beloit
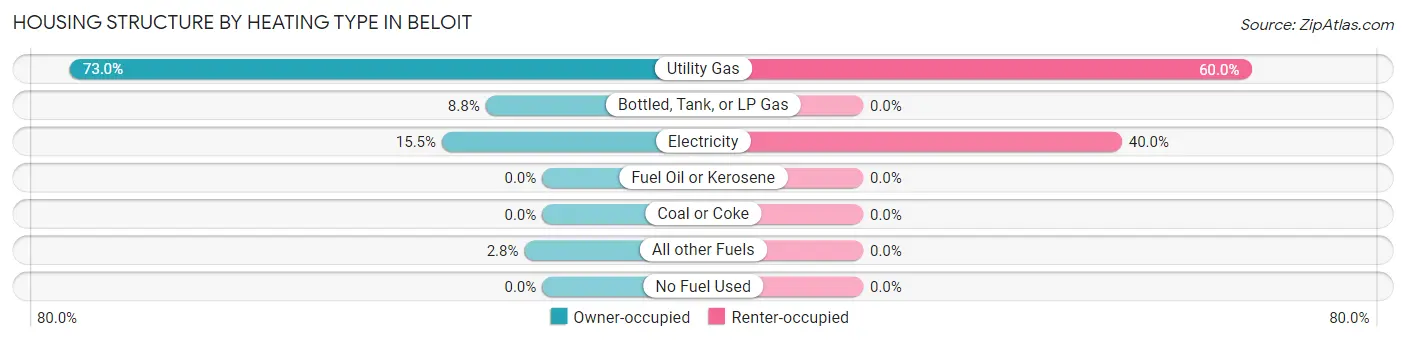
| Heating Type | Owner-occupied | Renter-occupied |
| Utility Gas | 292 (73.0%) | 72 (60.0%) |
| Bottled, Tank, or LP Gas | 35 (8.7%) | 0 (0.0%) |
| Electricity | 62 (15.5%) | 48 (40.0%) |
| Fuel Oil or Kerosene | 0 (0.0%) | 0 (0.0%) |
| Coal or Coke | 0 (0.0%) | 0 (0.0%) |
| All other Fuels | 11 (2.8%) | 0 (0.0%) |
| No Fuel Used | 0 (0.0%) | 0 (0.0%) |
| Total | 400 (100.0%) | 120 (100.0%) |
Household Vehicle Usage in Beloit
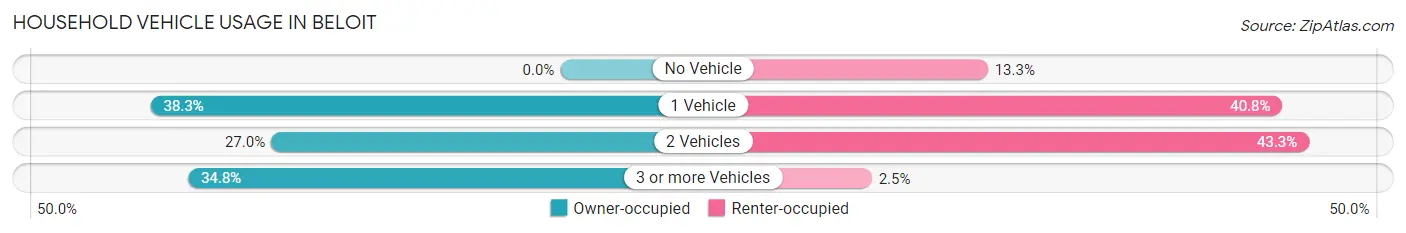
| Vehicles per Household | Owner-occupied | Renter-occupied |
| No Vehicle | 0 (0.0%) | 16 (13.3%) |
| 1 Vehicle | 153 (38.3%) | 49 (40.8%) |
| 2 Vehicles | 108 (27.0%) | 52 (43.3%) |
| 3 or more Vehicles | 139 (34.7%) | 3 (2.5%) |
| Total | 400 (100.0%) | 120 (100.0%) |
Real Estate & Mortgages in Beloit
Real Estate and Mortgage Overview in Beloit
| Characteristic | Without Mortgage | With Mortgage |
| Housing Units | 208 | 192 |
| Median Property Value | - | - |
| Median Household Income | $38,214 | $15 |
| Monthly Housing Costs | $512 | $3 |
| Real Estate Taxes | $1,166 | $0 |
Property Value by Mortgage Status in Beloit
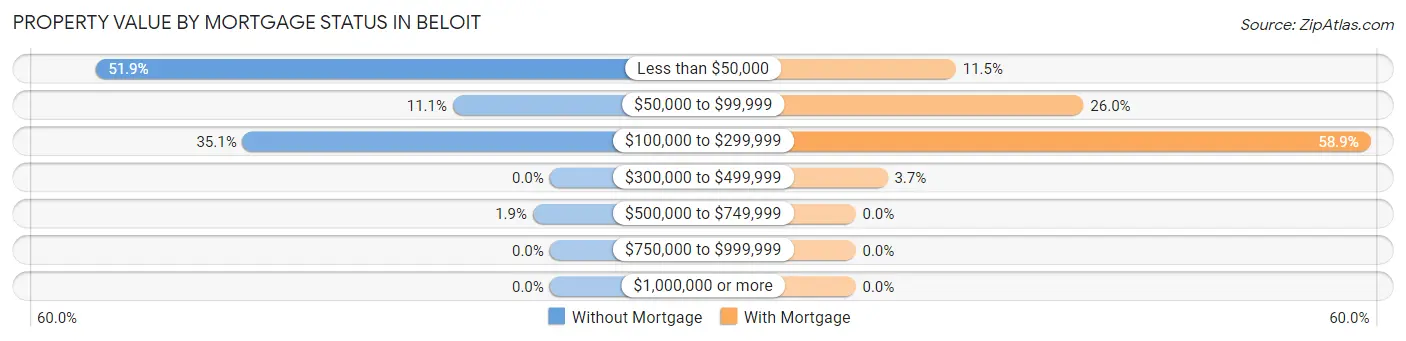
| Property Value | Without Mortgage | With Mortgage |
| Less than $50,000 | 108 (51.9%) | 22 (11.5%) |
| $50,000 to $99,999 | 23 (11.1%) | 50 (26.0%) |
| $100,000 to $299,999 | 73 (35.1%) | 113 (58.9%) |
| $300,000 to $499,999 | 0 (0.0%) | 7 (3.6%) |
| $500,000 to $749,999 | 4 (1.9%) | 0 (0.0%) |
| $750,000 to $999,999 | 0 (0.0%) | 0 (0.0%) |
| $1,000,000 or more | 0 (0.0%) | 0 (0.0%) |
| Total | 208 (100.0%) | 192 (100.0%) |
Household Income by Mortgage Status in Beloit
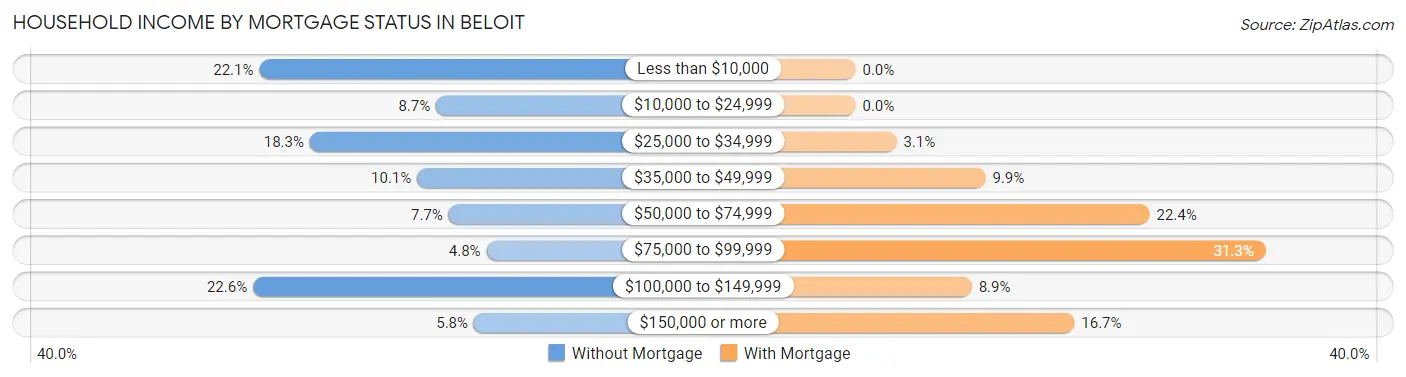
| Household Income | Without Mortgage | With Mortgage |
| Less than $10,000 | 46 (22.1%) | 0 (0.0%) |
| $10,000 to $24,999 | 18 (8.6%) | 0 (0.0%) |
| $25,000 to $34,999 | 38 (18.3%) | 6 (3.1%) |
| $35,000 to $49,999 | 21 (10.1%) | 19 (9.9%) |
| $50,000 to $74,999 | 16 (7.7%) | 43 (22.4%) |
| $75,000 to $99,999 | 10 (4.8%) | 60 (31.2%) |
| $100,000 to $149,999 | 47 (22.6%) | 17 (8.8%) |
| $150,000 or more | 12 (5.8%) | 32 (16.7%) |
| Total | 208 (100.0%) | 192 (100.0%) |
Property Value to Household Income Ratio in Beloit
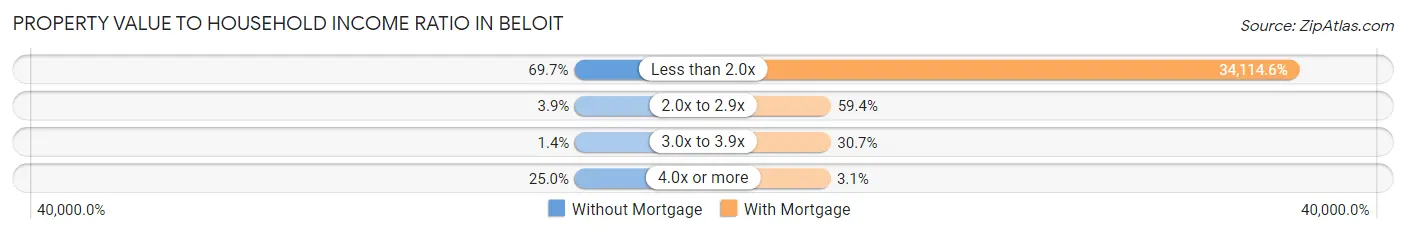
| Value-to-Income Ratio | Without Mortgage | With Mortgage |
| Less than 2.0x | 145 (69.7%) | 65,500 (34,114.6%) |
| 2.0x to 2.9x | 8 (3.8%) | 114 (59.4%) |
| 3.0x to 3.9x | 3 (1.4%) | 59 (30.7%) |
| 4.0x or more | 52 (25.0%) | 6 (3.1%) |
| Total | 208 (100.0%) | 192 (100.0%) |
Real Estate Taxes by Mortgage Status in Beloit
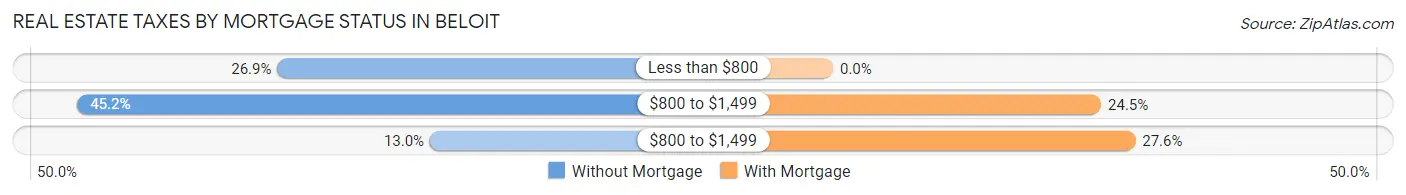
| Property Taxes | Without Mortgage | With Mortgage |
| Less than $800 | 56 (26.9%) | 0 (0.0%) |
| $800 to $1,499 | 94 (45.2%) | 47 (24.5%) |
| $800 to $1,499 | 27 (13.0%) | 53 (27.6%) |
| Total | 208 (100.0%) | 192 (100.0%) |
Health & Disability in Beloit
Health Insurance Coverage by Age in Beloit
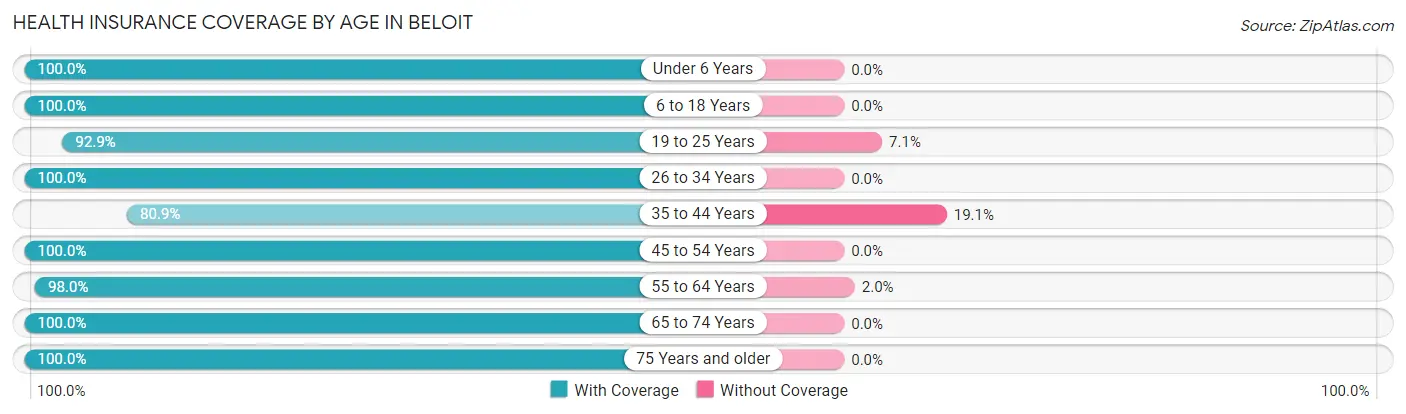
| Age Bracket | With Coverage | Without Coverage |
| Under 6 Years | 59 (100.0%) | 0 (0.0%) |
| 6 to 18 Years | 120 (100.0%) | 0 (0.0%) |
| 19 to 25 Years | 79 (92.9%) | 6 (7.1%) |
| 26 to 34 Years | 123 (100.0%) | 0 (0.0%) |
| 35 to 44 Years | 127 (80.9%) | 30 (19.1%) |
| 45 to 54 Years | 153 (100.0%) | 0 (0.0%) |
| 55 to 64 Years | 150 (98.0%) | 3 (2.0%) |
| 65 to 74 Years | 138 (100.0%) | 0 (0.0%) |
| 75 Years and older | 152 (100.0%) | 0 (0.0%) |
| Total | 1,101 (96.6%) | 39 (3.4%) |
Health Insurance Coverage by Citizenship Status in Beloit
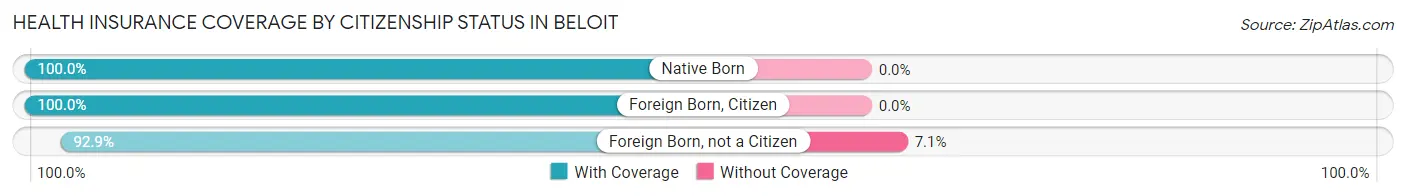
| Citizenship Status | With Coverage | Without Coverage |
| Native Born | 59 (100.0%) | 0 (0.0%) |
| Foreign Born, Citizen | 120 (100.0%) | 0 (0.0%) |
| Foreign Born, not a Citizen | 79 (92.9%) | 6 (7.1%) |
Health Insurance Coverage by Household Income in Beloit
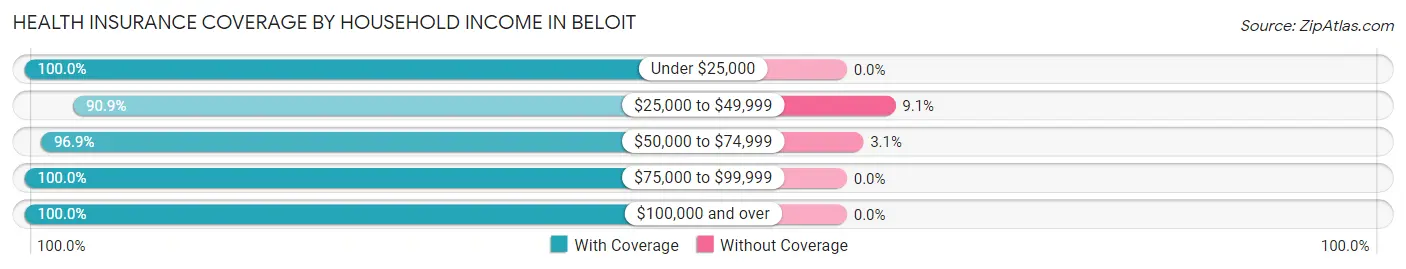
| Household Income | With Coverage | Without Coverage |
| Under $25,000 | 109 (100.0%) | 0 (0.0%) |
| $25,000 to $49,999 | 320 (90.9%) | 32 (9.1%) |
| $50,000 to $74,999 | 220 (96.9%) | 7 (3.1%) |
| $75,000 to $99,999 | 101 (100.0%) | 0 (0.0%) |
| $100,000 and over | 351 (100.0%) | 0 (0.0%) |
Public vs Private Health Insurance Coverage by Age in Beloit
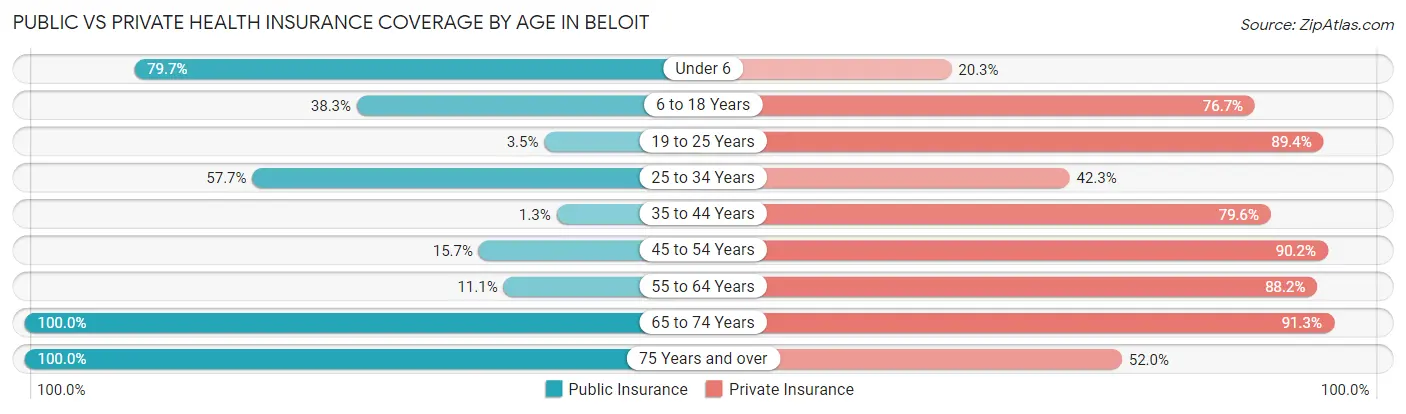
| Age Bracket | Public Insurance | Private Insurance |
| Under 6 | 47 (79.7%) | 12 (20.3%) |
| 6 to 18 Years | 46 (38.3%) | 92 (76.7%) |
| 19 to 25 Years | 3 (3.5%) | 76 (89.4%) |
| 25 to 34 Years | 71 (57.7%) | 52 (42.3%) |
| 35 to 44 Years | 2 (1.3%) | 125 (79.6%) |
| 45 to 54 Years | 24 (15.7%) | 138 (90.2%) |
| 55 to 64 Years | 17 (11.1%) | 135 (88.2%) |
| 65 to 74 Years | 138 (100.0%) | 126 (91.3%) |
| 75 Years and over | 152 (100.0%) | 79 (52.0%) |
| Total | 500 (43.9%) | 835 (73.3%) |
Disability Status by Sex by Age in Beloit
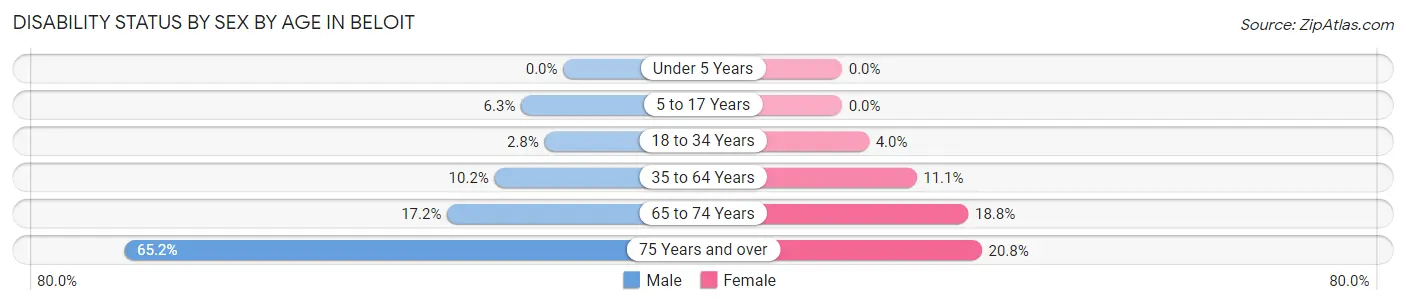
| Age Bracket | Male | Female |
| Under 5 Years | 0 (0.0%) | 0 (0.0%) |
| 5 to 17 Years | 4 (6.2%) | 0 (0.0%) |
| 18 to 34 Years | 3 (2.8%) | 4 (4.0%) |
| 35 to 64 Years | 26 (10.2%) | 23 (11.1%) |
| 65 to 74 Years | 10 (17.2%) | 15 (18.8%) |
| 75 Years and over | 30 (65.2%) | 22 (20.7%) |
Disability Class by Sex by Age in Beloit
Disability Class: Hearing Difficulty
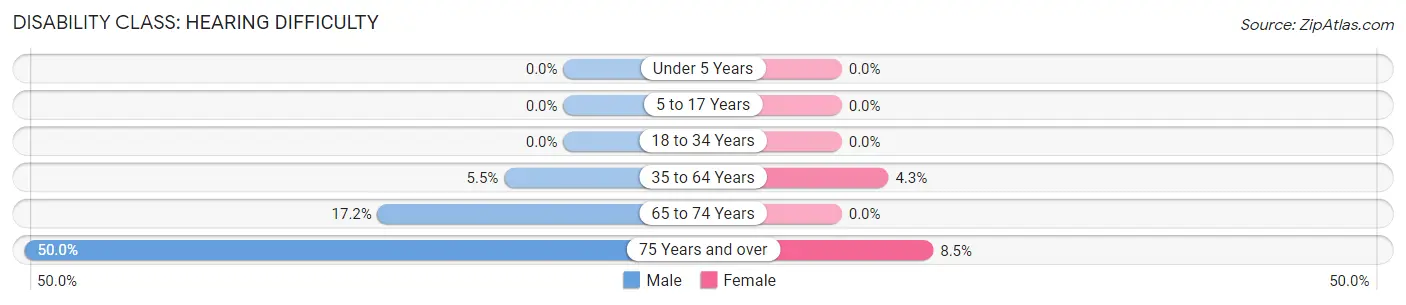
| Age Bracket | Male | Female |
| Under 5 Years | 0 (0.0%) | 0 (0.0%) |
| 5 to 17 Years | 0 (0.0%) | 0 (0.0%) |
| 18 to 34 Years | 0 (0.0%) | 0 (0.0%) |
| 35 to 64 Years | 14 (5.5%) | 9 (4.3%) |
| 65 to 74 Years | 10 (17.2%) | 0 (0.0%) |
| 75 Years and over | 23 (50.0%) | 9 (8.5%) |
Disability Class: Vision Difficulty
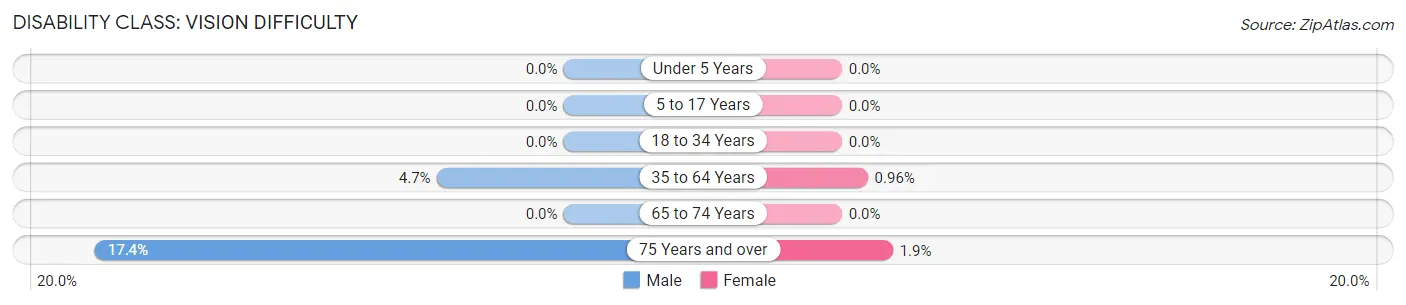
| Age Bracket | Male | Female |
| Under 5 Years | 0 (0.0%) | 0 (0.0%) |
| 5 to 17 Years | 0 (0.0%) | 0 (0.0%) |
| 18 to 34 Years | 0 (0.0%) | 0 (0.0%) |
| 35 to 64 Years | 12 (4.7%) | 2 (1.0%) |
| 65 to 74 Years | 0 (0.0%) | 0 (0.0%) |
| 75 Years and over | 8 (17.4%) | 2 (1.9%) |
Disability Class: Cognitive Difficulty
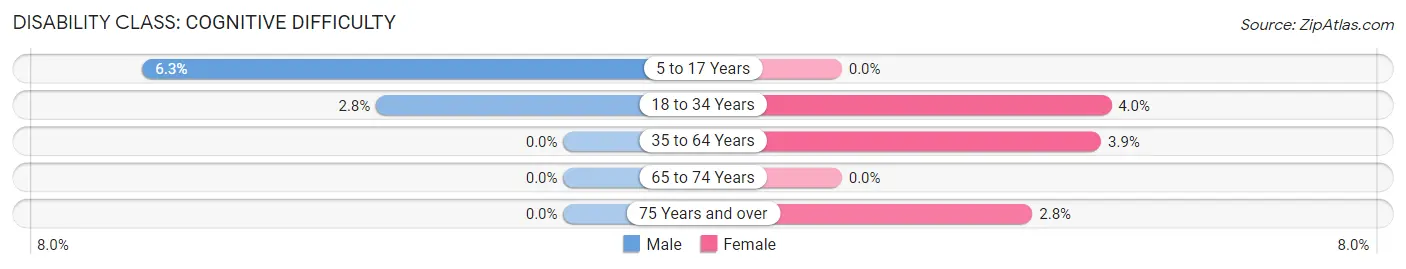
| Age Bracket | Male | Female |
| 5 to 17 Years | 4 (6.2%) | 0 (0.0%) |
| 18 to 34 Years | 3 (2.8%) | 4 (4.0%) |
| 35 to 64 Years | 0 (0.0%) | 8 (3.8%) |
| 65 to 74 Years | 0 (0.0%) | 0 (0.0%) |
| 75 Years and over | 0 (0.0%) | 3 (2.8%) |
Disability Class: Ambulatory Difficulty
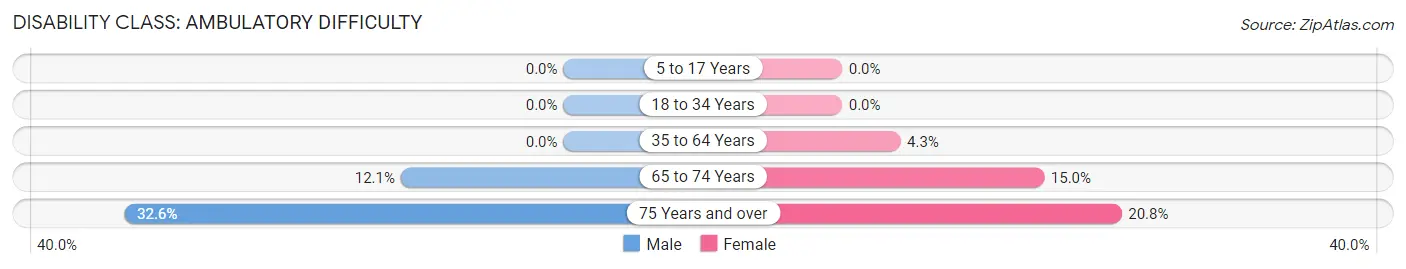
| Age Bracket | Male | Female |
| 5 to 17 Years | 0 (0.0%) | 0 (0.0%) |
| 18 to 34 Years | 0 (0.0%) | 0 (0.0%) |
| 35 to 64 Years | 0 (0.0%) | 9 (4.3%) |
| 65 to 74 Years | 7 (12.1%) | 12 (15.0%) |
| 75 Years and over | 15 (32.6%) | 22 (20.7%) |
Disability Class: Self-Care Difficulty
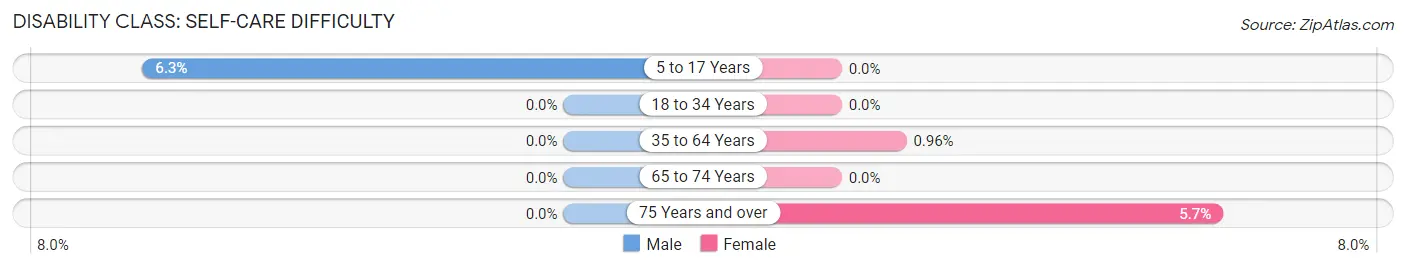
| Age Bracket | Male | Female |
| 5 to 17 Years | 4 (6.2%) | 0 (0.0%) |
| 18 to 34 Years | 0 (0.0%) | 0 (0.0%) |
| 35 to 64 Years | 0 (0.0%) | 2 (1.0%) |
| 65 to 74 Years | 0 (0.0%) | 0 (0.0%) |
| 75 Years and over | 0 (0.0%) | 6 (5.7%) |
Technology Access in Beloit
Computing Device Access in Beloit
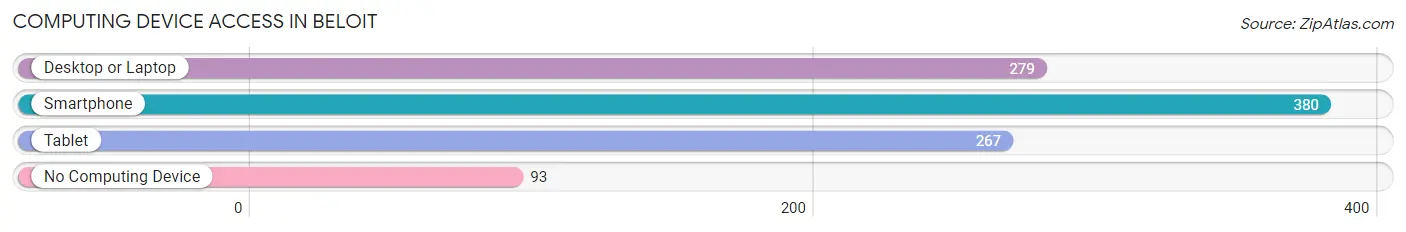
| Device Type | # Households | % Households |
| Desktop or Laptop | 279 | 53.6% |
| Smartphone | 380 | 73.1% |
| Tablet | 267 | 51.3% |
| No Computing Device | 93 | 17.9% |
| Total | 520 | 100.0% |
Internet Access in Beloit
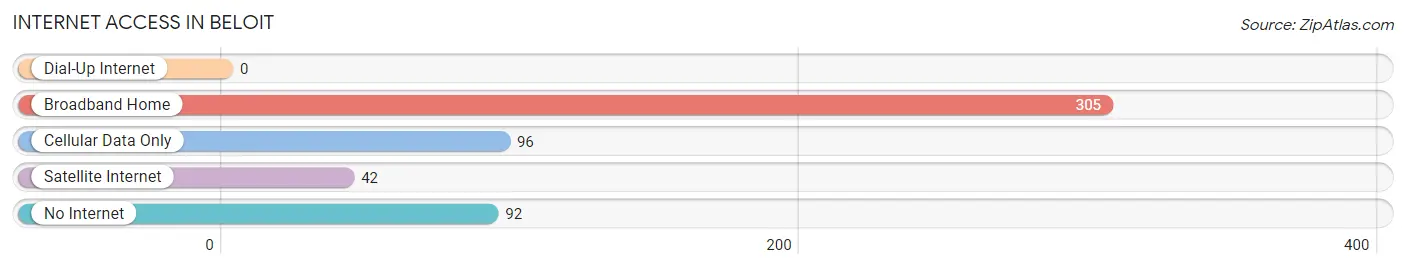
| Internet Type | # Households | % Households |
| Dial-Up Internet | 0 | 0.0% |
| Broadband Home | 305 | 58.7% |
| Cellular Data Only | 96 | 18.5% |
| Satellite Internet | 42 | 8.1% |
| No Internet | 92 | 17.7% |
| Total | 520 | 100.0% |
Beloit Summary
Beloit, Ohio is a small village located in Mahoning County, Ohio. It is situated on the Mahoning River, approximately 25 miles southeast of Youngstown. The village has a population of 1,845 people, according to the 2010 census.
History
Beloit was founded in 1806 by a group of settlers from Connecticut. The village was originally known as “New Connecticut” and was later renamed Beloit in 1817. The name was chosen in honor of Beloit College, which was founded in Wisconsin in 1846.
The village was incorporated in 1867 and was home to a variety of industries, including a sawmill, a grist mill, a woolen mill, and a tannery. The village also had a railroad station, which was used to transport goods and passengers.
Geography
Beloit is located in Mahoning County, Ohio. It is situated on the Mahoning River, approximately 25 miles southeast of Youngstown. The village has a total area of 1.2 square miles, all of which is land.
The village is located in the Appalachian Plateau region of Ohio. The terrain is mostly flat, with some rolling hills. The climate is humid continental, with hot summers and cold winters.
Economy
Beloit’s economy is largely based on agriculture and manufacturing. The village is home to several small businesses, including a grocery store, a hardware store, and a restaurant.
The village also has a few larger employers, including a plastics manufacturer and a metal fabrication company. The village is also home to a number of small farms, which produce a variety of crops, including corn, soybeans, and hay.
Demographics
According to the 2010 census, Beloit has a population of 1,845 people. The racial makeup of the village is 97.3% White, 0.7% African American, 0.2% Native American, 0.2% Asian, and 1.6% from other races.
The median household income in Beloit is $37,917, and the median family income is $45,938. The per capita income is $19,945. Approximately 11.3% of the population is below the poverty line.
Beloit is a small village with a rich history and a diverse economy. The village is home to a variety of businesses and industries, and the population is largely white. The village has a median household income that is slightly below the national average, and a poverty rate that is slightly above the national average.
Common Questions
What is Per Capita Income in Beloit?
Per Capita income in Beloit is $31,055.
What is the Median Family Income in Beloit?
Median Family Income in Beloit is $54,000.
What is the Median Household income in Beloit?
Median Household Income in Beloit is $50,682.
What is Income or Wage Gap in Beloit?
Income or Wage Gap in Beloit is 52.5%.
Women in Beloit earn 47.5 cents for every dollar earned by a man.
What is Inequality or Gini Index in Beloit?
Inequality or Gini Index in Beloit is 0.44.
What is the Total Population of Beloit?
Total Population of Beloit is 1,140.
What is the Total Male Population of Beloit?
Total Male Population of Beloit is 555.
What is the Total Female Population of Beloit?
Total Female Population of Beloit is 585.
What is the Ratio of Males per 100 Females in Beloit?
There are 94.87 Males per 100 Females in Beloit.
What is the Ratio of Females per 100 Males in Beloit?
There are 105.41 Females per 100 Males in Beloit.
What is the Median Population Age in Beloit?
Median Population Age in Beloit is 49.0 Years.
What is the Average Family Size in Beloit
Average Family Size in Beloit is 2.7 People.
What is the Average Household Size in Beloit
Average Household Size in Beloit is 2.2 People.
How Large is the Labor Force in Beloit?
There are 643 People in the Labor Forcein in Beloit.
What is the Percentage of People in the Labor Force in Beloit?
66.1% of People are in the Labor Force in Beloit.
What is the Unemployment Rate in Beloit?
Unemployment Rate in Beloit is 4.0%.