Cities with the Most Immigrants from Greece in Ohio
RELATED REPORTS & OPTIONS
Greece
Ohio
Compare Cities
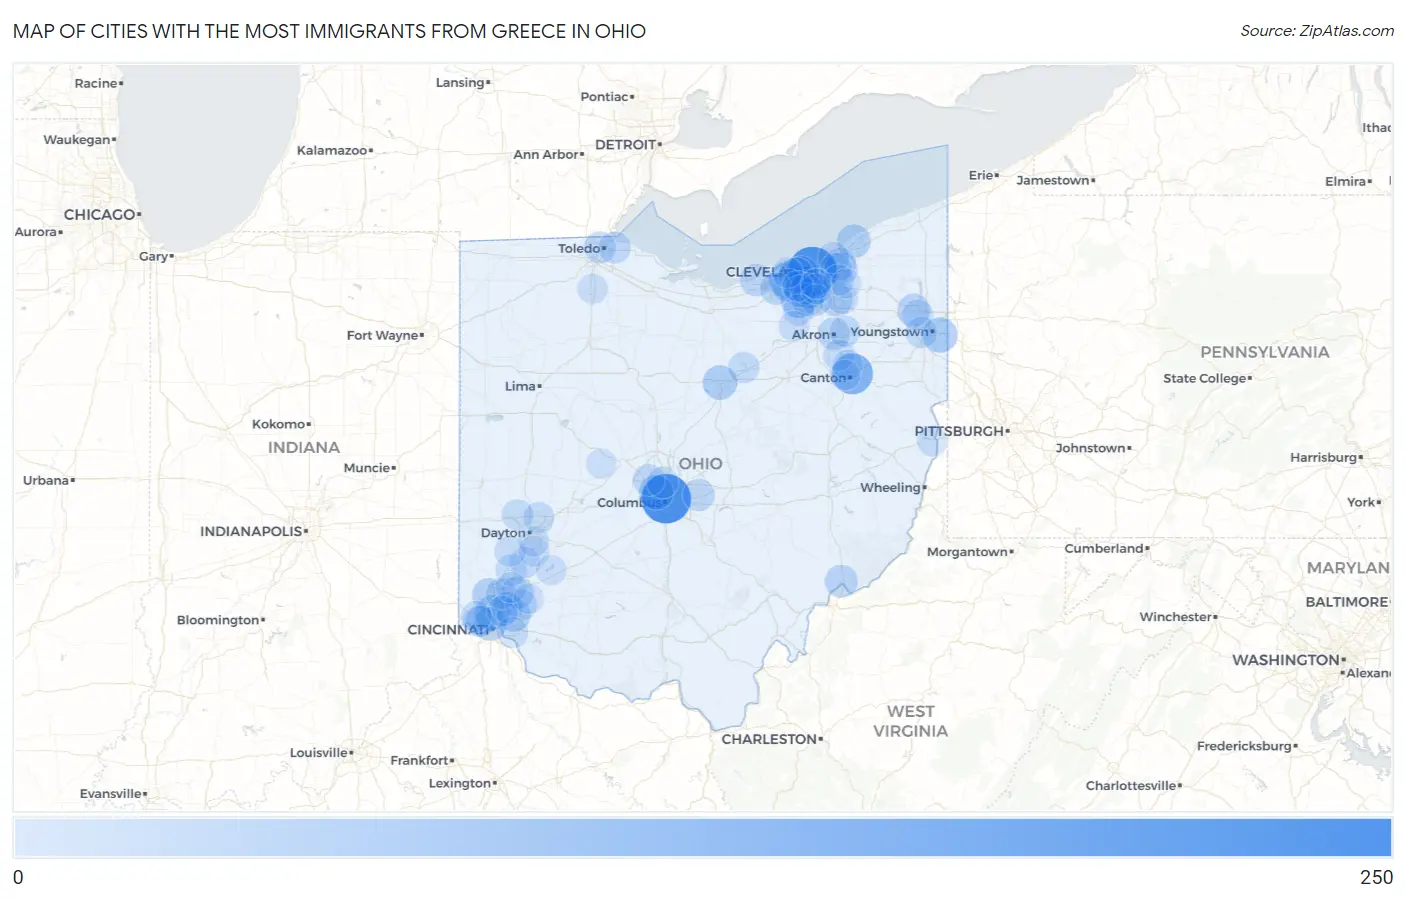
Map of Cities with the Most Immigrants from Greece in Ohio
0
250
Cities with the Most Immigrants from Greece in Ohio
| City | Greece | vs State | vs National | |
| 1. | Columbus | 245 | 2,690(9.11%)#1 | 118,932(0.21%)#38 |
| 2. | Cleveland | 238 | 2,690(8.85%)#2 | 118,932(0.20%)#44 |
| 3. | Canton | 134 | 2,690(4.98%)#3 | 118,932(0.11%)#116 |
| 4. | Parma | 103 | 2,690(3.83%)#4 | 118,932(0.09%)#171 |
| 5. | Westlake | 80 | 2,690(2.97%)#5 | 118,932(0.07%)#240 |
| 6. | Strongsville | 70 | 2,690(2.60%)#6 | 118,932(0.06%)#284 |
| 7. | Lakewood | 64 | 2,690(2.38%)#7 | 118,932(0.05%)#318 |
| 8. | Campbell | 61 | 2,690(2.27%)#8 | 118,932(0.05%)#337 |
| 9. | Rocky River | 60 | 2,690(2.23%)#9 | 118,932(0.05%)#345 |
| 10. | Upper Arlington | 56 | 2,690(2.08%)#10 | 118,932(0.05%)#367 |
| 11. | Finneytown | 54 | 2,690(2.01%)#11 | 118,932(0.05%)#388 |
| 12. | Mansfield | 52 | 2,690(1.93%)#12 | 118,932(0.04%)#404 |
| 13. | Mentor | 46 | 2,690(1.71%)#13 | 118,932(0.04%)#455 |
| 14. | Fairfield | 42 | 2,690(1.56%)#14 | 118,932(0.04%)#502 |
| 15. | Cincinnati | 40 | 2,690(1.49%)#15 | 118,932(0.03%)#520 |
| 16. | The Village Of Indian Hill | 40 | 2,690(1.49%)#16 | 118,932(0.03%)#532 |
| 17. | Warren | 33 | 2,690(1.23%)#17 | 118,932(0.03%)#633 |
| 18. | Mayfield Heights | 33 | 2,690(1.23%)#18 | 118,932(0.03%)#638 |
| 19. | Macedonia | 33 | 2,690(1.23%)#19 | 118,932(0.03%)#640 |
| 20. | North Olmsted | 32 | 2,690(1.19%)#20 | 118,932(0.03%)#652 |
| 21. | North Royalton | 31 | 2,690(1.15%)#21 | 118,932(0.03%)#665 |
| 22. | Marietta | 31 | 2,690(1.15%)#22 | 118,932(0.03%)#671 |
| 23. | Lorain | 30 | 2,690(1.12%)#23 | 118,932(0.03%)#680 |
| 24. | Mason | 27 | 2,690(1.00%)#24 | 118,932(0.02%)#741 |
| 25. | Akron | 26 | 2,690(0.97%)#25 | 118,932(0.02%)#755 |
| 26. | North Ridgeville | 26 | 2,690(0.97%)#26 | 118,932(0.02%)#761 |
| 27. | Pataskala | 26 | 2,690(0.97%)#27 | 118,932(0.02%)#763 |
| 28. | Middleburg Heights | 23 | 2,690(0.86%)#28 | 118,932(0.02%)#836 |
| 29. | Dublin | 22 | 2,690(0.82%)#29 | 118,932(0.02%)#851 |
| 30. | Oregon | 22 | 2,690(0.82%)#30 | 118,932(0.02%)#860 |
| 31. | Toledo | 21 | 2,690(0.78%)#31 | 118,932(0.02%)#873 |
| 32. | Highland Heights | 21 | 2,690(0.78%)#32 | 118,932(0.02%)#893 |
| 33. | Lyndhurst | 20 | 2,690(0.74%)#33 | 118,932(0.02%)#917 |
| 34. | Worthington | 17 | 2,690(0.63%)#34 | 118,932(0.01%)#1,015 |
| 35. | Austintown | 16 | 2,690(0.59%)#35 | 118,932(0.01%)#1,044 |
| 36. | Parma Heights | 16 | 2,690(0.59%)#36 | 118,932(0.01%)#1,051 |
| 37. | Ashland | 16 | 2,690(0.59%)#37 | 118,932(0.01%)#1,052 |
| 38. | Bridgetown | 16 | 2,690(0.59%)#38 | 118,932(0.01%)#1,057 |
| 39. | Middletown | 15 | 2,690(0.56%)#39 | 118,932(0.01%)#1,089 |
| 40. | Tallmadge | 15 | 2,690(0.56%)#40 | 118,932(0.01%)#1,108 |
| 41. | Loveland | 15 | 2,690(0.56%)#41 | 118,932(0.01%)#1,112 |
| 42. | Euclid | 14 | 2,690(0.52%)#42 | 118,932(0.01%)#1,138 |
| 43. | Green | 14 | 2,690(0.52%)#43 | 118,932(0.01%)#1,146 |
| 44. | Broadview Heights | 14 | 2,690(0.52%)#44 | 118,932(0.01%)#1,150 |
| 45. | Clayton | 14 | 2,690(0.52%)#45 | 118,932(0.01%)#1,154 |
| 46. | Cheviot | 14 | 2,690(0.52%)#46 | 118,932(0.01%)#1,161 |
| 47. | Bolindale | 14 | 2,690(0.52%)#47 | 118,932(0.01%)#1,177 |
| 48. | Brunswick | 13 | 2,690(0.48%)#48 | 118,932(0.01%)#1,189 |
| 49. | Blue Ash | 13 | 2,690(0.48%)#49 | 118,932(0.01%)#1,202 |
| 50. | Forestville | 12 | 2,690(0.45%)#50 | 118,932(0.01%)#1,245 |
| 51. | Huber Heights | 11 | 2,690(0.41%)#51 | 118,932(0.01%)#1,273 |
| 52. | Beckett Ridge | 11 | 2,690(0.41%)#52 | 118,932(0.01%)#1,296 |
| 53. | Twinsburg | 10 | 2,690(0.37%)#53 | 118,932(0.01%)#1,346 |
| 54. | Springboro | 10 | 2,690(0.37%)#54 | 118,932(0.01%)#1,347 |
| 55. | Reading | 10 | 2,690(0.37%)#55 | 118,932(0.01%)#1,360 |
| 56. | Orange | 10 | 2,690(0.37%)#56 | 118,932(0.01%)#1,383 |
| 57. | Germantown | 9 | 2,690(0.33%)#57 | 118,932(0.01%)#1,459 |
| 58. | Four Bridges | 9 | 2,690(0.33%)#58 | 118,932(0.01%)#1,465 |
| 59. | Centerville | 8 | 2,690(0.30%)#59 | 118,932(0.01%)#1,497 |
| 60. | Steubenville | 7 | 2,690(0.26%)#60 | 118,932(0.01%)#1,569 |
| 61. | Seven Hills | 7 | 2,690(0.26%)#61 | 118,932(0.01%)#1,577 |
| 62. | Dent | 7 | 2,690(0.26%)#62 | 118,932(0.01%)#1,578 |
| 63. | Kettering | 6 | 2,690(0.22%)#63 | 118,932(0.01%)#1,614 |
| 64. | Bay Village | 6 | 2,690(0.22%)#64 | 118,932(0.01%)#1,629 |
| 65. | Medina | 5 | 2,690(0.19%)#65 | 118,932(0.00%)#1,686 |
| 66. | Brook Park | 5 | 2,690(0.19%)#66 | 118,932(0.00%)#1,691 |
| 67. | Bowling Green | 4 | 2,690(0.15%)#67 | 118,932(0.00%)#1,737 |
| 68. | North Canton | 4 | 2,690(0.15%)#68 | 118,932(0.00%)#1,742 |
| 69. | Harveysburg | 4 | 2,690(0.15%)#69 | 118,932(0.00%)#1,772 |
| 70. | Brooklyn Heights | 3 | 2,690(0.11%)#70 | 118,932(0.00%)#1,799 |
| 71. | Meyers Lake | 3 | 2,690(0.11%)#71 | 118,932(0.00%)#1,810 |
| 72. | Maineville | 2 | 2,690(0.07%)#72 | 118,932(0.00%)#1,824 |
| 73. | North Lewisburg | 2 | 2,690(0.07%)#73 | 118,932(0.00%)#1,826 |
| 74. | Bentleyville | 1 | 2,690(0.04%)#74 | 118,932(0.00%)#1,851 |
Common Questions
What are the Top 10 Cities with the Most Immigrants from Greece in Ohio?
Top 10 Cities with the Most Immigrants from Greece in Ohio are:
#1
245
#2
238
#3
134
#4
103
#5
80
#6
70
#7
64
#8
61
#9
60
#10
56
What city has the Most Immigrants from Greece in Ohio?
Columbus has the Most Immigrants from Greece in Ohio with 245.
What is the Total Immigrants from Greece in the State of Ohio?
Total Immigrants from Greece in Ohio is 2,690.
What is the Total Immigrants from Greece in the United States?
Total Immigrants from Greece in the United States is 118,932.