Cities with the Highest Percentage of Immigrants from South Africa in Ohio
RELATED REPORTS & OPTIONS
South Africa
Ohio
Compare Cities
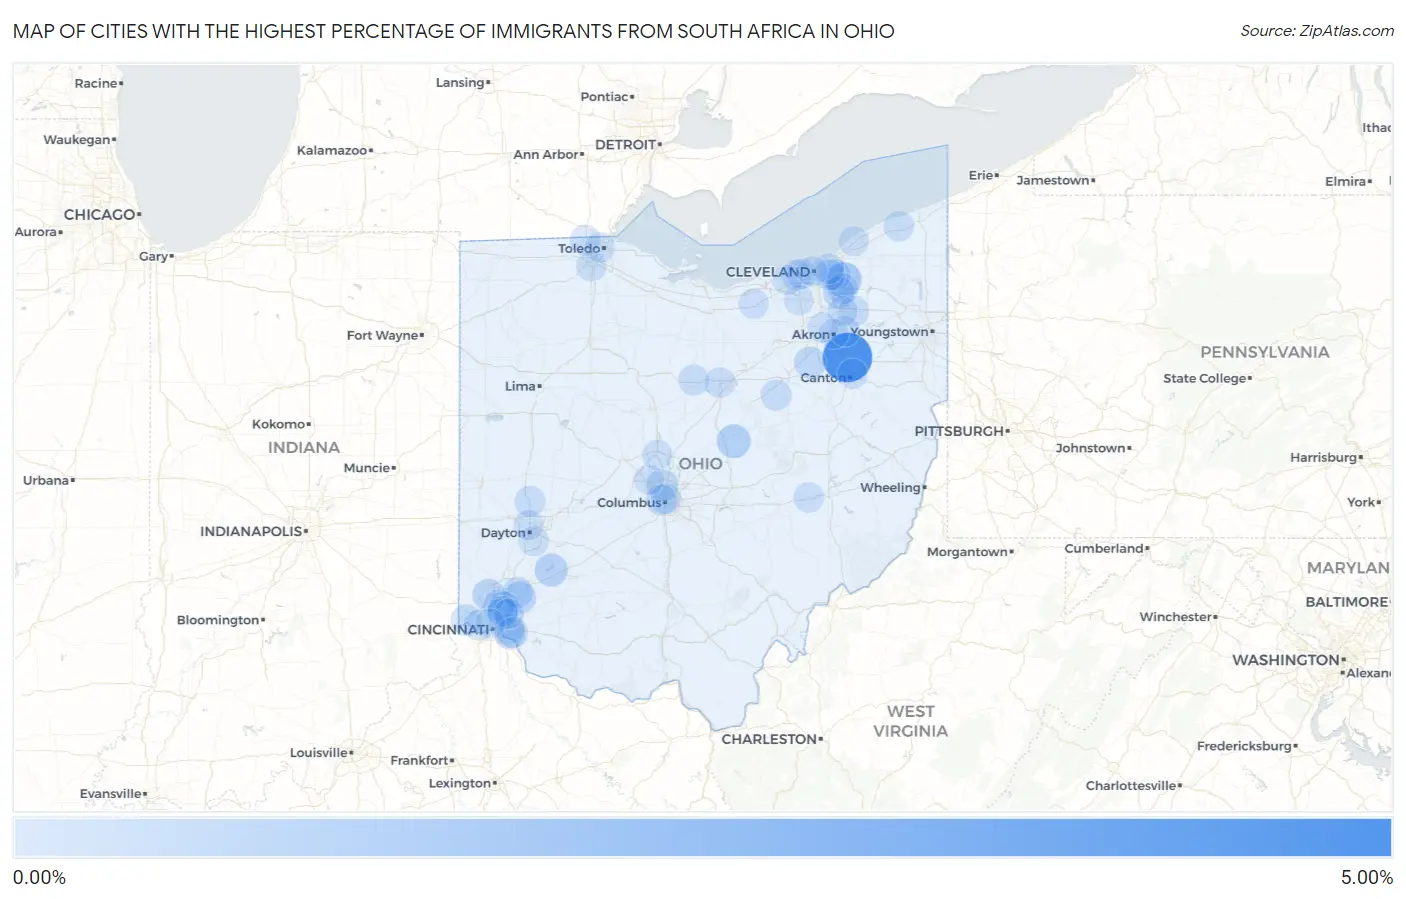
Map of Cities with the Highest Percentage of Immigrants from South Africa in Ohio
0.00%
5.00%
Cities with the Highest Percentage of Immigrants from South Africa in Ohio
| City | South Africa | vs State | vs National | |
| 1. | Greentown | 4.46% | 0.018%(+4.44)#-1 | 0.035%(+4.43)#0 |
| 2. | Bass Lake | 2.78% | 0.018%(+2.76)#0 | 0.035%(+2.75)#1 |
| 3. | Moreland Hills | 1.22% | 0.018%(+1.20)#1 | 0.035%(+1.19)#2 |
| 4. | Gambier | 0.80% | 0.018%(+0.782)#2 | 0.035%(+0.765)#3 |
| 5. | Harveysburg | 0.64% | 0.018%(+0.626)#3 | 0.035%(+0.608)#4 |
| 6. | Landen | 0.50% | 0.018%(+0.486)#4 | 0.035%(+0.468)#5 |
| 7. | Fairfield | 0.48% | 0.018%(+0.467)#5 | 0.035%(+0.449)#6 |
| 8. | Riverlea | 0.39% | 0.018%(+0.371)#6 | 0.035%(+0.353)#7 |
| 9. | Marshallville | 0.39% | 0.018%(+0.369)#7 | 0.035%(+0.351)#8 |
| 10. | Glenwillow | 0.35% | 0.018%(+0.336)#8 | 0.035%(+0.318)#9 |
| 11. | Evendale | 0.30% | 0.018%(+0.283)#9 | 0.035%(+0.265)#10 |
| 12. | Turpin Hills | 0.24% | 0.018%(+0.223)#10 | 0.035%(+0.205)#11 |
| 13. | Cleves | 0.24% | 0.018%(+0.218)#11 | 0.035%(+0.200)#12 |
| 14. | Glendale | 0.23% | 0.018%(+0.215)#12 | 0.035%(+0.197)#13 |
| 15. | Amberley | 0.21% | 0.018%(+0.192)#13 | 0.035%(+0.174)#14 |
| 16. | Mason | 0.21% | 0.018%(+0.189)#14 | 0.035%(+0.172)#15 |
| 17. | Beachwood | 0.20% | 0.018%(+0.185)#15 | 0.035%(+0.167)#16 |
| 18. | Grandview Heights | 0.19% | 0.018%(+0.176)#16 | 0.035%(+0.158)#17 |
| 19. | Fruit Hill | 0.19% | 0.018%(+0.175)#17 | 0.035%(+0.157)#18 |
| 20. | Shreve | 0.18% | 0.018%(+0.161)#18 | 0.035%(+0.143)#19 |
| 21. | Crestline | 0.18% | 0.018%(+0.161)#19 | 0.035%(+0.143)#20 |
| 22. | Solon | 0.17% | 0.018%(+0.157)#20 | 0.035%(+0.139)#21 |
| 23. | Shaker Heights | 0.17% | 0.018%(+0.154)#21 | 0.035%(+0.136)#22 |
| 24. | Tipp City | 0.17% | 0.018%(+0.148)#22 | 0.035%(+0.130)#23 |
| 25. | Forestville | 0.16% | 0.018%(+0.141)#23 | 0.035%(+0.123)#24 |
| 26. | Streetsboro | 0.13% | 0.018%(+0.115)#24 | 0.035%(+0.097)#25 |
| 27. | Covedale | 0.12% | 0.018%(+0.107)#25 | 0.035%(+0.089)#26 |
| 28. | Tallmadge | 0.10% | 0.018%(+0.086)#26 | 0.035%(+0.068)#27 |
| 29. | Cleveland Heights | 0.100% | 0.018%(+0.082)#27 | 0.035%(+0.065)#28 |
| 30. | Reading | 0.095% | 0.018%(+0.077)#28 | 0.035%(+0.060)#29 |
| 31. | Oberlin | 0.085% | 0.018%(+0.068)#29 | 0.035%(+0.050)#30 |
| 32. | New Concord | 0.077% | 0.018%(+0.060)#30 | 0.035%(+0.042)#31 |
| 33. | Mansfield | 0.073% | 0.018%(+0.056)#31 | 0.035%(+0.038)#32 |
| 34. | Rocky River | 0.070% | 0.018%(+0.052)#32 | 0.035%(+0.034)#33 |
| 35. | Sylvania | 0.058% | 0.018%(+0.040)#33 | 0.035%(+0.022)#34 |
| 36. | Columbus | 0.057% | 0.018%(+0.039)#34 | 0.035%(+0.021)#135 |
| 37. | Lakewood | 0.053% | 0.018%(+0.036)#35 | 0.035%(+0.018)#136 |
| 38. | Geneva | 0.051% | 0.018%(+0.033)#36 | 0.035%(+0.015)#137 |
| 39. | Perrysburg | 0.048% | 0.018%(+0.031)#37 | 0.035%(+0.013)#138 |
| 40. | Kenwood | 0.048% | 0.018%(+0.031)#38 | 0.035%(+0.013)#139 |
| 41. | Hudson | 0.039% | 0.018%(+0.022)#39 | 0.035%(+0.004)#140 |
| 42. | Strongsville | 0.037% | 0.018%(+0.019)#40 | 0.035%(+0.001)#141 |
| 43. | Cincinnati | 0.026% | 0.018%(+0.008)#41 | 0.035%(-0.010)#142 |
| 44. | Westlake | 0.024% | 0.018%(+0.006)#42 | 0.035%(-0.012)#290 |
| 45. | Dublin | 0.022% | 0.018%(+0.005)#43 | 0.035%(-0.013)#291 |
| 46. | Canton | 0.018% | 0.018%(+0.001)#44 | 0.035%(-0.017)#292 |
| 47. | Kettering | 0.017% | 0.018%(-0.000)#45 | 0.035%(-0.018)#293 |
| 48. | Mentor | 0.015% | 0.018%(-0.003)#46 | 0.035%(-0.021)#294 |
| 49. | Delaware | 0.014% | 0.018%(-0.003)#47 | 0.035%(-0.021)#295 |
| 50. | Cleveland | 0.013% | 0.018%(-0.004)#48 | 0.035%(-0.022)#441 |
| 51. | Fairlawn | 0.013% | 0.018%(-0.005)#49 | 0.035%(-0.022)#442 |
| 52. | Toledo | 0.012% | 0.018%(-0.006)#50 | 0.035%(-0.024)#443 |
| 53. | Dayton | 0.010% | 0.018%(-0.007)#51 | 0.035%(-0.025)#444 |
| 54. | Akron | 0.0095% | 0.018%(-0.008)#52 | 0.035%(-0.026)#445 |
Common Questions
What are the Top 10 Cities with the Highest Percentage of Immigrants from South Africa in Ohio?
Top 10 Cities with the Highest Percentage of Immigrants from South Africa in Ohio are:
#1
4.46%
#2
1.22%
#3
0.80%
#4
0.64%
#5
0.50%
#6
0.48%
#7
0.39%
#8
0.39%
#9
0.35%
#10
0.30%
What city has the Highest Percentage of Immigrants from South Africa in Ohio?
Greentown has the Highest Percentage of Immigrants from South Africa in Ohio with 4.46%.
What is the Percentage of Immigrants from South Africa in the State of Ohio?
Percentage of Immigrants from South Africa in Ohio is 0.018%.
What is the Percentage of Immigrants from South Africa in the United States?
Percentage of Immigrants from South Africa in the United States is 0.035%.