Cities with the Lowest Percentage of Births to Unmarried Women in Ohio
RELATED REPORTS & OPTIONS
Lowest Illegitimacy | All Women
Ohio
Compare Cities
Map of Cities with the Lowest Percentage of Births to Unmarried Women in Ohio
25.0%
0.0%
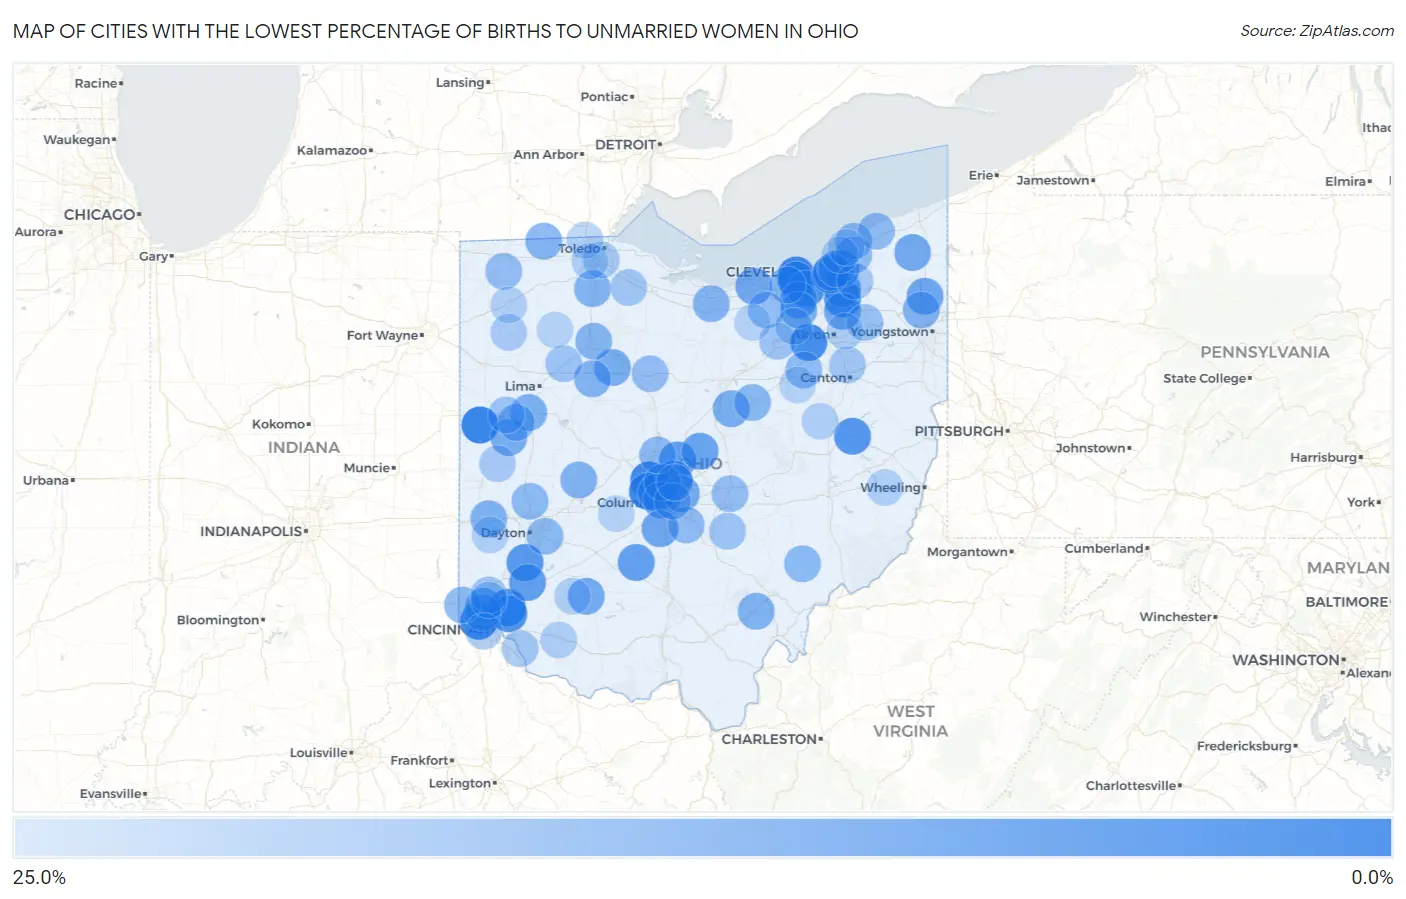
Cities with the Lowest Percentage of Births to Unmarried Women in Ohio
| City | % Unmarried | vs State | vs National | |
| 1. | Coldwater | 0.70% | 37.8%(-37.1)#1 | 32.1%(-31.4)#13 |
| 2. | Rocky River | 2.0% | 37.8%(-35.8)#2 | 32.1%(-30.1)#61 |
| 3. | Dublin | 2.1% | 37.8%(-35.7)#3 | 32.1%(-30.0)#64 |
| 4. | Blue Ash | 2.1% | 37.8%(-35.7)#4 | 32.1%(-30.0)#66 |
| 5. | Hilliard | 2.2% | 37.8%(-35.6)#5 | 32.1%(-29.9)#71 |
| 6. | Bridgetown | 2.2% | 37.8%(-35.6)#6 | 32.1%(-29.9)#75 |
| 7. | Fairview Park | 2.6% | 37.8%(-35.2)#7 | 32.1%(-29.5)#98 |
| 8. | Twinsburg | 2.9% | 37.8%(-34.9)#8 | 32.1%(-29.2)#118 |
| 9. | Wadsworth | 3.1% | 37.8%(-34.7)#9 | 32.1%(-29.0)#133 |
| 10. | Parma Heights | 3.9% | 37.8%(-33.9)#10 | 32.1%(-28.2)#171 |
| 11. | Upper Arlington | 4.3% | 37.8%(-33.5)#11 | 32.1%(-27.8)#198 |
| 12. | Kenwood | 4.8% | 37.8%(-33.0)#12 | 32.1%(-27.3)#247 |
| 13. | Uhrichsville | 5.3% | 37.8%(-32.5)#13 | 32.1%(-26.8)#293 |
| 14. | Springboro | 5.7% | 37.8%(-32.1)#14 | 32.1%(-26.4)#321 |
| 15. | Sunbury | 6.7% | 37.8%(-31.1)#15 | 32.1%(-25.4)#416 |
| 16. | Westerville | 7.2% | 37.8%(-30.6)#16 | 32.1%(-24.9)#469 |
| 17. | Lebanon | 7.4% | 37.8%(-30.4)#17 | 32.1%(-24.7)#487 |
| 18. | Solon | 7.6% | 37.8%(-30.2)#18 | 32.1%(-24.5)#506 |
| 19. | New Holland | 7.7% | 37.8%(-30.1)#19 | 32.1%(-24.4)#523 |
| 20. | Mayfield Heights | 7.9% | 37.8%(-29.9)#20 | 32.1%(-24.2)#542 |
| 21. | Grandview Heights | 8.3% | 37.8%(-29.5)#21 | 32.1%(-23.8)#585 |
| 22. | Shaker Heights | 8.5% | 37.8%(-29.3)#22 | 32.1%(-23.6)#612 |
| 23. | Strongsville | 8.7% | 37.8%(-29.1)#23 | 32.1%(-23.4)#630 |
| 24. | Centerburg | 8.9% | 37.8%(-28.9)#24 | 32.1%(-23.2)#662 |
| 25. | University Heights | 9.2% | 37.8%(-28.6)#25 | 32.1%(-22.9)#699 |
| 26. | Cortland | 9.3% | 37.8%(-28.5)#26 | 32.1%(-22.8)#711 |
| 27. | Commercial Point | 9.6% | 37.8%(-28.2)#27 | 32.1%(-22.5)#752 |
| 28. | Gahanna | 9.8% | 37.8%(-28.0)#28 | 32.1%(-22.3)#762 |
| 29. | Amherst | 9.8% | 37.8%(-28.0)#29 | 32.1%(-22.3)#765 |
| 30. | Roaming Shores | 10.0% | 37.8%(-27.8)#30 | 32.1%(-22.1)#792 |
| 31. | Hudson | 10.2% | 37.8%(-27.6)#31 | 32.1%(-21.9)#816 |
| 32. | New Vienna | 10.3% | 37.8%(-27.5)#32 | 32.1%(-21.8)#830 |
| 33. | Minster | 11.1% | 37.8%(-26.7)#33 | 32.1%(-21.0)#913 |
| 34. | Butler | 11.1% | 37.8%(-26.7)#34 | 32.1%(-21.0)#918 |
| 35. | Wharton | 11.1% | 37.8%(-26.7)#35 | 32.1%(-21.0)#932 |
| 36. | Brunswick | 11.4% | 37.8%(-26.4)#36 | 32.1%(-20.7)#946 |
| 37. | Northgate | 11.5% | 37.8%(-26.3)#37 | 32.1%(-20.6)#964 |
| 38. | Wapakoneta | 11.8% | 37.8%(-26.0)#38 | 32.1%(-20.3)#1,006 |
| 39. | Worthington | 12.0% | 37.8%(-25.8)#39 | 32.1%(-20.1)#1,029 |
| 40. | Lewisburg | 12.0% | 37.8%(-25.8)#40 | 32.1%(-20.1)#1,035 |
| 41. | Howland Center | 12.5% | 37.8%(-25.3)#41 | 32.1%(-19.6)#1,085 |
| 42. | Albany | 12.5% | 37.8%(-25.3)#42 | 32.1%(-19.6)#1,107 |
| 43. | Dunkirk | 12.5% | 37.8%(-25.3)#43 | 32.1%(-19.6)#1,109 |
| 44. | White Oak | 12.6% | 37.8%(-25.2)#44 | 32.1%(-19.5)#1,123 |
| 45. | Urbana | 12.6% | 37.8%(-25.2)#45 | 32.1%(-19.5)#1,125 |
| 46. | Bowling Green | 12.7% | 37.8%(-25.1)#46 | 32.1%(-19.4)#1,136 |
| 47. | Milan | 12.9% | 37.8%(-24.9)#47 | 32.1%(-19.2)#1,162 |
| 48. | Lyons | 12.9% | 37.8%(-24.9)#48 | 32.1%(-19.2)#1,166 |
| 49. | Findlay | 13.2% | 37.8%(-24.6)#49 | 32.1%(-18.9)#1,195 |
| 50. | North Olmsted | 13.3% | 37.8%(-24.5)#50 | 32.1%(-18.8)#1,205 |
| 51. | Lyndhurst | 13.7% | 37.8%(-24.1)#51 | 32.1%(-18.4)#1,261 |
| 52. | Harrison | 13.8% | 37.8%(-24.0)#52 | 32.1%(-18.3)#1,268 |
| 53. | Loudonville | 13.9% | 37.8%(-23.9)#53 | 32.1%(-18.2)#1,288 |
| 54. | Beavercreek | 14.0% | 37.8%(-23.8)#54 | 32.1%(-18.1)#1,290 |
| 55. | Tipp City | 14.3% | 37.8%(-23.5)#55 | 32.1%(-17.8)#1,327 |
| 56. | New Knoxville | 14.3% | 37.8%(-23.5)#56 | 32.1%(-17.8)#1,341 |
| 57. | Stockport | 14.3% | 37.8%(-23.5)#57 | 32.1%(-17.8)#1,348 |
| 58. | Kirtland | 14.5% | 37.8%(-23.3)#58 | 32.1%(-17.6)#1,380 |
| 59. | Mentor | 14.6% | 37.8%(-23.2)#59 | 32.1%(-17.5)#1,383 |
| 60. | Delaware | 14.6% | 37.8%(-23.2)#60 | 32.1%(-17.5)#1,385 |
| 61. | Lithopolis | 14.8% | 37.8%(-23.0)#61 | 32.1%(-17.3)#1,417 |
| 62. | Bexley | 14.9% | 37.8%(-22.9)#62 | 32.1%(-17.2)#1,427 |
| 63. | Orrville | 14.9% | 37.8%(-22.9)#63 | 32.1%(-17.2)#1,429 |
| 64. | Perry | 15.0% | 37.8%(-22.8)#64 | 32.1%(-17.1)#1,445 |
| 65. | Heath | 15.4% | 37.8%(-22.4)#65 | 32.1%(-16.7)#1,477 |
| 66. | Lagrange | 15.4% | 37.8%(-22.4)#66 | 32.1%(-16.7)#1,481 |
| 67. | Stryker | 15.4% | 37.8%(-22.4)#67 | 32.1%(-16.7)#1,486 |
| 68. | Nevada | 15.4% | 37.8%(-22.4)#68 | 32.1%(-16.7)#1,490 |
| 69. | Ravenna | 16.4% | 37.8%(-21.4)#69 | 32.1%(-15.7)#1,631 |
| 70. | Huber Ridge | 16.5% | 37.8%(-21.3)#70 | 32.1%(-15.6)#1,639 |
| 71. | St Marys | 16.7% | 37.8%(-21.1)#71 | 32.1%(-15.4)#1,652 |
| 72. | Bluffton | 16.7% | 37.8%(-21.1)#72 | 32.1%(-15.4)#1,661 |
| 73. | West Rushville | 16.7% | 37.8%(-21.1)#73 | 32.1%(-15.4)#1,704 |
| 74. | Fairfield | 17.0% | 37.8%(-20.8)#74 | 32.1%(-15.1)#1,725 |
| 75. | Lodi | 17.0% | 37.8%(-20.8)#75 | 32.1%(-15.1)#1,732 |
| 76. | Medina | 17.5% | 37.8%(-20.3)#76 | 32.1%(-14.6)#1,790 |
| 77. | Gibsonburg | 17.5% | 37.8%(-20.3)#77 | 32.1%(-14.6)#1,797 |
| 78. | North Canton | 17.7% | 37.8%(-20.1)#78 | 32.1%(-14.4)#1,820 |
| 79. | New Richmond | 17.8% | 37.8%(-20.0)#79 | 32.1%(-14.3)#1,834 |
| 80. | Rossford | 18.5% | 37.8%(-19.3)#80 | 32.1%(-13.6)#1,931 |
| 81. | South Russell | 18.6% | 37.8%(-19.2)#81 | 32.1%(-13.5)#1,947 |
| 82. | Delshire | 18.7% | 37.8%(-19.1)#82 | 32.1%(-13.4)#1,954 |
| 83. | Oakwood | 18.8% | 37.8%(-19.0)#83 | 32.1%(-13.3)#1,968 |
| 84. | Versailles | 19.0% | 37.8%(-18.8)#84 | 32.1%(-13.1)#2,013 |
| 85. | Pleasant Run Farm | 19.3% | 37.8%(-18.5)#85 | 32.1%(-12.8)#2,044 |
| 86. | Mount Orab | 19.5% | 37.8%(-18.3)#86 | 32.1%(-12.6)#2,073 |
| 87. | Tallmadge | 19.7% | 37.8%(-18.1)#87 | 32.1%(-12.4)#2,098 |
| 88. | Wickliffe | 19.7% | 37.8%(-18.1)#88 | 32.1%(-12.4)#2,100 |
| 89. | Defiance | 19.8% | 37.8%(-18.0)#89 | 32.1%(-12.3)#2,105 |
| 90. | Sylvania | 19.9% | 37.8%(-17.9)#90 | 32.1%(-12.2)#2,112 |
| 91. | Maumee | 19.9% | 37.8%(-17.9)#91 | 32.1%(-12.2)#2,113 |
| 92. | Sugarcreek | 20.0% | 37.8%(-17.8)#92 | 32.1%(-12.1)#2,132 |
| 93. | West Alexandria | 20.0% | 37.8%(-17.8)#93 | 32.1%(-12.1)#2,148 |
| 94. | Martinsville | 20.0% | 37.8%(-17.8)#94 | 32.1%(-12.1)#2,177 |
| 95. | Morristown | 20.0% | 37.8%(-17.8)#95 | 32.1%(-12.1)#2,190 |
| 96. | Leipsic | 20.6% | 37.8%(-17.2)#96 | 32.1%(-11.5)#2,252 |
| 97. | Apple Creek | 20.6% | 37.8%(-17.2)#97 | 32.1%(-11.5)#2,254 |
| 98. | London | 20.7% | 37.8%(-17.1)#98 | 32.1%(-11.4)#2,260 |
| 99. | Wellington | 20.8% | 37.8%(-17.0)#99 | 32.1%(-11.3)#2,279 |
| 100. | Willoughby | 20.9% | 37.8%(-16.9)#100 | 32.1%(-11.2)#2,286 |
Common Questions
What are the Top 10 Cities with the Lowest Percentage of Births to Unmarried Women in Ohio?
Top 10 Cities with the Lowest Percentage of Births to Unmarried Women in Ohio are:
#1
0.70%
#2
2.0%
#3
2.1%
#4
2.1%
#5
2.2%
#6
2.2%
#7
2.6%
#8
2.9%
#9
3.1%
#10
3.9%
What city has the Lowest Percentage of Births to Unmarried Women in Ohio?
Coldwater has the Lowest Percentage of Births to Unmarried Women in Ohio with 0.70%.
What is the Percentage of Births to Unmarried Women in the State of Ohio?
Percentage of Births to Unmarried Women in Ohio is 37.8%.
What is the Percentage of Births to Unmarried Women in the United States?
Percentage of Births to Unmarried Women in the United States is 32.1%.