Zip Codes with the Highest Percentage of Population Employed in Architecture & Engineering in Lima, OH
RELATED REPORTS & OPTIONS
Architecture & Engineering
Lima
Compare Zip Codes
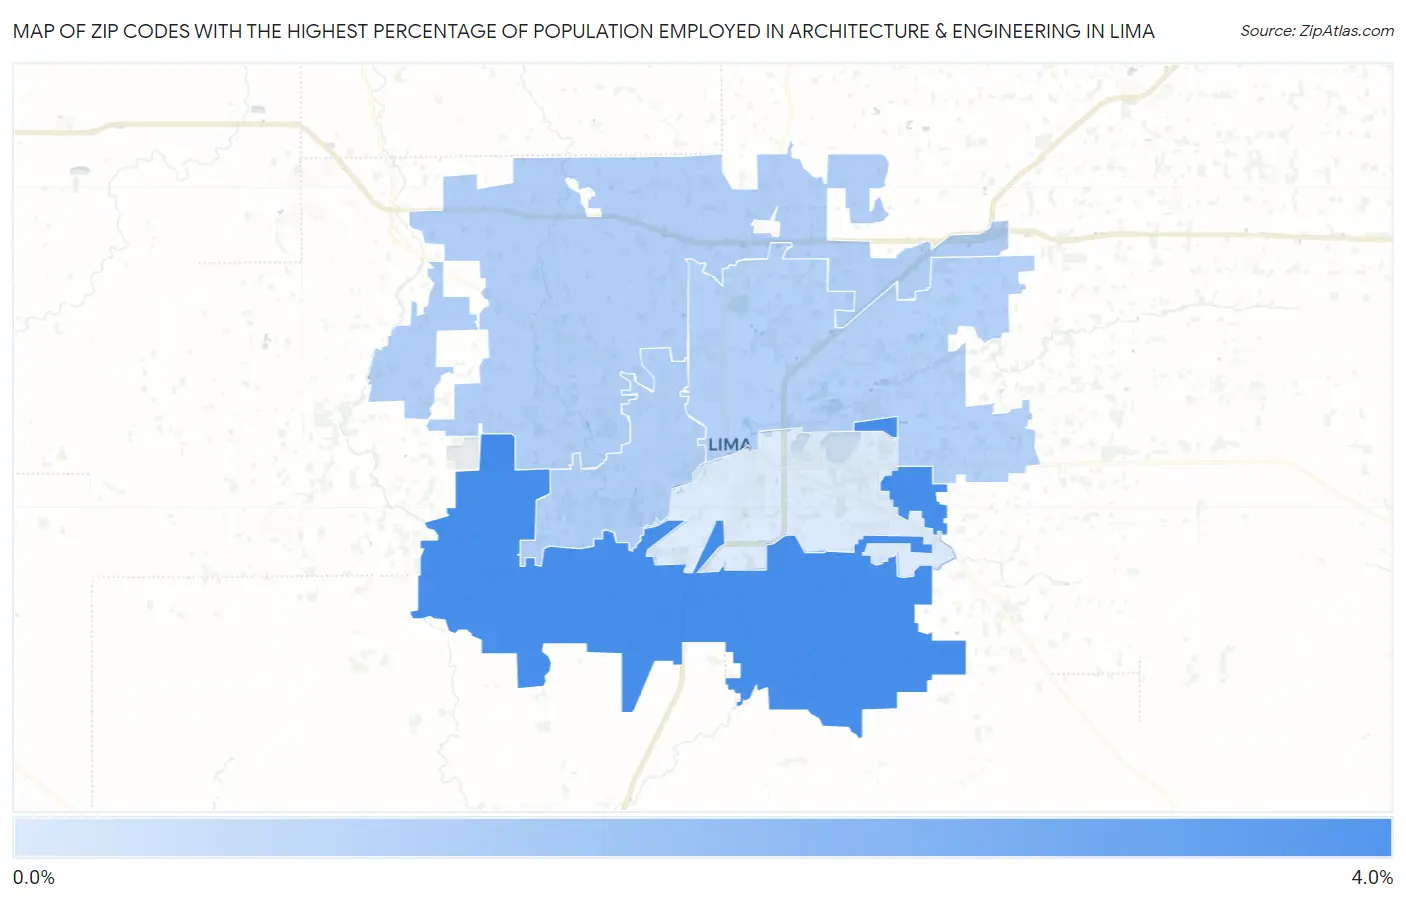
Map of Zip Codes with the Highest Percentage of Population Employed in Architecture & Engineering in Lima
0.55%
3.1%
Zip Codes with the Highest Percentage of Population Employed in Architecture & Engineering in Lima, OH
| Zip Code | % Employed | vs State | vs National | |
| 1. | 45806 | 3.1% | 2.1%(+0.993)#196 | 2.1%(+0.978)#4,666 |
| 2. | 45807 | 1.3% | 2.1%(-0.805)#606 | 2.1%(-0.820)#14,108 |
| 3. | 45805 | 1.3% | 2.1%(-0.825)#613 | 2.1%(-0.840)#14,255 |
| 4. | 45801 | 1.3% | 2.1%(-0.873)#630 | 2.1%(-0.889)#14,596 |
| 5. | 45804 | 0.55% | 2.1%(-1.59)#830 | 2.1%(-1.60)#19,999 |
1
Common Questions
What are the Top 3 Zip Codes with the Highest Percentage of Population Employed in Architecture & Engineering in Lima, OH?
Top 3 Zip Codes with the Highest Percentage of Population Employed in Architecture & Engineering in Lima, OH are:
What zip code has the Highest Percentage of Population Employed in Architecture & Engineering in Lima, OH?
45806 has the Highest Percentage of Population Employed in Architecture & Engineering in Lima, OH with 3.1%.
What is the Percentage of Population Employed in Architecture & Engineering in Lima, OH?
Percentage of Population Employed in Architecture & Engineering in Lima is 0.75%.
What is the Percentage of Population Employed in Architecture & Engineering in Ohio?
Percentage of Population Employed in Architecture & Engineering in Ohio is 2.1%.
What is the Percentage of Population Employed in Architecture & Engineering in the United States?
Percentage of Population Employed in Architecture & Engineering in the United States is 2.1%.