Cities with the Most Immigrants from Nigeria in Ohio
RELATED REPORTS & OPTIONS
Nigeria
Ohio
Compare Cities
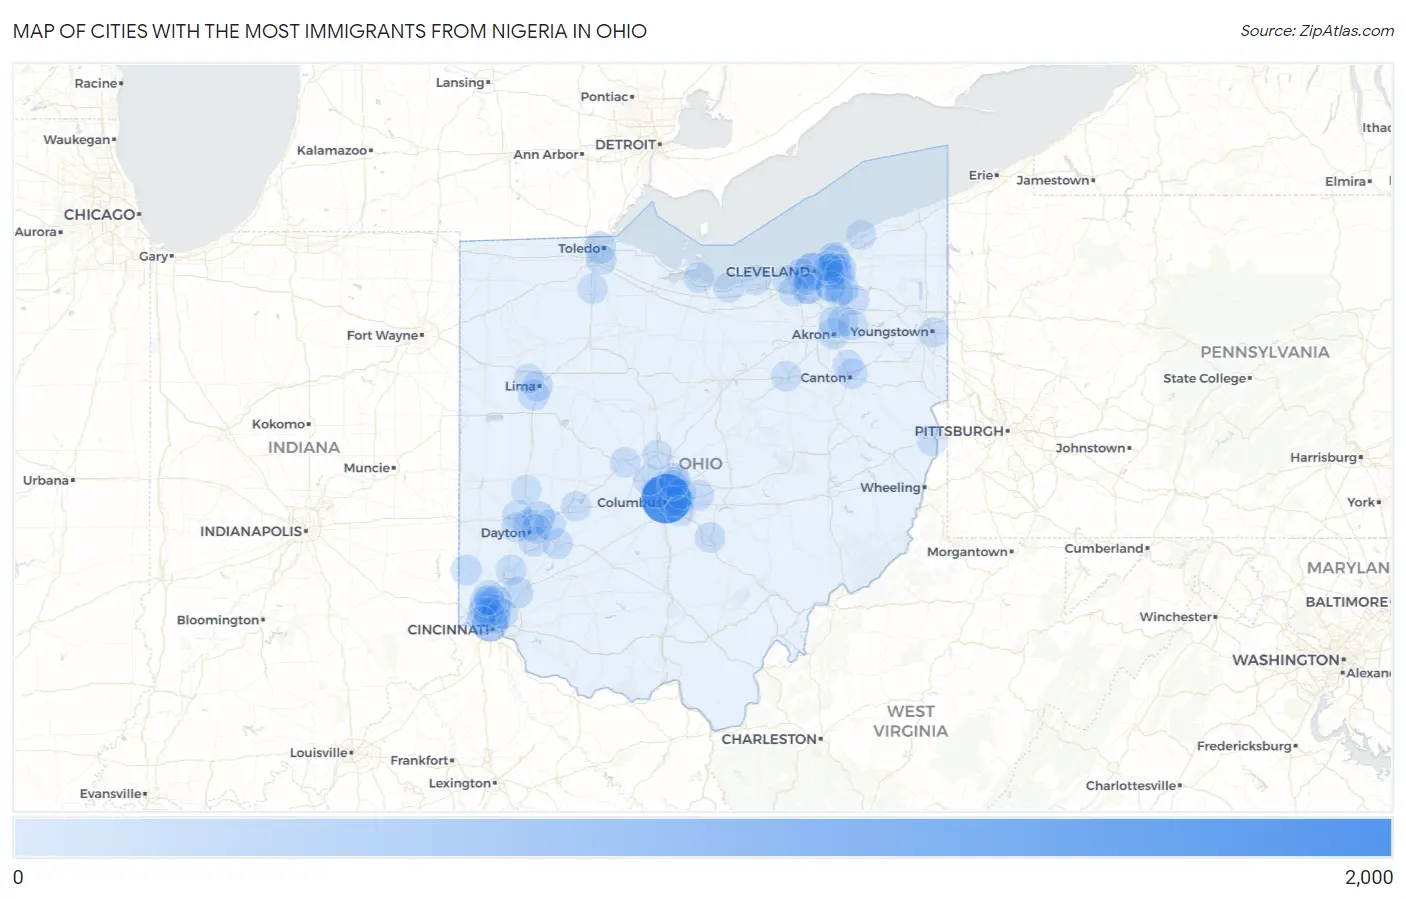
Map of Cities with the Most Immigrants from Nigeria in Ohio
0
2,000
Cities with the Most Immigrants from Nigeria in Ohio
| City | Nigeria | vs State | vs National | |
| 1. | Columbus | 1,642 | 7,029(23.36%)#1 | 416,418(0.39%)#25 |
| 2. | Cleveland | 555 | 7,029(7.90%)#2 | 416,418(0.13%)#109 |
| 3. | Cincinnati | 470 | 7,029(6.69%)#3 | 416,418(0.11%)#133 |
| 4. | Huber Heights | 198 | 7,029(2.82%)#4 | 416,418(0.05%)#324 |
| 5. | Solon | 171 | 7,029(2.43%)#5 | 416,418(0.04%)#369 |
| 6. | Richmond Heights | 168 | 7,029(2.39%)#6 | 416,418(0.04%)#378 |
| 7. | Toledo | 147 | 7,029(2.09%)#7 | 416,418(0.04%)#431 |
| 8. | Westerville | 144 | 7,029(2.05%)#8 | 416,418(0.03%)#440 |
| 9. | Dayton | 117 | 7,029(1.66%)#9 | 416,418(0.03%)#528 |
| 10. | Mason | 104 | 7,029(1.48%)#10 | 416,418(0.02%)#586 |
| 11. | Akron | 98 | 7,029(1.39%)#11 | 416,418(0.02%)#607 |
| 12. | Springdale | 94 | 7,029(1.34%)#12 | 416,418(0.02%)#620 |
| 13. | Lakewood | 83 | 7,029(1.18%)#13 | 416,418(0.02%)#670 |
| 14. | Euclid | 81 | 7,029(1.15%)#14 | 416,418(0.02%)#684 |
| 15. | Lyndhurst | 73 | 7,029(1.04%)#15 | 416,418(0.02%)#733 |
| 16. | Northbrook | 72 | 7,029(1.02%)#16 | 416,418(0.02%)#742 |
| 17. | Fort Shawnee | 71 | 7,029(1.01%)#17 | 416,418(0.02%)#748 |
| 18. | Oxford | 69 | 7,029(0.98%)#18 | 416,418(0.02%)#761 |
| 19. | Dublin | 65 | 7,029(0.92%)#19 | 416,418(0.02%)#792 |
| 20. | South Euclid | 62 | 7,029(0.88%)#20 | 416,418(0.01%)#827 |
| 21. | Kettering | 58 | 7,029(0.83%)#21 | 416,418(0.01%)#856 |
| 22. | Middletown | 57 | 7,029(0.81%)#22 | 416,418(0.01%)#869 |
| 23. | Xenia | 57 | 7,029(0.81%)#23 | 416,418(0.01%)#870 |
| 24. | Lima | 56 | 7,029(0.80%)#24 | 416,418(0.01%)#880 |
| 25. | Fairborn | 56 | 7,029(0.80%)#25 | 416,418(0.01%)#881 |
| 26. | Whitehall | 55 | 7,029(0.78%)#26 | 416,418(0.01%)#897 |
| 27. | Cuyahoga Falls | 54 | 7,029(0.77%)#27 | 416,418(0.01%)#901 |
| 28. | Pataskala | 50 | 7,029(0.71%)#28 | 416,418(0.01%)#956 |
| 29. | Lancaster | 45 | 7,029(0.64%)#29 | 416,418(0.01%)#1,014 |
| 30. | Sandusky | 45 | 7,029(0.64%)#30 | 416,418(0.01%)#1,017 |
| 31. | Parma Heights | 45 | 7,029(0.64%)#31 | 416,418(0.01%)#1,018 |
| 32. | Bedford | 43 | 7,029(0.61%)#32 | 416,418(0.01%)#1,042 |
| 33. | St Bernard | 43 | 7,029(0.61%)#33 | 416,418(0.01%)#1,046 |
| 34. | Stow | 42 | 7,029(0.60%)#34 | 416,418(0.01%)#1,051 |
| 35. | Upper Arlington | 38 | 7,029(0.54%)#35 | 416,418(0.01%)#1,102 |
| 36. | Fairfield | 37 | 7,029(0.53%)#36 | 416,418(0.01%)#1,117 |
| 37. | Canton | 32 | 7,029(0.46%)#37 | 416,418(0.01%)#1,206 |
| 38. | White Oak | 31 | 7,029(0.44%)#38 | 416,418(0.01%)#1,230 |
| 39. | Marysville | 30 | 7,029(0.43%)#39 | 416,418(0.01%)#1,243 |
| 40. | Aurora | 30 | 7,029(0.43%)#40 | 416,418(0.01%)#1,244 |
| 41. | Wooster | 28 | 7,029(0.40%)#41 | 416,418(0.01%)#1,285 |
| 42. | Lorain | 27 | 7,029(0.38%)#42 | 416,418(0.01%)#1,298 |
| 43. | Wyoming | 25 | 7,029(0.36%)#43 | 416,418(0.01%)#1,356 |
| 44. | Parma | 24 | 7,029(0.34%)#44 | 416,418(0.01%)#1,365 |
| 45. | Forest Park | 24 | 7,029(0.34%)#45 | 416,418(0.01%)#1,372 |
| 46. | North College Hill | 24 | 7,029(0.34%)#46 | 416,418(0.01%)#1,376 |
| 47. | Beulah Beach | 24 | 7,029(0.34%)#47 | 416,418(0.01%)#1,382 |
| 48. | Youngstown | 23 | 7,029(0.33%)#48 | 416,418(0.01%)#1,390 |
| 49. | Gahanna | 23 | 7,029(0.33%)#49 | 416,418(0.01%)#1,395 |
| 50. | Bexley | 23 | 7,029(0.33%)#50 | 416,418(0.01%)#1,402 |
| 51. | Clayton | 23 | 7,029(0.33%)#51 | 416,418(0.01%)#1,403 |
| 52. | Huber Ridge | 23 | 7,029(0.33%)#52 | 416,418(0.01%)#1,409 |
| 53. | Mayfield Heights | 22 | 7,029(0.31%)#53 | 416,418(0.01%)#1,427 |
| 54. | Berea | 21 | 7,029(0.30%)#54 | 416,418(0.01%)#1,450 |
| 55. | Westlake | 20 | 7,029(0.28%)#55 | 416,418(0.00%)#1,470 |
| 56. | Troy | 19 | 7,029(0.27%)#56 | 416,418(0.00%)#1,499 |
| 57. | Bowling Green | 18 | 7,029(0.26%)#57 | 416,418(0.00%)#1,530 |
| 58. | Amberley | 18 | 7,029(0.26%)#58 | 416,418(0.00%)#1,545 |
| 59. | Shaker Heights | 17 | 7,029(0.24%)#59 | 416,418(0.00%)#1,560 |
| 60. | Springfield | 16 | 7,029(0.23%)#60 | 416,418(0.00%)#1,586 |
| 61. | Rossford | 16 | 7,029(0.23%)#61 | 416,418(0.00%)#1,604 |
| 62. | Maple Heights | 15 | 7,029(0.21%)#62 | 416,418(0.00%)#1,629 |
| 63. | Riverside | 11 | 7,029(0.16%)#63 | 416,418(0.00%)#1,781 |
| 64. | Pepper Pike | 11 | 7,029(0.16%)#64 | 416,418(0.00%)#1,804 |
| 65. | Glenwillow | 11 | 7,029(0.16%)#65 | 416,418(0.00%)#1,814 |
| 66. | Pleasant Run | 10 | 7,029(0.14%)#66 | 416,418(0.00%)#1,852 |
| 67. | Kent | 9 | 7,029(0.13%)#67 | 416,418(0.00%)#1,880 |
| 68. | North Canton | 9 | 7,029(0.13%)#68 | 416,418(0.00%)#1,888 |
| 69. | East Cleveland | 9 | 7,029(0.13%)#69 | 416,418(0.00%)#1,893 |
| 70. | Blacklick Estates | 9 | 7,029(0.13%)#70 | 416,418(0.00%)#1,898 |
| 71. | Pleasant Run Farm | 8 | 7,029(0.11%)#71 | 416,418(0.00%)#1,954 |
| 72. | Cleveland Heights | 7 | 7,029(0.10%)#72 | 416,418(0.00%)#1,969 |
| 73. | Delaware | 7 | 7,029(0.10%)#73 | 416,418(0.00%)#1,971 |
| 74. | Brooklyn | 7 | 7,029(0.10%)#74 | 416,418(0.00%)#1,995 |
| 75. | Trotwood | 6 | 7,029(0.09%)#75 | 416,418(0.00%)#2,035 |
| 76. | Steubenville | 6 | 7,029(0.09%)#76 | 416,418(0.00%)#2,037 |
| 77. | Cheviot | 6 | 7,029(0.09%)#77 | 416,418(0.00%)#2,045 |
| 78. | Elida | 5 | 7,029(0.07%)#78 | 416,418(0.00%)#2,084 |
| 79. | Minerva Park | 4 | 7,029(0.06%)#79 | 416,418(0.00%)#2,120 |
| 80. | Grand River | 4 | 7,029(0.06%)#80 | 416,418(0.00%)#2,129 |
Common Questions
What are the Top 10 Cities with the Most Immigrants from Nigeria in Ohio?
Top 10 Cities with the Most Immigrants from Nigeria in Ohio are:
#1
1,642
#2
555
#3
470
#4
198
#5
171
#6
168
#7
147
#8
144
#9
117
#10
104
What city has the Most Immigrants from Nigeria in Ohio?
Columbus has the Most Immigrants from Nigeria in Ohio with 1,642.
What is the Total Immigrants from Nigeria in the State of Ohio?
Total Immigrants from Nigeria in Ohio is 7,029.
What is the Total Immigrants from Nigeria in the United States?
Total Immigrants from Nigeria in the United States is 416,418.