Shawnee Hills, OH Map & Demographics
Shawnee Hills Map
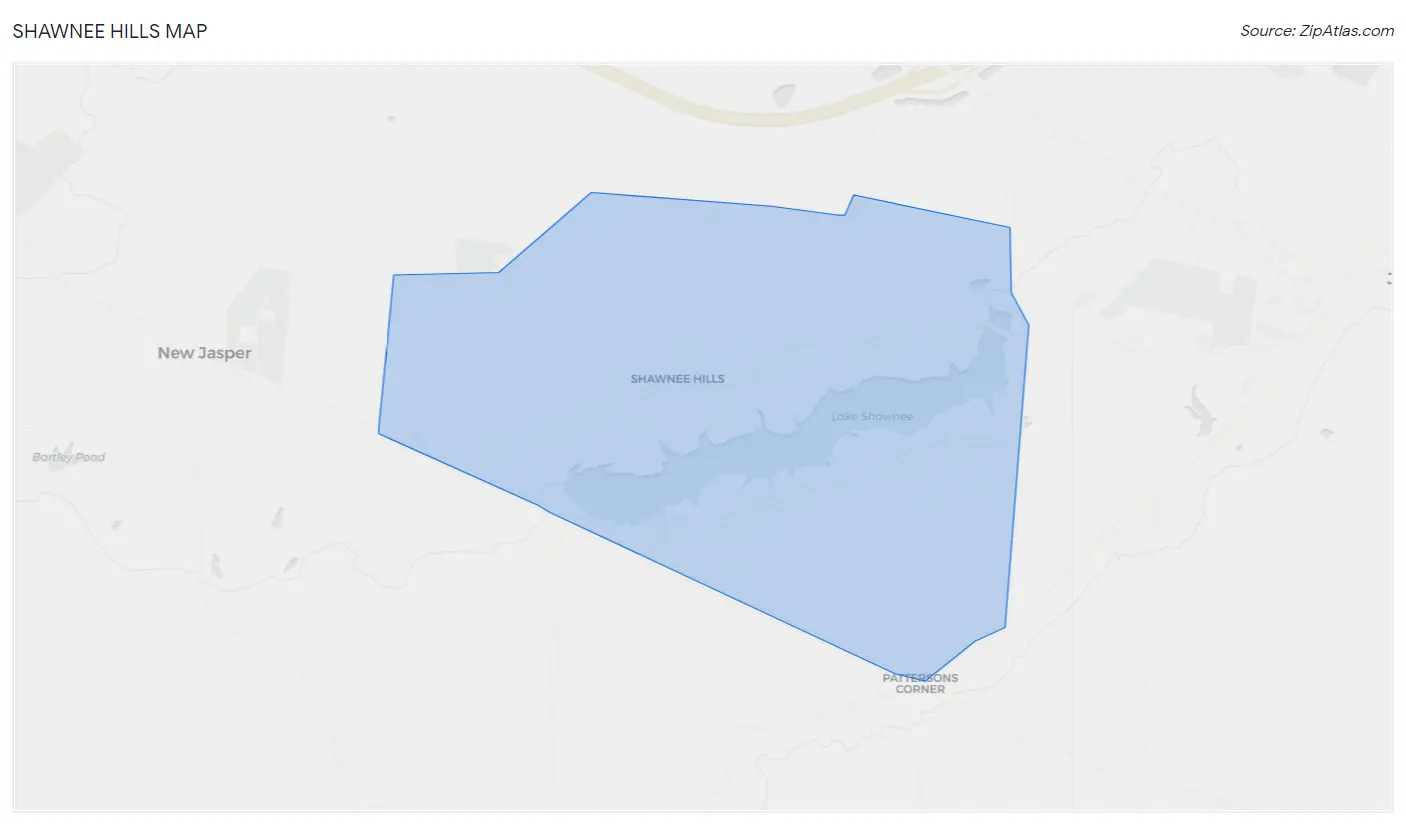
Shawnee Hills Overview
$45,407
PER CAPITA INCOME
$109,844
AVG FAMILY INCOME
$95,909
AVG HOUSEHOLD INCOME
28.1%
WAGE / INCOME GAP [ % ]
71.9¢/ $1
WAGE / INCOME GAP [ $ ]
0.36
INEQUALITY / GINI INDEX
2,566
TOTAL POPULATION
1,287
MALE POPULATION
1,279
FEMALE POPULATION
100.63
MALES / 100 FEMALES
99.38
FEMALES / 100 MALES
45.2
MEDIAN AGE
2.8
AVG FAMILY SIZE
2.4
AVG HOUSEHOLD SIZE
1,506
LABOR FORCE [ PEOPLE ]
70.0%
PERCENT IN LABOR FORCE
12.9%
UNEMPLOYMENT RATE
Shawnee Hills Area Codes
Income in Shawnee Hills
Income Overview in Shawnee Hills
Per Capita Income in Shawnee Hills is $45,407, while median incomes of families and households are $109,844 and $95,909 respectively.
| Characteristic | Number | Measure |
| Per Capita Income | 2,566 | $45,407 |
| Median Family Income | 804 | $109,844 |
| Mean Family Income | 804 | $123,318 |
| Median Household Income | 1,068 | $95,909 |
| Mean Household Income | 1,068 | $105,142 |
| Income Deficit | 804 | $0 |
| Wage / Income Gap (%) | 2,566 | 28.09% |
| Wage / Income Gap ($) | 2,566 | 71.91¢ per $1 |
| Gini / Inequality Index | 2,566 | 0.36 |
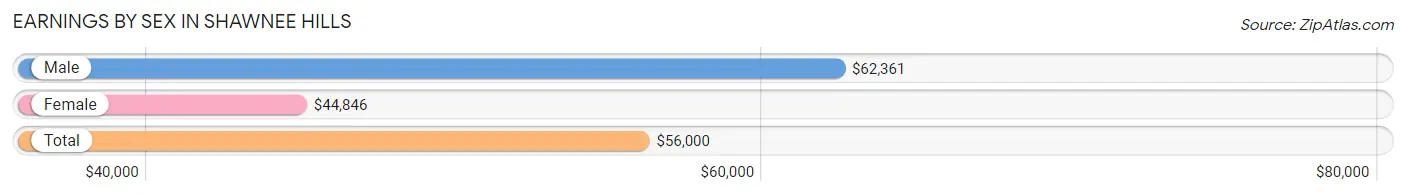
Earnings by Sex in Shawnee Hills
Average Earnings in Shawnee Hills are $56,000, $62,361 for men and $44,846 for women, a difference of 28.1%.
| Sex | Number | Average Earnings |
| Male | 827 (53.4%) | $62,361 |
| Female | 721 (46.6%) | $44,846 |
| Total | 1,548 (100.0%) | $56,000 |
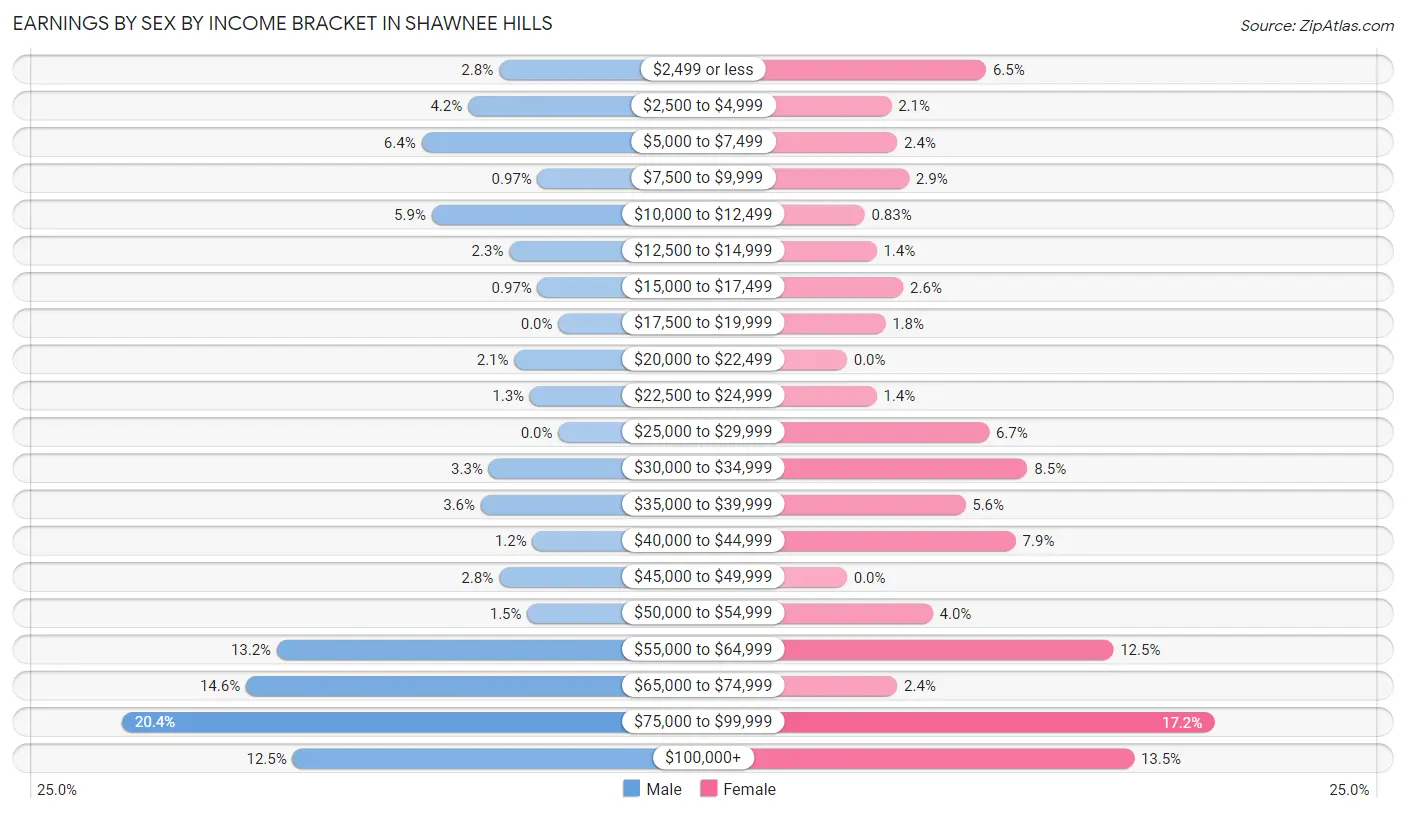
Earnings by Sex by Income Bracket in Shawnee Hills
The most common earnings brackets in Shawnee Hills are $75,000 to $99,999 for men (169 | 20.4%) and $75,000 to $99,999 for women (124 | 17.2%).
| Income | Male | Female |
| $2,499 or less | 23 (2.8%) | 47 (6.5%) |
| $2,500 to $4,999 | 35 (4.2%) | 15 (2.1%) |
| $5,000 to $7,499 | 53 (6.4%) | 17 (2.4%) |
| $7,500 to $9,999 | 8 (1.0%) | 21 (2.9%) |
| $10,000 to $12,499 | 49 (5.9%) | 6 (0.8%) |
| $12,500 to $14,999 | 19 (2.3%) | 10 (1.4%) |
| $15,000 to $17,499 | 8 (1.0%) | 19 (2.6%) |
| $17,500 to $19,999 | 0 (0.0%) | 13 (1.8%) |
| $20,000 to $22,499 | 17 (2.1%) | 0 (0.0%) |
| $22,500 to $24,999 | 11 (1.3%) | 10 (1.4%) |
| $25,000 to $29,999 | 0 (0.0%) | 48 (6.7%) |
| $30,000 to $34,999 | 27 (3.3%) | 61 (8.5%) |
| $35,000 to $39,999 | 30 (3.6%) | 40 (5.6%) |
| $40,000 to $44,999 | 10 (1.2%) | 57 (7.9%) |
| $45,000 to $49,999 | 23 (2.8%) | 0 (0.0%) |
| $50,000 to $54,999 | 12 (1.5%) | 29 (4.0%) |
| $55,000 to $64,999 | 109 (13.2%) | 90 (12.5%) |
| $65,000 to $74,999 | 121 (14.6%) | 17 (2.4%) |
| $75,000 to $99,999 | 169 (20.4%) | 124 (17.2%) |
| $100,000+ | 103 (12.4%) | 97 (13.5%) |
| Total | 827 (100.0%) | 721 (100.0%) |
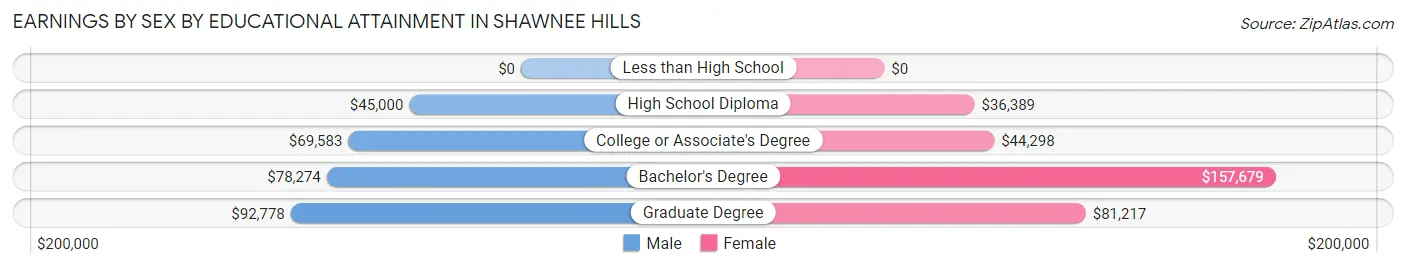
Earnings by Sex by Educational Attainment in Shawnee Hills
Average earnings in Shawnee Hills are $68,615 for men and $55,519 for women, a difference of 19.1%. Men with an educational attainment of graduate degree enjoy the highest average annual earnings of $92,778, while those with high school diploma education earn the least with $45,000. Women with an educational attainment of bachelor's degree earn the most with the average annual earnings of $157,679, while those with high school diploma education have the smallest earnings of $36,389.
| Educational Attainment | Male Income | Female Income |
| Less than High School | - | - |
| High School Diploma | $45,000 | $36,389 |
| College or Associate's Degree | $69,583 | $44,298 |
| Bachelor's Degree | $78,274 | $157,679 |
| Graduate Degree | $92,778 | $81,217 |
| Total | $68,615 | $55,519 |
Family Income in Shawnee Hills
Family Income Brackets in Shawnee Hills
According to the Shawnee Hills family income data, there are 267 families falling into the $100,000 to $149,999 income range, which is the most common income bracket and makes up 33.2% of all families.
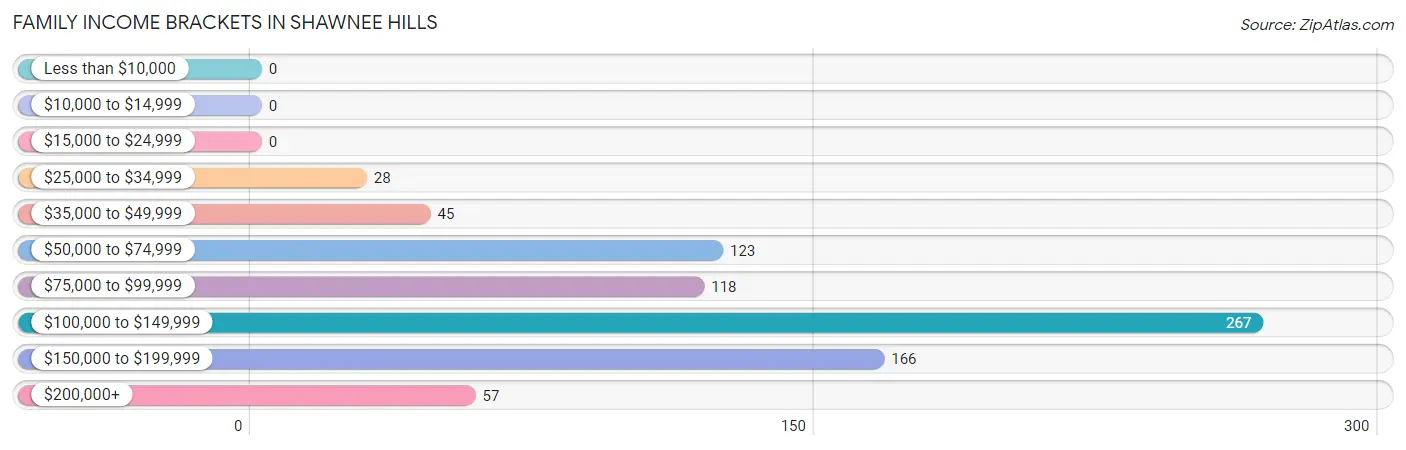
| Income Bracket | # Families | % Families |
| Less than $10,000 | 0 | 0.0% |
| $10,000 to $14,999 | 0 | 0.0% |
| $15,000 to $24,999 | 0 | 0.0% |
| $25,000 to $34,999 | 28 | 3.5% |
| $35,000 to $49,999 | 45 | 5.6% |
| $50,000 to $74,999 | 123 | 15.3% |
| $75,000 to $99,999 | 118 | 14.7% |
| $100,000 to $149,999 | 267 | 33.2% |
| $150,000 to $199,999 | 166 | 20.6% |
| $200,000+ | 57 | 7.1% |
Family Income by Famaliy Size in Shawnee Hills
4-person families (89 | 11.1%) account for the highest median family income in Shawnee Hills with $121,875 per family, while 2-person families (471 | 58.6%) have the highest median income of $54,367 per family member.
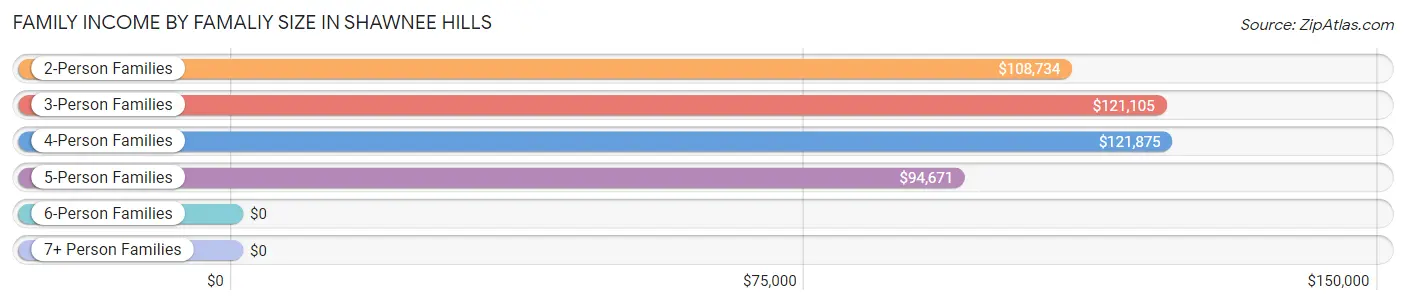
| Income Bracket | # Families | Median Income |
| 2-Person Families | 471 (58.6%) | $108,734 |
| 3-Person Families | 166 (20.6%) | $121,105 |
| 4-Person Families | 89 (11.1%) | $121,875 |
| 5-Person Families | 53 (6.6%) | $94,671 |
| 6-Person Families | 17 (2.1%) | $0 |
| 7+ Person Families | 8 (1.0%) | $0 |
| Total | 804 (100.0%) | $109,844 |
Family Income by Number of Earners in Shawnee Hills
The median family income in Shawnee Hills is $109,844, with families comprising 3+ earners (94) having the highest median family income of $121,477, while families with no earners (126) have the lowest median family income of $65,750, accounting for 11.7% and 15.7% of families, respectively.
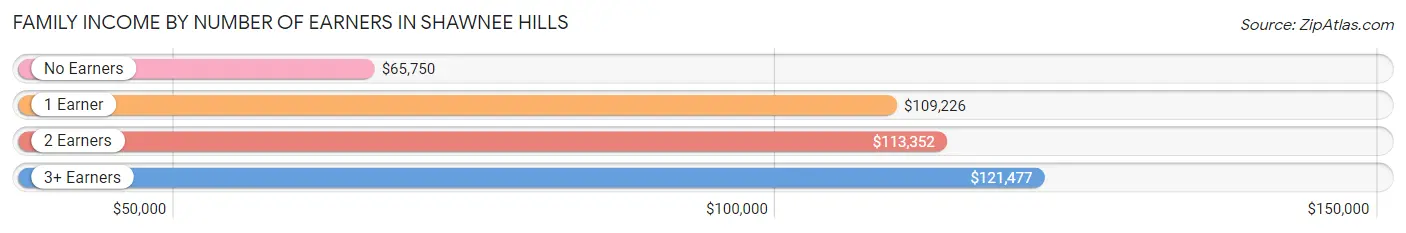
| Number of Earners | # Families | Median Income |
| No Earners | 126 (15.7%) | $65,750 |
| 1 Earner | 139 (17.3%) | $109,226 |
| 2 Earners | 445 (55.3%) | $113,352 |
| 3+ Earners | 94 (11.7%) | $121,477 |
| Total | 804 (100.0%) | $109,844 |
Household Income in Shawnee Hills
Household Income Brackets in Shawnee Hills
With 288 households falling in the category, the $100,000 to $149,999 income range is the most frequent in Shawnee Hills, accounting for 27.0% of all households. In contrast, only 9 households (0.8%) fall into the $10,000 to $14,999 income bracket, making it the least populous group.
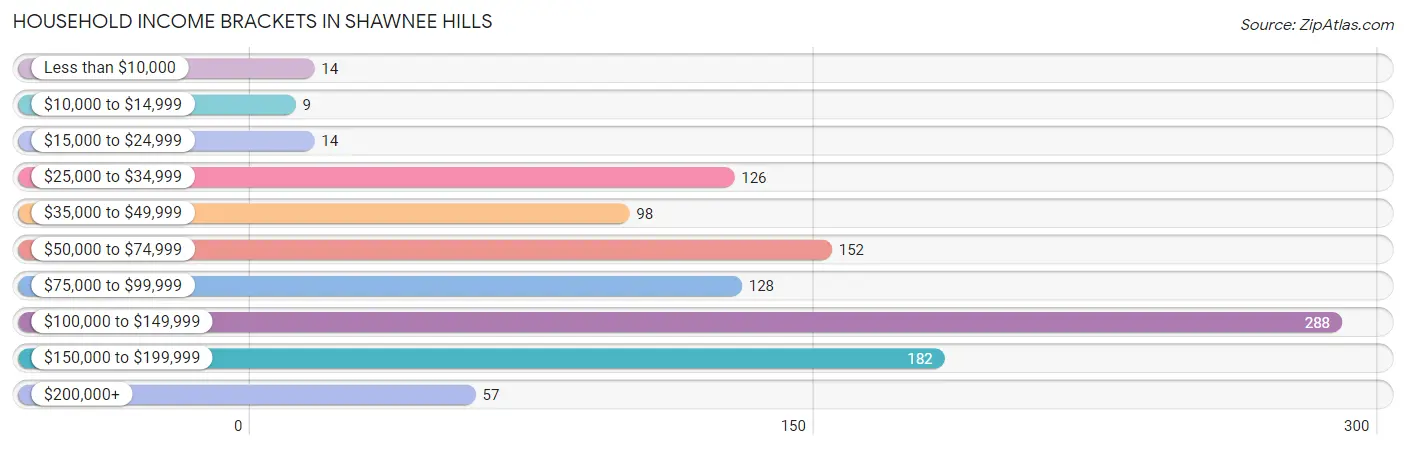
| Income Bracket | # Households | % Households |
| Less than $10,000 | 14 | 1.3% |
| $10,000 to $14,999 | 9 | 0.8% |
| $15,000 to $24,999 | 14 | 1.3% |
| $25,000 to $34,999 | 126 | 11.8% |
| $35,000 to $49,999 | 98 | 9.2% |
| $50,000 to $74,999 | 152 | 14.2% |
| $75,000 to $99,999 | 128 | 12.0% |
| $100,000 to $149,999 | 288 | 27.0% |
| $150,000 to $199,999 | 182 | 17.0% |
| $200,000+ | 57 | 5.3% |
Household Income by Householder Age in Shawnee Hills
The median household income in Shawnee Hills is $95,909, with the highest median household income of $134,883 found in the 25 to 44 years age bracket for the primary householder. A total of 295 households (27.6%) fall into this category. Meanwhile, the 15 to 24 years age bracket for the primary householder has the lowest median household income of $0, with 39 households (3.6%) in this group.
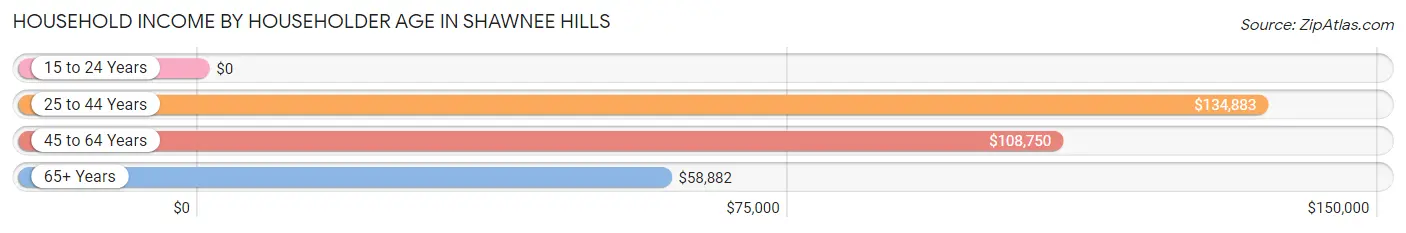
| Income Bracket | # Households | Median Income |
| 15 to 24 Years | 39 (3.6%) | $0 |
| 25 to 44 Years | 295 (27.6%) | $134,883 |
| 45 to 64 Years | 401 (37.6%) | $108,750 |
| 65+ Years | 333 (31.2%) | $58,882 |
| Total | 1,068 (100.0%) | $95,909 |
Poverty in Shawnee Hills
Income Below Poverty by Sex and Age in Shawnee Hills
With 1.8% poverty level for males and 2.4% for females among the residents of Shawnee Hills, 16 and 17 year old males and 75 year old and over females are the most vulnerable to poverty, with 5 males (100.0%) and 15 females (13.8%) in their respective age groups living below the poverty level.
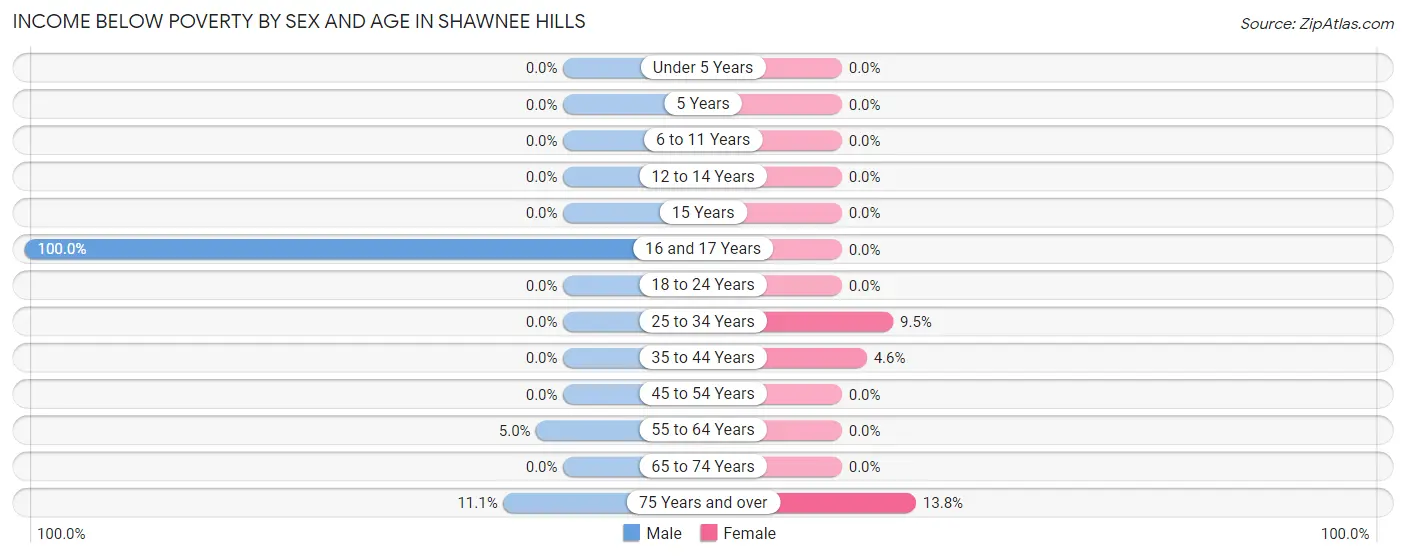
| Age Bracket | Male | Female |
| Under 5 Years | 0 (0.0%) | 0 (0.0%) |
| 5 Years | 0 (0.0%) | 0 (0.0%) |
| 6 to 11 Years | 0 (0.0%) | 0 (0.0%) |
| 12 to 14 Years | 0 (0.0%) | 0 (0.0%) |
| 15 Years | 0 (0.0%) | 0 (0.0%) |
| 16 and 17 Years | 5 (100.0%) | 0 (0.0%) |
| 18 to 24 Years | 0 (0.0%) | 0 (0.0%) |
| 25 to 34 Years | 0 (0.0%) | 8 (9.5%) |
| 35 to 44 Years | 0 (0.0%) | 8 (4.6%) |
| 45 to 54 Years | 0 (0.0%) | 0 (0.0%) |
| 55 to 64 Years | 10 (5.0%) | 0 (0.0%) |
| 65 to 74 Years | 0 (0.0%) | 0 (0.0%) |
| 75 Years and over | 8 (11.1%) | 15 (13.8%) |
| Total | 23 (1.8%) | 31 (2.4%) |
Income Above Poverty by Sex and Age in Shawnee Hills
According to the poverty statistics in Shawnee Hills, males aged under 5 years and females aged under 5 years are the age groups that are most secure financially, with 100.0% of males and 100.0% of females in these age groups living above the poverty line.
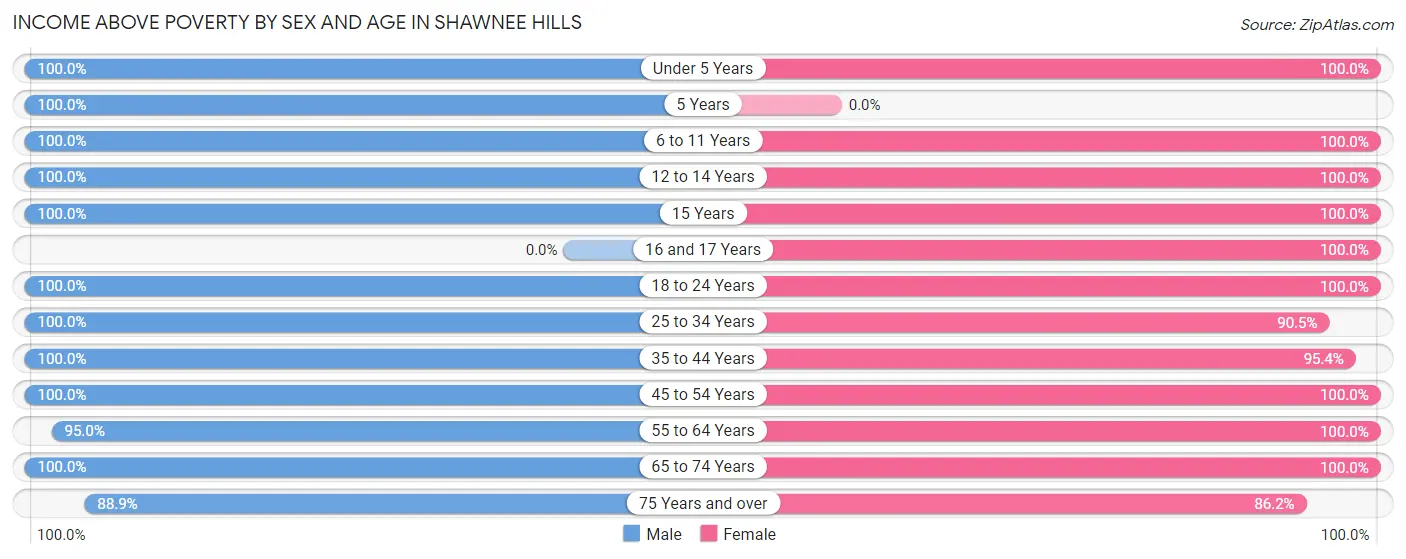
| Age Bracket | Male | Female |
| Under 5 Years | 57 (100.0%) | 86 (100.0%) |
| 5 Years | 15 (100.0%) | 0 (0.0%) |
| 6 to 11 Years | 66 (100.0%) | 85 (100.0%) |
| 12 to 14 Years | 53 (100.0%) | 34 (100.0%) |
| 15 Years | 10 (100.0%) | 9 (100.0%) |
| 16 and 17 Years | 0 (0.0%) | 9 (100.0%) |
| 18 to 24 Years | 119 (100.0%) | 88 (100.0%) |
| 25 to 34 Years | 197 (100.0%) | 76 (90.5%) |
| 35 to 44 Years | 191 (100.0%) | 165 (95.4%) |
| 45 to 54 Years | 122 (100.0%) | 220 (100.0%) |
| 55 to 64 Years | 190 (95.0%) | 174 (100.0%) |
| 65 to 74 Years | 180 (100.0%) | 208 (100.0%) |
| 75 Years and over | 64 (88.9%) | 94 (86.2%) |
| Total | 1,264 (98.2%) | 1,248 (97.6%) |
Income Below Poverty Among Married-Couple Families in Shawnee Hills
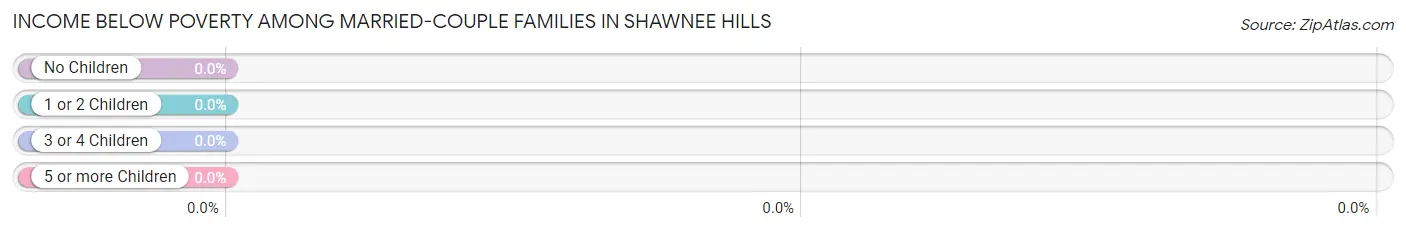
| Children | Above Poverty | Below Poverty |
| No Children | 483 (100.0%) | 0 (0.0%) |
| 1 or 2 Children | 138 (100.0%) | 0 (0.0%) |
| 3 or 4 Children | 64 (100.0%) | 0 (0.0%) |
| 5 or more Children | 0 (0.0%) | 0 (0.0%) |
| Total | 685 (100.0%) | 0 (0.0%) |
Income Below Poverty Among Single-Parent Households in Shawnee Hills
| Children | Single Father | Single Mother |
| No Children | 0 (0.0%) | 0 (0.0%) |
| 1 or 2 Children | 0 (0.0%) | 0 (0.0%) |
| 3 or 4 Children | 0 (0.0%) | 0 (0.0%) |
| 5 or more Children | 0 (0.0%) | 0 (0.0%) |
| Total | 0 (0.0%) | 0 (0.0%) |
Income Below Poverty Among Married-Couple vs Single-Parent Households in Shawnee Hills
| Children | Married-Couple Families | Single-Parent Households |
| No Children | 0 (0.0%) | 0 (0.0%) |
| 1 or 2 Children | 0 (0.0%) | 0 (0.0%) |
| 3 or 4 Children | 0 (0.0%) | 0 (0.0%) |
| 5 or more Children | 0 (0.0%) | 0 (0.0%) |
| Total | 0 (0.0%) | 0 (0.0%) |
Race in Shawnee Hills
The most populous races in Shawnee Hills are White / Caucasian (2,511 | 97.9%), Two or more Races (40 | 1.6%), and Hispanic or Latino (24 | 0.9%).
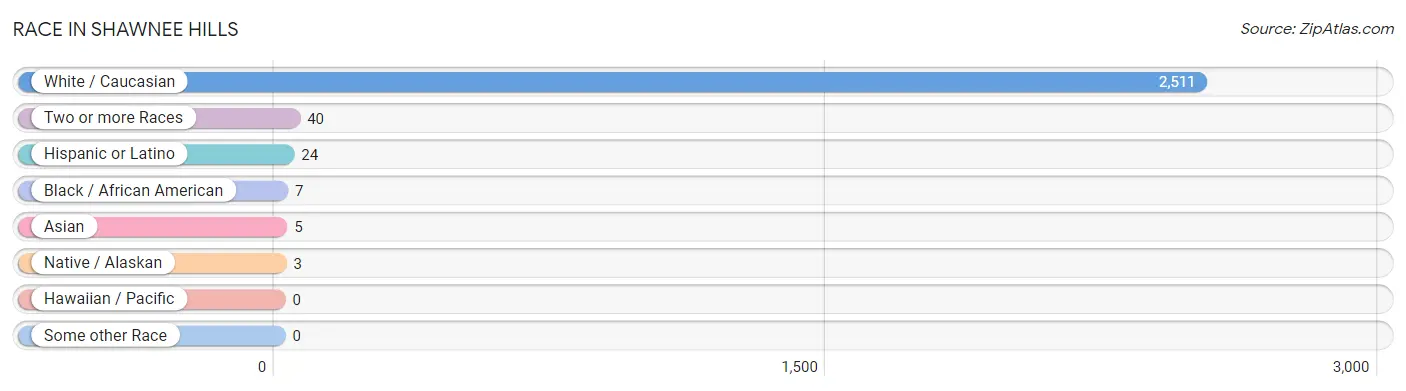
| Race | # Population | % Population |
| Asian | 5 | 0.2% |
| Black / African American | 7 | 0.3% |
| Hawaiian / Pacific | 0 | 0.0% |
| Hispanic or Latino | 24 | 0.9% |
| Native / Alaskan | 3 | 0.1% |
| White / Caucasian | 2,511 | 97.9% |
| Two or more Races | 40 | 1.6% |
| Some other Race | 0 | 0.0% |
| Total | 2,566 | 100.0% |
Ancestry in Shawnee Hills
The most populous ancestries reported in Shawnee Hills are German (690 | 26.9%), Irish (545 | 21.2%), English (514 | 20.0%), American (237 | 9.2%), and Italian (137 | 5.3%), together accounting for 82.7% of all Shawnee Hills residents.
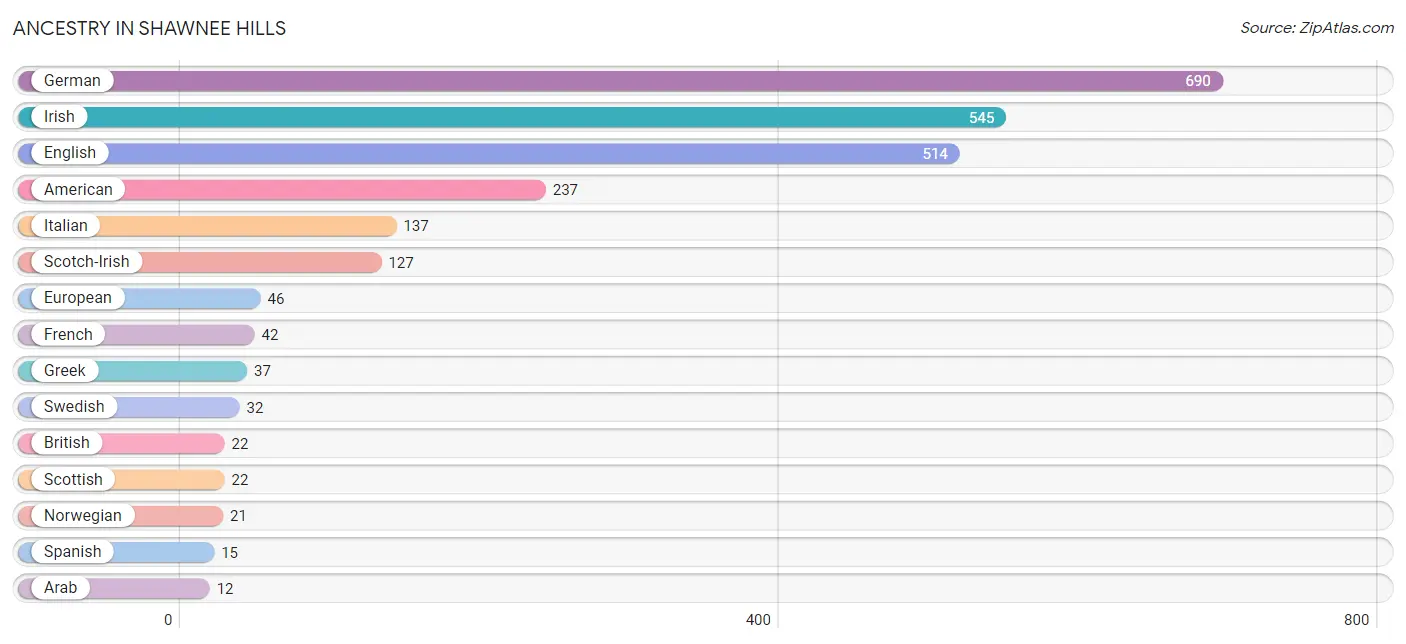
| Ancestry | # Population | % Population |
| American | 237 | 9.2% |
| Arab | 12 | 0.5% |
| British | 22 | 0.9% |
| English | 514 | 20.0% |
| European | 46 | 1.8% |
| French | 42 | 1.6% |
| French American Indian | 3 | 0.1% |
| German | 690 | 26.9% |
| Greek | 37 | 1.4% |
| Indian (Asian) | 5 | 0.2% |
| Irish | 545 | 21.2% |
| Italian | 137 | 5.3% |
| Lebanese | 12 | 0.5% |
| Mexican | 9 | 0.4% |
| Norwegian | 21 | 0.8% |
| Polish | 9 | 0.4% |
| Romanian | 10 | 0.4% |
| Russian | 7 | 0.3% |
| Scandinavian | 9 | 0.4% |
| Scotch-Irish | 127 | 5.0% |
| Scottish | 22 | 0.9% |
| Spanish | 15 | 0.6% |
| Swedish | 32 | 1.3% |
| Swiss | 10 | 0.4% |
| Welsh | 9 | 0.4% | View All 25 Rows |
Immigrants in Shawnee Hills
The most numerous immigrant groups reported in Shawnee Hills came from Asia (5 | 0.2%), China (5 | 0.2%), and Eastern Asia (5 | 0.2%), together accounting for 0.6% of all Shawnee Hills residents.
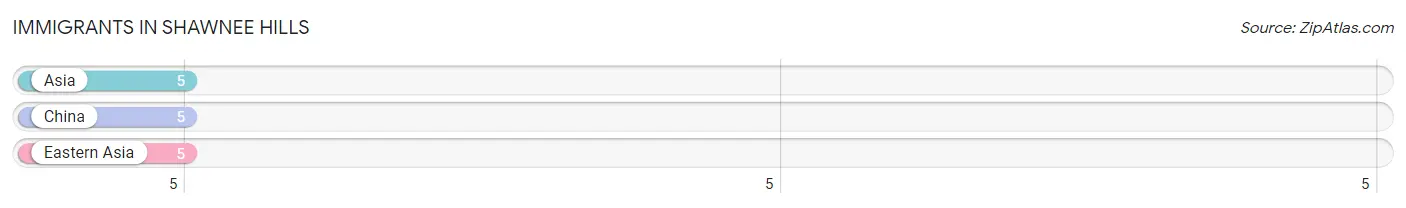
| Immigration Origin | # Population | % Population |
| Asia | 5 | 0.2% |
| China | 5 | 0.2% |
| Eastern Asia | 5 | 0.2% | View All 3 Rows |
Sex and Age in Shawnee Hills
Sex and Age in Shawnee Hills
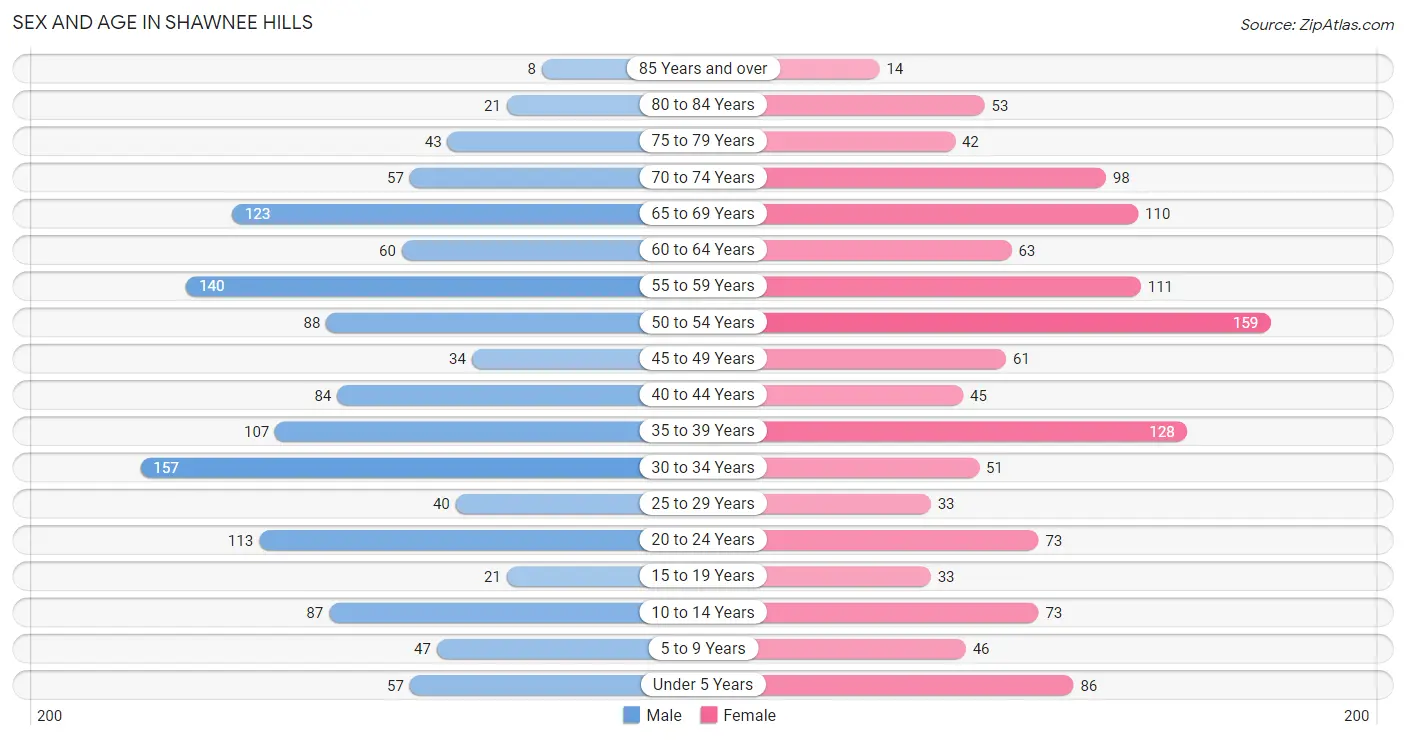
The most populous age groups in Shawnee Hills are 30 to 34 Years (157 | 12.2%) for men and 50 to 54 Years (159 | 12.4%) for women.
| Age Bracket | Male | Female |
| Under 5 Years | 57 (4.4%) | 86 (6.7%) |
| 5 to 9 Years | 47 (3.6%) | 46 (3.6%) |
| 10 to 14 Years | 87 (6.8%) | 73 (5.7%) |
| 15 to 19 Years | 21 (1.6%) | 33 (2.6%) |
| 20 to 24 Years | 113 (8.8%) | 73 (5.7%) |
| 25 to 29 Years | 40 (3.1%) | 33 (2.6%) |
| 30 to 34 Years | 157 (12.2%) | 51 (4.0%) |
| 35 to 39 Years | 107 (8.3%) | 128 (10.0%) |
| 40 to 44 Years | 84 (6.5%) | 45 (3.5%) |
| 45 to 49 Years | 34 (2.6%) | 61 (4.8%) |
| 50 to 54 Years | 88 (6.8%) | 159 (12.4%) |
| 55 to 59 Years | 140 (10.9%) | 111 (8.7%) |
| 60 to 64 Years | 60 (4.7%) | 63 (4.9%) |
| 65 to 69 Years | 123 (9.6%) | 110 (8.6%) |
| 70 to 74 Years | 57 (4.4%) | 98 (7.7%) |
| 75 to 79 Years | 43 (3.3%) | 42 (3.3%) |
| 80 to 84 Years | 21 (1.6%) | 53 (4.1%) |
| 85 Years and over | 8 (0.6%) | 14 (1.1%) |
| Total | 1,287 (100.0%) | 1,279 (100.0%) |
Families and Households in Shawnee Hills
Median Family Size in Shawnee Hills
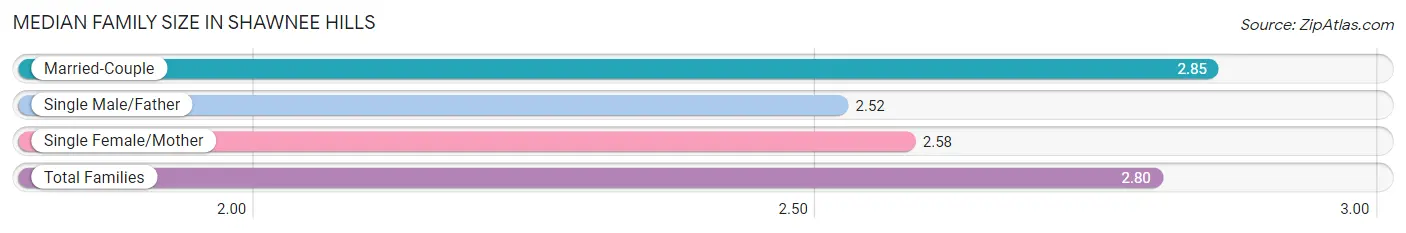
The median family size in Shawnee Hills is 2.80 persons per family, with married-couple families (685 | 85.2%) accounting for the largest median family size of 2.85 persons per family. On the other hand, single male/father families (64 | 8.0%) represent the smallest median family size with 2.52 persons per family.
| Family Type | # Families | Family Size |
| Married-Couple | 685 (85.2%) | 2.85 |
| Single Male/Father | 64 (8.0%) | 2.52 |
| Single Female/Mother | 55 (6.8%) | 2.58 |
| Total Families | 804 (100.0%) | 2.80 |
Median Household Size in Shawnee Hills
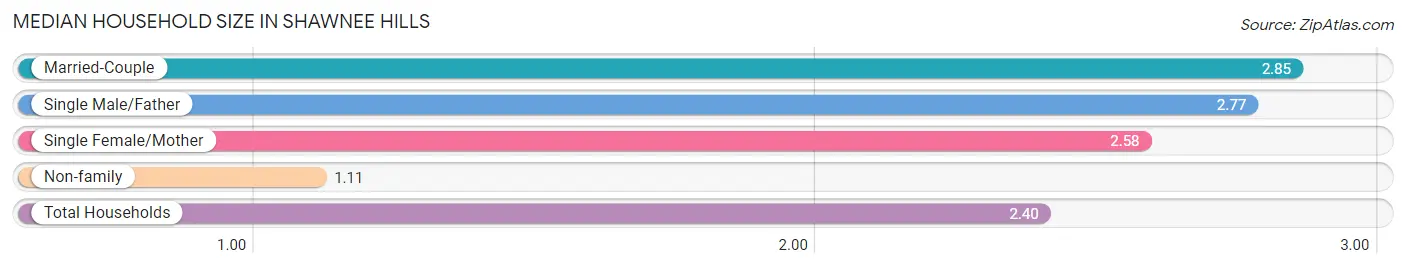
The median household size in Shawnee Hills is 2.40 persons per household, with married-couple households (685 | 64.1%) accounting for the largest median household size of 2.85 persons per household. non-family households (264 | 24.7%) represent the smallest median household size with 1.11 persons per household.
| Household Type | # Households | Household Size |
| Married-Couple | 685 (64.1%) | 2.85 |
| Single Male/Father | 64 (6.0%) | 2.77 |
| Single Female/Mother | 55 (5.1%) | 2.58 |
| Non-family | 264 (24.7%) | 1.11 |
| Total Households | 1,068 (100.0%) | 2.40 |
Household Size by Marriage Status in Shawnee Hills
Out of a total of 1,068 households in Shawnee Hills, 804 (75.3%) are family households, while 264 (24.7%) are nonfamily households. The most numerous type of family households are 2-person households, comprising 471, and the most common type of nonfamily households are 1-person households, comprising 236.
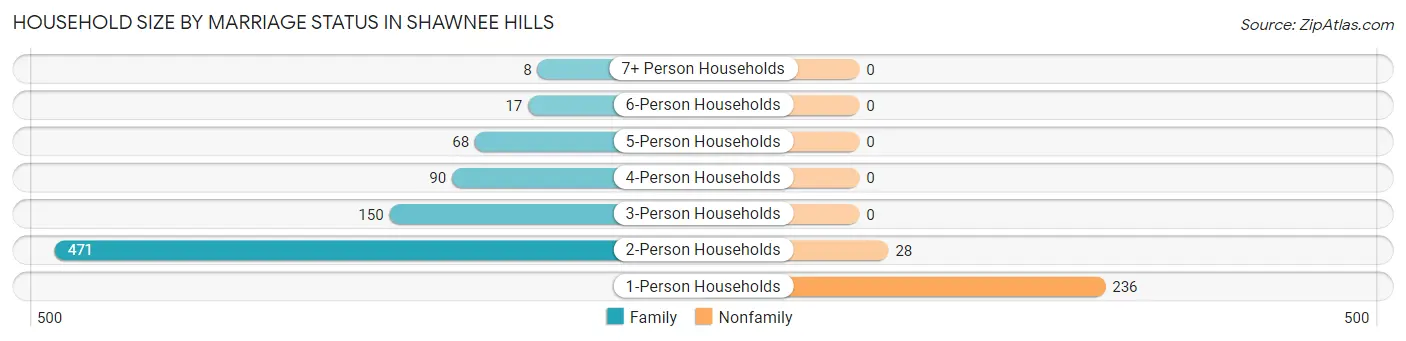
| Household Size | Family Households | Nonfamily Households |
| 1-Person Households | - | 236 (22.1%) |
| 2-Person Households | 471 (44.1%) | 28 (2.6%) |
| 3-Person Households | 150 (14.0%) | 0 (0.0%) |
| 4-Person Households | 90 (8.4%) | 0 (0.0%) |
| 5-Person Households | 68 (6.4%) | 0 (0.0%) |
| 6-Person Households | 17 (1.6%) | 0 (0.0%) |
| 7+ Person Households | 8 (0.7%) | 0 (0.0%) |
| Total | 804 (75.3%) | 264 (24.7%) |
Female Fertility in Shawnee Hills
Fertility by Age in Shawnee Hills
Average fertility rate in Shawnee Hills is 37.0 births per 1,000 women. Women in the age bracket of 20 to 34 years have the highest fertility rate with 121.0 births per 1,000 women. Women in the age bracket of 20 to 34 years acount for 100.0% of all women with births.
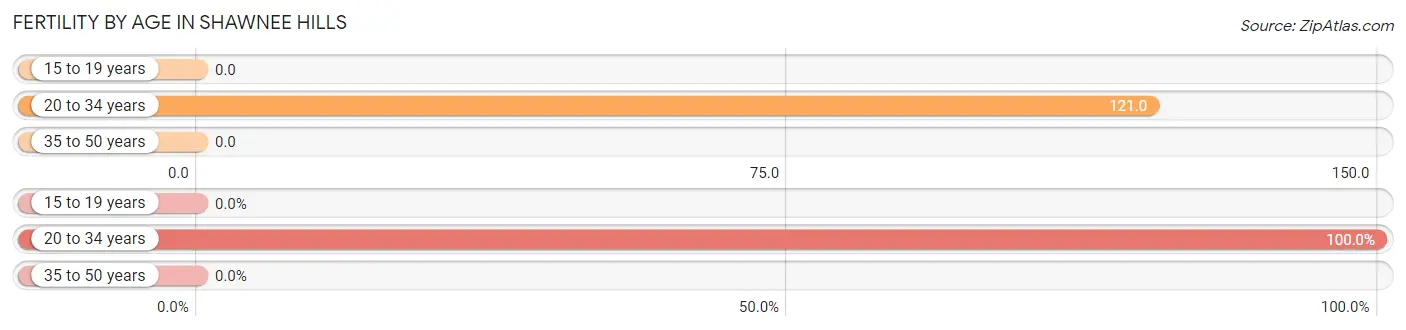
| Age Bracket | Women with Births | Births / 1,000 Women |
| 15 to 19 years | 0 (0.0%) | 0.0 |
| 20 to 34 years | 19 (100.0%) | 121.0 |
| 35 to 50 years | 0 (0.0%) | 0.0 |
| Total | 19 (100.0%) | 37.0 |
Fertility by Age by Marriage Status in Shawnee Hills
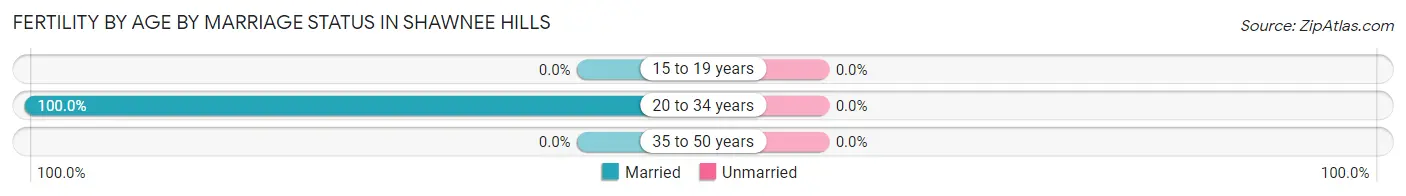
| Age Bracket | Married | Unmarried |
| 15 to 19 years | 0 (0.0%) | 0 (0.0%) |
| 20 to 34 years | 19 (100.0%) | 0 (0.0%) |
| 35 to 50 years | 0 (0.0%) | 0 (0.0%) |
| Total | 19 (100.0%) | 0 (0.0%) |
Fertility by Education in Shawnee Hills
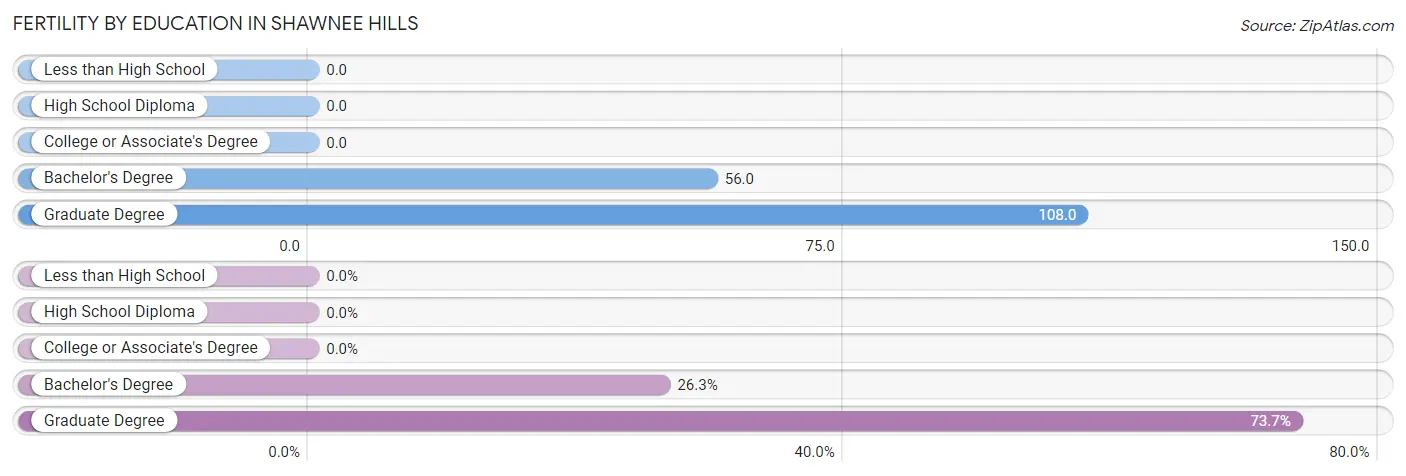
| Educational Attainment | Women with Births | Births / 1,000 Women |
| Less than High School | 0 (0.0%) | 0.0 |
| High School Diploma | 0 (0.0%) | 0.0 |
| College or Associate's Degree | 0 (0.0%) | 0.0 |
| Bachelor's Degree | 5 (26.3%) | 56.0 |
| Graduate Degree | 14 (73.7%) | 108.0 |
| Total | 19 (100.0%) | 37.0 |
Fertility by Education by Marriage Status in Shawnee Hills
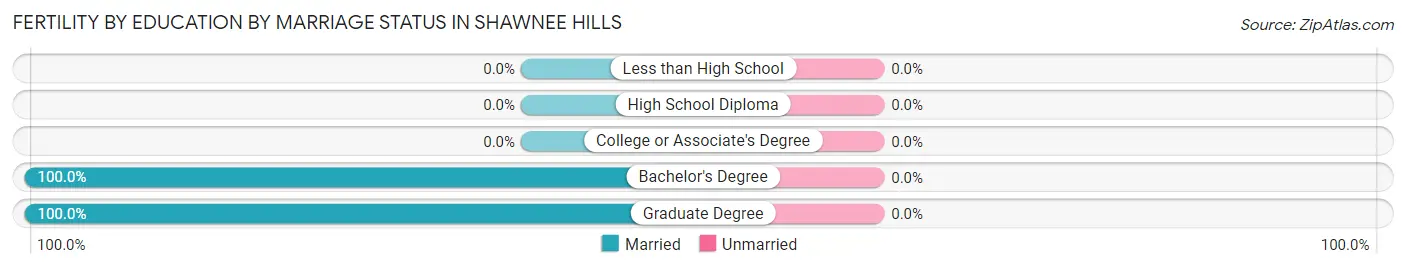
| Educational Attainment | Married | Unmarried |
| Less than High School | 0 (0.0%) | 0 (0.0%) |
| High School Diploma | 0 (0.0%) | 0 (0.0%) |
| College or Associate's Degree | 0 (0.0%) | 0 (0.0%) |
| Bachelor's Degree | 5 (100.0%) | 0 (0.0%) |
| Graduate Degree | 14 (100.0%) | 0 (0.0%) |
| Total | 19 (100.0%) | 0 (0.0%) |
Employment Characteristics in Shawnee Hills
Employment by Class of Employer in Shawnee Hills
Among the 1,269 employed individuals in Shawnee Hills, private company employees (833 | 65.6%), local government employees (267 | 21.0%), and not-for-profit organizations (61 | 4.8%) make up the most common classes of employment.
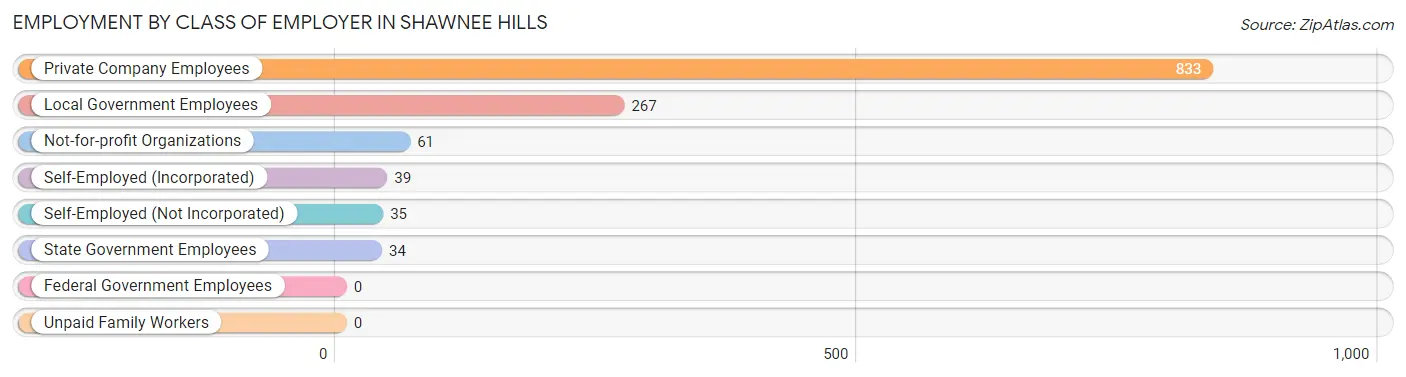
| Employer Class | # Employees | % Employees |
| Private Company Employees | 833 | 65.6% |
| Self-Employed (Incorporated) | 39 | 3.1% |
| Self-Employed (Not Incorporated) | 35 | 2.8% |
| Not-for-profit Organizations | 61 | 4.8% |
| Local Government Employees | 267 | 21.0% |
| State Government Employees | 34 | 2.7% |
| Federal Government Employees | 0 | 0.0% |
| Unpaid Family Workers | 0 | 0.0% |
| Total | 1,269 | 100.0% |
Employment Status by Age in Shawnee Hills
According to the labor force statistics for Shawnee Hills, out of the total population over 16 years of age (2,151), 70.0% or 1,506 individuals are in the labor force, with 12.9% or 194 of them unemployed. The age group with the highest labor force participation rate is 20 to 24 years, with 100.0% or 186 individuals in the labor force. Within the labor force, the 16 to 19 years age range has the highest percentage of unemployed individuals, with 62.5% or 15 of them being unemployed.
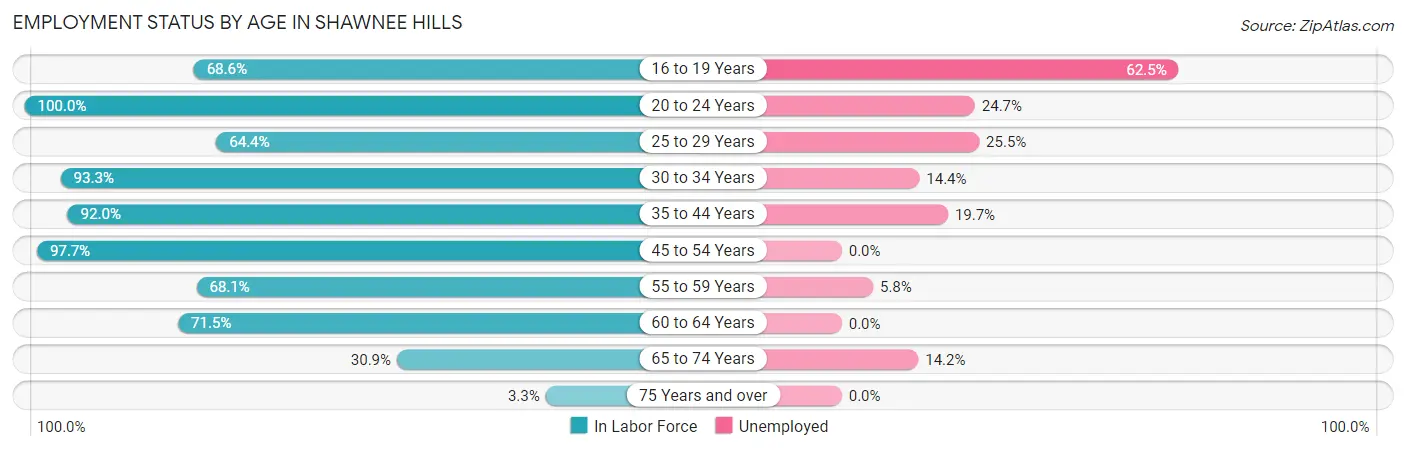
| Age Bracket | In Labor Force | Unemployed |
| 16 to 19 Years | 24 (68.6%) | 15 (62.5%) |
| 20 to 24 Years | 186 (100.0%) | 46 (24.7%) |
| 25 to 29 Years | 47 (64.4%) | 12 (25.5%) |
| 30 to 34 Years | 194 (93.3%) | 28 (14.4%) |
| 35 to 44 Years | 335 (92.0%) | 66 (19.7%) |
| 45 to 54 Years | 334 (97.7%) | 0 (0.0%) |
| 55 to 59 Years | 171 (68.1%) | 10 (5.8%) |
| 60 to 64 Years | 88 (71.5%) | 0 (0.0%) |
| 65 to 74 Years | 120 (30.9%) | 17 (14.2%) |
| 75 Years and over | 6 (3.3%) | 0 (0.0%) |
| Total | 1,506 (70.0%) | 194 (12.9%) |
Employment Status by Educational Attainment in Shawnee Hills
According to labor force statistics for Shawnee Hills, 85.9% of individuals (1,169) out of the total population between 25 and 64 years of age (1,361) are in the labor force, with 9.9% or 116 of them being unemployed. The group with the highest labor force participation rate are those with the educational attainment of less than high school, with 100.0% or 49 individuals in the labor force. Within the labor force, individuals with high school diploma education have the highest percentage of unemployment, with 19.7% or 50 of them being unemployed.
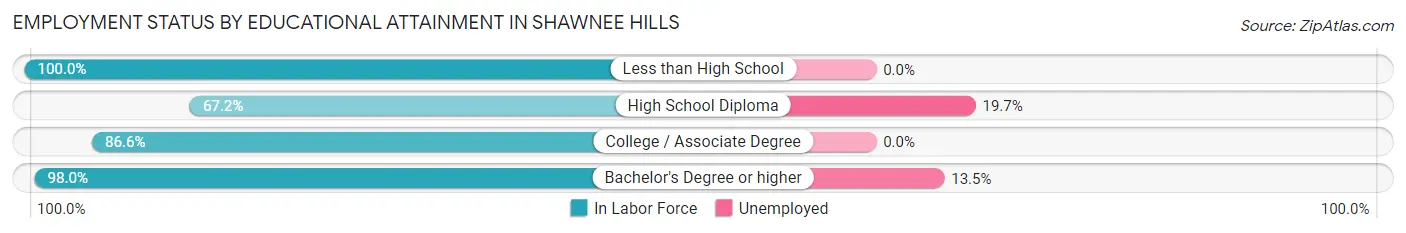
| Educational Attainment | In Labor Force | Unemployed |
| Less than High School | 49 (100.0%) | 0 (0.0%) |
| High School Diploma | 254 (67.2%) | 74 (19.7%) |
| College / Associate Degree | 376 (86.6%) | 0 (0.0%) |
| Bachelor's Degree or higher | 490 (98.0%) | 68 (13.5%) |
| Total | 1,169 (85.9%) | 135 (9.9%) |
Employment Occupations by Sex in Shawnee Hills
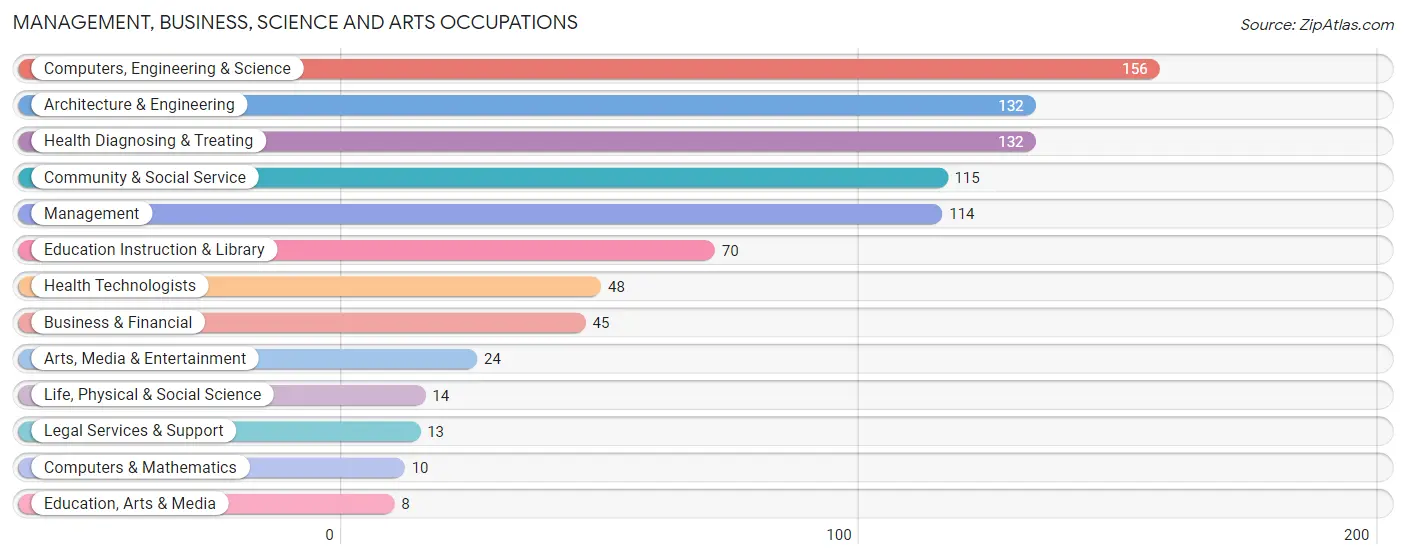
Management, Business, Science and Arts Occupations
The most common Management, Business, Science and Arts occupations in Shawnee Hills are Computers, Engineering & Science (156 | 11.9%), Architecture & Engineering (132 | 10.1%), Health Diagnosing & Treating (132 | 10.1%), Community & Social Service (115 | 8.8%), and Management (114 | 8.7%).
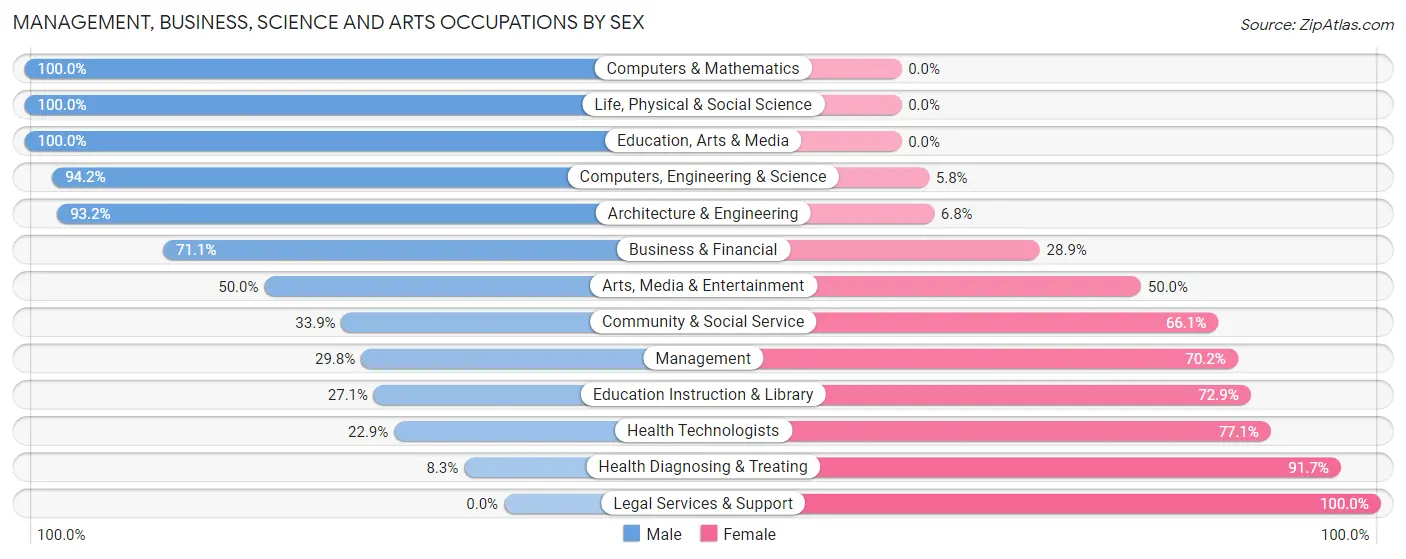
Management, Business, Science and Arts Occupations by Sex
Within the Management, Business, Science and Arts occupations in Shawnee Hills, the most male-oriented occupations are Computers & Mathematics (100.0%), Life, Physical & Social Science (100.0%), and Education, Arts & Media (100.0%), while the most female-oriented occupations are Legal Services & Support (100.0%), Health Diagnosing & Treating (91.7%), and Health Technologists (77.1%).
| Occupation | Male | Female |
| Management | 34 (29.8%) | 80 (70.2%) |
| Business & Financial | 32 (71.1%) | 13 (28.9%) |
| Computers, Engineering & Science | 147 (94.2%) | 9 (5.8%) |
| Computers & Mathematics | 10 (100.0%) | 0 (0.0%) |
| Architecture & Engineering | 123 (93.2%) | 9 (6.8%) |
| Life, Physical & Social Science | 14 (100.0%) | 0 (0.0%) |
| Community & Social Service | 39 (33.9%) | 76 (66.1%) |
| Education, Arts & Media | 8 (100.0%) | 0 (0.0%) |
| Legal Services & Support | 0 (0.0%) | 13 (100.0%) |
| Education Instruction & Library | 19 (27.1%) | 51 (72.9%) |
| Arts, Media & Entertainment | 12 (50.0%) | 12 (50.0%) |
| Health Diagnosing & Treating | 11 (8.3%) | 121 (91.7%) |
| Health Technologists | 11 (22.9%) | 37 (77.1%) |
| Total (Category) | 263 (46.8%) | 299 (53.2%) |
| Total (Overall) | 699 (53.3%) | 612 (46.7%) |
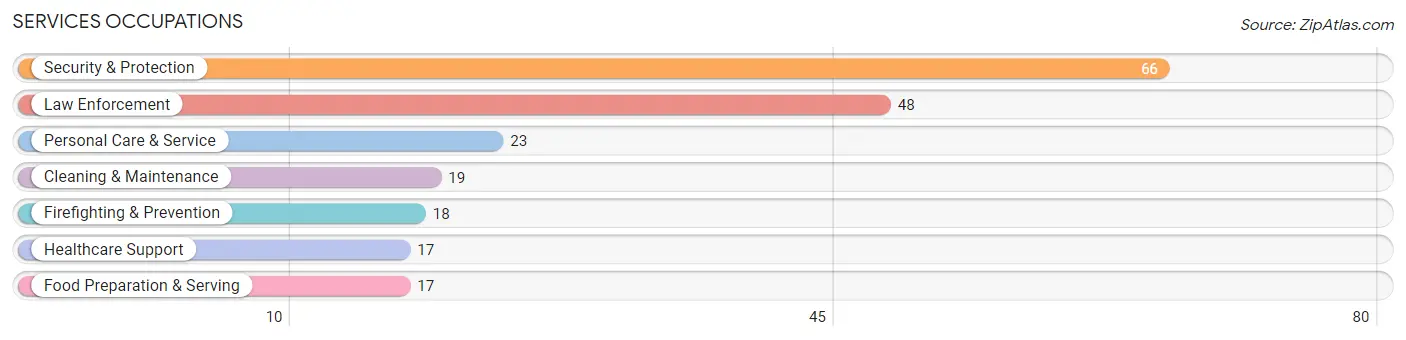
Services Occupations
The most common Services occupations in Shawnee Hills are Security & Protection (66 | 5.0%), Law Enforcement (48 | 3.7%), Personal Care & Service (23 | 1.8%), Cleaning & Maintenance (19 | 1.5%), and Firefighting & Prevention (18 | 1.4%).
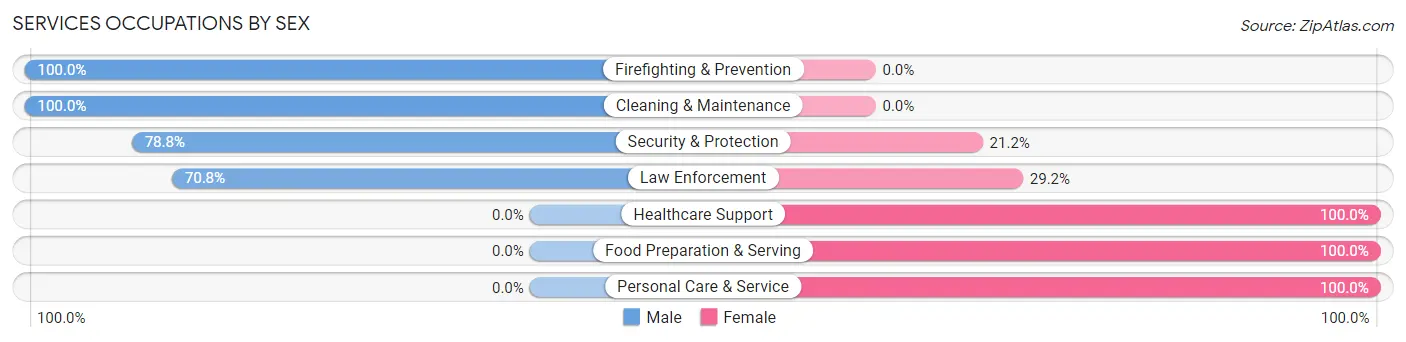
Services Occupations by Sex
Within the Services occupations in Shawnee Hills, the most male-oriented occupations are Firefighting & Prevention (100.0%), Cleaning & Maintenance (100.0%), and Security & Protection (78.8%), while the most female-oriented occupations are Healthcare Support (100.0%), Food Preparation & Serving (100.0%), and Personal Care & Service (100.0%).
| Occupation | Male | Female |
| Healthcare Support | 0 (0.0%) | 17 (100.0%) |
| Security & Protection | 52 (78.8%) | 14 (21.2%) |
| Firefighting & Prevention | 18 (100.0%) | 0 (0.0%) |
| Law Enforcement | 34 (70.8%) | 14 (29.2%) |
| Food Preparation & Serving | 0 (0.0%) | 17 (100.0%) |
| Cleaning & Maintenance | 19 (100.0%) | 0 (0.0%) |
| Personal Care & Service | 0 (0.0%) | 23 (100.0%) |
| Total (Category) | 71 (50.0%) | 71 (50.0%) |
| Total (Overall) | 699 (53.3%) | 612 (46.7%) |
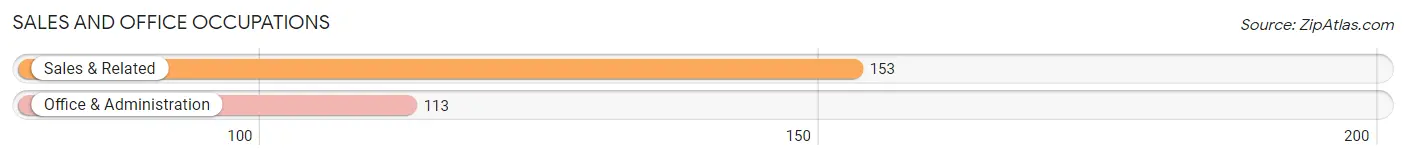
Sales and Office Occupations
The most common Sales and Office occupations in Shawnee Hills are Sales & Related (153 | 11.7%), and Office & Administration (113 | 8.6%).
Sales and Office Occupations by Sex
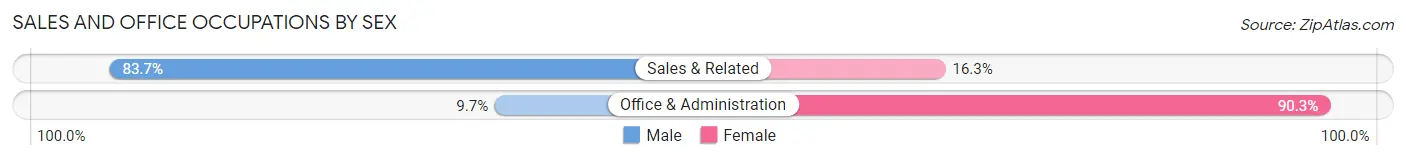
| Occupation | Male | Female |
| Sales & Related | 128 (83.7%) | 25 (16.3%) |
| Office & Administration | 11 (9.7%) | 102 (90.3%) |
| Total (Category) | 139 (52.3%) | 127 (47.7%) |
| Total (Overall) | 699 (53.3%) | 612 (46.7%) |
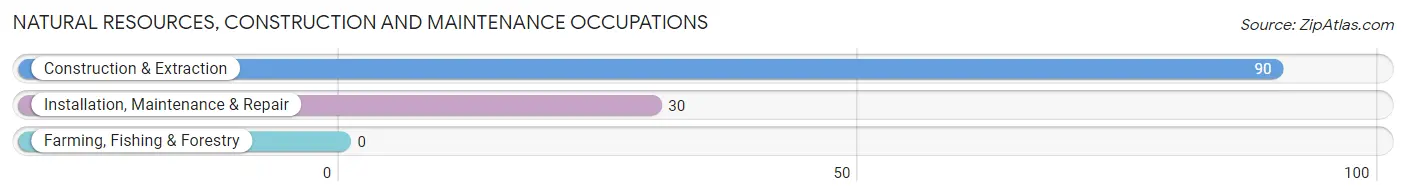
Natural Resources, Construction and Maintenance Occupations
The most common Natural Resources, Construction and Maintenance occupations in Shawnee Hills are Construction & Extraction (90 | 6.9%), and Installation, Maintenance & Repair (30 | 2.3%).
Natural Resources, Construction and Maintenance Occupations by Sex
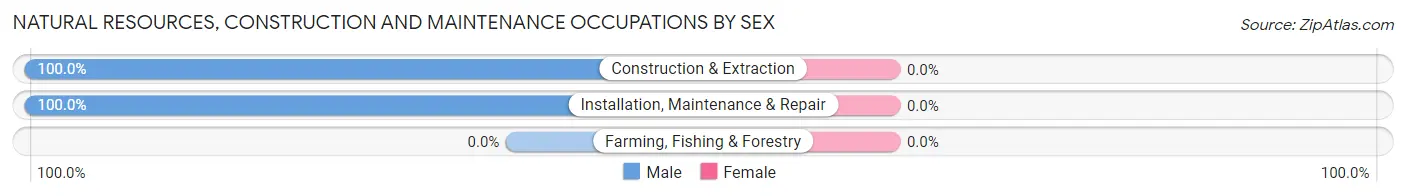
| Occupation | Male | Female |
| Farming, Fishing & Forestry | 0 (0.0%) | 0 (0.0%) |
| Construction & Extraction | 90 (100.0%) | 0 (0.0%) |
| Installation, Maintenance & Repair | 30 (100.0%) | 0 (0.0%) |
| Total (Category) | 120 (100.0%) | 0 (0.0%) |
| Total (Overall) | 699 (53.3%) | 612 (46.7%) |
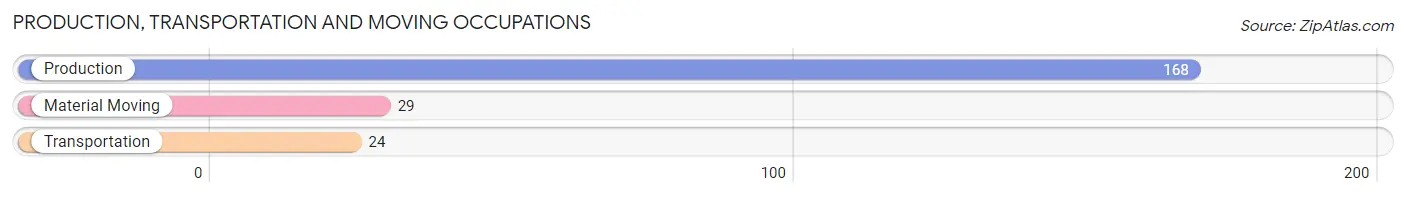
Production, Transportation and Moving Occupations
The most common Production, Transportation and Moving occupations in Shawnee Hills are Production (168 | 12.8%), Material Moving (29 | 2.2%), and Transportation (24 | 1.8%).
Production, Transportation and Moving Occupations by Sex
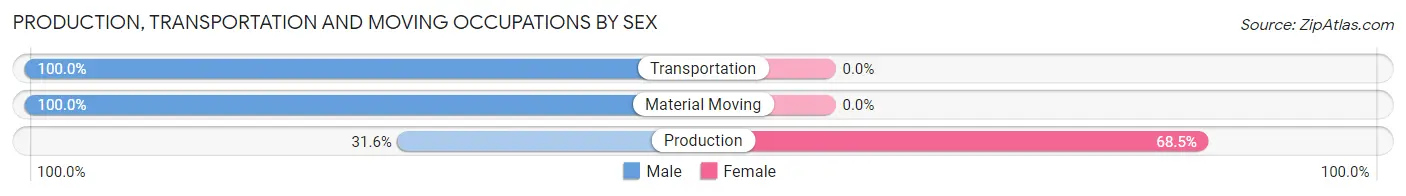
| Occupation | Male | Female |
| Production | 53 (31.6%) | 115 (68.4%) |
| Transportation | 24 (100.0%) | 0 (0.0%) |
| Material Moving | 29 (100.0%) | 0 (0.0%) |
| Total (Category) | 106 (48.0%) | 115 (52.0%) |
| Total (Overall) | 699 (53.3%) | 612 (46.7%) |
Employment Industries by Sex in Shawnee Hills
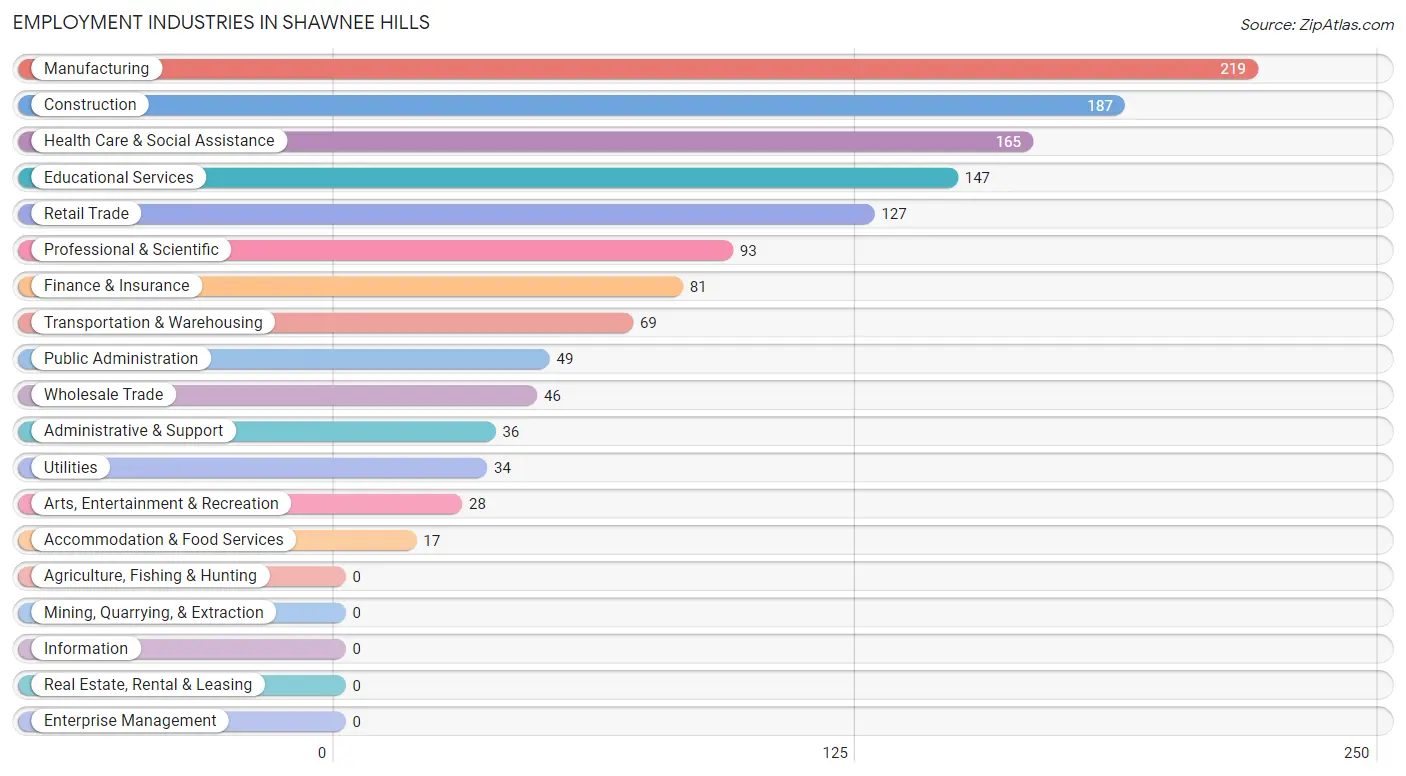
Employment Industries in Shawnee Hills
The major employment industries in Shawnee Hills include Manufacturing (219 | 16.7%), Construction (187 | 14.3%), Health Care & Social Assistance (165 | 12.6%), Educational Services (147 | 11.2%), and Retail Trade (127 | 9.7%).
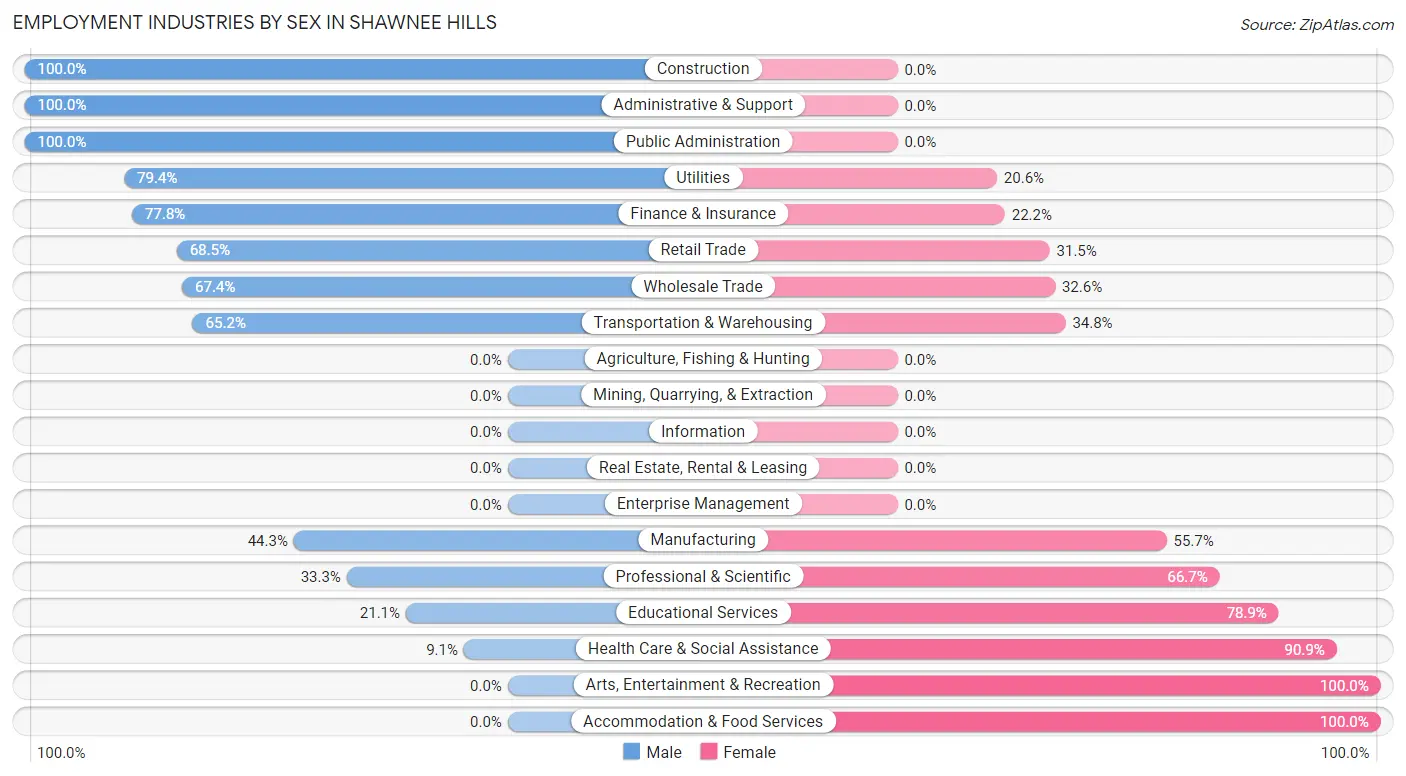
Employment Industries by Sex in Shawnee Hills
The Shawnee Hills industries that see more men than women are Construction (100.0%), Administrative & Support (100.0%), and Public Administration (100.0%), whereas the industries that tend to have a higher number of women are Arts, Entertainment & Recreation (100.0%), Accommodation & Food Services (100.0%), and Health Care & Social Assistance (90.9%).
| Industry | Male | Female |
| Agriculture, Fishing & Hunting | 0 (0.0%) | 0 (0.0%) |
| Mining, Quarrying, & Extraction | 0 (0.0%) | 0 (0.0%) |
| Construction | 187 (100.0%) | 0 (0.0%) |
| Manufacturing | 97 (44.3%) | 122 (55.7%) |
| Wholesale Trade | 31 (67.4%) | 15 (32.6%) |
| Retail Trade | 87 (68.5%) | 40 (31.5%) |
| Transportation & Warehousing | 45 (65.2%) | 24 (34.8%) |
| Utilities | 27 (79.4%) | 7 (20.6%) |
| Information | 0 (0.0%) | 0 (0.0%) |
| Finance & Insurance | 63 (77.8%) | 18 (22.2%) |
| Real Estate, Rental & Leasing | 0 (0.0%) | 0 (0.0%) |
| Professional & Scientific | 31 (33.3%) | 62 (66.7%) |
| Enterprise Management | 0 (0.0%) | 0 (0.0%) |
| Administrative & Support | 36 (100.0%) | 0 (0.0%) |
| Educational Services | 31 (21.1%) | 116 (78.9%) |
| Health Care & Social Assistance | 15 (9.1%) | 150 (90.9%) |
| Arts, Entertainment & Recreation | 0 (0.0%) | 28 (100.0%) |
| Accommodation & Food Services | 0 (0.0%) | 17 (100.0%) |
| Public Administration | 49 (100.0%) | 0 (0.0%) |
| Total | 699 (53.3%) | 612 (46.7%) |
Education in Shawnee Hills
School Enrollment in Shawnee Hills
The most common levels of schooling among the 539 students in Shawnee Hills are elementary school (124 | 23.0%), middle school (99 | 18.4%), and graduate / professional (98 | 18.2%).
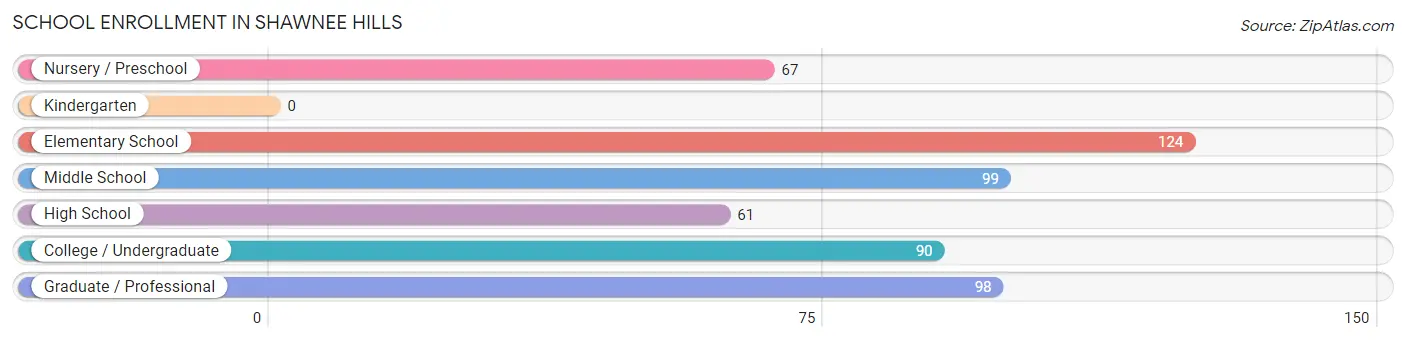
| School Level | # Students | % Students |
| Nursery / Preschool | 67 | 12.4% |
| Kindergarten | 0 | 0.0% |
| Elementary School | 124 | 23.0% |
| Middle School | 99 | 18.4% |
| High School | 61 | 11.3% |
| College / Undergraduate | 90 | 16.7% |
| Graduate / Professional | 98 | 18.2% |
| Total | 539 | 100.0% |
School Enrollment by Age by Funding Source in Shawnee Hills
Out of a total of 539 students who are enrolled in schools in Shawnee Hills, 109 (20.2%) attend a private institution, while the remaining 430 (79.8%) are enrolled in public schools. The age group of 15 to 17 year olds has the highest likelihood of being enrolled in private schools, with 18 (54.5% in the age bracket) enrolled. Conversely, the age group of 18 to 19 year olds has the lowest likelihood of being enrolled in a private school, with 21 (100.0% in the age bracket) attending a public institution.
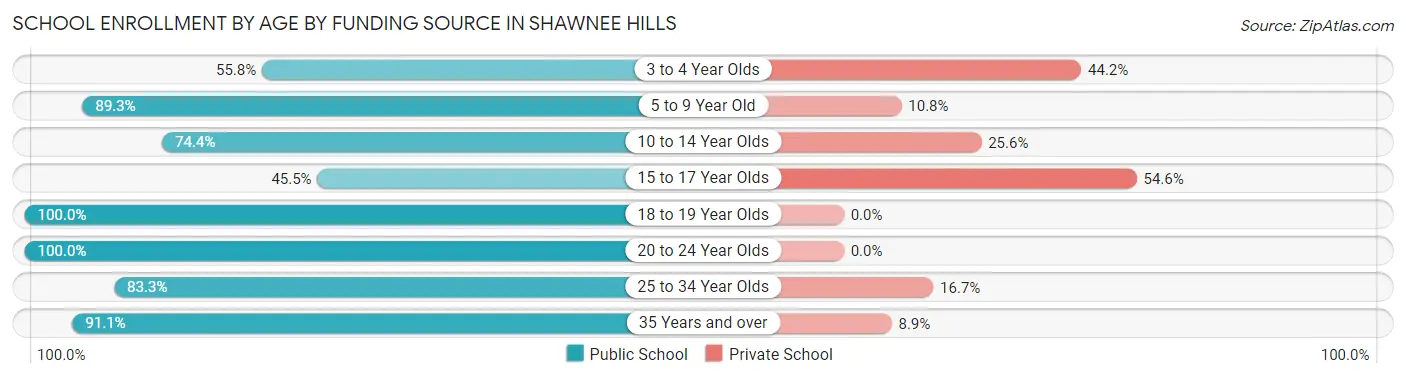
| Age Bracket | Public School | Private School |
| 3 to 4 Year Olds | 29 (55.8%) | 23 (44.2%) |
| 5 to 9 Year Old | 83 (89.2%) | 10 (10.7%) |
| 10 to 14 Year Olds | 119 (74.4%) | 41 (25.6%) |
| 15 to 17 Year Olds | 15 (45.5%) | 18 (54.5%) |
| 18 to 19 Year Olds | 21 (100.0%) | 0 (0.0%) |
| 20 to 24 Year Olds | 31 (100.0%) | 0 (0.0%) |
| 25 to 34 Year Olds | 40 (83.3%) | 8 (16.7%) |
| 35 Years and over | 92 (91.1%) | 9 (8.9%) |
| Total | 430 (79.8%) | 109 (20.2%) |
Educational Attainment by Field of Study in Shawnee Hills
Education (199 | 28.5%), engineering (187 | 26.8%), business (84 | 12.0%), bio, nature & agricultural (48 | 6.9%), and science & technology (45 | 6.5%) are the most common fields of study among 697 individuals in Shawnee Hills who have obtained a bachelor's degree or higher.
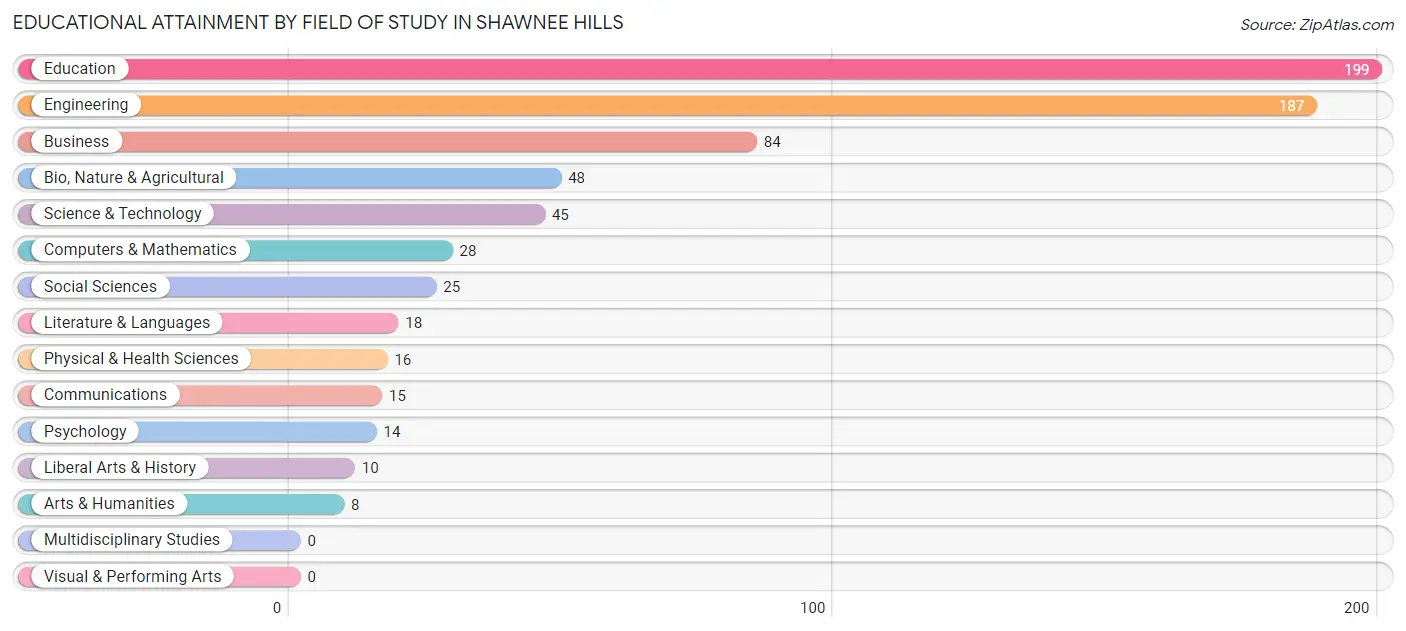
| Field of Study | # Graduates | % Graduates |
| Computers & Mathematics | 28 | 4.0% |
| Bio, Nature & Agricultural | 48 | 6.9% |
| Physical & Health Sciences | 16 | 2.3% |
| Psychology | 14 | 2.0% |
| Social Sciences | 25 | 3.6% |
| Engineering | 187 | 26.8% |
| Multidisciplinary Studies | 0 | 0.0% |
| Science & Technology | 45 | 6.5% |
| Business | 84 | 12.0% |
| Education | 199 | 28.5% |
| Literature & Languages | 18 | 2.6% |
| Liberal Arts & History | 10 | 1.4% |
| Visual & Performing Arts | 0 | 0.0% |
| Communications | 15 | 2.1% |
| Arts & Humanities | 8 | 1.1% |
| Total | 697 | 100.0% |
Transportation & Commute in Shawnee Hills
Vehicle Availability by Sex in Shawnee Hills
The most prevalent vehicle ownership categories in Shawnee Hills are males with 2 vehicles (388, accounting for 56.8%) and females with 2 vehicles (257, making up 66.2%).
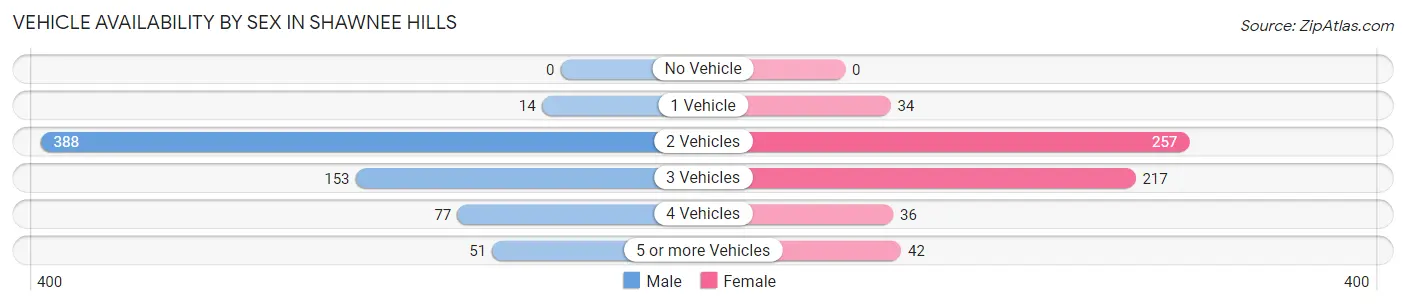
| Vehicles Available | Male | Female |
| No Vehicle | 0 (0.0%) | 0 (0.0%) |
| 1 Vehicle | 14 (2.1%) | 34 (5.8%) |
| 2 Vehicles | 388 (56.8%) | 257 (43.9%) |
| 3 Vehicles | 153 (22.4%) | 217 (37.0%) |
| 4 Vehicles | 77 (11.3%) | 36 (6.1%) |
| 5 or more Vehicles | 51 (7.5%) | 42 (7.2%) |
| Total | 683 (100.0%) | 586 (100.0%) |
Commute Time in Shawnee Hills
The most frequently occuring commute durations in Shawnee Hills are 30 to 34 minutes (326 commuters, 28.5%), 15 to 19 minutes (171 commuters, 14.9%), and 40 to 44 minutes (155 commuters, 13.5%).
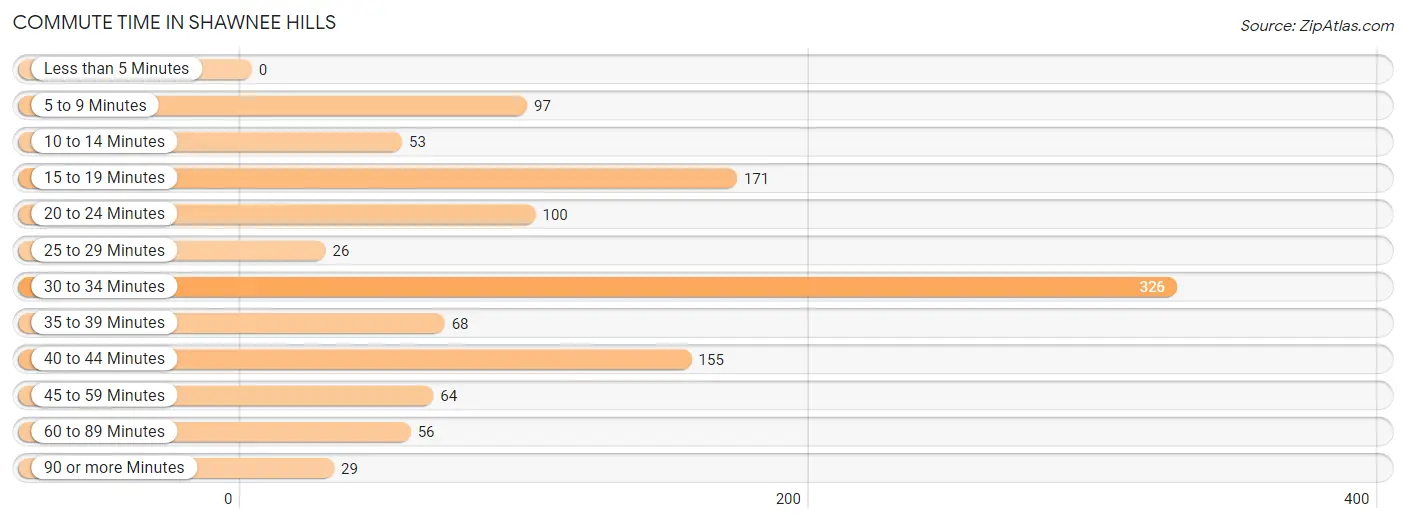
| Commute Time | # Commuters | % Commuters |
| Less than 5 Minutes | 0 | 0.0% |
| 5 to 9 Minutes | 97 | 8.5% |
| 10 to 14 Minutes | 53 | 4.6% |
| 15 to 19 Minutes | 171 | 14.9% |
| 20 to 24 Minutes | 100 | 8.7% |
| 25 to 29 Minutes | 26 | 2.3% |
| 30 to 34 Minutes | 326 | 28.5% |
| 35 to 39 Minutes | 68 | 5.9% |
| 40 to 44 Minutes | 155 | 13.5% |
| 45 to 59 Minutes | 64 | 5.6% |
| 60 to 89 Minutes | 56 | 4.9% |
| 90 or more Minutes | 29 | 2.5% |
Commute Time by Sex in Shawnee Hills
The most common commute times in Shawnee Hills are 40 to 44 minutes (114 commuters, 17.9%) for males and 30 to 34 minutes (215 commuters, 42.2%) for females.
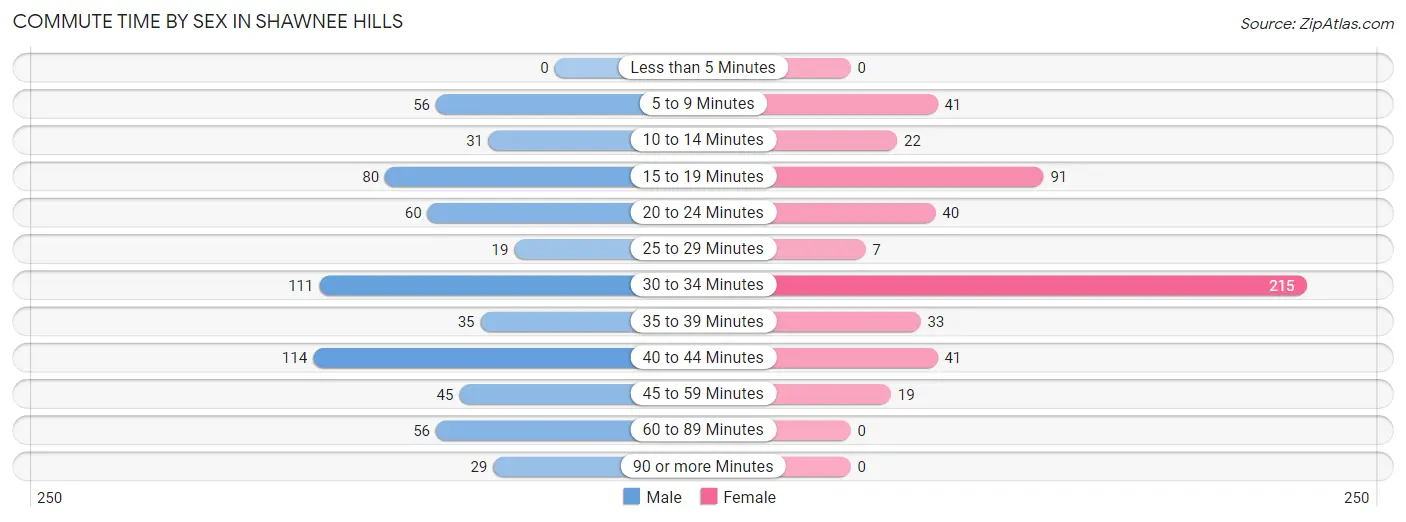
| Commute Time | Male | Female |
| Less than 5 Minutes | 0 (0.0%) | 0 (0.0%) |
| 5 to 9 Minutes | 56 (8.8%) | 41 (8.1%) |
| 10 to 14 Minutes | 31 (4.9%) | 22 (4.3%) |
| 15 to 19 Minutes | 80 (12.6%) | 91 (17.9%) |
| 20 to 24 Minutes | 60 (9.4%) | 40 (7.9%) |
| 25 to 29 Minutes | 19 (3.0%) | 7 (1.4%) |
| 30 to 34 Minutes | 111 (17.4%) | 215 (42.2%) |
| 35 to 39 Minutes | 35 (5.5%) | 33 (6.5%) |
| 40 to 44 Minutes | 114 (17.9%) | 41 (8.1%) |
| 45 to 59 Minutes | 45 (7.1%) | 19 (3.7%) |
| 60 to 89 Minutes | 56 (8.8%) | 0 (0.0%) |
| 90 or more Minutes | 29 (4.6%) | 0 (0.0%) |
Time of Departure to Work by Sex in Shawnee Hills
The most frequent times of departure to work in Shawnee Hills are 7:00 AM to 7:29 AM (200, 31.5%) for males and 7:00 AM to 7:29 AM (174, 34.2%) for females.
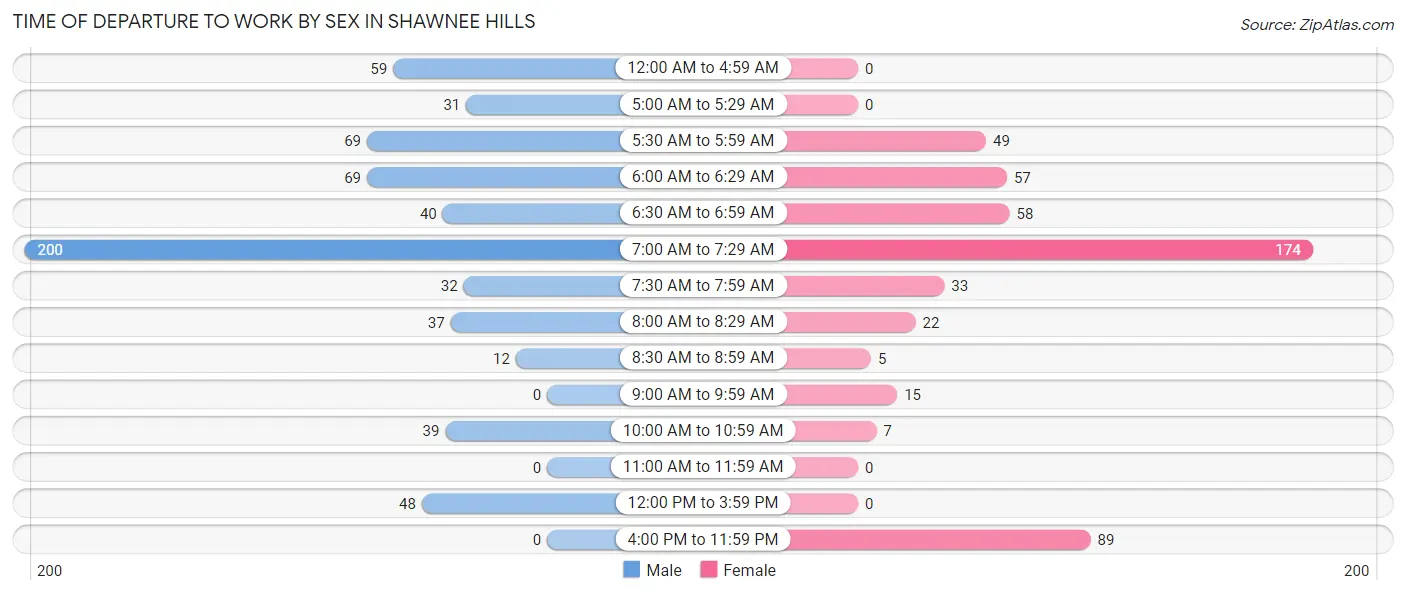
| Time of Departure | Male | Female |
| 12:00 AM to 4:59 AM | 59 (9.3%) | 0 (0.0%) |
| 5:00 AM to 5:29 AM | 31 (4.9%) | 0 (0.0%) |
| 5:30 AM to 5:59 AM | 69 (10.8%) | 49 (9.6%) |
| 6:00 AM to 6:29 AM | 69 (10.8%) | 57 (11.2%) |
| 6:30 AM to 6:59 AM | 40 (6.3%) | 58 (11.4%) |
| 7:00 AM to 7:29 AM | 200 (31.5%) | 174 (34.2%) |
| 7:30 AM to 7:59 AM | 32 (5.0%) | 33 (6.5%) |
| 8:00 AM to 8:29 AM | 37 (5.8%) | 22 (4.3%) |
| 8:30 AM to 8:59 AM | 12 (1.9%) | 5 (1.0%) |
| 9:00 AM to 9:59 AM | 0 (0.0%) | 15 (2.9%) |
| 10:00 AM to 10:59 AM | 39 (6.1%) | 7 (1.4%) |
| 11:00 AM to 11:59 AM | 0 (0.0%) | 0 (0.0%) |
| 12:00 PM to 3:59 PM | 48 (7.5%) | 0 (0.0%) |
| 4:00 PM to 11:59 PM | 0 (0.0%) | 89 (17.5%) |
| Total | 636 (100.0%) | 509 (100.0%) |
Housing Occupancy in Shawnee Hills
Occupancy by Ownership in Shawnee Hills
Of the total 1,068 dwellings in Shawnee Hills, owner-occupied units account for 1,053 (98.6%), while renter-occupied units make up 15 (1.4%).
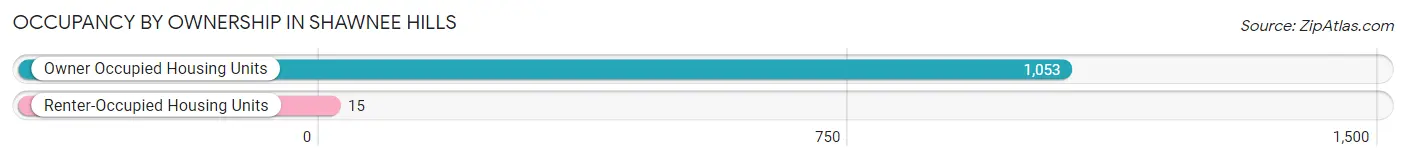
| Occupancy | # Housing Units | % Housing Units |
| Owner Occupied Housing Units | 1,053 | 98.6% |
| Renter-Occupied Housing Units | 15 | 1.4% |
| Total Occupied Housing Units | 1,068 | 100.0% |
Occupancy by Household Size in Shawnee Hills
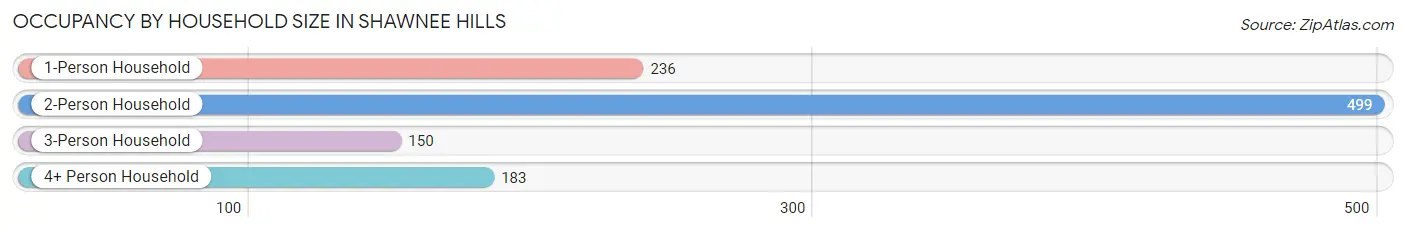
| Household Size | # Housing Units | % Housing Units |
| 1-Person Household | 236 | 22.1% |
| 2-Person Household | 499 | 46.7% |
| 3-Person Household | 150 | 14.0% |
| 4+ Person Household | 183 | 17.1% |
| Total Housing Units | 1,068 | 100.0% |
Occupancy by Ownership by Household Size in Shawnee Hills
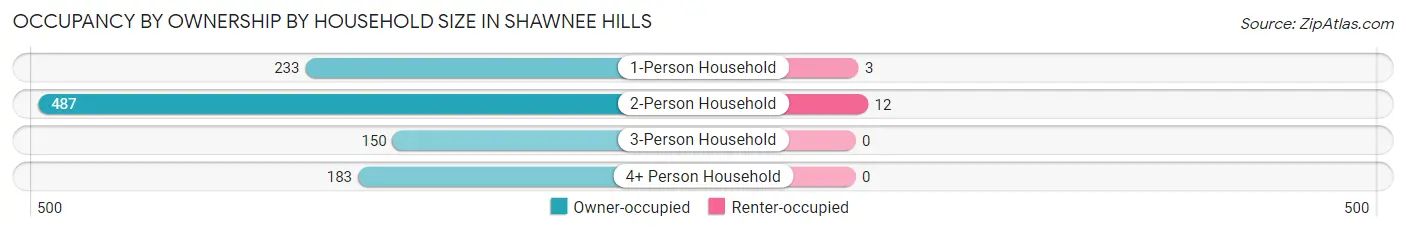
| Household Size | Owner-occupied | Renter-occupied |
| 1-Person Household | 233 (98.7%) | 3 (1.3%) |
| 2-Person Household | 487 (97.6%) | 12 (2.4%) |
| 3-Person Household | 150 (100.0%) | 0 (0.0%) |
| 4+ Person Household | 183 (100.0%) | 0 (0.0%) |
| Total Housing Units | 1,053 (98.6%) | 15 (1.4%) |
Occupancy by Educational Attainment in Shawnee Hills
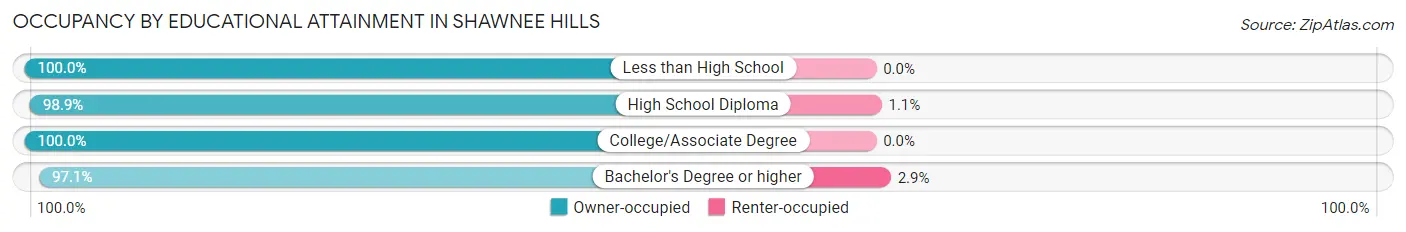
| Household Size | Owner-occupied | Renter-occupied |
| Less than High School | 49 (100.0%) | 0 (0.0%) |
| High School Diploma | 279 (98.9%) | 3 (1.1%) |
| College/Associate Degree | 321 (100.0%) | 0 (0.0%) |
| Bachelor's Degree or higher | 404 (97.1%) | 12 (2.9%) |
Occupancy by Age of Householder in Shawnee Hills
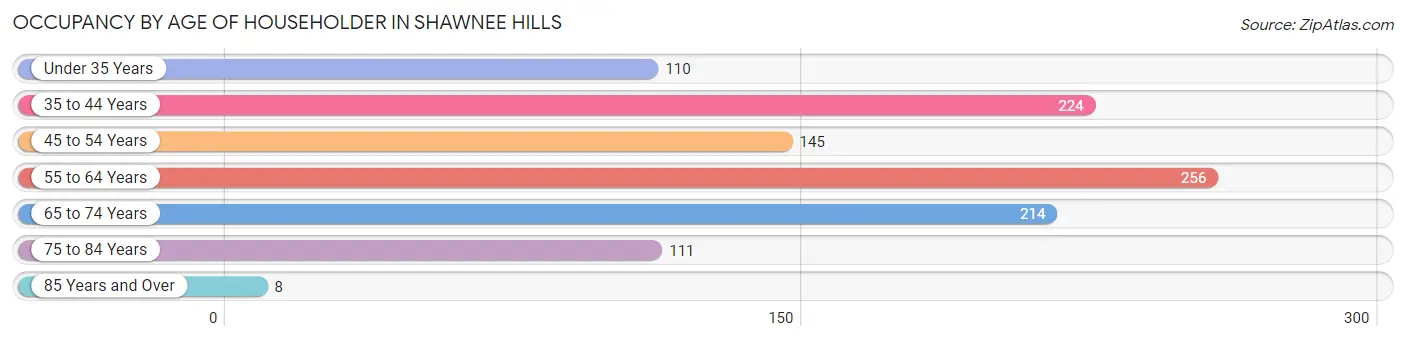
| Age Bracket | # Households | % Households |
| Under 35 Years | 110 | 10.3% |
| 35 to 44 Years | 224 | 21.0% |
| 45 to 54 Years | 145 | 13.6% |
| 55 to 64 Years | 256 | 24.0% |
| 65 to 74 Years | 214 | 20.0% |
| 75 to 84 Years | 111 | 10.4% |
| 85 Years and Over | 8 | 0.7% |
| Total | 1,068 | 100.0% |
Housing Finances in Shawnee Hills
Median Income by Occupancy in Shawnee Hills
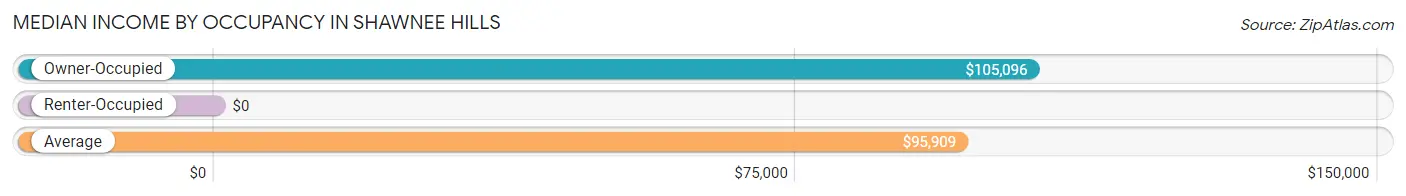
| Occupancy Type | # Households | Median Income |
| Owner-Occupied | 1,053 (98.6%) | $105,096 |
| Renter-Occupied | 15 (1.4%) | $0 |
| Average | 1,068 (100.0%) | $95,909 |
Occupancy by Householder Income Bracket in Shawnee Hills

| Income Bracket | Owner-occupied | Renter-occupied |
| Less than $5,000 | 14 (1.3%) | 0 (0.0%) |
| $5,000 to $9,999 | 0 (0.0%) | 0 (0.0%) |
| $10,000 to $14,999 | 9 (0.9%) | 0 (0.0%) |
| $15,000 to $19,999 | 0 (0.0%) | 0 (0.0%) |
| $20,000 to $24,999 | 14 (1.3%) | 0 (0.0%) |
| $25,000 to $34,999 | 126 (12.0%) | 0 (0.0%) |
| $35,000 to $49,999 | 98 (9.3%) | 0 (0.0%) |
| $50,000 to $74,999 | 140 (13.3%) | 12 (80.0%) |
| $75,000 to $99,999 | 125 (11.9%) | 3 (20.0%) |
| $100,000 to $149,999 | 288 (27.4%) | 0 (0.0%) |
| $150,000 or more | 239 (22.7%) | 0 (0.0%) |
| Total | 1,053 (100.0%) | 15 (100.0%) |
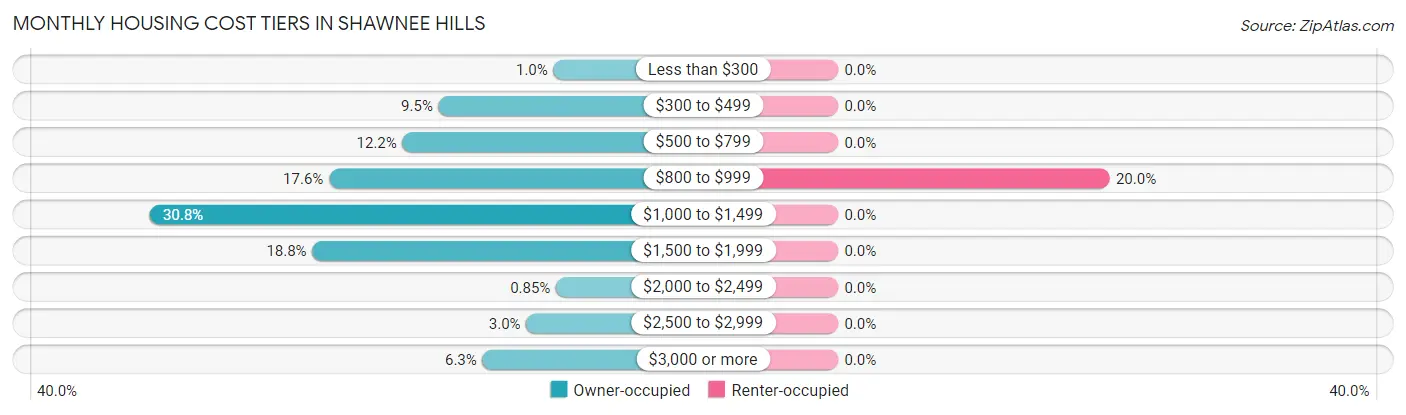
Monthly Housing Cost Tiers in Shawnee Hills
| Monthly Cost | Owner-occupied | Renter-occupied |
| Less than $300 | 11 (1.0%) | 0 (0.0%) |
| $300 to $499 | 100 (9.5%) | 0 (0.0%) |
| $500 to $799 | 128 (12.2%) | 0 (0.0%) |
| $800 to $999 | 185 (17.6%) | 3 (20.0%) |
| $1,000 to $1,499 | 324 (30.8%) | 0 (0.0%) |
| $1,500 to $1,999 | 198 (18.8%) | 0 (0.0%) |
| $2,000 to $2,499 | 9 (0.9%) | 0 (0.0%) |
| $2,500 to $2,999 | 32 (3.0%) | 0 (0.0%) |
| $3,000 or more | 66 (6.3%) | 0 (0.0%) |
| Total | 1,053 (100.0%) | 15 (100.0%) |
Physical Housing Characteristics in Shawnee Hills
Housing Structures in Shawnee Hills
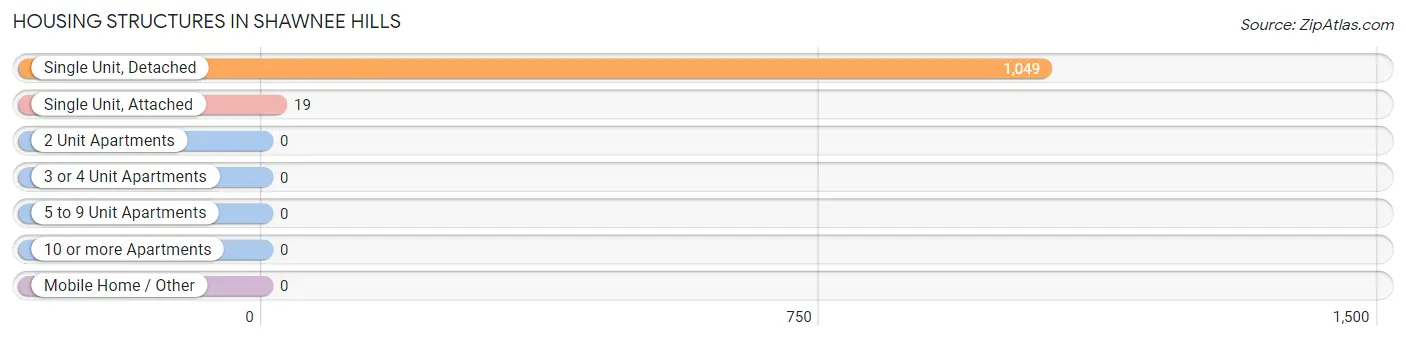
| Structure Type | # Housing Units | % Housing Units |
| Single Unit, Detached | 1,049 | 98.2% |
| Single Unit, Attached | 19 | 1.8% |
| 2 Unit Apartments | 0 | 0.0% |
| 3 or 4 Unit Apartments | 0 | 0.0% |
| 5 to 9 Unit Apartments | 0 | 0.0% |
| 10 or more Apartments | 0 | 0.0% |
| Mobile Home / Other | 0 | 0.0% |
| Total | 1,068 | 100.0% |
Housing Structures by Occupancy in Shawnee Hills
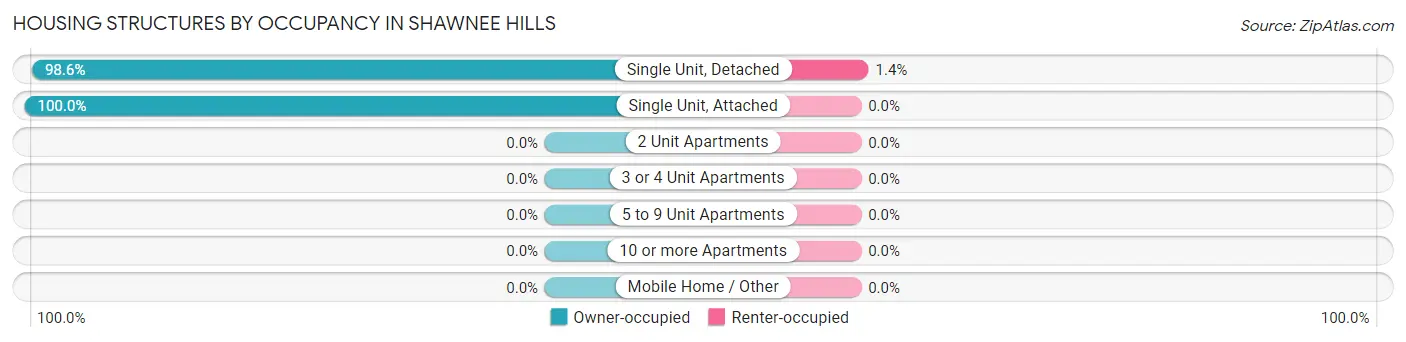
| Structure Type | Owner-occupied | Renter-occupied |
| Single Unit, Detached | 1,034 (98.6%) | 15 (1.4%) |
| Single Unit, Attached | 19 (100.0%) | 0 (0.0%) |
| 2 Unit Apartments | 0 (0.0%) | 0 (0.0%) |
| 3 or 4 Unit Apartments | 0 (0.0%) | 0 (0.0%) |
| 5 to 9 Unit Apartments | 0 (0.0%) | 0 (0.0%) |
| 10 or more Apartments | 0 (0.0%) | 0 (0.0%) |
| Mobile Home / Other | 0 (0.0%) | 0 (0.0%) |
| Total | 1,053 (98.6%) | 15 (1.4%) |
Housing Structures by Number of Rooms in Shawnee Hills
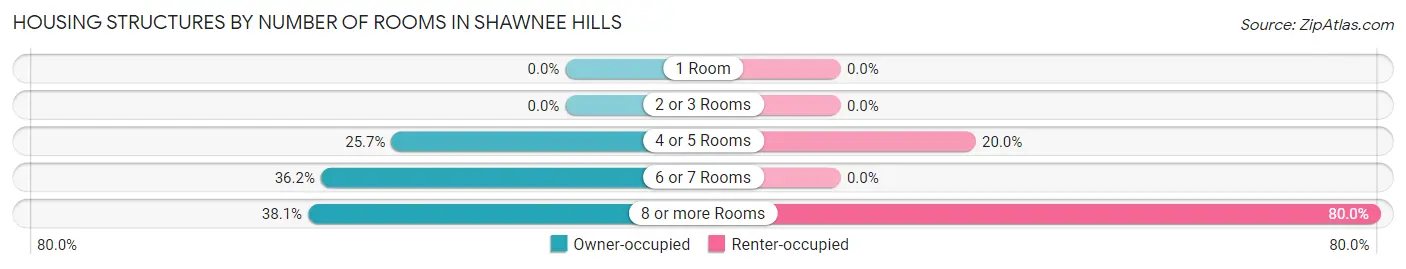
| Number of Rooms | Owner-occupied | Renter-occupied |
| 1 Room | 0 (0.0%) | 0 (0.0%) |
| 2 or 3 Rooms | 0 (0.0%) | 0 (0.0%) |
| 4 or 5 Rooms | 271 (25.7%) | 3 (20.0%) |
| 6 or 7 Rooms | 381 (36.2%) | 0 (0.0%) |
| 8 or more Rooms | 401 (38.1%) | 12 (80.0%) |
| Total | 1,053 (100.0%) | 15 (100.0%) |
Housing Structure by Heating Type in Shawnee Hills
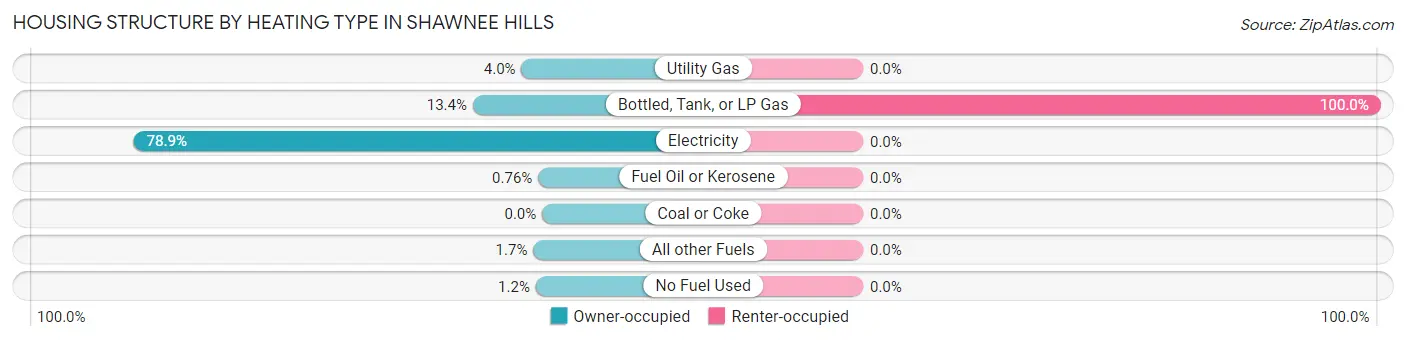
| Heating Type | Owner-occupied | Renter-occupied |
| Utility Gas | 42 (4.0%) | 0 (0.0%) |
| Bottled, Tank, or LP Gas | 141 (13.4%) | 15 (100.0%) |
| Electricity | 831 (78.9%) | 0 (0.0%) |
| Fuel Oil or Kerosene | 8 (0.8%) | 0 (0.0%) |
| Coal or Coke | 0 (0.0%) | 0 (0.0%) |
| All other Fuels | 18 (1.7%) | 0 (0.0%) |
| No Fuel Used | 13 (1.2%) | 0 (0.0%) |
| Total | 1,053 (100.0%) | 15 (100.0%) |
Household Vehicle Usage in Shawnee Hills
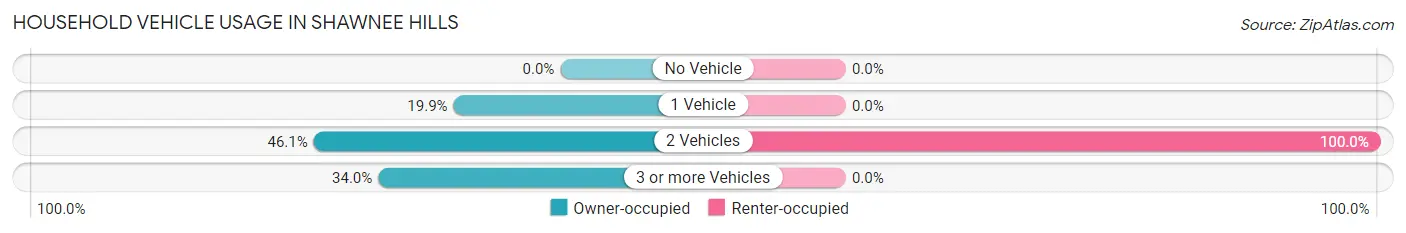
| Vehicles per Household | Owner-occupied | Renter-occupied |
| No Vehicle | 0 (0.0%) | 0 (0.0%) |
| 1 Vehicle | 210 (19.9%) | 0 (0.0%) |
| 2 Vehicles | 485 (46.1%) | 15 (100.0%) |
| 3 or more Vehicles | 358 (34.0%) | 0 (0.0%) |
| Total | 1,053 (100.0%) | 15 (100.0%) |
Real Estate & Mortgages in Shawnee Hills
Real Estate and Mortgage Overview in Shawnee Hills
| Characteristic | Without Mortgage | With Mortgage |
| Housing Units | 247 | 806 |
| Median Property Value | $166,100 | $166,700 |
| Median Household Income | $72,202 | $211 |
| Monthly Housing Costs | $536 | $66 |
| Real Estate Taxes | $2,296 | $68 |
Property Value by Mortgage Status in Shawnee Hills
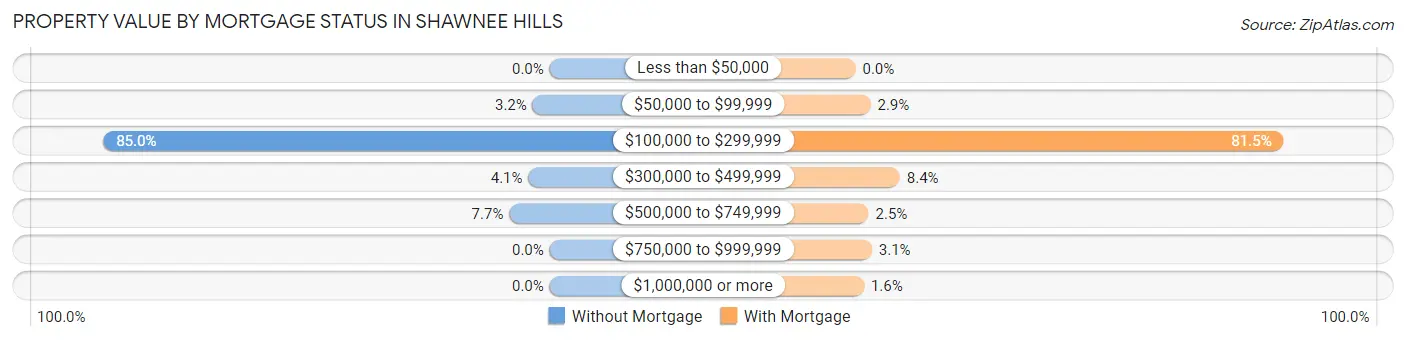
| Property Value | Without Mortgage | With Mortgage |
| Less than $50,000 | 0 (0.0%) | 0 (0.0%) |
| $50,000 to $99,999 | 8 (3.2%) | 23 (2.9%) |
| $100,000 to $299,999 | 210 (85.0%) | 657 (81.5%) |
| $300,000 to $499,999 | 10 (4.1%) | 68 (8.4%) |
| $500,000 to $749,999 | 19 (7.7%) | 20 (2.5%) |
| $750,000 to $999,999 | 0 (0.0%) | 25 (3.1%) |
| $1,000,000 or more | 0 (0.0%) | 13 (1.6%) |
| Total | 247 (100.0%) | 806 (100.0%) |
Household Income by Mortgage Status in Shawnee Hills
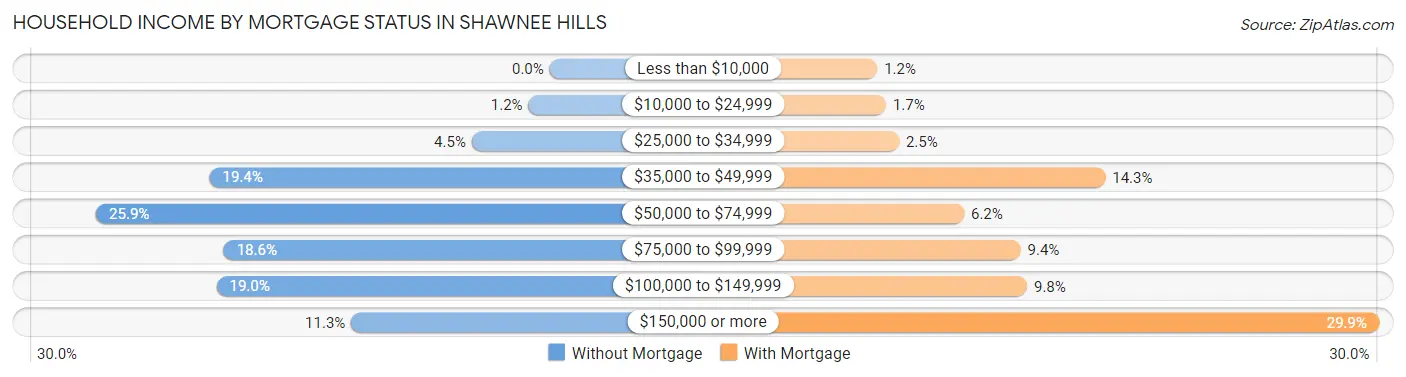
| Household Income | Without Mortgage | With Mortgage |
| Less than $10,000 | 0 (0.0%) | 10 (1.2%) |
| $10,000 to $24,999 | 3 (1.2%) | 14 (1.7%) |
| $25,000 to $34,999 | 11 (4.4%) | 20 (2.5%) |
| $35,000 to $49,999 | 48 (19.4%) | 115 (14.3%) |
| $50,000 to $74,999 | 64 (25.9%) | 50 (6.2%) |
| $75,000 to $99,999 | 46 (18.6%) | 76 (9.4%) |
| $100,000 to $149,999 | 47 (19.0%) | 79 (9.8%) |
| $150,000 or more | 28 (11.3%) | 241 (29.9%) |
| Total | 247 (100.0%) | 806 (100.0%) |
Property Value to Household Income Ratio in Shawnee Hills
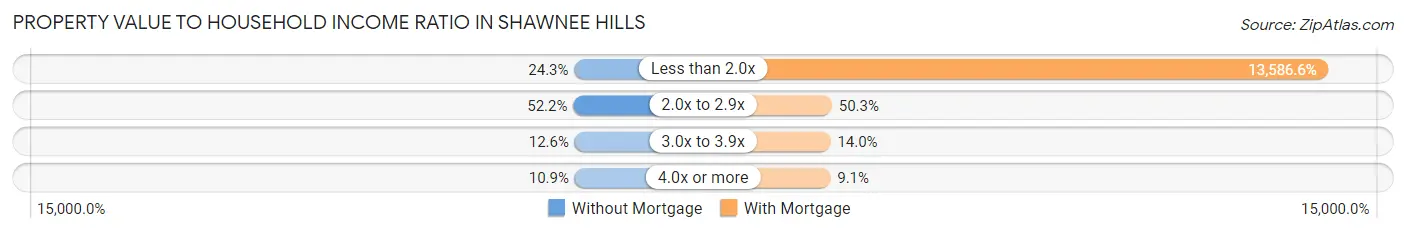
| Value-to-Income Ratio | Without Mortgage | With Mortgage |
| Less than 2.0x | 60 (24.3%) | 109,508 (13,586.6%) |
| 2.0x to 2.9x | 129 (52.2%) | 405 (50.2%) |
| 3.0x to 3.9x | 31 (12.6%) | 113 (14.0%) |
| 4.0x or more | 27 (10.9%) | 73 (9.1%) |
| Total | 247 (100.0%) | 806 (100.0%) |
Real Estate Taxes by Mortgage Status in Shawnee Hills
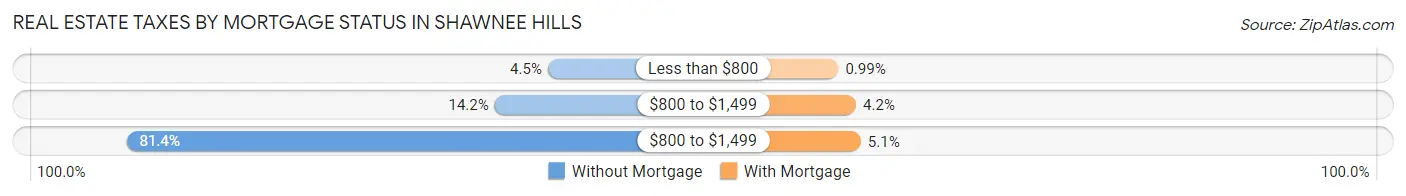
| Property Taxes | Without Mortgage | With Mortgage |
| Less than $800 | 11 (4.4%) | 8 (1.0%) |
| $800 to $1,499 | 35 (14.2%) | 34 (4.2%) |
| $800 to $1,499 | 201 (81.4%) | 41 (5.1%) |
| Total | 247 (100.0%) | 806 (100.0%) |
Health & Disability in Shawnee Hills
Health Insurance Coverage by Age in Shawnee Hills
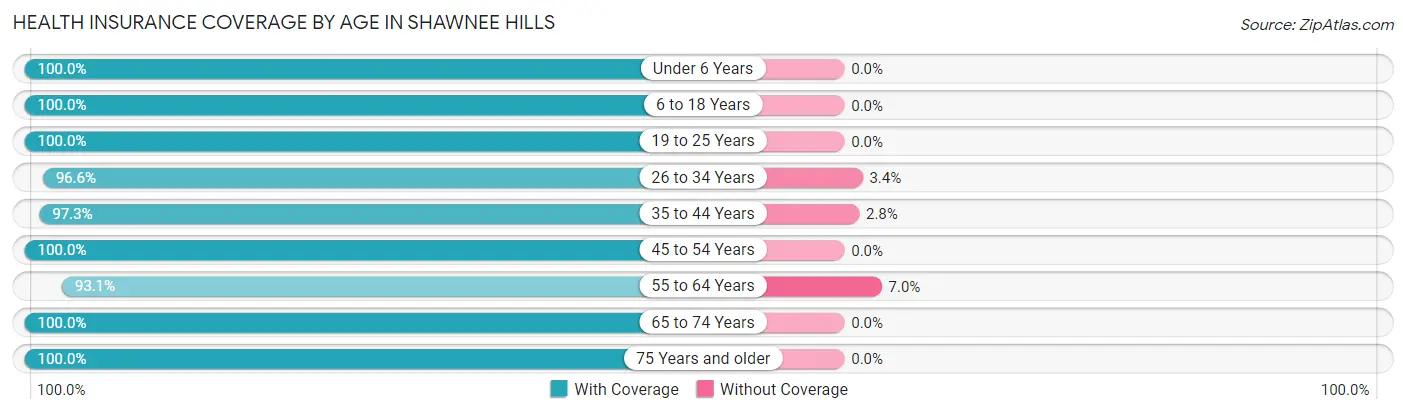
| Age Bracket | With Coverage | Without Coverage |
| Under 6 Years | 158 (100.0%) | 0 (0.0%) |
| 6 to 18 Years | 277 (100.0%) | 0 (0.0%) |
| 19 to 25 Years | 216 (100.0%) | 0 (0.0%) |
| 26 to 34 Years | 257 (96.6%) | 9 (3.4%) |
| 35 to 44 Years | 354 (97.3%) | 10 (2.8%) |
| 45 to 54 Years | 342 (100.0%) | 0 (0.0%) |
| 55 to 64 Years | 348 (93.0%) | 26 (7.0%) |
| 65 to 74 Years | 388 (100.0%) | 0 (0.0%) |
| 75 Years and older | 181 (100.0%) | 0 (0.0%) |
| Total | 2,521 (98.3%) | 45 (1.8%) |
Health Insurance Coverage by Citizenship Status in Shawnee Hills
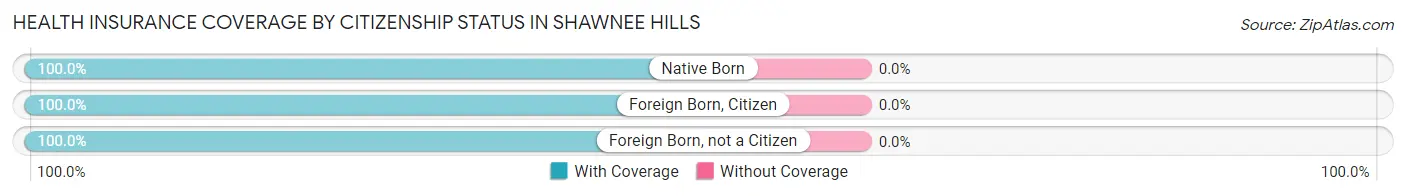
| Citizenship Status | With Coverage | Without Coverage |
| Native Born | 158 (100.0%) | 0 (0.0%) |
| Foreign Born, Citizen | 277 (100.0%) | 0 (0.0%) |
| Foreign Born, not a Citizen | 216 (100.0%) | 0 (0.0%) |
Health Insurance Coverage by Household Income in Shawnee Hills
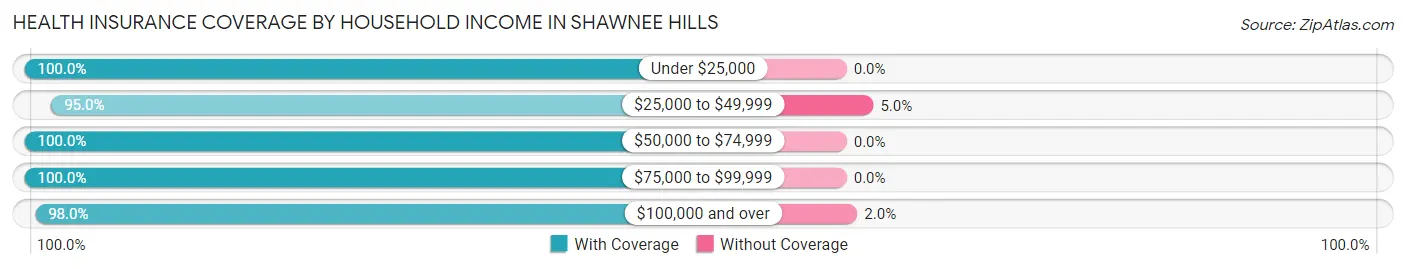
| Household Income | With Coverage | Without Coverage |
| Under $25,000 | 37 (100.0%) | 0 (0.0%) |
| $25,000 to $49,999 | 323 (95.0%) | 17 (5.0%) |
| $50,000 to $74,999 | 395 (100.0%) | 0 (0.0%) |
| $75,000 to $99,999 | 389 (100.0%) | 0 (0.0%) |
| $100,000 and over | 1,377 (98.0%) | 28 (2.0%) |
Public vs Private Health Insurance Coverage by Age in Shawnee Hills
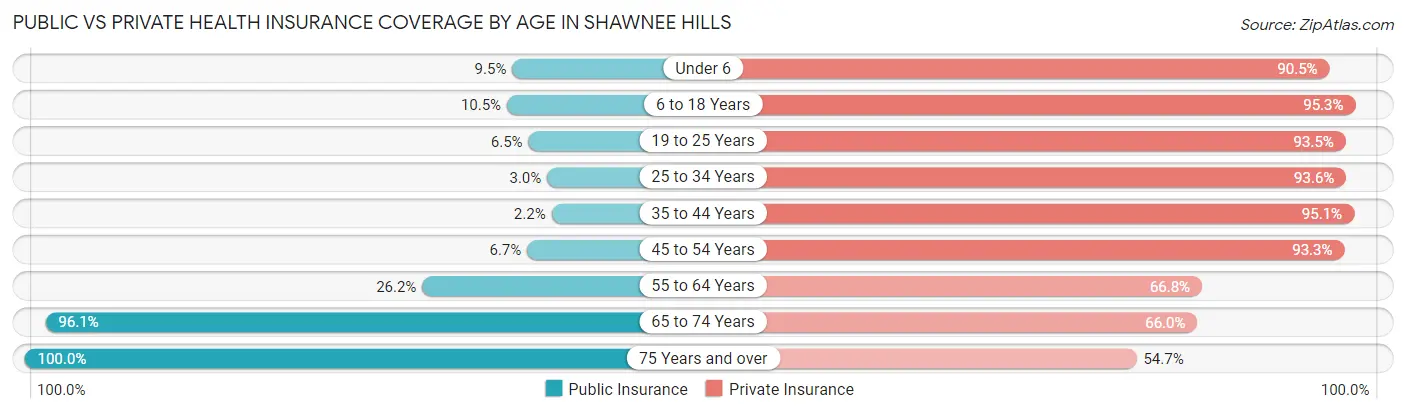
| Age Bracket | Public Insurance | Private Insurance |
| Under 6 | 15 (9.5%) | 143 (90.5%) |
| 6 to 18 Years | 29 (10.5%) | 264 (95.3%) |
| 19 to 25 Years | 14 (6.5%) | 202 (93.5%) |
| 25 to 34 Years | 8 (3.0%) | 249 (93.6%) |
| 35 to 44 Years | 8 (2.2%) | 346 (95.1%) |
| 45 to 54 Years | 23 (6.7%) | 319 (93.3%) |
| 55 to 64 Years | 98 (26.2%) | 250 (66.8%) |
| 65 to 74 Years | 373 (96.1%) | 256 (66.0%) |
| 75 Years and over | 181 (100.0%) | 99 (54.7%) |
| Total | 749 (29.2%) | 2,128 (82.9%) |
Disability Status by Sex by Age in Shawnee Hills
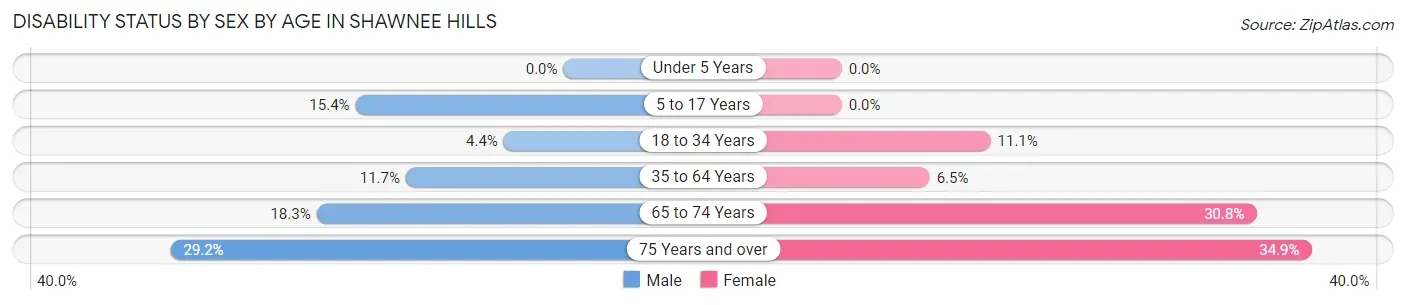
| Age Bracket | Male | Female |
| Under 5 Years | 0 (0.0%) | 0 (0.0%) |
| 5 to 17 Years | 23 (15.4%) | 0 (0.0%) |
| 18 to 34 Years | 14 (4.4%) | 19 (11.1%) |
| 35 to 64 Years | 60 (11.7%) | 37 (6.5%) |
| 65 to 74 Years | 33 (18.3%) | 64 (30.8%) |
| 75 Years and over | 21 (29.2%) | 38 (34.9%) |
Disability Class by Sex by Age in Shawnee Hills
Disability Class: Hearing Difficulty
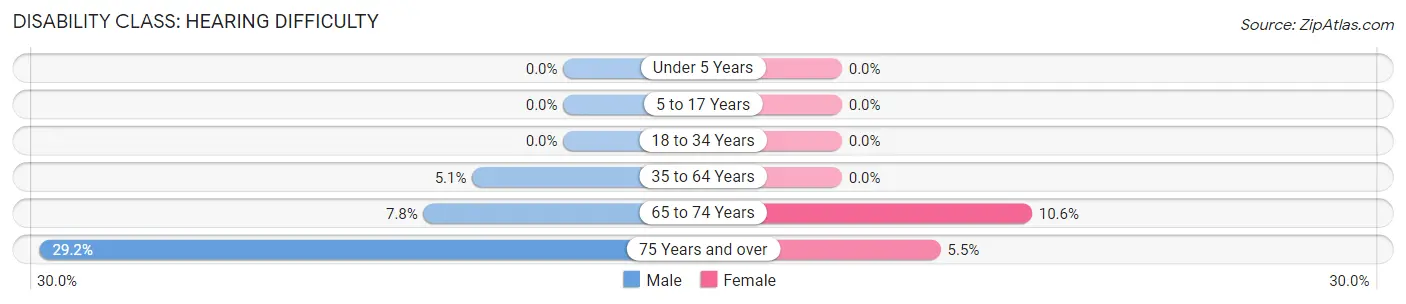
| Age Bracket | Male | Female |
| Under 5 Years | 0 (0.0%) | 0 (0.0%) |
| 5 to 17 Years | 0 (0.0%) | 0 (0.0%) |
| 18 to 34 Years | 0 (0.0%) | 0 (0.0%) |
| 35 to 64 Years | 26 (5.1%) | 0 (0.0%) |
| 65 to 74 Years | 14 (7.8%) | 22 (10.6%) |
| 75 Years and over | 21 (29.2%) | 6 (5.5%) |
Disability Class: Vision Difficulty
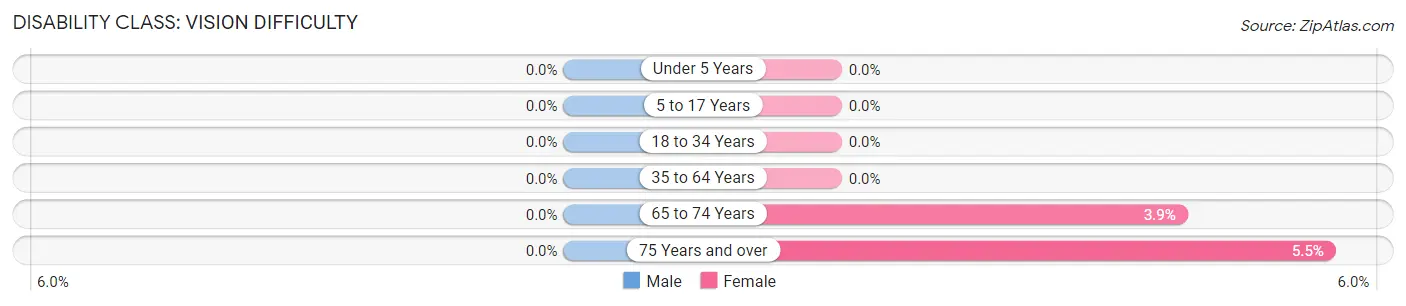
| Age Bracket | Male | Female |
| Under 5 Years | 0 (0.0%) | 0 (0.0%) |
| 5 to 17 Years | 0 (0.0%) | 0 (0.0%) |
| 18 to 34 Years | 0 (0.0%) | 0 (0.0%) |
| 35 to 64 Years | 0 (0.0%) | 0 (0.0%) |
| 65 to 74 Years | 0 (0.0%) | 8 (3.8%) |
| 75 Years and over | 0 (0.0%) | 6 (5.5%) |
Disability Class: Cognitive Difficulty
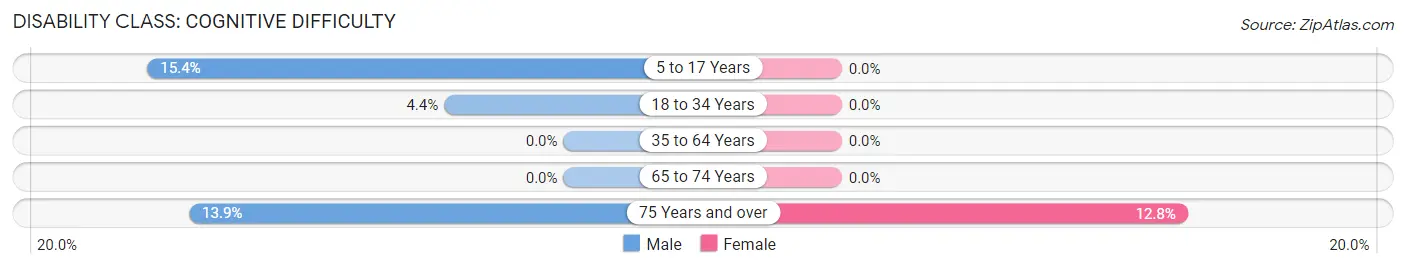
| Age Bracket | Male | Female |
| 5 to 17 Years | 23 (15.4%) | 0 (0.0%) |
| 18 to 34 Years | 14 (4.4%) | 0 (0.0%) |
| 35 to 64 Years | 0 (0.0%) | 0 (0.0%) |
| 65 to 74 Years | 0 (0.0%) | 0 (0.0%) |
| 75 Years and over | 10 (13.9%) | 14 (12.8%) |
Disability Class: Ambulatory Difficulty
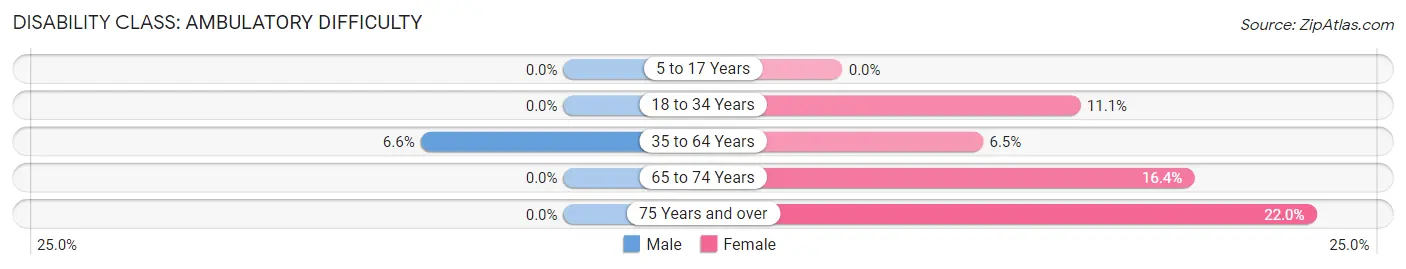
| Age Bracket | Male | Female |
| 5 to 17 Years | 0 (0.0%) | 0 (0.0%) |
| 18 to 34 Years | 0 (0.0%) | 19 (11.1%) |
| 35 to 64 Years | 34 (6.6%) | 37 (6.5%) |
| 65 to 74 Years | 0 (0.0%) | 34 (16.4%) |
| 75 Years and over | 0 (0.0%) | 24 (22.0%) |
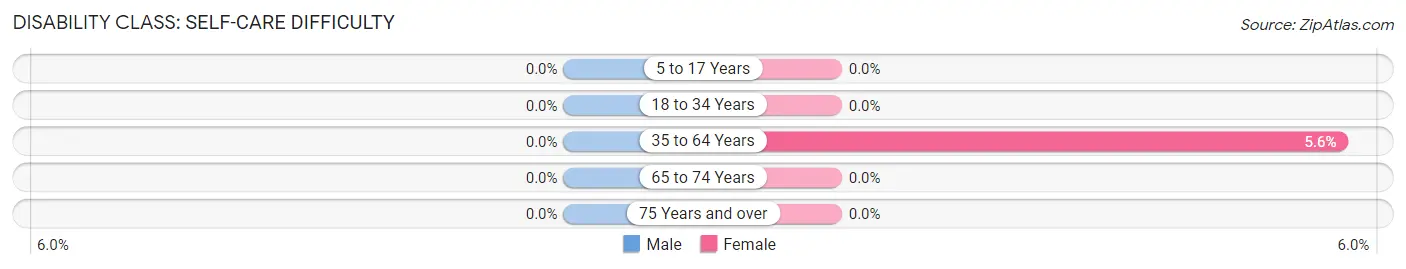
Disability Class: Self-Care Difficulty
| Age Bracket | Male | Female |
| 5 to 17 Years | 0 (0.0%) | 0 (0.0%) |
| 18 to 34 Years | 0 (0.0%) | 0 (0.0%) |
| 35 to 64 Years | 0 (0.0%) | 32 (5.6%) |
| 65 to 74 Years | 0 (0.0%) | 0 (0.0%) |
| 75 Years and over | 0 (0.0%) | 0 (0.0%) |
Technology Access in Shawnee Hills
Computing Device Access in Shawnee Hills
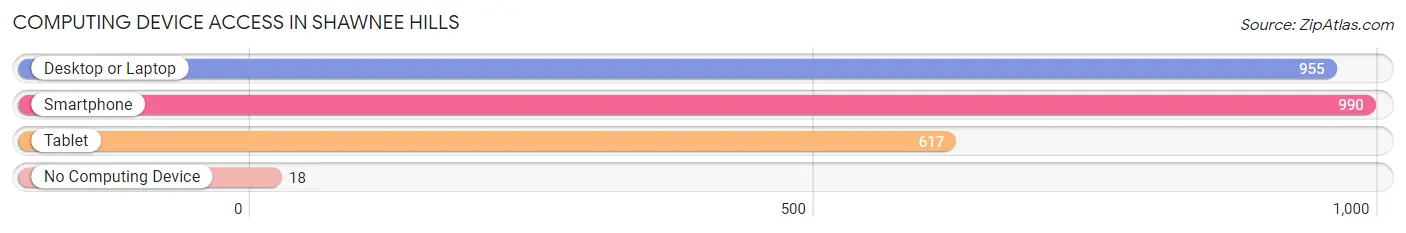
| Device Type | # Households | % Households |
| Desktop or Laptop | 955 | 89.4% |
| Smartphone | 990 | 92.7% |
| Tablet | 617 | 57.8% |
| No Computing Device | 18 | 1.7% |
| Total | 1,068 | 100.0% |
Internet Access in Shawnee Hills
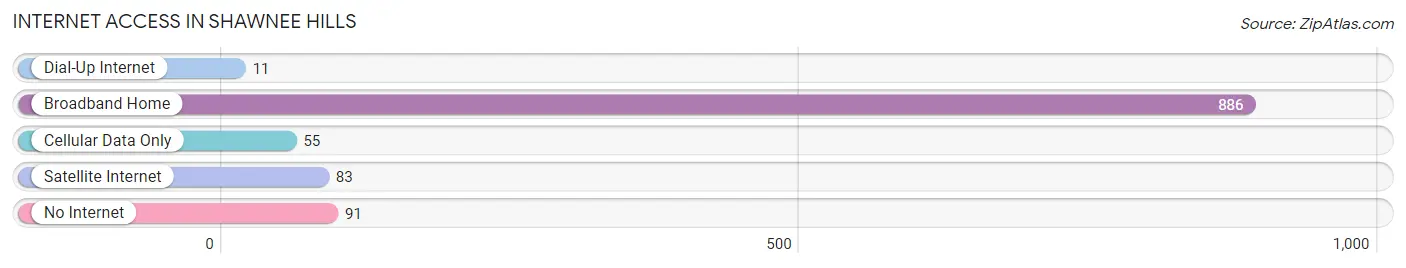
| Internet Type | # Households | % Households |
| Dial-Up Internet | 11 | 1.0% |
| Broadband Home | 886 | 83.0% |
| Cellular Data Only | 55 | 5.1% |
| Satellite Internet | 83 | 7.8% |
| No Internet | 91 | 8.5% |
| Total | 1,068 | 100.0% |
Shawnee Hills Summary
Shawnee Hills is a small village located in the southeastern corner of Ohio, in the Appalachian foothills. It is situated in the Scioto River Valley, and is part of the larger Columbus metropolitan area. The village is home to a population of just over 1,000 people, and is known for its rural charm and scenic beauty.
History
The area that is now Shawnee Hills was first settled in the early 1800s by a group of settlers from Pennsylvania. The settlers were attracted to the area by its abundant natural resources, including timber, coal, and iron ore. The village was officially founded in 1820, and was named after the Shawnee Indians who had previously inhabited the area.
In the late 1800s, the village began to grow and develop. The railroad arrived in 1887, connecting the village to the larger cities of Columbus and Cincinnati. This allowed for the development of industry and commerce in the area, and the village soon became a popular tourist destination.
In the early 1900s, the village was home to a thriving coal mining industry. The coal mines provided employment for many of the village’s residents, and the village’s population grew to over 1,000 people.
Geography
Shawnee Hills is located in the southeastern corner of Ohio, in the Appalachian foothills. The village is situated in the Scioto River Valley, and is part of the larger Columbus metropolitan area. The village is surrounded by rolling hills and lush forests, and is home to a variety of wildlife.
The village is located approximately 30 miles south of Columbus, and is accessible via Interstate 71. The village is also served by a number of local roads, including State Route 104 and State Route 664.
Economy
The economy of Shawnee Hills is largely based on tourism and agriculture. The village is home to a number of tourist attractions, including the Shawnee Hills Wildlife Area, the Shawnee Hills State Park, and the Shawnee Hills Golf Course. The village is also home to a number of farms, which produce a variety of crops, including corn, soybeans, and wheat.
In addition to tourism and agriculture, the village is also home to a number of small businesses, including restaurants, shops, and other services. The village is also home to a number of manufacturing companies, which produce a variety of products, including furniture, clothing, and electronics.
Demographics
As of the 2010 census, the population of Shawnee Hills was 1,072. The village is predominantly white, with 92.3% of the population identifying as white. The village is also home to a small African American population, with 4.2% of the population identifying as African American. The village is also home to a small Hispanic population, with 1.7% of the population identifying as Hispanic or Latino.
The median household income in Shawnee Hills is $45,938, and the median home value is $127,400. The village has a poverty rate of 11.3%, and the unemployment rate is 4.2%.
Conclusion
Shawnee Hills is a small village located in the southeastern corner of Ohio, in the Appalachian foothills. The village is home to a population of just over 1,000 people, and is known for its rural charm and scenic beauty. The village is largely supported by tourism and agriculture, and is home to a number of small businesses, manufacturing companies, and tourist attractions. The village is predominantly white, with a small African American and Hispanic population. The median household income in Shawnee Hills is $45,938, and the median home value is $127,400.
Common Questions
What is Per Capita Income in Shawnee Hills?
Per Capita income in Shawnee Hills is $45,407.
What is the Median Family Income in Shawnee Hills?
Median Family Income in Shawnee Hills is $109,844.
What is the Median Household income in Shawnee Hills?
Median Household Income in Shawnee Hills is $95,909.
What is Income or Wage Gap in Shawnee Hills?
Income or Wage Gap in Shawnee Hills is 28.1%.
Women in Shawnee Hills earn 71.9 cents for every dollar earned by a man.
What is Inequality or Gini Index in Shawnee Hills?
Inequality or Gini Index in Shawnee Hills is 0.36.
What is the Total Population of Shawnee Hills?
Total Population of Shawnee Hills is 2,566.
What is the Total Male Population of Shawnee Hills?
Total Male Population of Shawnee Hills is 1,287.
What is the Total Female Population of Shawnee Hills?
Total Female Population of Shawnee Hills is 1,279.
What is the Ratio of Males per 100 Females in Shawnee Hills?
There are 100.63 Males per 100 Females in Shawnee Hills.
What is the Ratio of Females per 100 Males in Shawnee Hills?
There are 99.38 Females per 100 Males in Shawnee Hills.
What is the Median Population Age in Shawnee Hills?
Median Population Age in Shawnee Hills is 45.2 Years.
What is the Average Family Size in Shawnee Hills
Average Family Size in Shawnee Hills is 2.8 People.
What is the Average Household Size in Shawnee Hills
Average Household Size in Shawnee Hills is 2.4 People.
How Large is the Labor Force in Shawnee Hills?
There are 1,506 People in the Labor Forcein in Shawnee Hills.
What is the Percentage of People in the Labor Force in Shawnee Hills?
70.0% of People are in the Labor Force in Shawnee Hills.
What is the Unemployment Rate in Shawnee Hills?
Unemployment Rate in Shawnee Hills is 12.9%.