Five Points, OH Map & Demographics
Five Points Map
Five Points Overview
$69,195
PER CAPITA INCOME
$152,533
AVG FAMILY INCOME
$133,603
AVG HOUSEHOLD INCOME
69.1%
WAGE / INCOME GAP [ % ]
30.9¢/ $1
WAGE / INCOME GAP [ $ ]
0.40
INEQUALITY / GINI INDEX
1,652
TOTAL POPULATION
748
MALE POPULATION
904
FEMALE POPULATION
82.74
MALES / 100 FEMALES
120.86
FEMALES / 100 MALES
44.7
MEDIAN AGE
2.8
AVG FAMILY SIZE
2.6
AVG HOUSEHOLD SIZE
745
LABOR FORCE [ PEOPLE ]
59.4%
PERCENT IN LABOR FORCE
7.6%
UNEMPLOYMENT RATE
Income in Five Points
Income Overview in Five Points
Per Capita Income in Five Points is $69,195, while median incomes of families and households are $152,533 and $133,603 respectively.
| Characteristic | Number | Measure |
| Per Capita Income | 1,652 | $69,195 |
| Median Family Income | 561 | $152,533 |
| Mean Family Income | 561 | $187,071 |
| Median Household Income | 635 | $133,603 |
| Mean Household Income | 635 | $176,129 |
| Income Deficit | 561 | $0 |
| Wage / Income Gap (%) | 1,652 | 69.15% |
| Wage / Income Gap ($) | 1,652 | 30.85¢ per $1 |
| Gini / Inequality Index | 1,652 | 0.40 |
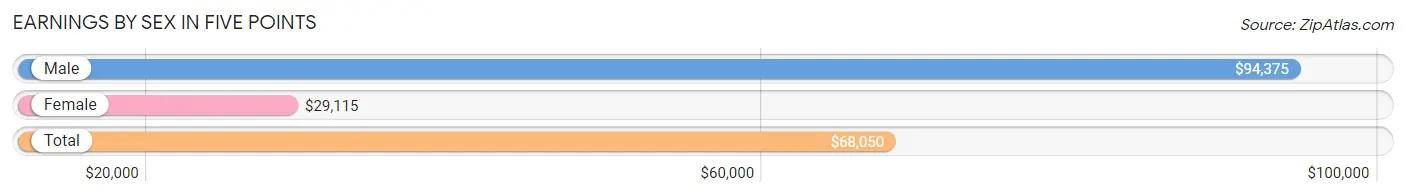
Earnings by Sex in Five Points
Average Earnings in Five Points are $68,050, $94,375 for men and $29,115 for women, a difference of 69.2%.
| Sex | Number | Average Earnings |
| Male | 406 (51.8%) | $94,375 |
| Female | 377 (48.1%) | $29,115 |
| Total | 783 (100.0%) | $68,050 |
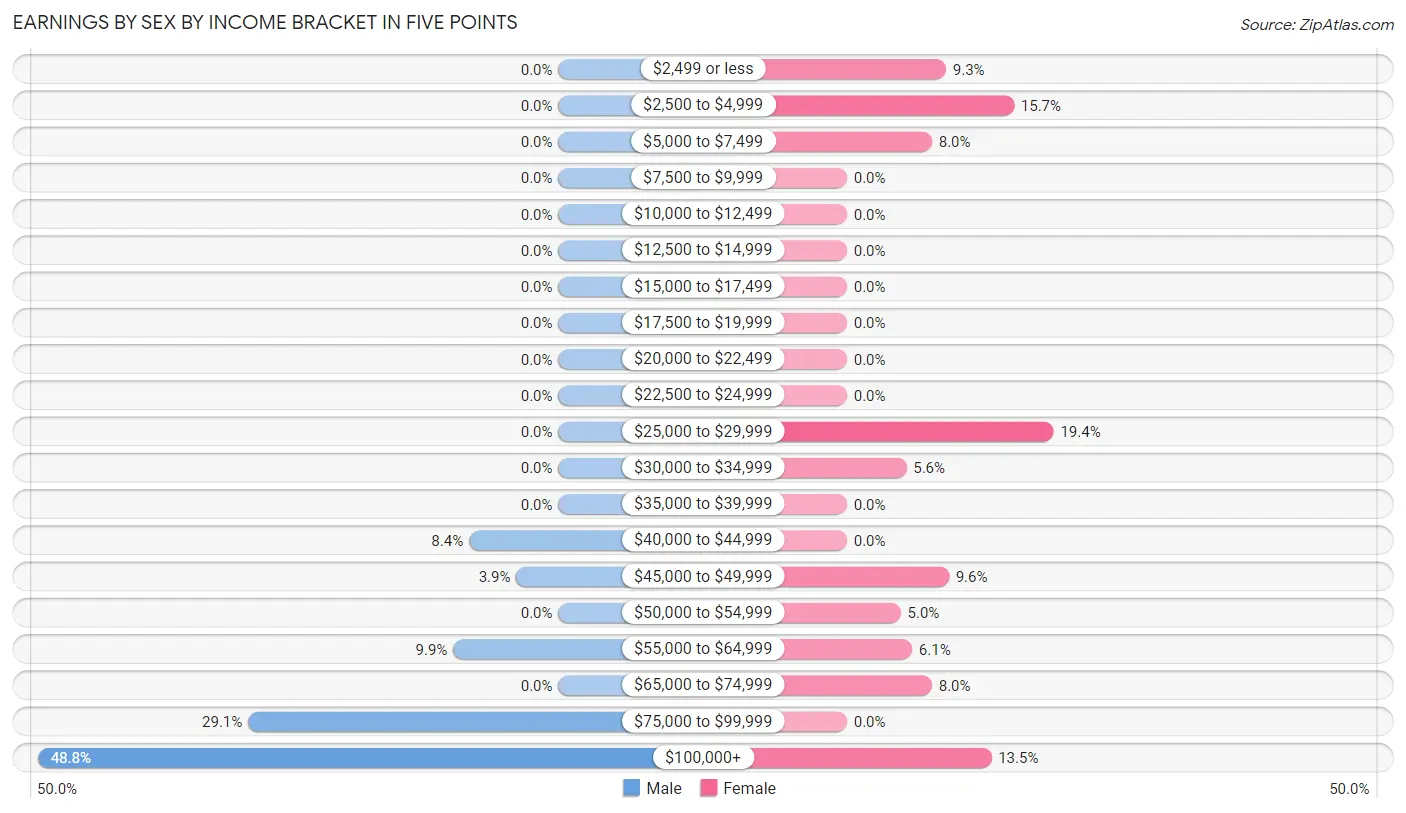
Earnings by Sex by Income Bracket in Five Points
The most common earnings brackets in Five Points are $100,000+ for men (198 | 48.8%) and $25,000 to $29,999 for women (73 | 19.4%).
| Income | Male | Female |
| $2,499 or less | 0 (0.0%) | 35 (9.3%) |
| $2,500 to $4,999 | 0 (0.0%) | 59 (15.7%) |
| $5,000 to $7,499 | 0 (0.0%) | 30 (8.0%) |
| $7,500 to $9,999 | 0 (0.0%) | 0 (0.0%) |
| $10,000 to $12,499 | 0 (0.0%) | 0 (0.0%) |
| $12,500 to $14,999 | 0 (0.0%) | 0 (0.0%) |
| $15,000 to $17,499 | 0 (0.0%) | 0 (0.0%) |
| $17,500 to $19,999 | 0 (0.0%) | 0 (0.0%) |
| $20,000 to $22,499 | 0 (0.0%) | 0 (0.0%) |
| $22,500 to $24,999 | 0 (0.0%) | 0 (0.0%) |
| $25,000 to $29,999 | 0 (0.0%) | 73 (19.4%) |
| $30,000 to $34,999 | 0 (0.0%) | 21 (5.6%) |
| $35,000 to $39,999 | 0 (0.0%) | 0 (0.0%) |
| $40,000 to $44,999 | 34 (8.4%) | 0 (0.0%) |
| $45,000 to $49,999 | 16 (3.9%) | 36 (9.6%) |
| $50,000 to $54,999 | 0 (0.0%) | 19 (5.0%) |
| $55,000 to $64,999 | 40 (9.9%) | 23 (6.1%) |
| $65,000 to $74,999 | 0 (0.0%) | 30 (8.0%) |
| $75,000 to $99,999 | 118 (29.1%) | 0 (0.0%) |
| $100,000+ | 198 (48.8%) | 51 (13.5%) |
| Total | 406 (100.0%) | 377 (100.0%) |
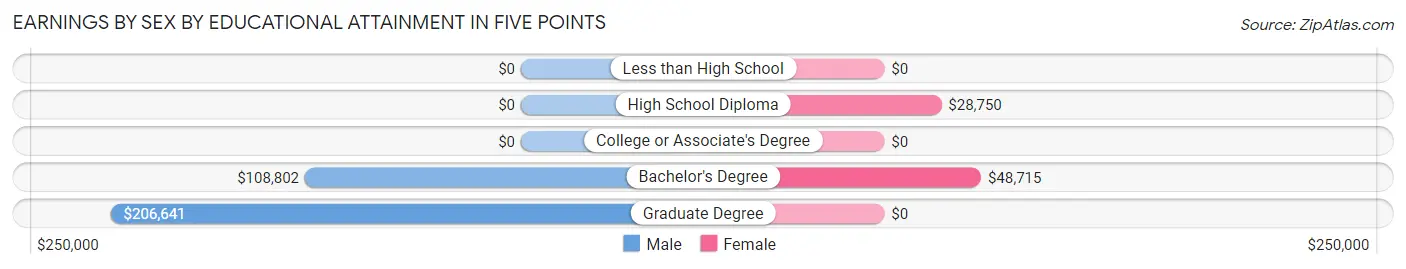
Earnings by Sex by Educational Attainment in Five Points
Average earnings in Five Points are $94,375 for men and $30,060 for women, a difference of 68.1%. Men with an educational attainment of graduate degree enjoy the highest average annual earnings of $206,641, while those with bachelor's degree education earn the least with $108,802. Women with an educational attainment of bachelor's degree earn the most with the average annual earnings of $48,715, while those with high school diploma education have the smallest earnings of $28,750.
| Educational Attainment | Male Income | Female Income |
| Less than High School | - | - |
| High School Diploma | - | - |
| College or Associate's Degree | - | - |
| Bachelor's Degree | $108,802 | $48,715 |
| Graduate Degree | $206,641 | $0 |
| Total | $94,375 | $30,060 |
Family Income in Five Points
Family Income Brackets in Five Points
According to the Five Points family income data, there are 152 families falling into the $200,000+ income range, which is the most common income bracket and makes up 27.1% of all families.
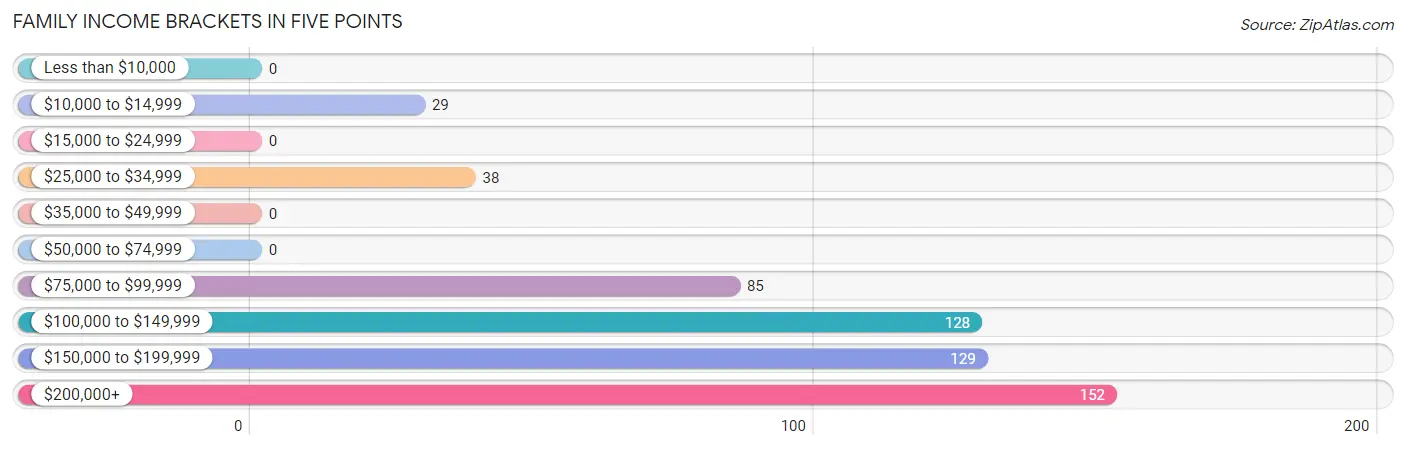
| Income Bracket | # Families | % Families |
| Less than $10,000 | 0 | 0.0% |
| $10,000 to $14,999 | 29 | 5.2% |
| $15,000 to $24,999 | 0 | 0.0% |
| $25,000 to $34,999 | 38 | 6.8% |
| $35,000 to $49,999 | 0 | 0.0% |
| $50,000 to $74,999 | 0 | 0.0% |
| $75,000 to $99,999 | 85 | 15.2% |
| $100,000 to $149,999 | 128 | 22.8% |
| $150,000 to $199,999 | 129 | 23.0% |
| $200,000+ | 152 | 27.1% |
Family Income by Famaliy Size in Five Points
2-person families (357 | 63.6%) account for the highest median family income in Five Points with $154,309 per family, while 2-person families (357 | 63.6%) have the highest median income of $77,154 per family member.
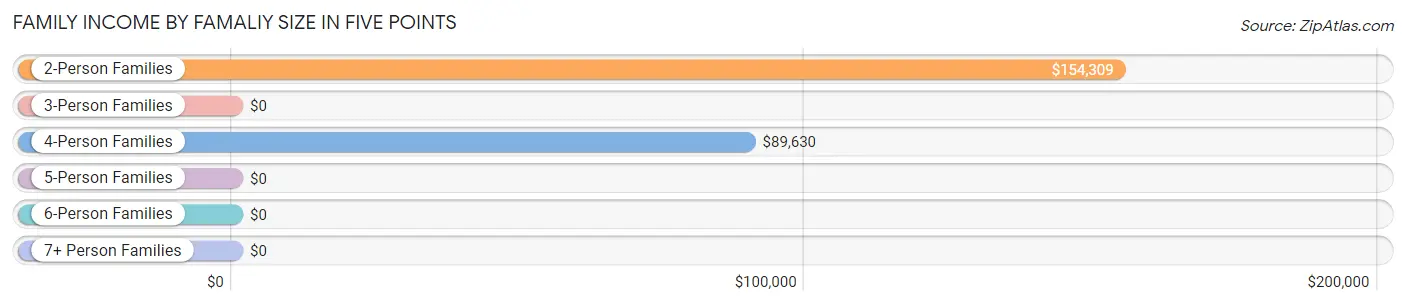
| Income Bracket | # Families | Median Income |
| 2-Person Families | 357 (63.6%) | $154,309 |
| 3-Person Families | 54 (9.6%) | $0 |
| 4-Person Families | 121 (21.6%) | $89,630 |
| 5-Person Families | 19 (3.4%) | $0 |
| 6-Person Families | 10 (1.8%) | $0 |
| 7+ Person Families | 0 (0.0%) | $0 |
| Total | 561 (100.0%) | $152,533 |
Family Income by Number of Earners in Five Points
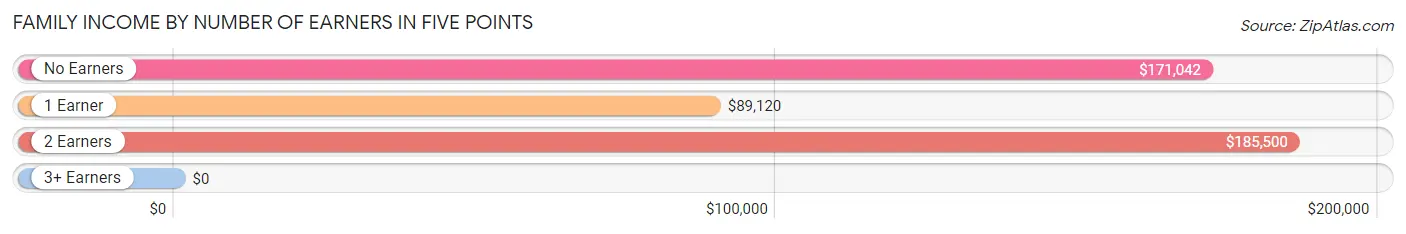
| Number of Earners | # Families | Median Income |
| No Earners | 119 (21.2%) | $171,042 |
| 1 Earner | 174 (31.0%) | $89,120 |
| 2 Earners | 268 (47.8%) | $185,500 |
| 3+ Earners | 0 (0.0%) | $0 |
| Total | 561 (100.0%) | $152,533 |
Household Income in Five Points
Household Income Brackets in Five Points
With 164 households falling in the category, the $100,000 to $149,999 income range is the most frequent in Five Points, accounting for 25.8% of all households.
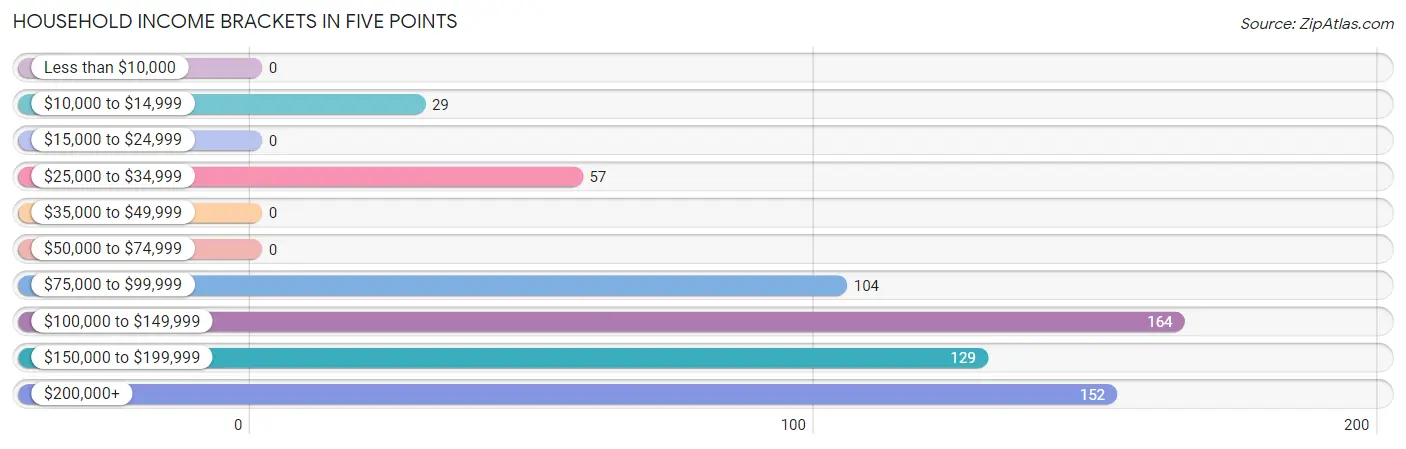
| Income Bracket | # Households | % Households |
| Less than $10,000 | 0 | 0.0% |
| $10,000 to $14,999 | 29 | 4.6% |
| $15,000 to $24,999 | 0 | 0.0% |
| $25,000 to $34,999 | 57 | 9.0% |
| $35,000 to $49,999 | 0 | 0.0% |
| $50,000 to $74,999 | 0 | 0.0% |
| $75,000 to $99,999 | 104 | 16.4% |
| $100,000 to $149,999 | 164 | 25.8% |
| $150,000 to $199,999 | 129 | 20.3% |
| $200,000+ | 152 | 23.9% |
Household Income by Householder Age in Five Points
The median household income in Five Points is $133,603, with the highest median household income of $152,993 found in the 45 to 64 years age bracket for the primary householder. A total of 187 households (29.4%) fall into this category.
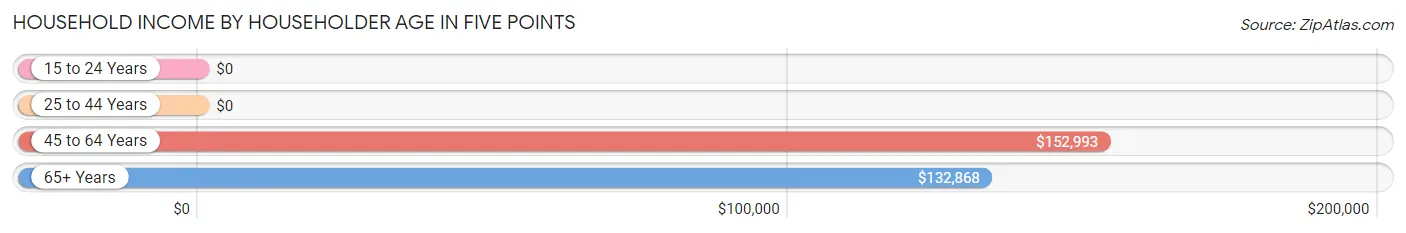
| Income Bracket | # Households | Median Income |
| 15 to 24 Years | 0 (0.0%) | $0 |
| 25 to 44 Years | 215 (33.9%) | $0 |
| 45 to 64 Years | 187 (29.4%) | $152,993 |
| 65+ Years | 233 (36.7%) | $132,868 |
| Total | 635 (100.0%) | $133,603 |
Poverty in Five Points
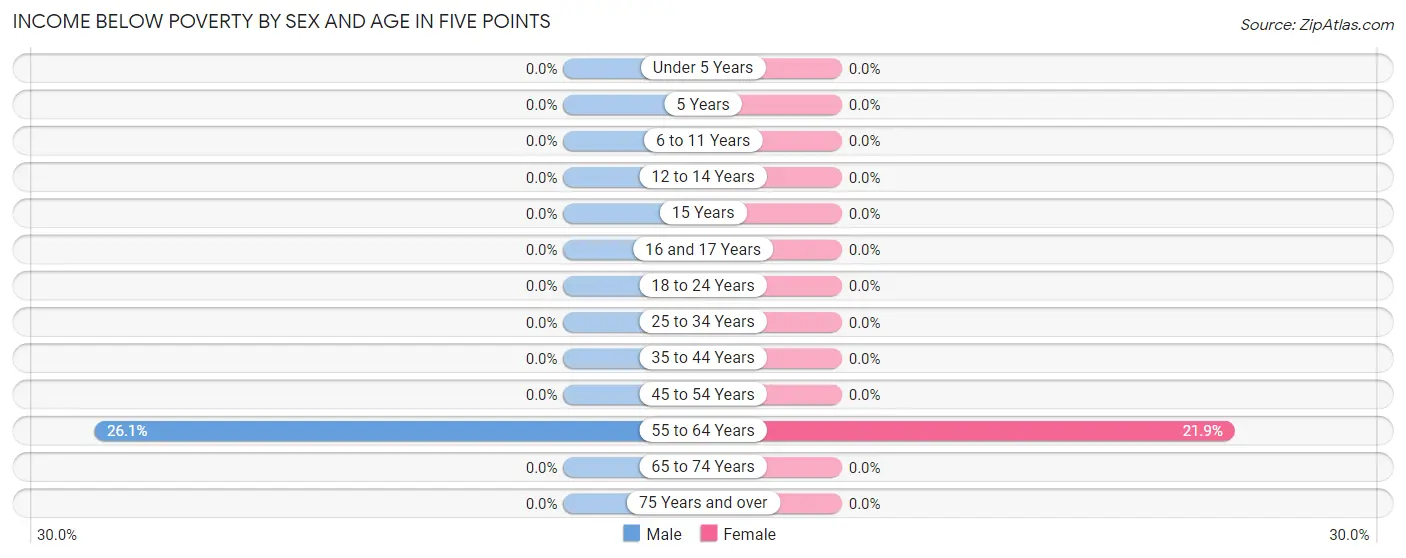
Income Below Poverty by Sex and Age in Five Points
With 3.9% poverty level for males and 3.1% for females among the residents of Five Points, 55 to 64 year old males and 55 to 64 year old females are the most vulnerable to poverty, with 29 males (26.1%) and 28 females (21.9%) in their respective age groups living below the poverty level.
| Age Bracket | Male | Female |
| Under 5 Years | 0 (0.0%) | 0 (0.0%) |
| 5 Years | 0 (0.0%) | 0 (0.0%) |
| 6 to 11 Years | 0 (0.0%) | 0 (0.0%) |
| 12 to 14 Years | 0 (0.0%) | 0 (0.0%) |
| 15 Years | 0 (0.0%) | 0 (0.0%) |
| 16 and 17 Years | 0 (0.0%) | 0 (0.0%) |
| 18 to 24 Years | 0 (0.0%) | 0 (0.0%) |
| 25 to 34 Years | 0 (0.0%) | 0 (0.0%) |
| 35 to 44 Years | 0 (0.0%) | 0 (0.0%) |
| 45 to 54 Years | 0 (0.0%) | 0 (0.0%) |
| 55 to 64 Years | 29 (26.1%) | 28 (21.9%) |
| 65 to 74 Years | 0 (0.0%) | 0 (0.0%) |
| 75 Years and over | 0 (0.0%) | 0 (0.0%) |
| Total | 29 (3.9%) | 28 (3.1%) |
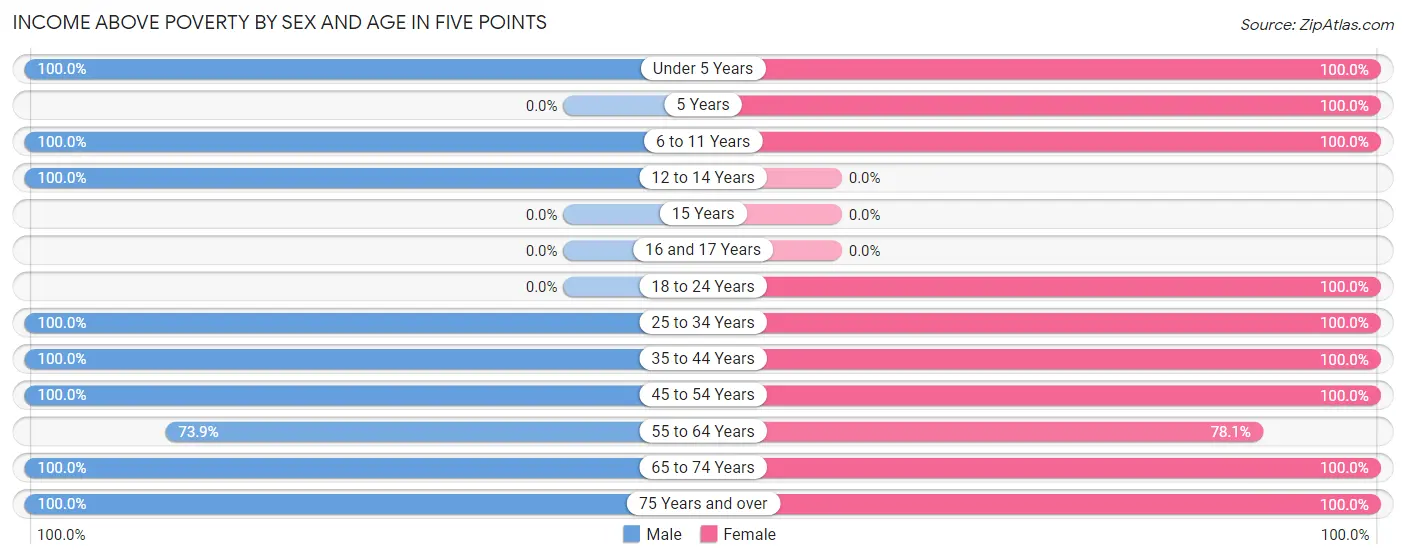
Income Above Poverty by Sex and Age in Five Points
According to the poverty statistics in Five Points, males aged under 5 years and females aged under 5 years are the age groups that are most secure financially, with 100.0% of males and 100.0% of females in these age groups living above the poverty line.
| Age Bracket | Male | Female |
| Under 5 Years | 33 (100.0%) | 169 (100.0%) |
| 5 Years | 0 (0.0%) | 22 (100.0%) |
| 6 to 11 Years | 104 (100.0%) | 48 (100.0%) |
| 12 to 14 Years | 21 (100.0%) | 0 (0.0%) |
| 15 Years | 0 (0.0%) | 0 (0.0%) |
| 16 and 17 Years | 0 (0.0%) | 0 (0.0%) |
| 18 to 24 Years | 0 (0.0%) | 18 (100.0%) |
| 25 to 34 Years | 20 (100.0%) | 89 (100.0%) |
| 35 to 44 Years | 196 (100.0%) | 122 (100.0%) |
| 45 to 54 Years | 58 (100.0%) | 86 (100.0%) |
| 55 to 64 Years | 82 (73.9%) | 100 (78.1%) |
| 65 to 74 Years | 160 (100.0%) | 146 (100.0%) |
| 75 Years and over | 45 (100.0%) | 76 (100.0%) |
| Total | 719 (96.1%) | 876 (96.9%) |
Income Below Poverty Among Married-Couple Families in Five Points
The poverty statistics for married-couple families in Five Points show that 5.3% or 29 of the total 549 families live below the poverty line. Families with no children have the highest poverty rate of 7.6%, comprising of 29 families. On the other hand, families with 1 or 2 children have the lowest poverty rate of 0.0%, which includes 0 families.
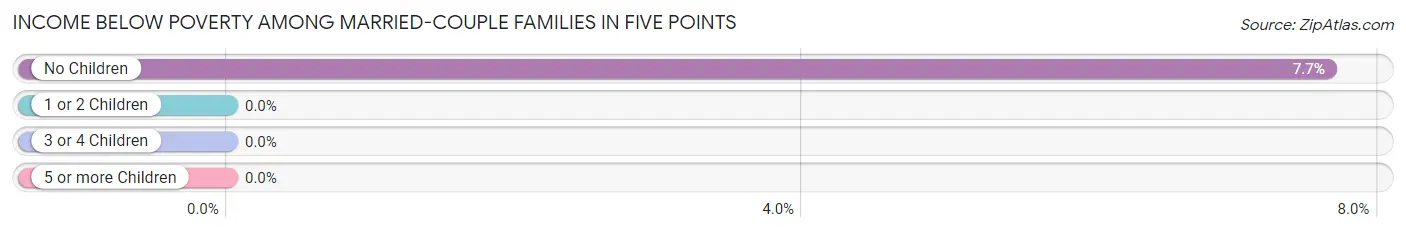
| Children | Above Poverty | Below Poverty |
| No Children | 350 (92.3%) | 29 (7.6%) |
| 1 or 2 Children | 141 (100.0%) | 0 (0.0%) |
| 3 or 4 Children | 29 (100.0%) | 0 (0.0%) |
| 5 or more Children | 0 (0.0%) | 0 (0.0%) |
| Total | 520 (94.7%) | 29 (5.3%) |
Income Below Poverty Among Single-Parent Households in Five Points
| Children | Single Father | Single Mother |
| No Children | 0 (0.0%) | 0 (0.0%) |
| 1 or 2 Children | 0 (0.0%) | 0 (0.0%) |
| 3 or 4 Children | 0 (0.0%) | 0 (0.0%) |
| 5 or more Children | 0 (0.0%) | 0 (0.0%) |
| Total | 0 (0.0%) | 0 (0.0%) |
Income Below Poverty Among Married-Couple vs Single-Parent Households in Five Points
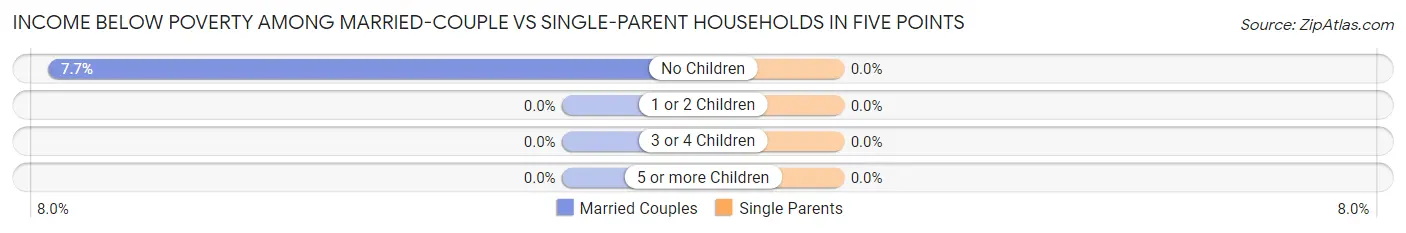
| Children | Married-Couple Families | Single-Parent Households |
| No Children | 29 (7.6%) | 0 (0.0%) |
| 1 or 2 Children | 0 (0.0%) | 0 (0.0%) |
| 3 or 4 Children | 0 (0.0%) | 0 (0.0%) |
| 5 or more Children | 0 (0.0%) | 0 (0.0%) |
| Total | 29 (5.3%) | 0 (0.0%) |
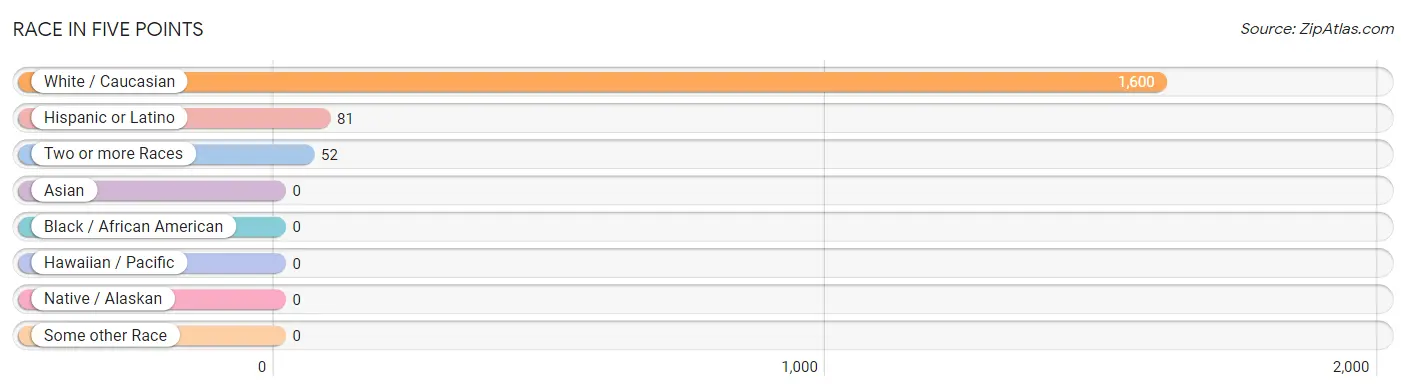
Race in Five Points
The most populous races in Five Points are White / Caucasian (1,600 | 96.9%), Hispanic or Latino (81 | 4.9%), and Two or more Races (52 | 3.2%).
| Race | # Population | % Population |
| Asian | 0 | 0.0% |
| Black / African American | 0 | 0.0% |
| Hawaiian / Pacific | 0 | 0.0% |
| Hispanic or Latino | 81 | 4.9% |
| Native / Alaskan | 0 | 0.0% |
| White / Caucasian | 1,600 | 96.9% |
| Two or more Races | 52 | 3.2% |
| Some other Race | 0 | 0.0% |
| Total | 1,652 | 100.0% |
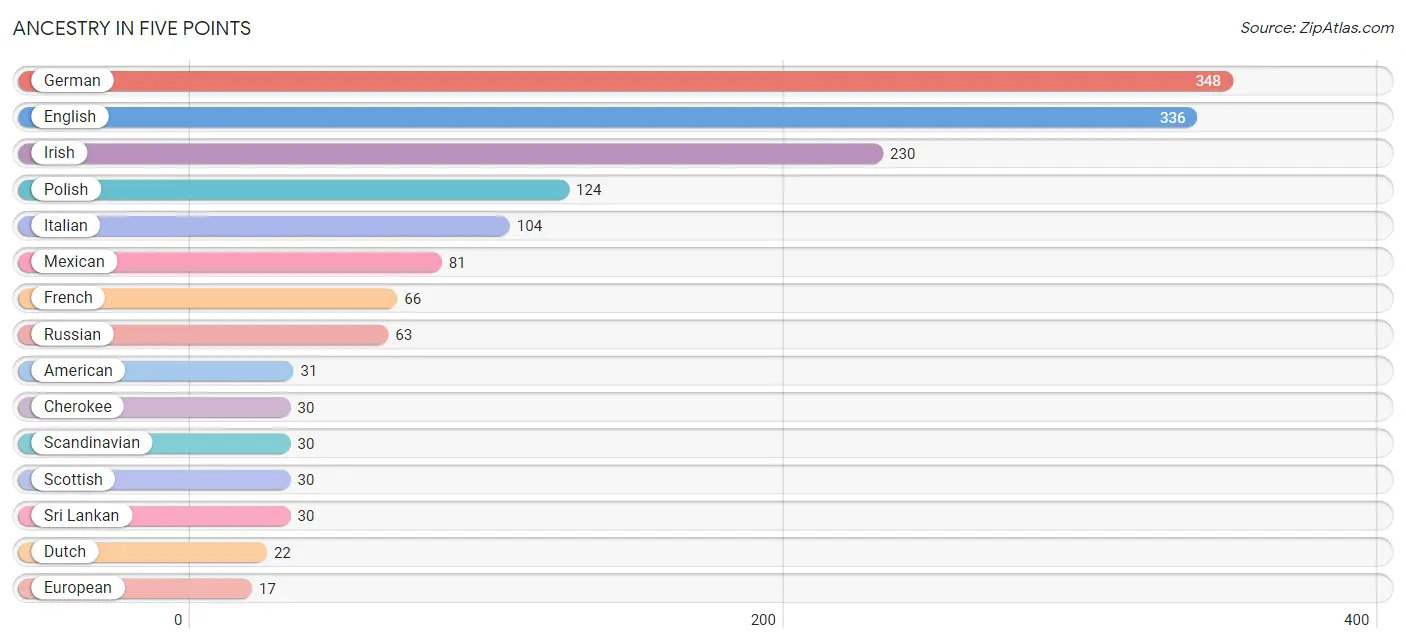
Ancestry in Five Points
The most populous ancestries reported in Five Points are German (348 | 21.1%), English (336 | 20.3%), Irish (230 | 13.9%), Polish (124 | 7.5%), and Italian (104 | 6.3%), together accounting for 69.1% of all Five Points residents.
| Ancestry | # Population | % Population |
| American | 31 | 1.9% |
| Cherokee | 30 | 1.8% |
| Dutch | 22 | 1.3% |
| English | 336 | 20.3% |
| European | 17 | 1.0% |
| French | 66 | 4.0% |
| German | 348 | 21.1% |
| Irish | 230 | 13.9% |
| Italian | 104 | 6.3% |
| Mexican | 81 | 4.9% |
| Polish | 124 | 7.5% |
| Russian | 63 | 3.8% |
| Scandinavian | 30 | 1.8% |
| Scottish | 30 | 1.8% |
| Sri Lankan | 30 | 1.8% |
| Swedish | 14 | 0.9% | View All 16 Rows |
Immigrants in Five Points
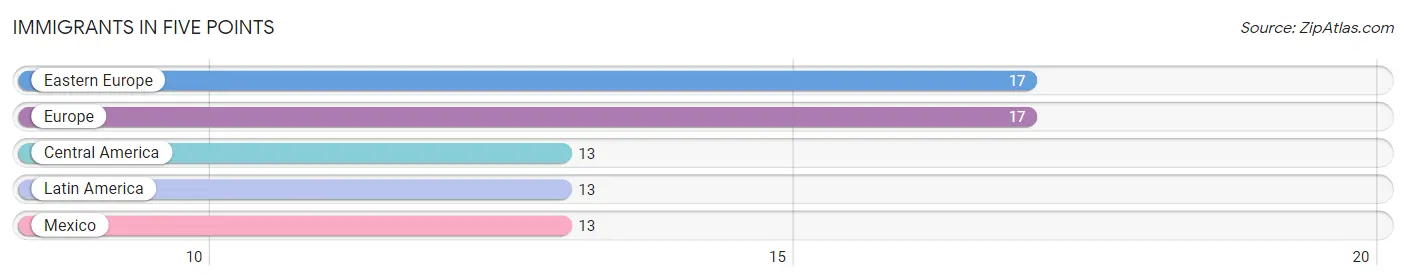
The most numerous immigrant groups reported in Five Points came from Eastern Europe (17 | 1.0%), Europe (17 | 1.0%), Central America (13 | 0.8%), Latin America (13 | 0.8%), and Mexico (13 | 0.8%), together accounting for 4.4% of all Five Points residents.
| Immigration Origin | # Population | % Population |
| Central America | 13 | 0.8% |
| Eastern Europe | 17 | 1.0% |
| Europe | 17 | 1.0% |
| Latin America | 13 | 0.8% |
| Mexico | 13 | 0.8% | View All 5 Rows |
Sex and Age in Five Points
Sex and Age in Five Points
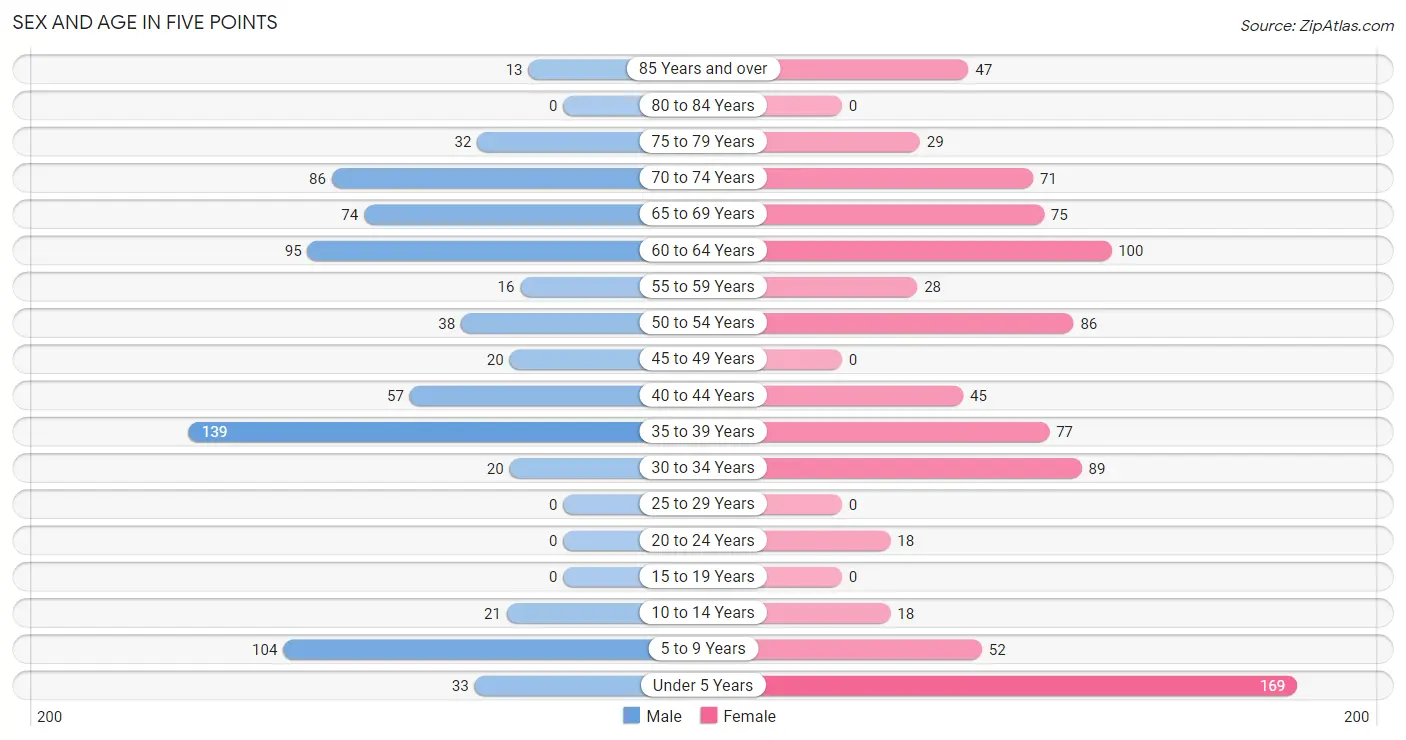
The most populous age groups in Five Points are 35 to 39 Years (139 | 18.6%) for men and Under 5 Years (169 | 18.7%) for women.
| Age Bracket | Male | Female |
| Under 5 Years | 33 (4.4%) | 169 (18.7%) |
| 5 to 9 Years | 104 (13.9%) | 52 (5.8%) |
| 10 to 14 Years | 21 (2.8%) | 18 (2.0%) |
| 15 to 19 Years | 0 (0.0%) | 0 (0.0%) |
| 20 to 24 Years | 0 (0.0%) | 18 (2.0%) |
| 25 to 29 Years | 0 (0.0%) | 0 (0.0%) |
| 30 to 34 Years | 20 (2.7%) | 89 (9.9%) |
| 35 to 39 Years | 139 (18.6%) | 77 (8.5%) |
| 40 to 44 Years | 57 (7.6%) | 45 (5.0%) |
| 45 to 49 Years | 20 (2.7%) | 0 (0.0%) |
| 50 to 54 Years | 38 (5.1%) | 86 (9.5%) |
| 55 to 59 Years | 16 (2.1%) | 28 (3.1%) |
| 60 to 64 Years | 95 (12.7%) | 100 (11.1%) |
| 65 to 69 Years | 74 (9.9%) | 75 (8.3%) |
| 70 to 74 Years | 86 (11.5%) | 71 (7.9%) |
| 75 to 79 Years | 32 (4.3%) | 29 (3.2%) |
| 80 to 84 Years | 0 (0.0%) | 0 (0.0%) |
| 85 Years and over | 13 (1.7%) | 47 (5.2%) |
| Total | 748 (100.0%) | 904 (100.0%) |
Families and Households in Five Points
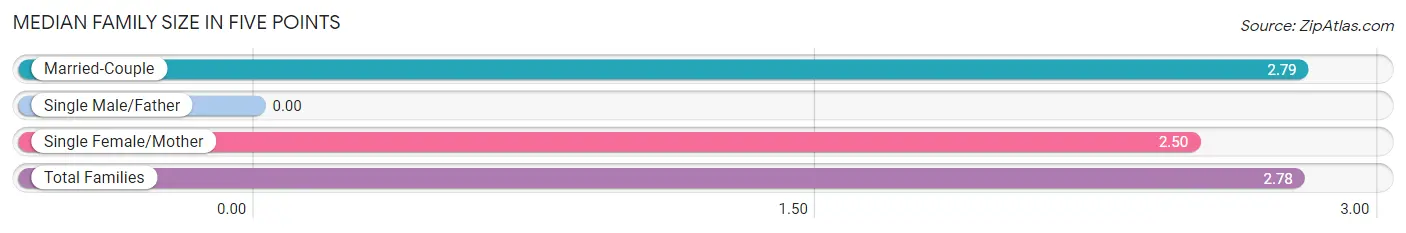
Median Family Size in Five Points
| Family Type | # Families | Family Size |
| Married-Couple | 549 (97.9%) | 2.79 |
| Single Male/Father | 0 (0.0%) | - |
| Single Female/Mother | 12 (2.1%) | 2.50 |
| Total Families | 561 (100.0%) | 2.78 |
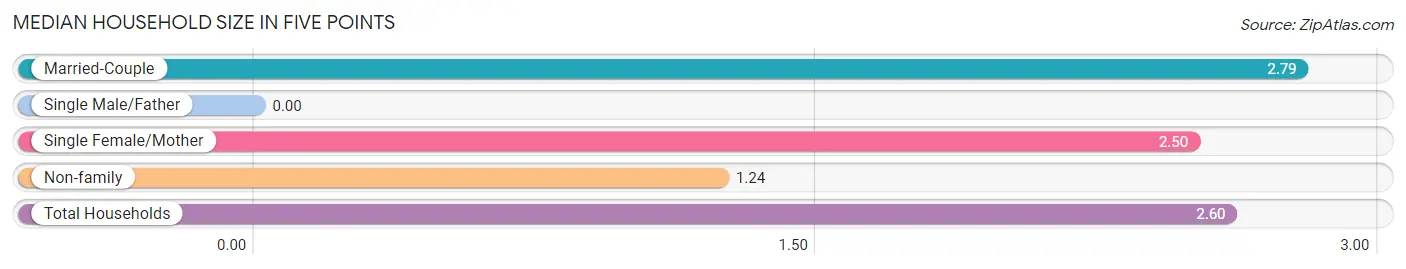
Median Household Size in Five Points
| Household Type | # Households | Household Size |
| Married-Couple | 549 (86.5%) | 2.79 |
| Single Male/Father | 0 (0.0%) | - |
| Single Female/Mother | 12 (1.9%) | 2.50 |
| Non-family | 74 (11.7%) | 1.24 |
| Total Households | 635 (100.0%) | 2.60 |
Household Size by Marriage Status in Five Points
Out of a total of 635 households in Five Points, 561 (88.3%) are family households, while 74 (11.7%) are nonfamily households. The most numerous type of family households are 2-person households, comprising 357, and the most common type of nonfamily households are 1-person households, comprising 57.
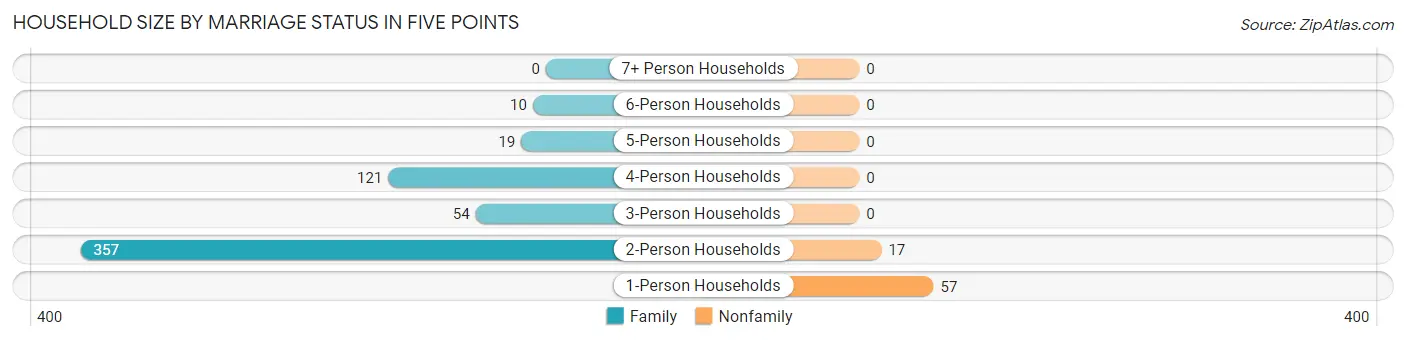
| Household Size | Family Households | Nonfamily Households |
| 1-Person Households | - | 57 (9.0%) |
| 2-Person Households | 357 (56.2%) | 17 (2.7%) |
| 3-Person Households | 54 (8.5%) | 0 (0.0%) |
| 4-Person Households | 121 (19.1%) | 0 (0.0%) |
| 5-Person Households | 19 (3.0%) | 0 (0.0%) |
| 6-Person Households | 10 (1.6%) | 0 (0.0%) |
| 7+ Person Households | 0 (0.0%) | 0 (0.0%) |
| Total | 561 (88.3%) | 74 (11.7%) |
Female Fertility in Five Points
Fertility by Age in Five Points
Average fertility rate in Five Points is 157.0 births per 1,000 women. Women in the age bracket of 35 to 50 years have the highest fertility rate with 295.0 births per 1,000 women. Women in the age bracket of 35 to 50 years acount for 100.0% of all women with births.
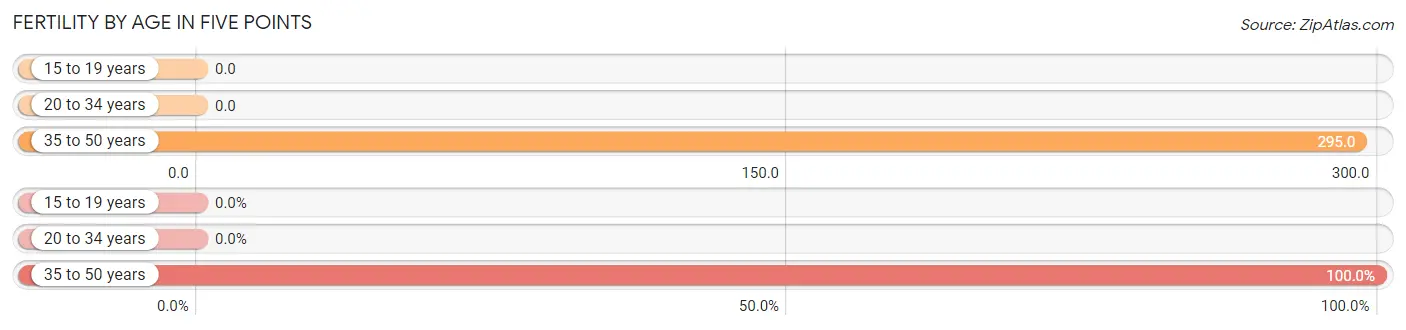
| Age Bracket | Women with Births | Births / 1,000 Women |
| 15 to 19 years | 0 (0.0%) | 0.0 |
| 20 to 34 years | 0 (0.0%) | 0.0 |
| 35 to 50 years | 36 (100.0%) | 295.0 |
| Total | 36 (100.0%) | 157.0 |
Fertility by Age by Marriage Status in Five Points
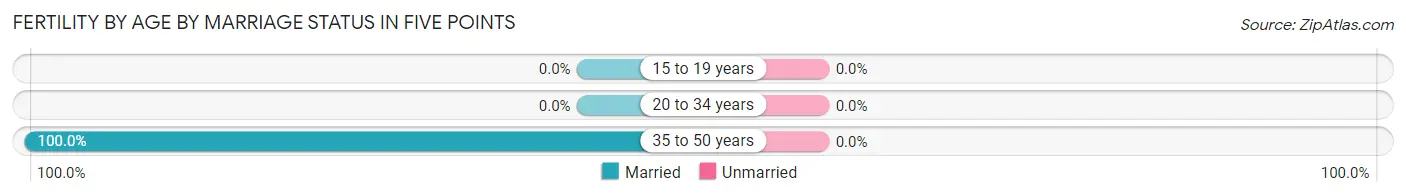
| Age Bracket | Married | Unmarried |
| 15 to 19 years | 0 (0.0%) | 0 (0.0%) |
| 20 to 34 years | 0 (0.0%) | 0 (0.0%) |
| 35 to 50 years | 36 (100.0%) | 0 (0.0%) |
| Total | 36 (100.0%) | 0 (0.0%) |
Fertility by Education in Five Points
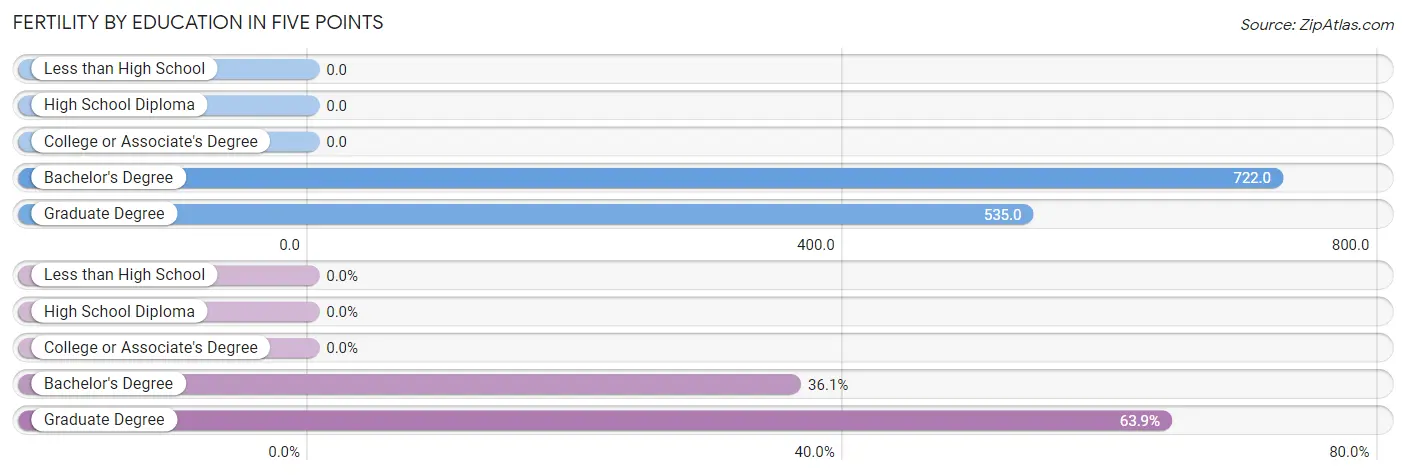
| Educational Attainment | Women with Births | Births / 1,000 Women |
| Less than High School | 0 (0.0%) | 0.0 |
| High School Diploma | 0 (0.0%) | 0.0 |
| College or Associate's Degree | 0 (0.0%) | 0.0 |
| Bachelor's Degree | 13 (36.1%) | 722.0 |
| Graduate Degree | 23 (63.9%) | 535.0 |
| Total | 36 (100.0%) | 157.0 |
Fertility by Education by Marriage Status in Five Points
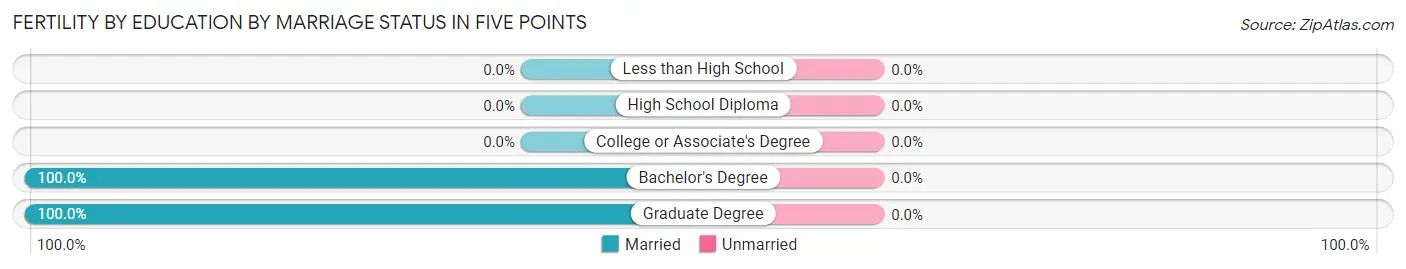
| Educational Attainment | Married | Unmarried |
| Less than High School | 0 (0.0%) | 0 (0.0%) |
| High School Diploma | 0 (0.0%) | 0 (0.0%) |
| College or Associate's Degree | 0 (0.0%) | 0 (0.0%) |
| Bachelor's Degree | 13 (100.0%) | 0 (0.0%) |
| Graduate Degree | 23 (100.0%) | 0 (0.0%) |
| Total | 36 (100.0%) | 0 (0.0%) |
Employment Characteristics in Five Points
Employment by Class of Employer in Five Points
Among the 689 employed individuals in Five Points, private company employees (493 | 71.6%), self-employed (incorporated) (68 | 9.9%), and local government employees (65 | 9.4%) make up the most common classes of employment.
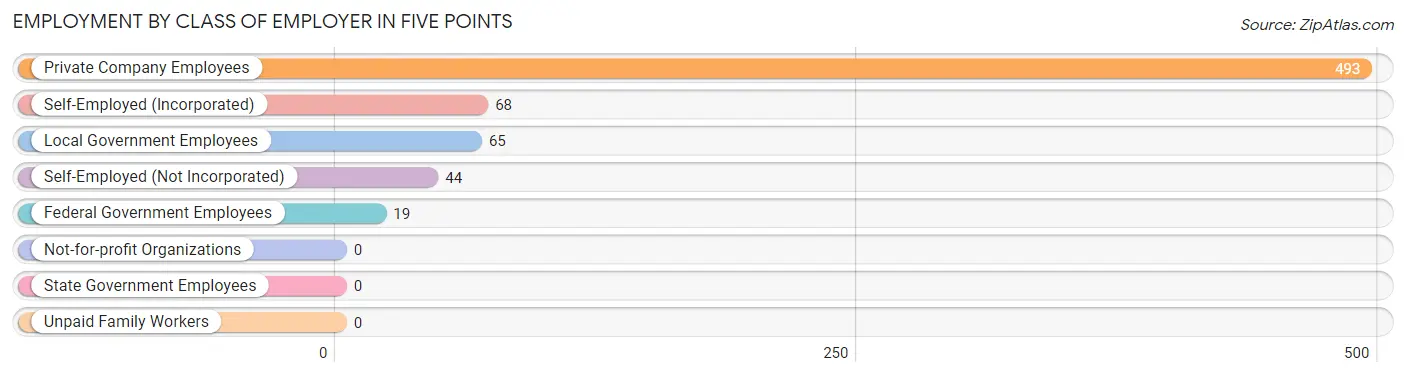
| Employer Class | # Employees | % Employees |
| Private Company Employees | 493 | 71.6% |
| Self-Employed (Incorporated) | 68 | 9.9% |
| Self-Employed (Not Incorporated) | 44 | 6.4% |
| Not-for-profit Organizations | 0 | 0.0% |
| Local Government Employees | 65 | 9.4% |
| State Government Employees | 0 | 0.0% |
| Federal Government Employees | 19 | 2.8% |
| Unpaid Family Workers | 0 | 0.0% |
| Total | 689 | 100.0% |
Employment Status by Age in Five Points
According to the labor force statistics for Five Points, out of the total population over 16 years of age (1,255), 59.4% or 745 individuals are in the labor force, with 7.6% or 57 of them unemployed. The age group with the highest labor force participation rate is 55 to 59 years, with 100.0% or 44 individuals in the labor force. Within the labor force, the 55 to 59 years age range has the highest percentage of unemployed individuals, with 63.6% or 28 of them being unemployed.
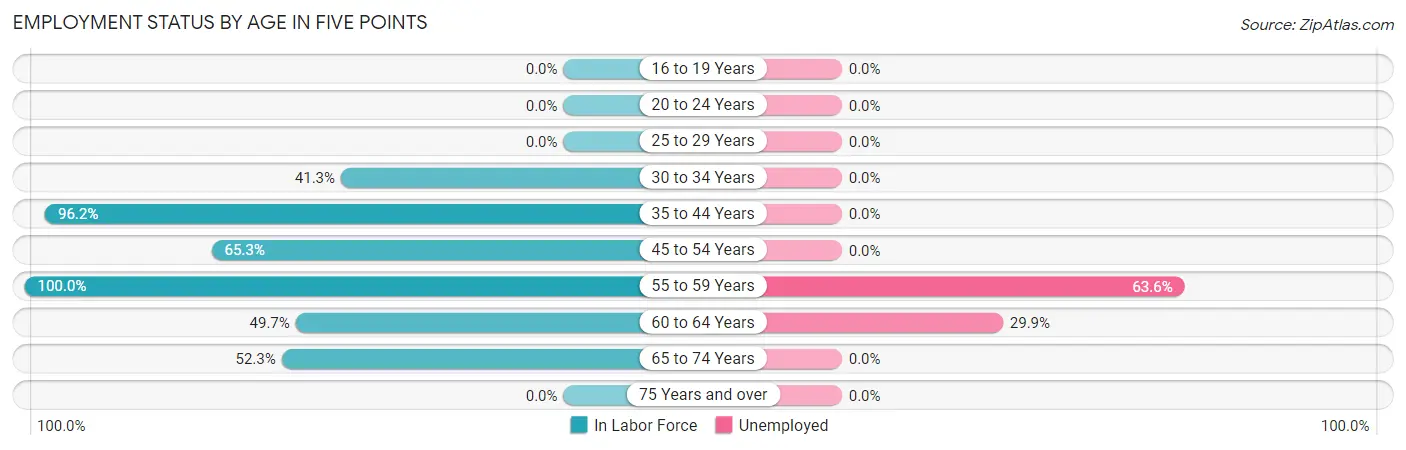
| Age Bracket | In Labor Force | Unemployed |
| 16 to 19 Years | 0 (0.0%) | 0 (0.0%) |
| 20 to 24 Years | 0 (0.0%) | 0 (0.0%) |
| 25 to 29 Years | 0 (0.0%) | 0 (0.0%) |
| 30 to 34 Years | 45 (41.3%) | 0 (0.0%) |
| 35 to 44 Years | 306 (96.2%) | 0 (0.0%) |
| 45 to 54 Years | 94 (65.3%) | 0 (0.0%) |
| 55 to 59 Years | 44 (100.0%) | 28 (63.6%) |
| 60 to 64 Years | 97 (49.7%) | 29 (29.9%) |
| 65 to 74 Years | 160 (52.3%) | 0 (0.0%) |
| 75 Years and over | 0 (0.0%) | 0 (0.0%) |
| Total | 745 (59.4%) | 57 (7.6%) |
Employment Status by Educational Attainment in Five Points
According to labor force statistics for Five Points, 72.3% of individuals (586) out of the total population between 25 and 64 years of age (810) are in the labor force, with 9.7% or 57 of them being unemployed. The group with the highest labor force participation rate are those with the educational attainment of bachelor's degree or higher, with 83.9% or 350 individuals in the labor force. Within the labor force, individuals with bachelor's degree or higher education have the highest percentage of unemployment, with 16.3% or 57 of them being unemployed.
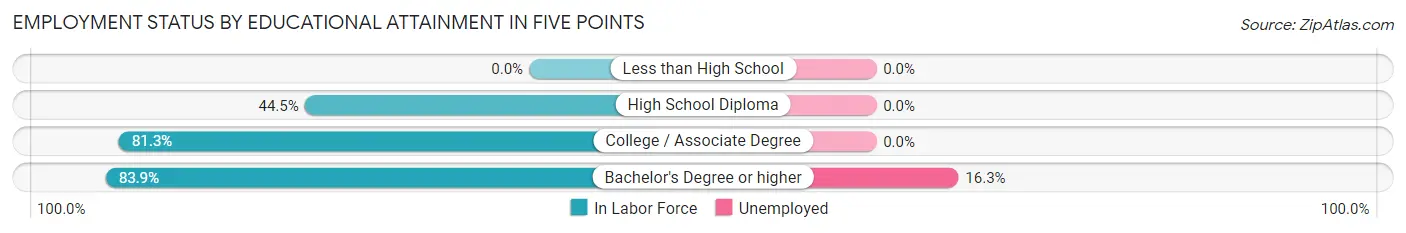
| Educational Attainment | In Labor Force | Unemployed |
| Less than High School | 0 (0.0%) | 0 (0.0%) |
| High School Diploma | 101 (44.5%) | 0 (0.0%) |
| College / Associate Degree | 135 (81.3%) | 0 (0.0%) |
| Bachelor's Degree or higher | 350 (83.9%) | 68 (16.3%) |
| Total | 586 (72.3%) | 79 (9.7%) |
Employment Occupations by Sex in Five Points
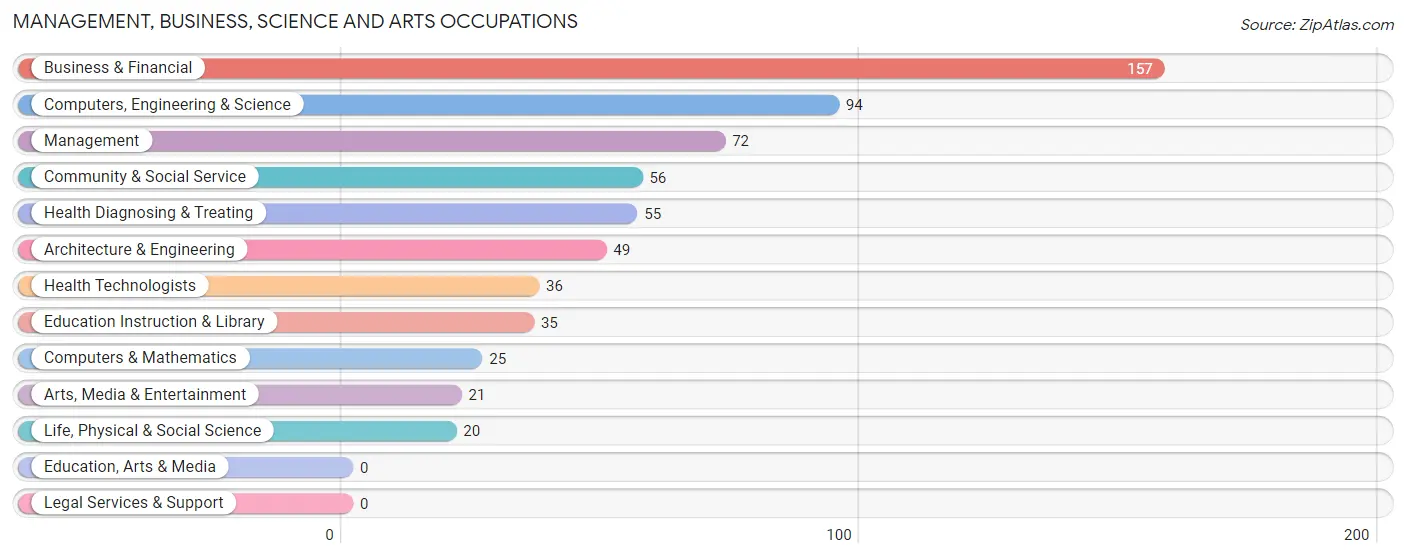
Management, Business, Science and Arts Occupations
The most common Management, Business, Science and Arts occupations in Five Points are Business & Financial (157 | 22.8%), Computers, Engineering & Science (94 | 13.6%), Management (72 | 10.4%), Community & Social Service (56 | 8.1%), and Health Diagnosing & Treating (55 | 8.0%).
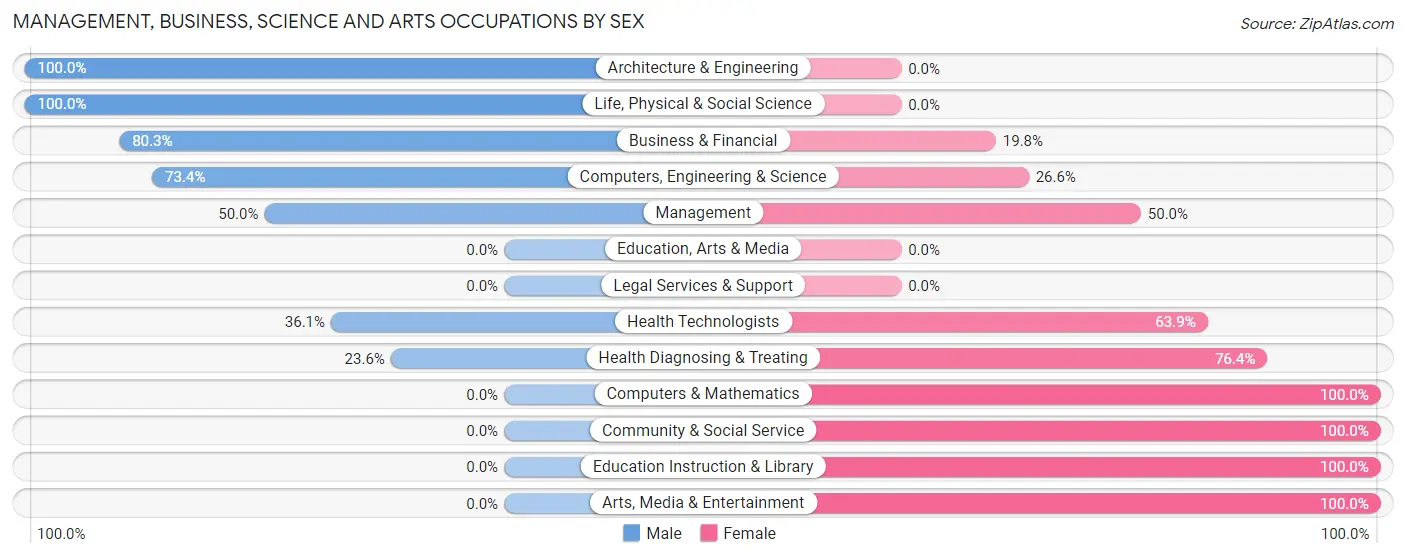
Management, Business, Science and Arts Occupations by Sex
Within the Management, Business, Science and Arts occupations in Five Points, the most male-oriented occupations are Architecture & Engineering (100.0%), Life, Physical & Social Science (100.0%), and Business & Financial (80.2%), while the most female-oriented occupations are Computers & Mathematics (100.0%), Community & Social Service (100.0%), and Education Instruction & Library (100.0%).
| Occupation | Male | Female |
| Management | 36 (50.0%) | 36 (50.0%) |
| Business & Financial | 126 (80.2%) | 31 (19.8%) |
| Computers, Engineering & Science | 69 (73.4%) | 25 (26.6%) |
| Computers & Mathematics | 0 (0.0%) | 25 (100.0%) |
| Architecture & Engineering | 49 (100.0%) | 0 (0.0%) |
| Life, Physical & Social Science | 20 (100.0%) | 0 (0.0%) |
| Community & Social Service | 0 (0.0%) | 56 (100.0%) |
| Education, Arts & Media | 0 (0.0%) | 0 (0.0%) |
| Legal Services & Support | 0 (0.0%) | 0 (0.0%) |
| Education Instruction & Library | 0 (0.0%) | 35 (100.0%) |
| Arts, Media & Entertainment | 0 (0.0%) | 21 (100.0%) |
| Health Diagnosing & Treating | 13 (23.6%) | 42 (76.4%) |
| Health Technologists | 13 (36.1%) | 23 (63.9%) |
| Total (Category) | 244 (56.2%) | 190 (43.8%) |
| Total (Overall) | 406 (58.9%) | 283 (41.1%) |
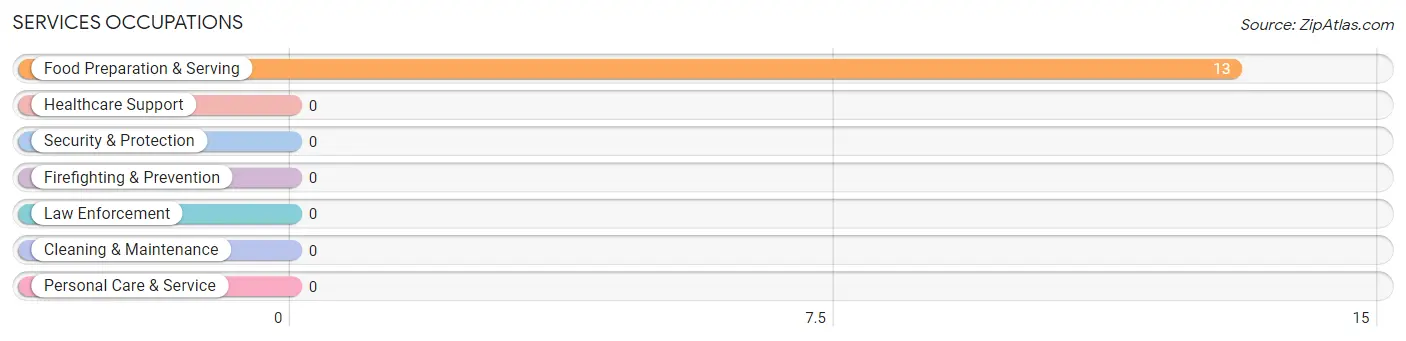
Services Occupations
The most common Services occupations in Five Points are , and Food Preparation & Serving (13 | 1.9%).
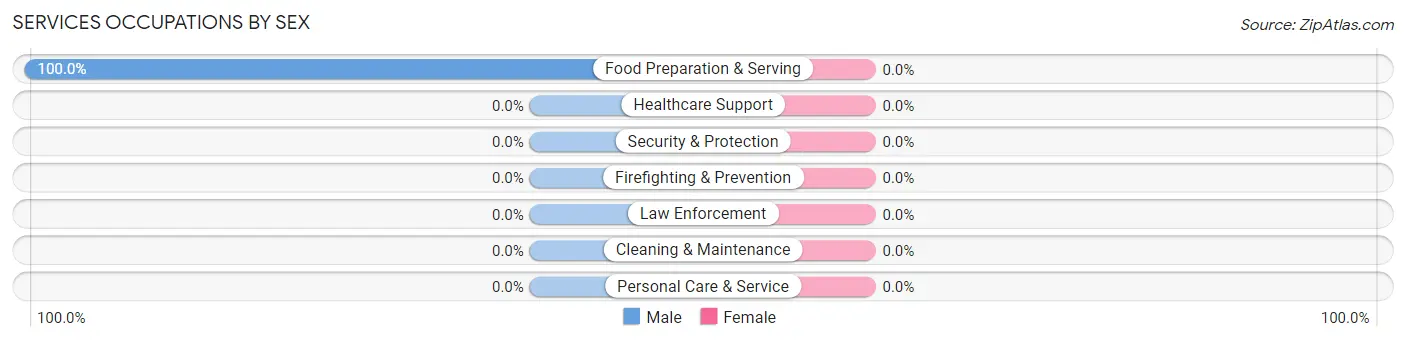
Services Occupations by Sex
| Occupation | Male | Female |
| Healthcare Support | 0 (0.0%) | 0 (0.0%) |
| Security & Protection | 0 (0.0%) | 0 (0.0%) |
| Firefighting & Prevention | 0 (0.0%) | 0 (0.0%) |
| Law Enforcement | 0 (0.0%) | 0 (0.0%) |
| Food Preparation & Serving | 13 (100.0%) | 0 (0.0%) |
| Cleaning & Maintenance | 0 (0.0%) | 0 (0.0%) |
| Personal Care & Service | 0 (0.0%) | 0 (0.0%) |
| Total (Category) | 13 (100.0%) | 0 (0.0%) |
| Total (Overall) | 406 (58.9%) | 283 (41.1%) |
Sales and Office Occupations
The most common Sales and Office occupations in Five Points are Office & Administration (83 | 12.0%), and Sales & Related (34 | 4.9%).
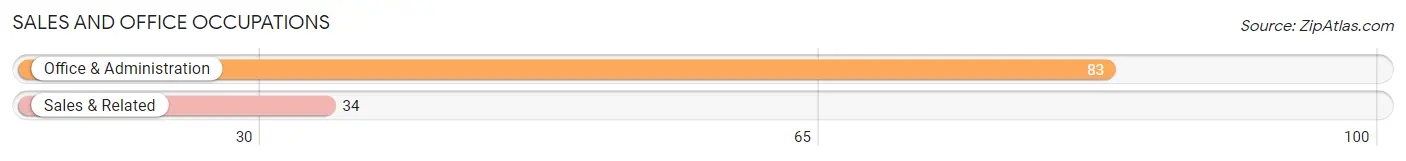
Sales and Office Occupations by Sex

| Occupation | Male | Female |
| Sales & Related | 24 (70.6%) | 10 (29.4%) |
| Office & Administration | 0 (0.0%) | 83 (100.0%) |
| Total (Category) | 24 (20.5%) | 93 (79.5%) |
| Total (Overall) | 406 (58.9%) | 283 (41.1%) |
Natural Resources, Construction and Maintenance Occupations
The most common Natural Resources, Construction and Maintenance occupations in Five Points are , and Construction & Extraction (125 | 18.1%).
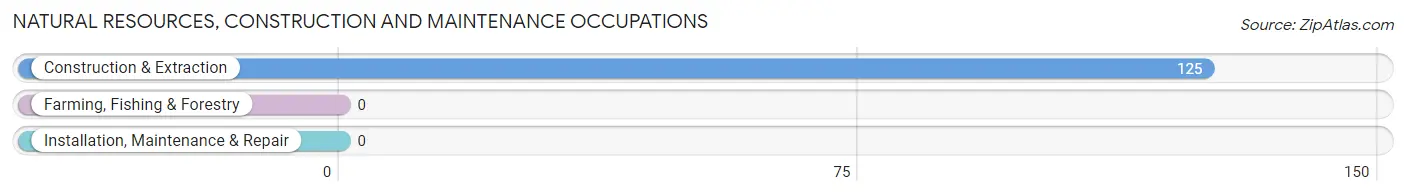
Natural Resources, Construction and Maintenance Occupations by Sex
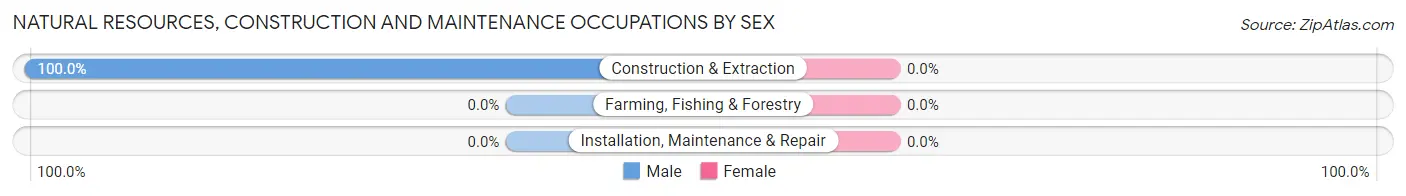
| Occupation | Male | Female |
| Farming, Fishing & Forestry | 0 (0.0%) | 0 (0.0%) |
| Construction & Extraction | 125 (100.0%) | 0 (0.0%) |
| Installation, Maintenance & Repair | 0 (0.0%) | 0 (0.0%) |
| Total (Category) | 125 (100.0%) | 0 (0.0%) |
| Total (Overall) | 406 (58.9%) | 283 (41.1%) |
Production, Transportation and Moving Occupations
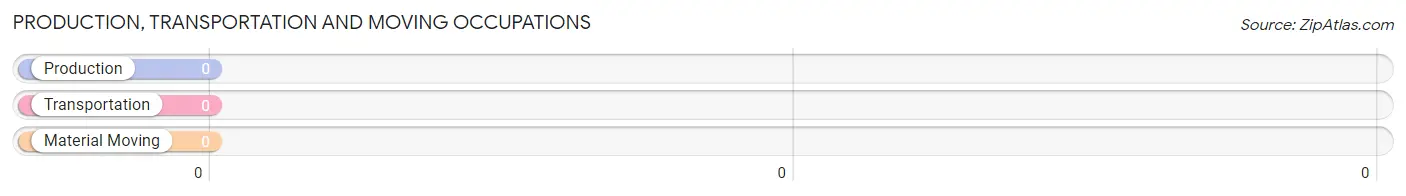
Production, Transportation and Moving Occupations by Sex
| Occupation | Male | Female |
| Production | 0 (0.0%) | 0 (0.0%) |
| Transportation | 0 (0.0%) | 0 (0.0%) |
| Material Moving | 0 (0.0%) | 0 (0.0%) |
| Total (Category) | 0 (0.0%) | 0 (0.0%) |
| Total (Overall) | 406 (58.9%) | 283 (41.1%) |
Employment Industries by Sex in Five Points
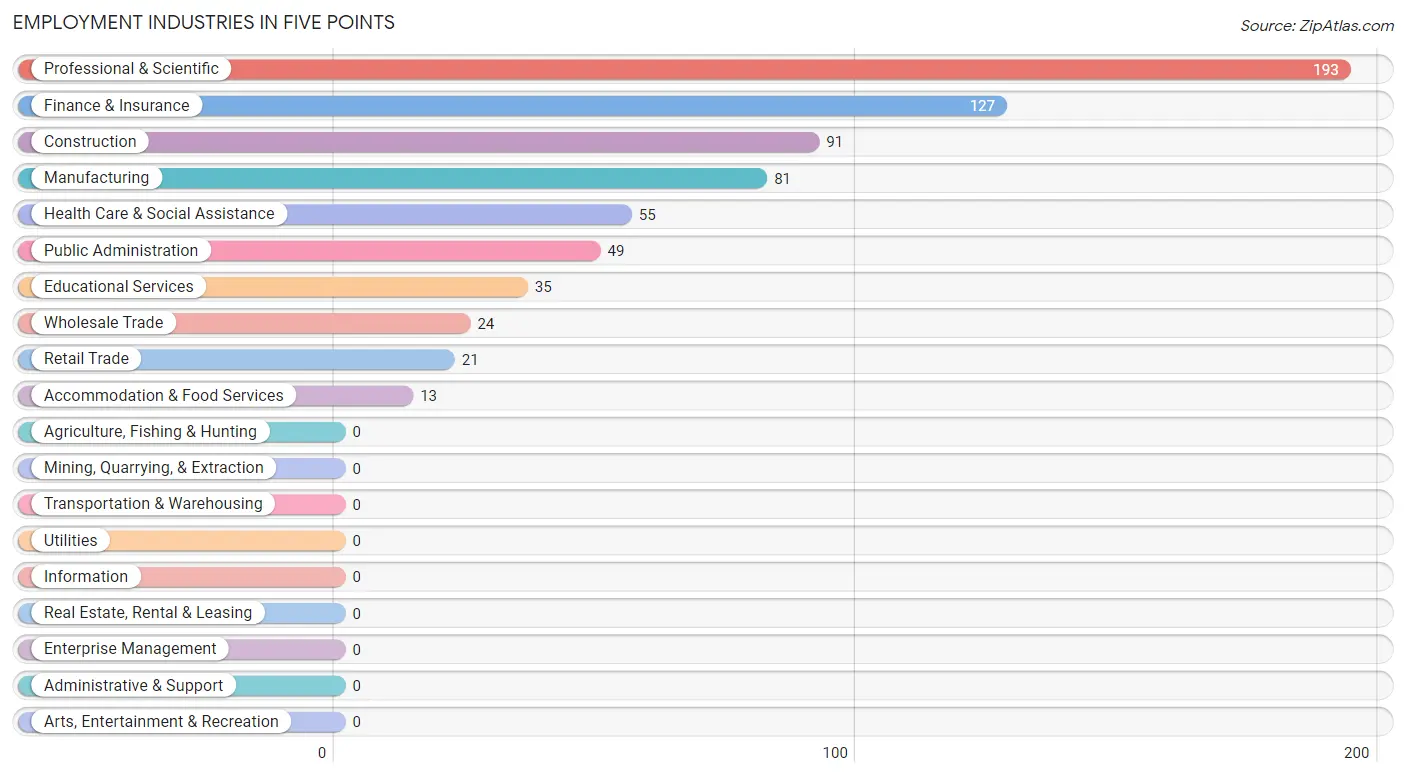
Employment Industries in Five Points
The major employment industries in Five Points include Professional & Scientific (193 | 28.0%), Finance & Insurance (127 | 18.4%), Construction (91 | 13.2%), Manufacturing (81 | 11.8%), and Health Care & Social Assistance (55 | 8.0%).
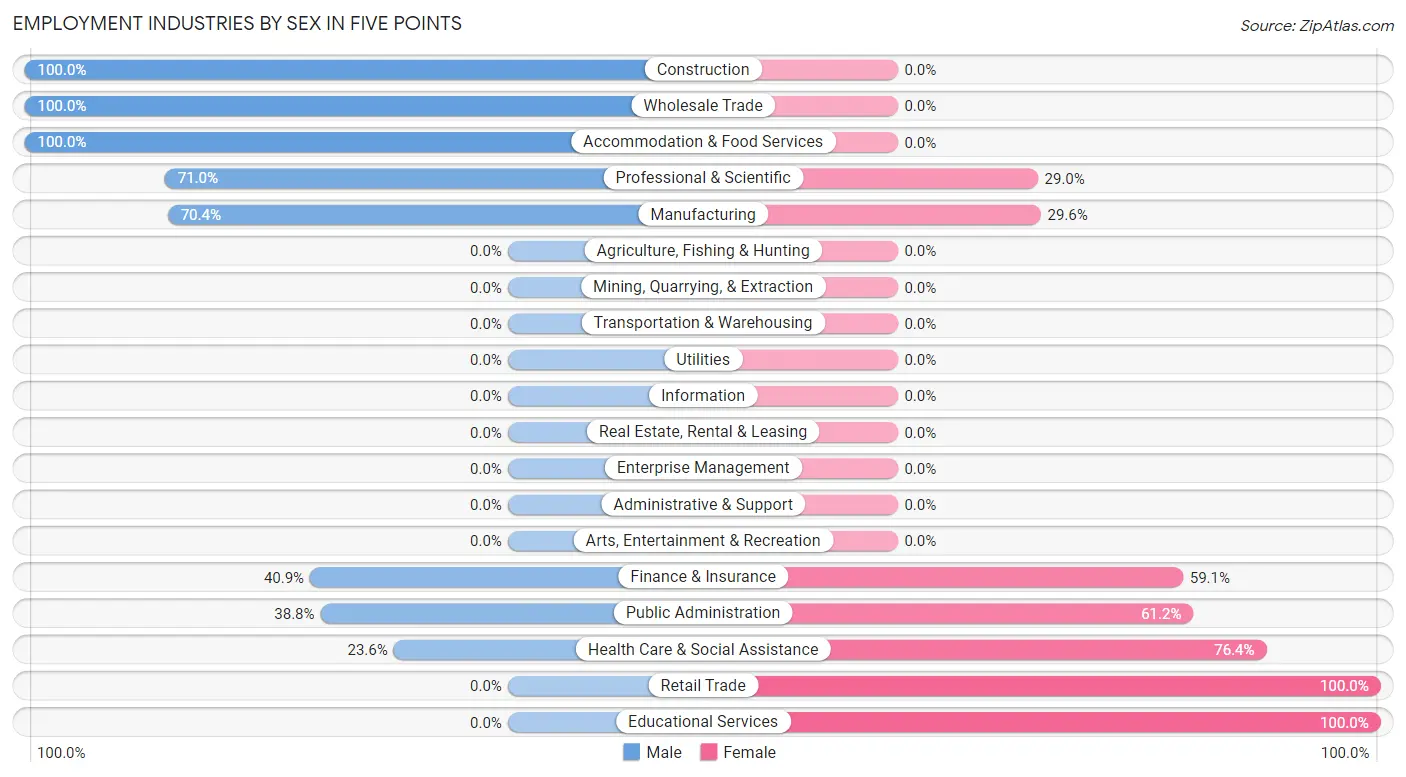
Employment Industries by Sex in Five Points
The Five Points industries that see more men than women are Construction (100.0%), Wholesale Trade (100.0%), and Accommodation & Food Services (100.0%), whereas the industries that tend to have a higher number of women are Retail Trade (100.0%), Educational Services (100.0%), and Health Care & Social Assistance (76.4%).
| Industry | Male | Female |
| Agriculture, Fishing & Hunting | 0 (0.0%) | 0 (0.0%) |
| Mining, Quarrying, & Extraction | 0 (0.0%) | 0 (0.0%) |
| Construction | 91 (100.0%) | 0 (0.0%) |
| Manufacturing | 57 (70.4%) | 24 (29.6%) |
| Wholesale Trade | 24 (100.0%) | 0 (0.0%) |
| Retail Trade | 0 (0.0%) | 21 (100.0%) |
| Transportation & Warehousing | 0 (0.0%) | 0 (0.0%) |
| Utilities | 0 (0.0%) | 0 (0.0%) |
| Information | 0 (0.0%) | 0 (0.0%) |
| Finance & Insurance | 52 (40.9%) | 75 (59.1%) |
| Real Estate, Rental & Leasing | 0 (0.0%) | 0 (0.0%) |
| Professional & Scientific | 137 (71.0%) | 56 (29.0%) |
| Enterprise Management | 0 (0.0%) | 0 (0.0%) |
| Administrative & Support | 0 (0.0%) | 0 (0.0%) |
| Educational Services | 0 (0.0%) | 35 (100.0%) |
| Health Care & Social Assistance | 13 (23.6%) | 42 (76.4%) |
| Arts, Entertainment & Recreation | 0 (0.0%) | 0 (0.0%) |
| Accommodation & Food Services | 13 (100.0%) | 0 (0.0%) |
| Public Administration | 19 (38.8%) | 30 (61.2%) |
| Total | 406 (58.9%) | 283 (41.1%) |
Education in Five Points
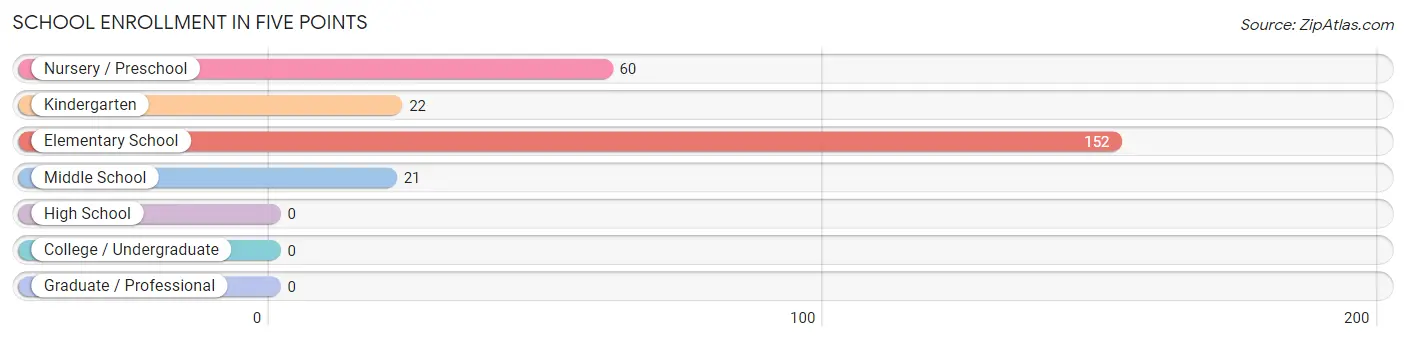
School Enrollment in Five Points
The most common levels of schooling among the 255 students in Five Points are elementary school (152 | 59.6%), nursery / preschool (60 | 23.5%), and kindergarten (22 | 8.6%).
| School Level | # Students | % Students |
| Nursery / Preschool | 60 | 23.5% |
| Kindergarten | 22 | 8.6% |
| Elementary School | 152 | 59.6% |
| Middle School | 21 | 8.2% |
| High School | 0 | 0.0% |
| College / Undergraduate | 0 | 0.0% |
| Graduate / Professional | 0 | 0.0% |
| Total | 255 | 100.0% |
School Enrollment by Age by Funding Source in Five Points
Out of a total of 255 students who are enrolled in schools in Five Points, 74 (29.0%) attend a private institution, while the remaining 181 (71.0%) are enrolled in public schools. The age group of 3 to 4 year olds has the highest likelihood of being enrolled in private schools, with 60 (100.0% in the age bracket) enrolled. Conversely, the age group of 10 to 14 year olds has the lowest likelihood of being enrolled in a private school, with 39 (100.0% in the age bracket) attending a public institution.
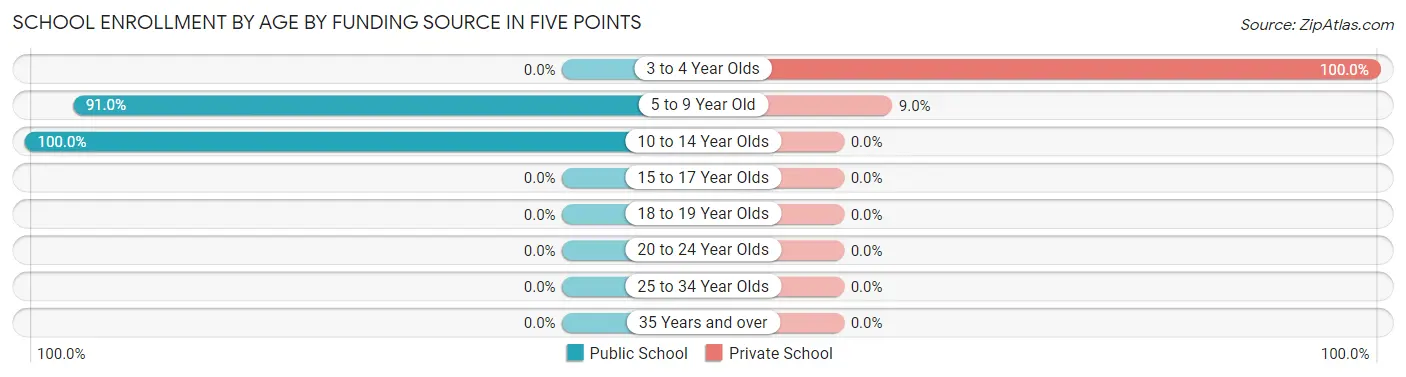
| Age Bracket | Public School | Private School |
| 3 to 4 Year Olds | 0 (0.0%) | 60 (100.0%) |
| 5 to 9 Year Old | 142 (91.0%) | 14 (9.0%) |
| 10 to 14 Year Olds | 39 (100.0%) | 0 (0.0%) |
| 15 to 17 Year Olds | 0 (0.0%) | 0 (0.0%) |
| 18 to 19 Year Olds | 0 (0.0%) | 0 (0.0%) |
| 20 to 24 Year Olds | 0 (0.0%) | 0 (0.0%) |
| 25 to 34 Year Olds | 0 (0.0%) | 0 (0.0%) |
| 35 Years and over | 0 (0.0%) | 0 (0.0%) |
| Total | 181 (71.0%) | 74 (29.0%) |
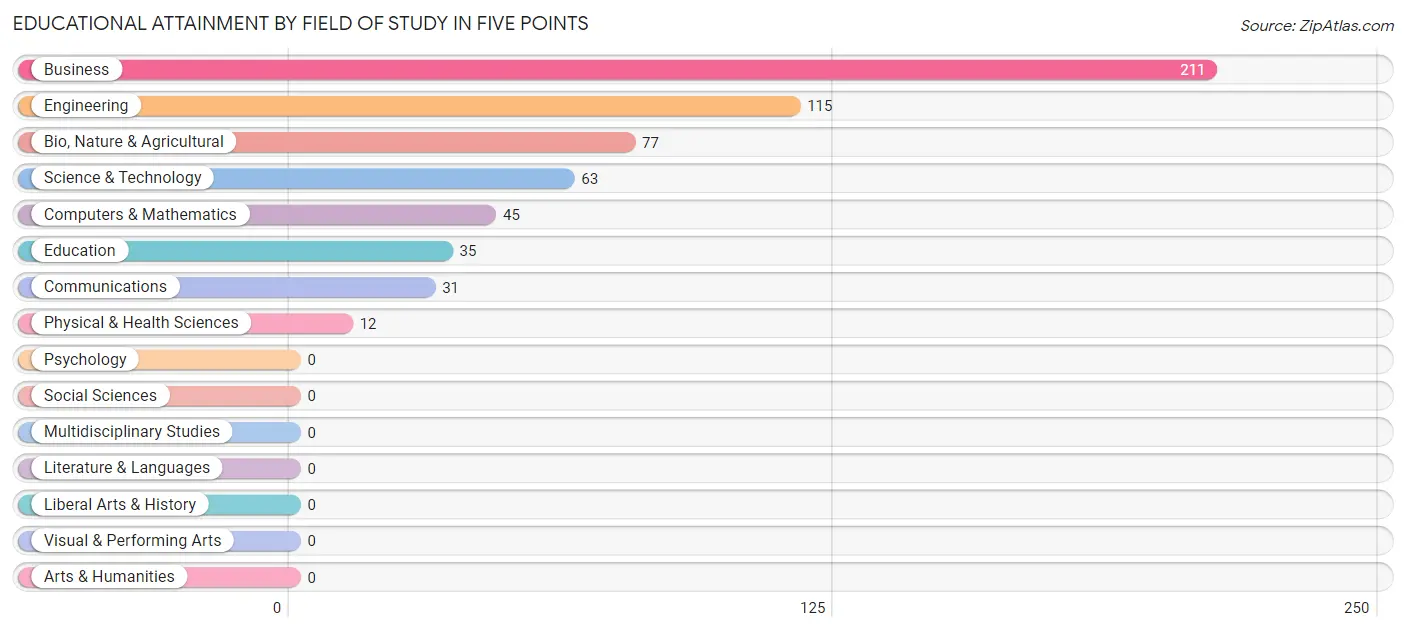
Educational Attainment by Field of Study in Five Points
Business (211 | 35.8%), engineering (115 | 19.5%), bio, nature & agricultural (77 | 13.1%), science & technology (63 | 10.7%), and computers & mathematics (45 | 7.6%) are the most common fields of study among 589 individuals in Five Points who have obtained a bachelor's degree or higher.
| Field of Study | # Graduates | % Graduates |
| Computers & Mathematics | 45 | 7.6% |
| Bio, Nature & Agricultural | 77 | 13.1% |
| Physical & Health Sciences | 12 | 2.0% |
| Psychology | 0 | 0.0% |
| Social Sciences | 0 | 0.0% |
| Engineering | 115 | 19.5% |
| Multidisciplinary Studies | 0 | 0.0% |
| Science & Technology | 63 | 10.7% |
| Business | 211 | 35.8% |
| Education | 35 | 5.9% |
| Literature & Languages | 0 | 0.0% |
| Liberal Arts & History | 0 | 0.0% |
| Visual & Performing Arts | 0 | 0.0% |
| Communications | 31 | 5.3% |
| Arts & Humanities | 0 | 0.0% |
| Total | 589 | 100.0% |
Transportation & Commute in Five Points
Vehicle Availability by Sex in Five Points
The most prevalent vehicle ownership categories in Five Points are males with 2 vehicles (188, accounting for 46.3%) and females with 2 vehicles (166, making up 66.4%).
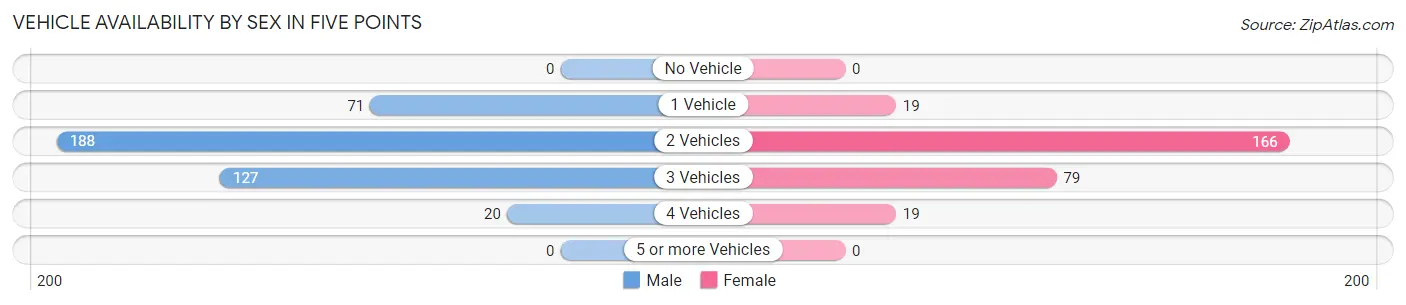
| Vehicles Available | Male | Female |
| No Vehicle | 0 (0.0%) | 0 (0.0%) |
| 1 Vehicle | 71 (17.5%) | 19 (6.7%) |
| 2 Vehicles | 188 (46.3%) | 166 (58.7%) |
| 3 Vehicles | 127 (31.3%) | 79 (27.9%) |
| 4 Vehicles | 20 (4.9%) | 19 (6.7%) |
| 5 or more Vehicles | 0 (0.0%) | 0 (0.0%) |
| Total | 406 (100.0%) | 283 (100.0%) |
Commute Time in Five Points
The most frequently occuring commute durations in Five Points are 35 to 39 minutes (103 commuters, 23.0%), 20 to 24 minutes (75 commuters, 16.8%), and 5 to 9 minutes (71 commuters, 15.9%).
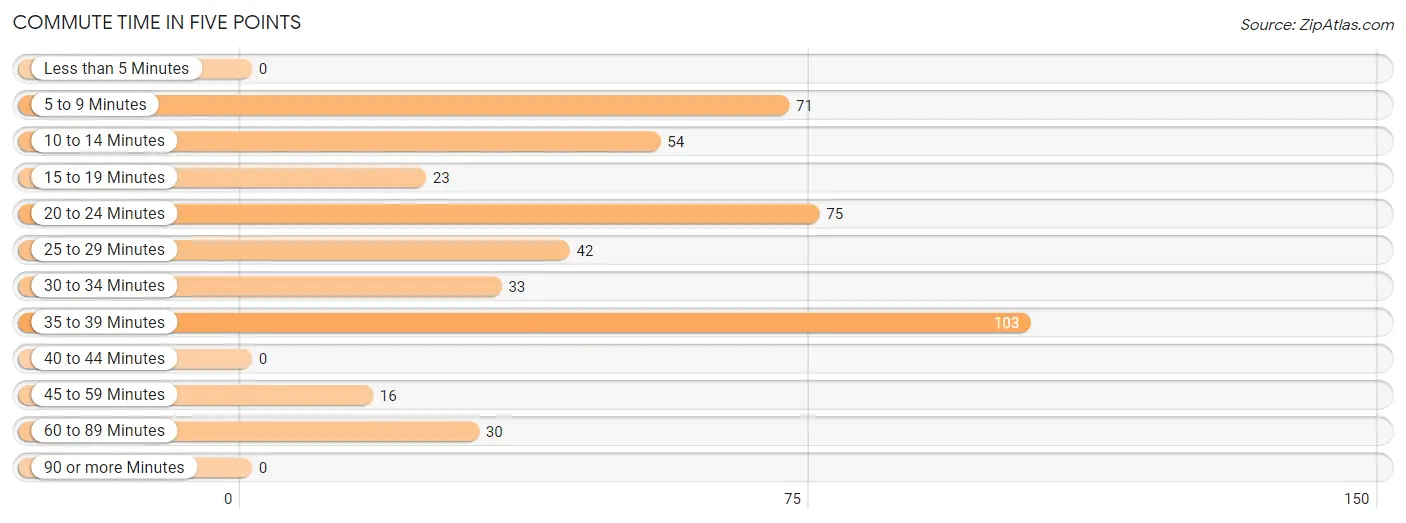
| Commute Time | # Commuters | % Commuters |
| Less than 5 Minutes | 0 | 0.0% |
| 5 to 9 Minutes | 71 | 15.9% |
| 10 to 14 Minutes | 54 | 12.1% |
| 15 to 19 Minutes | 23 | 5.1% |
| 20 to 24 Minutes | 75 | 16.8% |
| 25 to 29 Minutes | 42 | 9.4% |
| 30 to 34 Minutes | 33 | 7.4% |
| 35 to 39 Minutes | 103 | 23.0% |
| 40 to 44 Minutes | 0 | 0.0% |
| 45 to 59 Minutes | 16 | 3.6% |
| 60 to 89 Minutes | 30 | 6.7% |
| 90 or more Minutes | 0 | 0.0% |
Commute Time by Sex in Five Points
The most common commute times in Five Points are 35 to 39 minutes (61 commuters, 28.1%) for males and 5 to 9 minutes (71 commuters, 30.9%) for females.
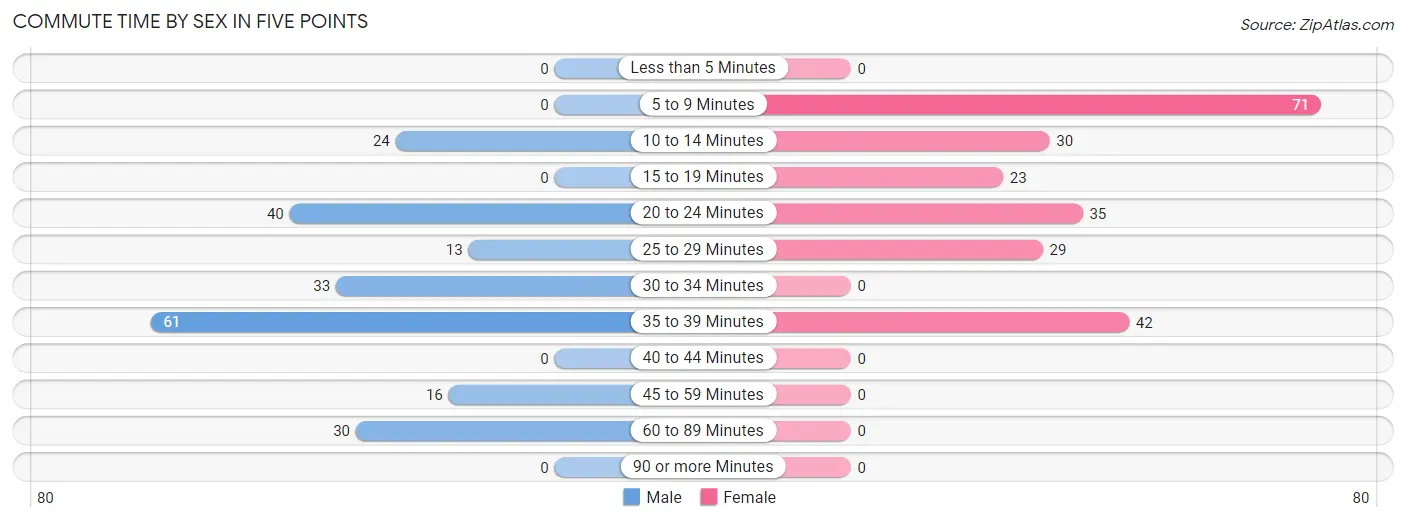
| Commute Time | Male | Female |
| Less than 5 Minutes | 0 (0.0%) | 0 (0.0%) |
| 5 to 9 Minutes | 0 (0.0%) | 71 (30.9%) |
| 10 to 14 Minutes | 24 (11.1%) | 30 (13.0%) |
| 15 to 19 Minutes | 0 (0.0%) | 23 (10.0%) |
| 20 to 24 Minutes | 40 (18.4%) | 35 (15.2%) |
| 25 to 29 Minutes | 13 (6.0%) | 29 (12.6%) |
| 30 to 34 Minutes | 33 (15.2%) | 0 (0.0%) |
| 35 to 39 Minutes | 61 (28.1%) | 42 (18.3%) |
| 40 to 44 Minutes | 0 (0.0%) | 0 (0.0%) |
| 45 to 59 Minutes | 16 (7.4%) | 0 (0.0%) |
| 60 to 89 Minutes | 30 (13.8%) | 0 (0.0%) |
| 90 or more Minutes | 0 (0.0%) | 0 (0.0%) |
Time of Departure to Work by Sex in Five Points
The most frequent times of departure to work in Five Points are 8:00 AM to 8:29 AM (67, 30.9%) for males and 8:30 AM to 8:59 AM (73, 31.7%) for females.
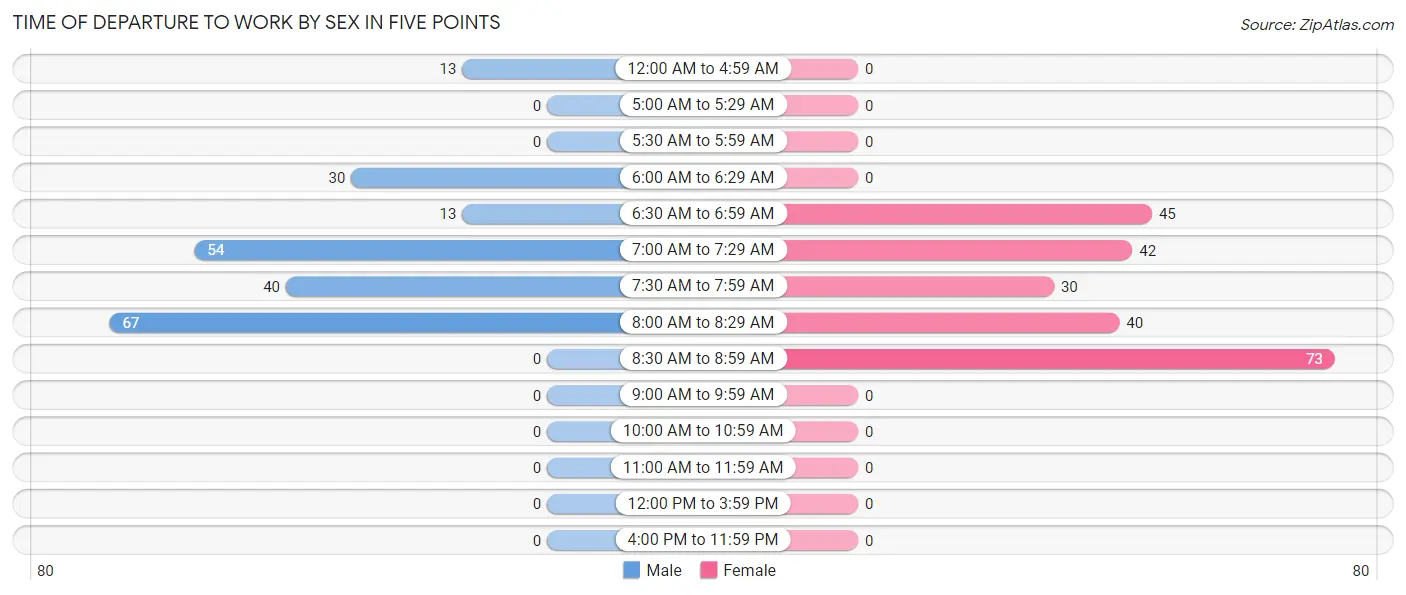
| Time of Departure | Male | Female |
| 12:00 AM to 4:59 AM | 13 (6.0%) | 0 (0.0%) |
| 5:00 AM to 5:29 AM | 0 (0.0%) | 0 (0.0%) |
| 5:30 AM to 5:59 AM | 0 (0.0%) | 0 (0.0%) |
| 6:00 AM to 6:29 AM | 30 (13.8%) | 0 (0.0%) |
| 6:30 AM to 6:59 AM | 13 (6.0%) | 45 (19.6%) |
| 7:00 AM to 7:29 AM | 54 (24.9%) | 42 (18.3%) |
| 7:30 AM to 7:59 AM | 40 (18.4%) | 30 (13.0%) |
| 8:00 AM to 8:29 AM | 67 (30.9%) | 40 (17.4%) |
| 8:30 AM to 8:59 AM | 0 (0.0%) | 73 (31.7%) |
| 9:00 AM to 9:59 AM | 0 (0.0%) | 0 (0.0%) |
| 10:00 AM to 10:59 AM | 0 (0.0%) | 0 (0.0%) |
| 11:00 AM to 11:59 AM | 0 (0.0%) | 0 (0.0%) |
| 12:00 PM to 3:59 PM | 0 (0.0%) | 0 (0.0%) |
| 4:00 PM to 11:59 PM | 0 (0.0%) | 0 (0.0%) |
| Total | 217 (100.0%) | 230 (100.0%) |
Housing Occupancy in Five Points
Occupancy by Ownership in Five Points
Of the total 635 dwellings in Five Points, owner-occupied units account for 635 (100.0%), while renter-occupied units make up 0 (0.0%).
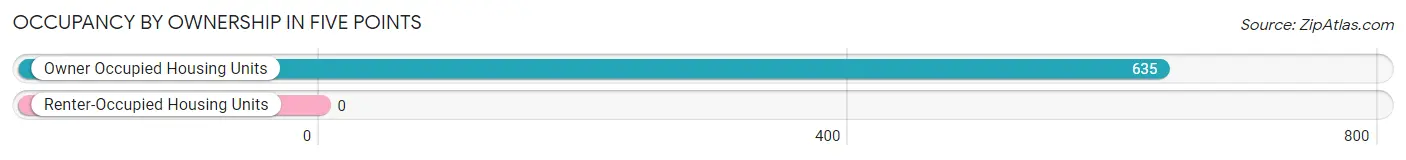
| Occupancy | # Housing Units | % Housing Units |
| Owner Occupied Housing Units | 635 | 100.0% |
| Renter-Occupied Housing Units | 0 | 0.0% |
| Total Occupied Housing Units | 635 | 100.0% |
Occupancy by Household Size in Five Points
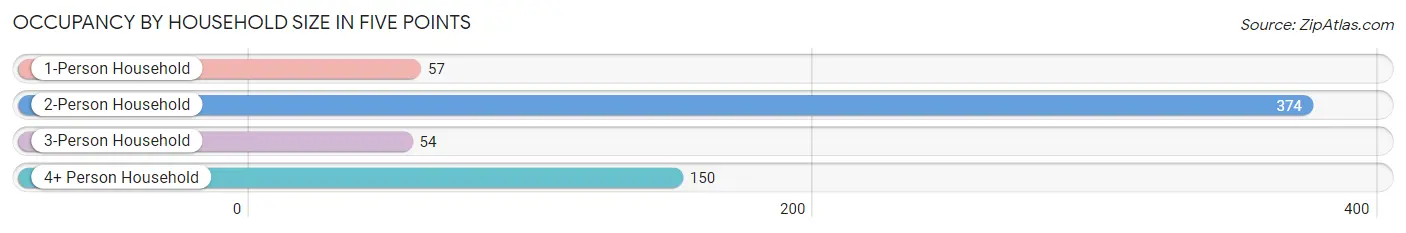
| Household Size | # Housing Units | % Housing Units |
| 1-Person Household | 57 | 9.0% |
| 2-Person Household | 374 | 58.9% |
| 3-Person Household | 54 | 8.5% |
| 4+ Person Household | 150 | 23.6% |
| Total Housing Units | 635 | 100.0% |
Occupancy by Ownership by Household Size in Five Points
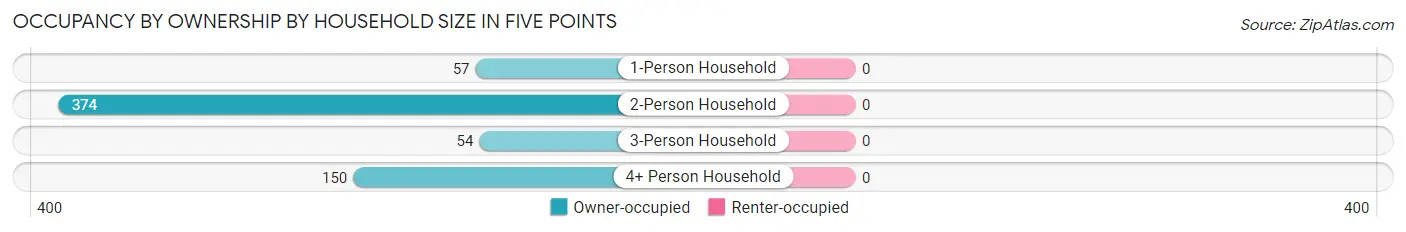
| Household Size | Owner-occupied | Renter-occupied |
| 1-Person Household | 57 (100.0%) | 0 (0.0%) |
| 2-Person Household | 374 (100.0%) | 0 (0.0%) |
| 3-Person Household | 54 (100.0%) | 0 (0.0%) |
| 4+ Person Household | 150 (100.0%) | 0 (0.0%) |
| Total Housing Units | 635 (100.0%) | 0 (0.0%) |
Occupancy by Educational Attainment in Five Points
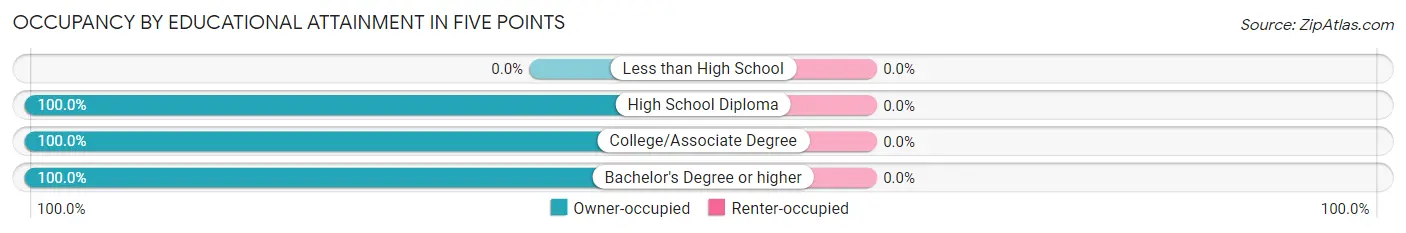
| Household Size | Owner-occupied | Renter-occupied |
| Less than High School | 0 (0.0%) | 0 (0.0%) |
| High School Diploma | 168 (100.0%) | 0 (0.0%) |
| College/Associate Degree | 163 (100.0%) | 0 (0.0%) |
| Bachelor's Degree or higher | 304 (100.0%) | 0 (0.0%) |
Occupancy by Age of Householder in Five Points
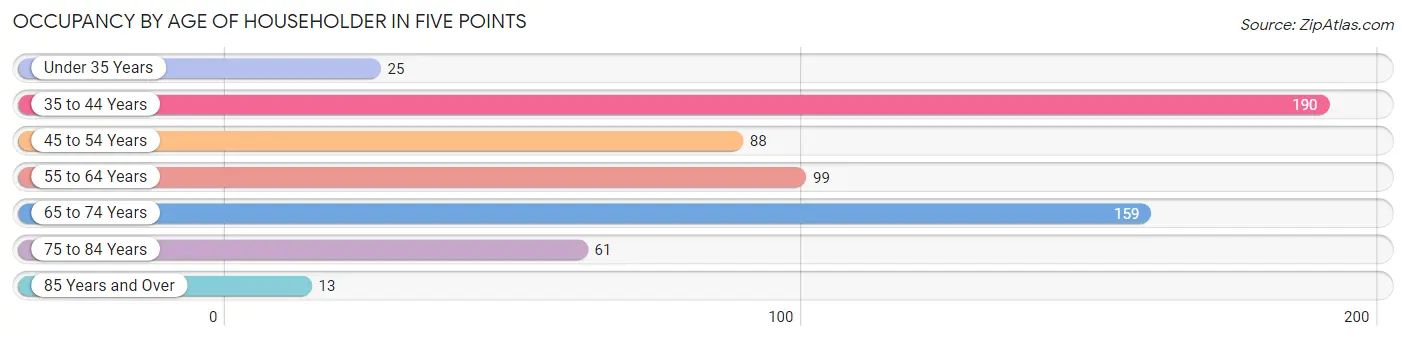
| Age Bracket | # Households | % Households |
| Under 35 Years | 25 | 3.9% |
| 35 to 44 Years | 190 | 29.9% |
| 45 to 54 Years | 88 | 13.9% |
| 55 to 64 Years | 99 | 15.6% |
| 65 to 74 Years | 159 | 25.0% |
| 75 to 84 Years | 61 | 9.6% |
| 85 Years and Over | 13 | 2.1% |
| Total | 635 | 100.0% |
Housing Finances in Five Points
Median Income by Occupancy in Five Points
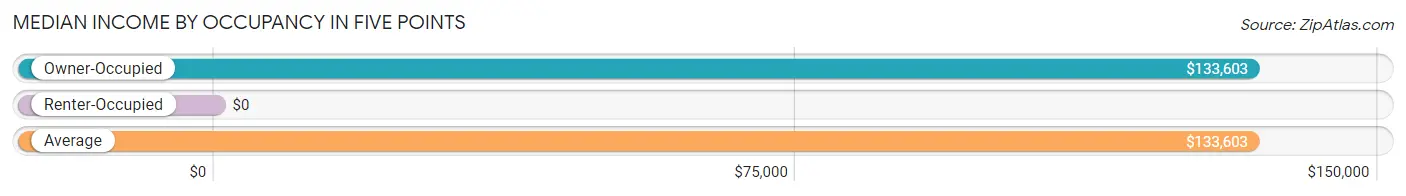
| Occupancy Type | # Households | Median Income |
| Owner-Occupied | 635 (100.0%) | $133,603 |
| Renter-Occupied | 0 (0.0%) | $0 |
| Average | 635 (100.0%) | $133,603 |
Occupancy by Householder Income Bracket in Five Points
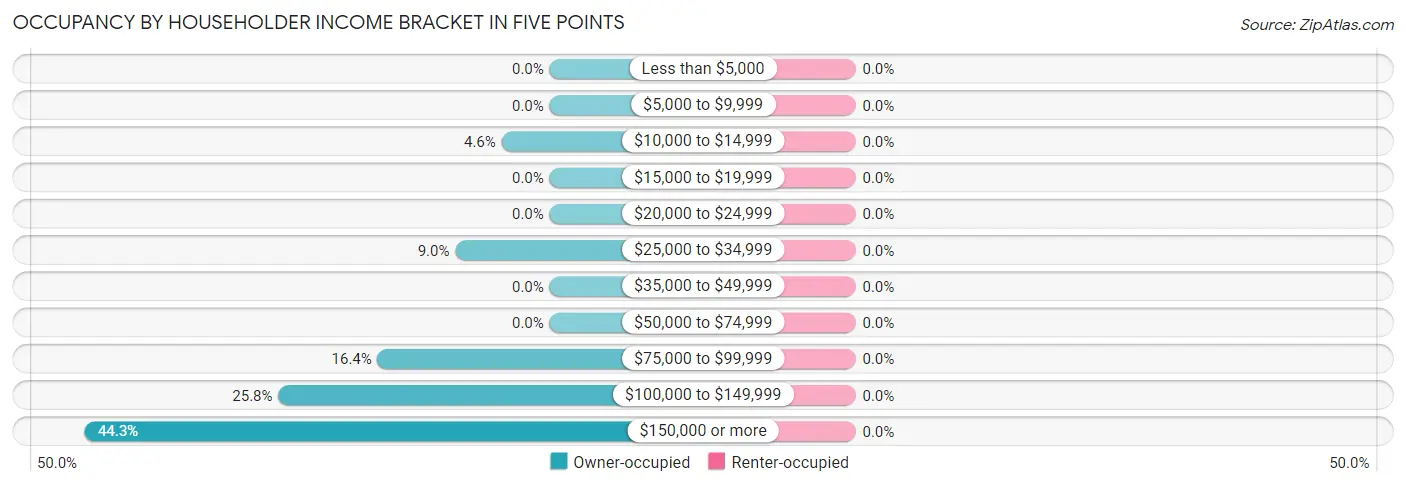
| Income Bracket | Owner-occupied | Renter-occupied |
| Less than $5,000 | 0 (0.0%) | 0 (0.0%) |
| $5,000 to $9,999 | 0 (0.0%) | 0 (0.0%) |
| $10,000 to $14,999 | 29 (4.6%) | 0 (0.0%) |
| $15,000 to $19,999 | 0 (0.0%) | 0 (0.0%) |
| $20,000 to $24,999 | 0 (0.0%) | 0 (0.0%) |
| $25,000 to $34,999 | 57 (9.0%) | 0 (0.0%) |
| $35,000 to $49,999 | 0 (0.0%) | 0 (0.0%) |
| $50,000 to $74,999 | 0 (0.0%) | 0 (0.0%) |
| $75,000 to $99,999 | 104 (16.4%) | 0 (0.0%) |
| $100,000 to $149,999 | 164 (25.8%) | 0 (0.0%) |
| $150,000 or more | 281 (44.3%) | 0 (0.0%) |
| Total | 635 (100.0%) | 0 (0.0%) |
Monthly Housing Cost Tiers in Five Points
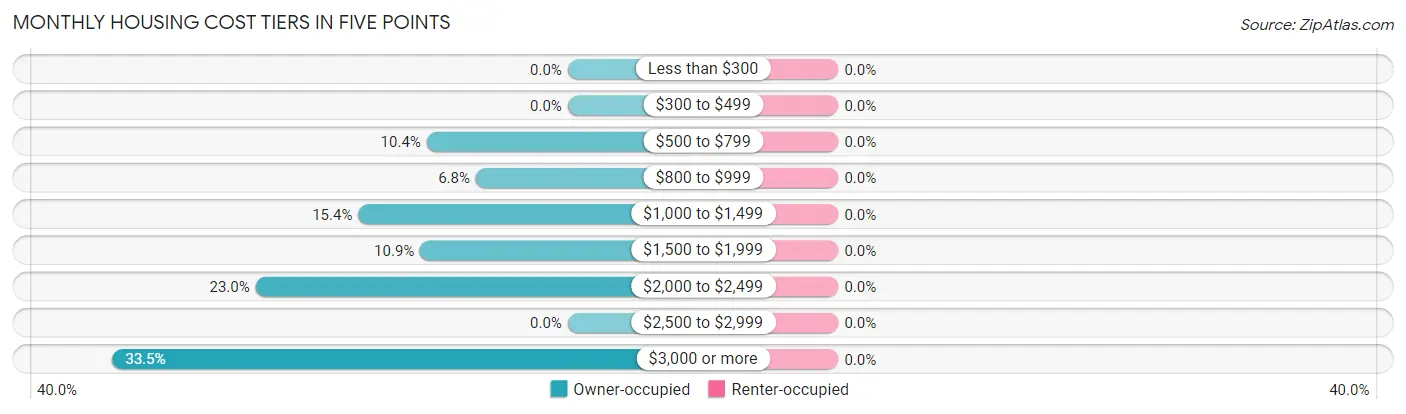
| Monthly Cost | Owner-occupied | Renter-occupied |
| Less than $300 | 0 (0.0%) | 0 (0.0%) |
| $300 to $499 | 0 (0.0%) | 0 (0.0%) |
| $500 to $799 | 66 (10.4%) | 0 (0.0%) |
| $800 to $999 | 43 (6.8%) | 0 (0.0%) |
| $1,000 to $1,499 | 98 (15.4%) | 0 (0.0%) |
| $1,500 to $1,999 | 69 (10.9%) | 0 (0.0%) |
| $2,000 to $2,499 | 146 (23.0%) | 0 (0.0%) |
| $2,500 to $2,999 | 0 (0.0%) | 0 (0.0%) |
| $3,000 or more | 213 (33.5%) | 0 (0.0%) |
| Total | 635 (100.0%) | 0 (0.0%) |
Physical Housing Characteristics in Five Points
Housing Structures in Five Points
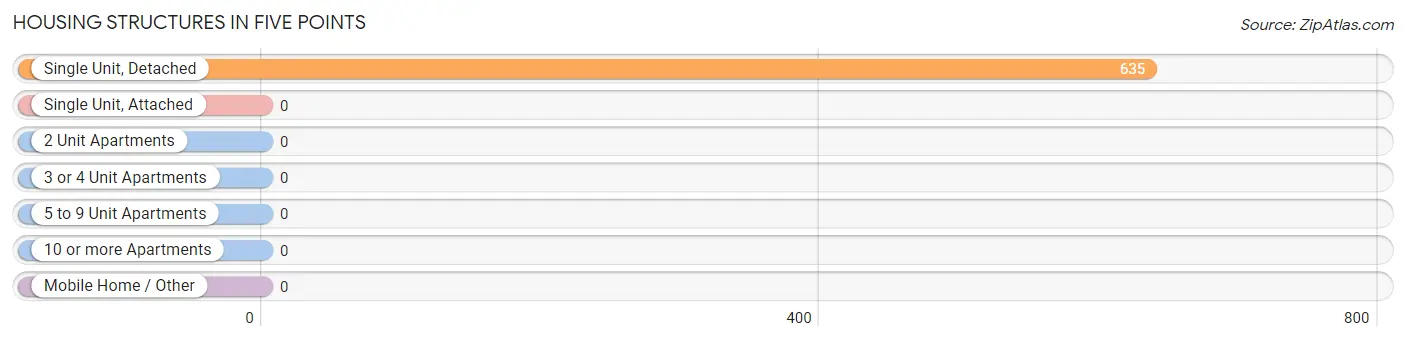
| Structure Type | # Housing Units | % Housing Units |
| Single Unit, Detached | 635 | 100.0% |
| Single Unit, Attached | 0 | 0.0% |
| 2 Unit Apartments | 0 | 0.0% |
| 3 or 4 Unit Apartments | 0 | 0.0% |
| 5 to 9 Unit Apartments | 0 | 0.0% |
| 10 or more Apartments | 0 | 0.0% |
| Mobile Home / Other | 0 | 0.0% |
| Total | 635 | 100.0% |
Housing Structures by Occupancy in Five Points
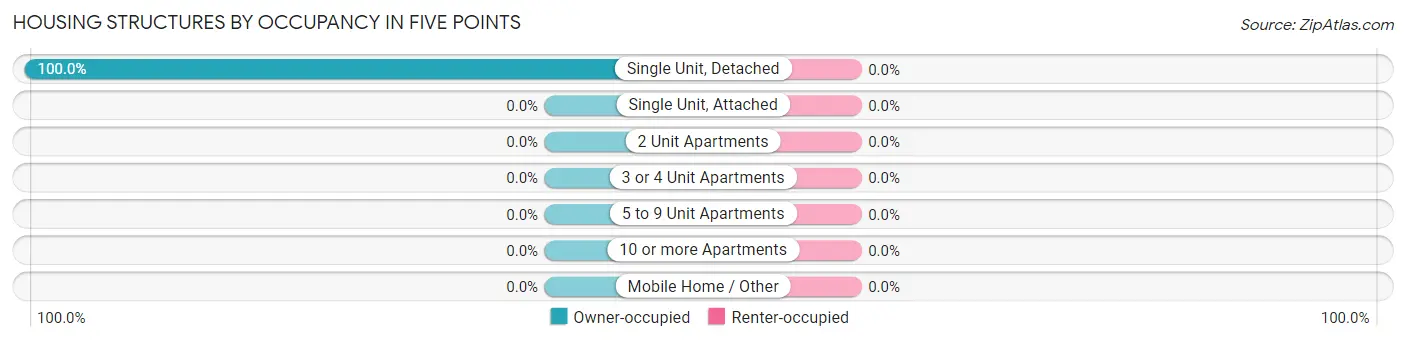
| Structure Type | Owner-occupied | Renter-occupied |
| Single Unit, Detached | 635 (100.0%) | 0 (0.0%) |
| Single Unit, Attached | 0 (0.0%) | 0 (0.0%) |
| 2 Unit Apartments | 0 (0.0%) | 0 (0.0%) |
| 3 or 4 Unit Apartments | 0 (0.0%) | 0 (0.0%) |
| 5 to 9 Unit Apartments | 0 (0.0%) | 0 (0.0%) |
| 10 or more Apartments | 0 (0.0%) | 0 (0.0%) |
| Mobile Home / Other | 0 (0.0%) | 0 (0.0%) |
| Total | 635 (100.0%) | 0 (0.0%) |
Housing Structures by Number of Rooms in Five Points
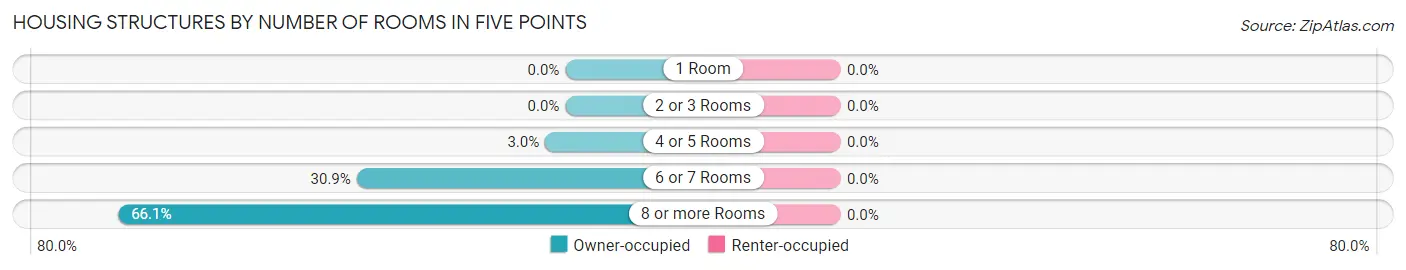
| Number of Rooms | Owner-occupied | Renter-occupied |
| 1 Room | 0 (0.0%) | 0 (0.0%) |
| 2 or 3 Rooms | 0 (0.0%) | 0 (0.0%) |
| 4 or 5 Rooms | 19 (3.0%) | 0 (0.0%) |
| 6 or 7 Rooms | 196 (30.9%) | 0 (0.0%) |
| 8 or more Rooms | 420 (66.1%) | 0 (0.0%) |
| Total | 635 (100.0%) | 0 (0.0%) |
Housing Structure by Heating Type in Five Points
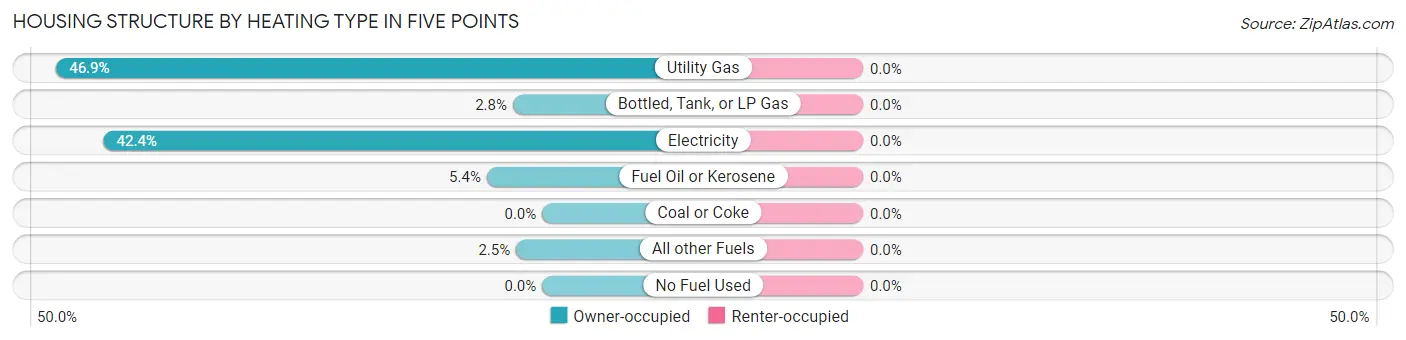
| Heating Type | Owner-occupied | Renter-occupied |
| Utility Gas | 298 (46.9%) | 0 (0.0%) |
| Bottled, Tank, or LP Gas | 18 (2.8%) | 0 (0.0%) |
| Electricity | 269 (42.4%) | 0 (0.0%) |
| Fuel Oil or Kerosene | 34 (5.3%) | 0 (0.0%) |
| Coal or Coke | 0 (0.0%) | 0 (0.0%) |
| All other Fuels | 16 (2.5%) | 0 (0.0%) |
| No Fuel Used | 0 (0.0%) | 0 (0.0%) |
| Total | 635 (100.0%) | 0 (0.0%) |
Household Vehicle Usage in Five Points
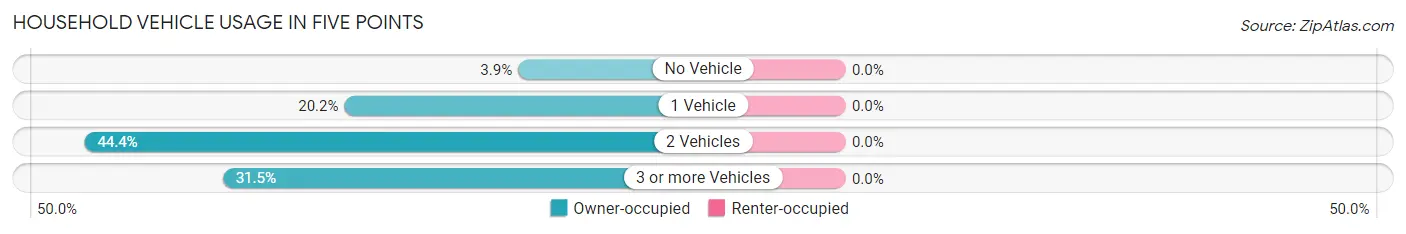
| Vehicles per Household | Owner-occupied | Renter-occupied |
| No Vehicle | 25 (3.9%) | 0 (0.0%) |
| 1 Vehicle | 128 (20.2%) | 0 (0.0%) |
| 2 Vehicles | 282 (44.4%) | 0 (0.0%) |
| 3 or more Vehicles | 200 (31.5%) | 0 (0.0%) |
| Total | 635 (100.0%) | 0 (0.0%) |
Real Estate & Mortgages in Five Points
Real Estate and Mortgage Overview in Five Points
| Characteristic | Without Mortgage | With Mortgage |
| Housing Units | 156 | 479 |
| Median Property Value | $385,200 | $418,400 |
| Median Household Income | - | - |
| Monthly Housing Costs | $841 | $213 |
| Real Estate Taxes | $4,696 | $0 |
Property Value by Mortgage Status in Five Points
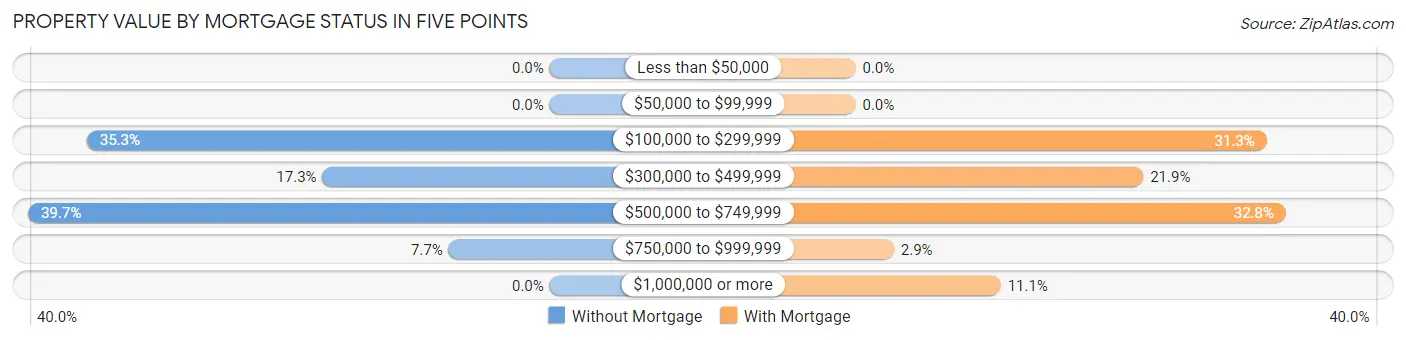
| Property Value | Without Mortgage | With Mortgage |
| Less than $50,000 | 0 (0.0%) | 0 (0.0%) |
| $50,000 to $99,999 | 0 (0.0%) | 0 (0.0%) |
| $100,000 to $299,999 | 55 (35.3%) | 150 (31.3%) |
| $300,000 to $499,999 | 27 (17.3%) | 105 (21.9%) |
| $500,000 to $749,999 | 62 (39.7%) | 157 (32.8%) |
| $750,000 to $999,999 | 12 (7.7%) | 14 (2.9%) |
| $1,000,000 or more | 0 (0.0%) | 53 (11.1%) |
| Total | 156 (100.0%) | 479 (100.0%) |
Household Income by Mortgage Status in Five Points
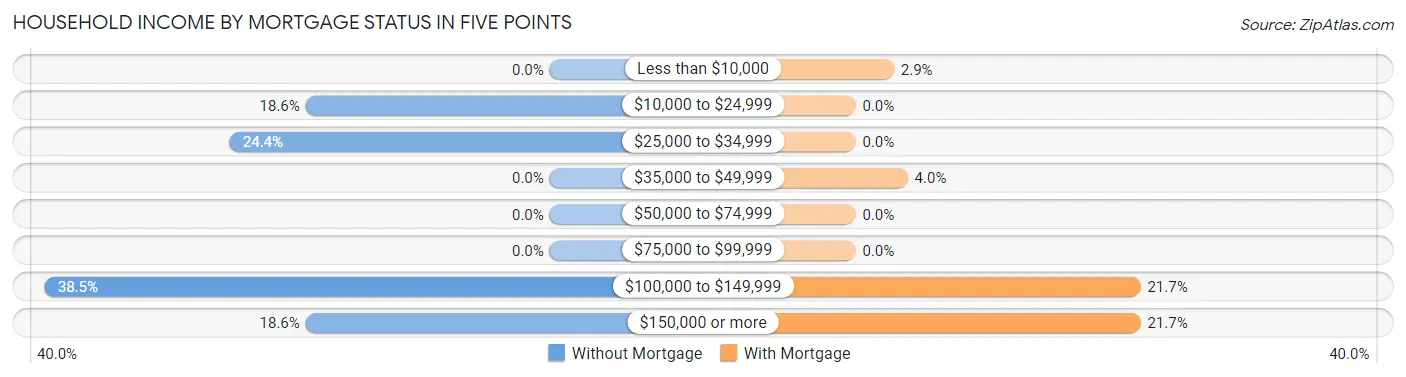
| Household Income | Without Mortgage | With Mortgage |
| Less than $10,000 | 0 (0.0%) | 14 (2.9%) |
| $10,000 to $24,999 | 29 (18.6%) | 0 (0.0%) |
| $25,000 to $34,999 | 38 (24.4%) | 0 (0.0%) |
| $35,000 to $49,999 | 0 (0.0%) | 19 (4.0%) |
| $50,000 to $74,999 | 0 (0.0%) | 0 (0.0%) |
| $75,000 to $99,999 | 0 (0.0%) | 0 (0.0%) |
| $100,000 to $149,999 | 60 (38.5%) | 104 (21.7%) |
| $150,000 or more | 29 (18.6%) | 104 (21.7%) |
| Total | 156 (100.0%) | 479 (100.0%) |
Property Value to Household Income Ratio in Five Points
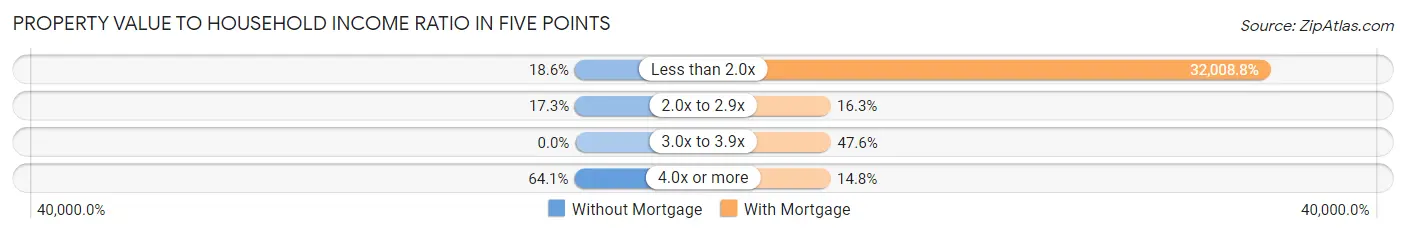
| Value-to-Income Ratio | Without Mortgage | With Mortgage |
| Less than 2.0x | 29 (18.6%) | 153,322 (32,008.8%) |
| 2.0x to 2.9x | 27 (17.3%) | 78 (16.3%) |
| 3.0x to 3.9x | 0 (0.0%) | 228 (47.6%) |
| 4.0x or more | 100 (64.1%) | 71 (14.8%) |
| Total | 156 (100.0%) | 479 (100.0%) |
Real Estate Taxes by Mortgage Status in Five Points
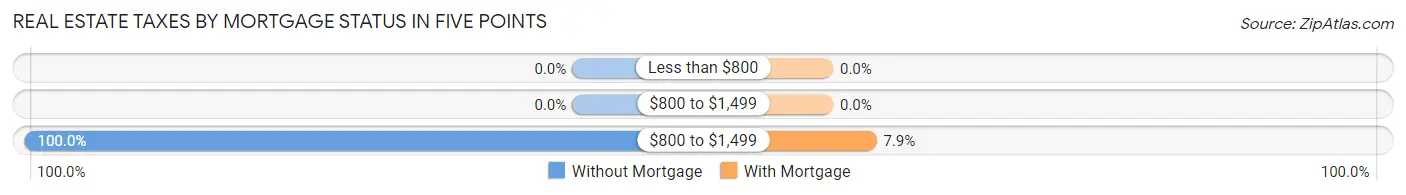
| Property Taxes | Without Mortgage | With Mortgage |
| Less than $800 | 0 (0.0%) | 0 (0.0%) |
| $800 to $1,499 | 0 (0.0%) | 0 (0.0%) |
| $800 to $1,499 | 156 (100.0%) | 38 (7.9%) |
| Total | 156 (100.0%) | 479 (100.0%) |
Health & Disability in Five Points
Health Insurance Coverage by Age in Five Points
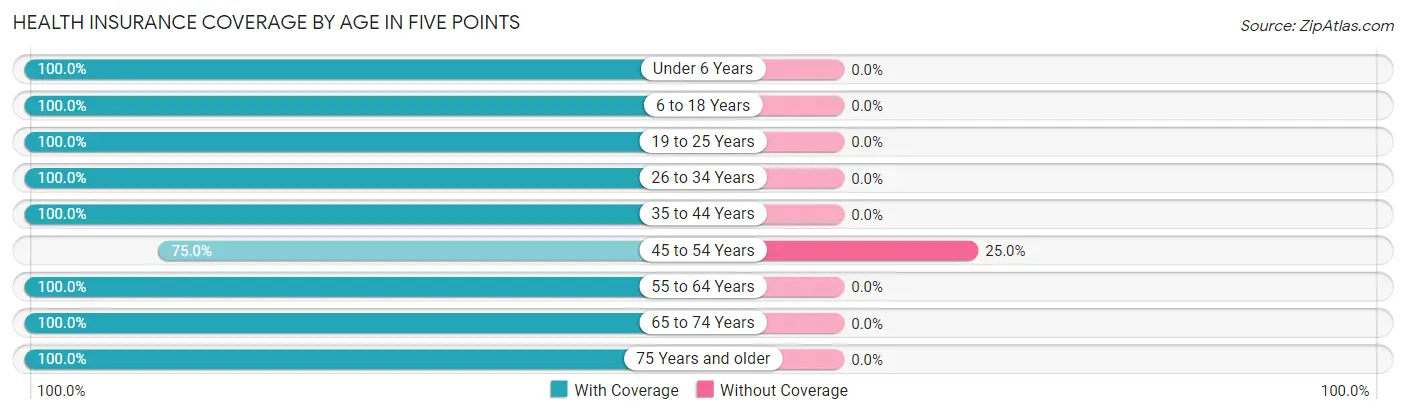
| Age Bracket | With Coverage | Without Coverage |
| Under 6 Years | 224 (100.0%) | 0 (0.0%) |
| 6 to 18 Years | 173 (100.0%) | 0 (0.0%) |
| 19 to 25 Years | 18 (100.0%) | 0 (0.0%) |
| 26 to 34 Years | 109 (100.0%) | 0 (0.0%) |
| 35 to 44 Years | 318 (100.0%) | 0 (0.0%) |
| 45 to 54 Years | 108 (75.0%) | 36 (25.0%) |
| 55 to 64 Years | 239 (100.0%) | 0 (0.0%) |
| 65 to 74 Years | 306 (100.0%) | 0 (0.0%) |
| 75 Years and older | 121 (100.0%) | 0 (0.0%) |
| Total | 1,616 (97.8%) | 36 (2.2%) |
Health Insurance Coverage by Citizenship Status in Five Points
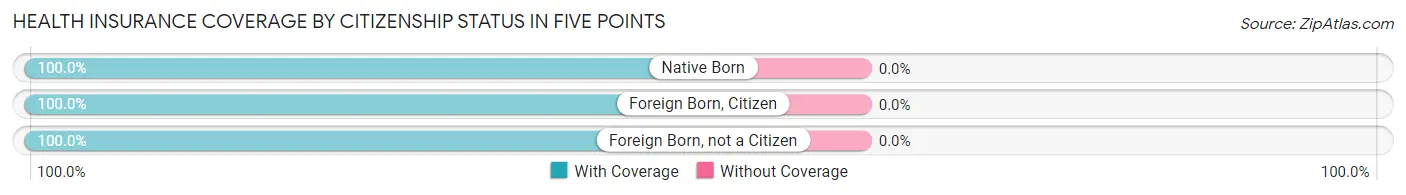
| Citizenship Status | With Coverage | Without Coverage |
| Native Born | 224 (100.0%) | 0 (0.0%) |
| Foreign Born, Citizen | 173 (100.0%) | 0 (0.0%) |
| Foreign Born, not a Citizen | 18 (100.0%) | 0 (0.0%) |
Health Insurance Coverage by Household Income in Five Points
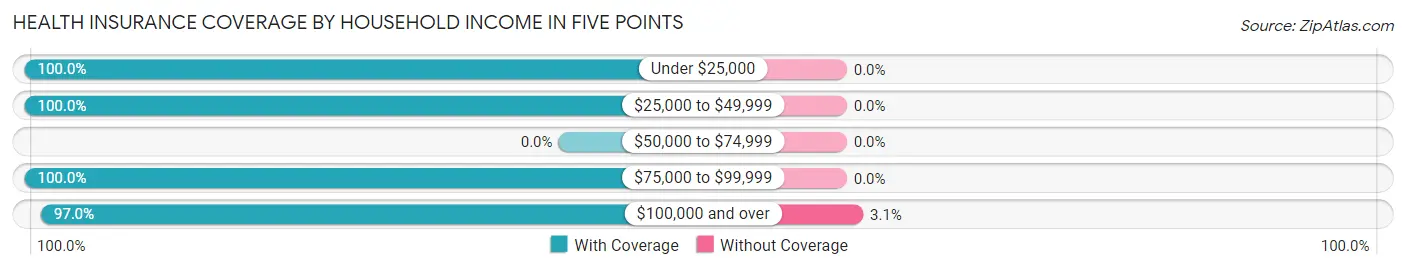
| Household Income | With Coverage | Without Coverage |
| Under $25,000 | 57 (100.0%) | 0 (0.0%) |
| $25,000 to $49,999 | 98 (100.0%) | 0 (0.0%) |
| $50,000 to $74,999 | 0 (0.0%) | 0 (0.0%) |
| $75,000 to $99,999 | 316 (100.0%) | 0 (0.0%) |
| $100,000 and over | 1,145 (97.0%) | 36 (3.0%) |
Public vs Private Health Insurance Coverage by Age in Five Points
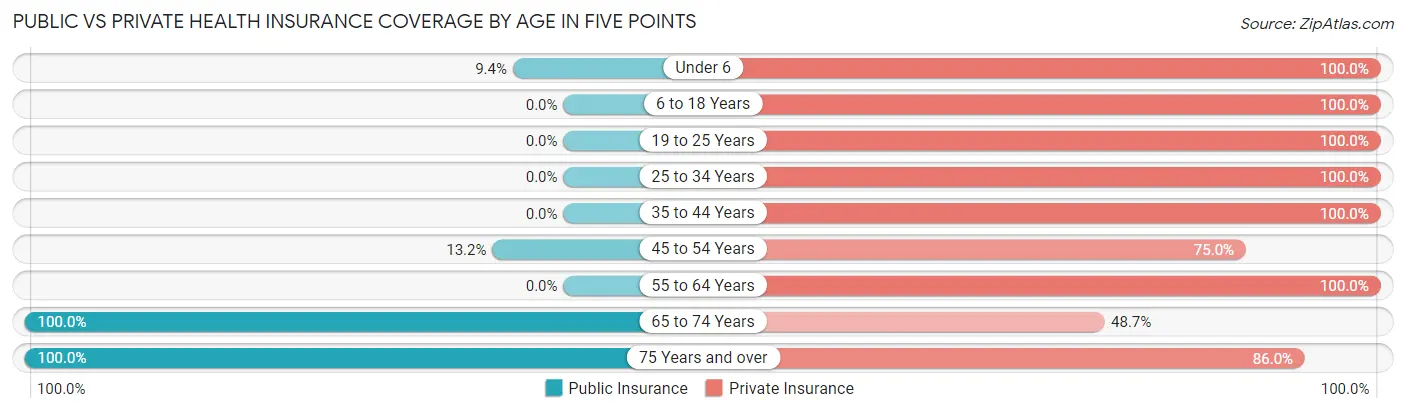
| Age Bracket | Public Insurance | Private Insurance |
| Under 6 | 21 (9.4%) | 224 (100.0%) |
| 6 to 18 Years | 0 (0.0%) | 173 (100.0%) |
| 19 to 25 Years | 0 (0.0%) | 18 (100.0%) |
| 25 to 34 Years | 0 (0.0%) | 109 (100.0%) |
| 35 to 44 Years | 0 (0.0%) | 318 (100.0%) |
| 45 to 54 Years | 19 (13.2%) | 108 (75.0%) |
| 55 to 64 Years | 0 (0.0%) | 239 (100.0%) |
| 65 to 74 Years | 306 (100.0%) | 149 (48.7%) |
| 75 Years and over | 121 (100.0%) | 104 (86.0%) |
| Total | 467 (28.3%) | 1,442 (87.3%) |
Disability Status by Sex by Age in Five Points
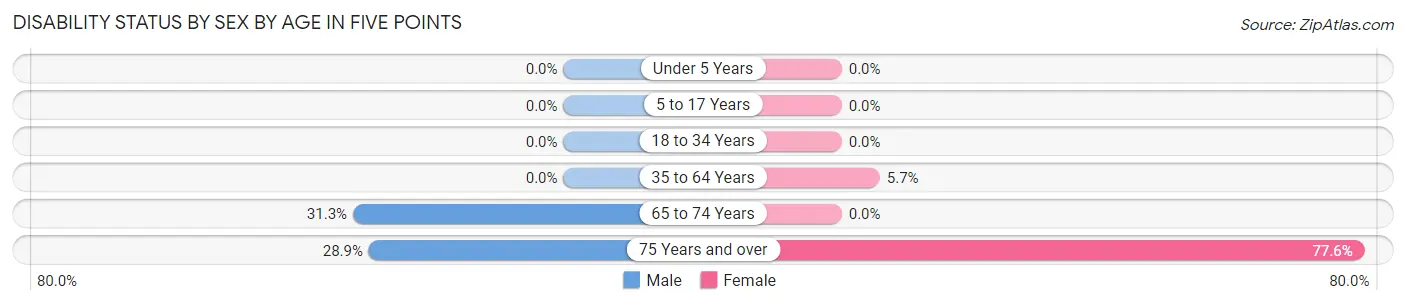
| Age Bracket | Male | Female |
| Under 5 Years | 0 (0.0%) | 0 (0.0%) |
| 5 to 17 Years | 0 (0.0%) | 0 (0.0%) |
| 18 to 34 Years | 0 (0.0%) | 0 (0.0%) |
| 35 to 64 Years | 0 (0.0%) | 19 (5.7%) |
| 65 to 74 Years | 50 (31.2%) | 0 (0.0%) |
| 75 Years and over | 13 (28.9%) | 59 (77.6%) |
Disability Class by Sex by Age in Five Points
Disability Class: Hearing Difficulty
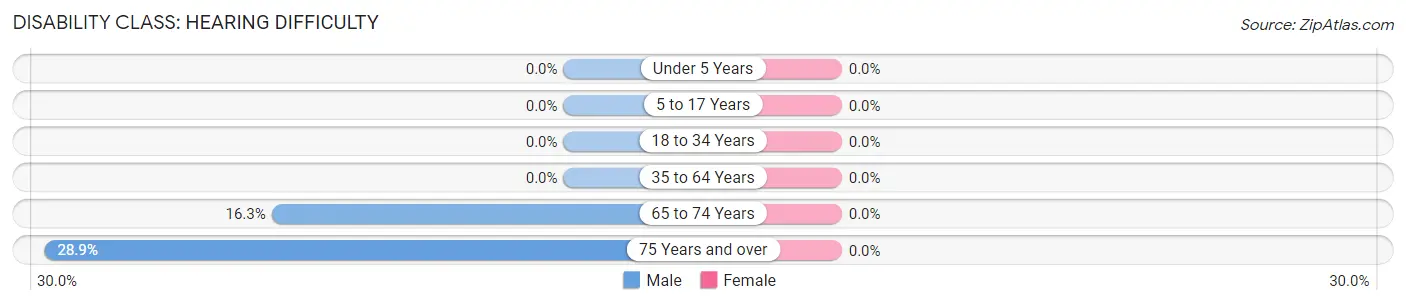
| Age Bracket | Male | Female |
| Under 5 Years | 0 (0.0%) | 0 (0.0%) |
| 5 to 17 Years | 0 (0.0%) | 0 (0.0%) |
| 18 to 34 Years | 0 (0.0%) | 0 (0.0%) |
| 35 to 64 Years | 0 (0.0%) | 0 (0.0%) |
| 65 to 74 Years | 26 (16.3%) | 0 (0.0%) |
| 75 Years and over | 13 (28.9%) | 0 (0.0%) |
Disability Class: Vision Difficulty
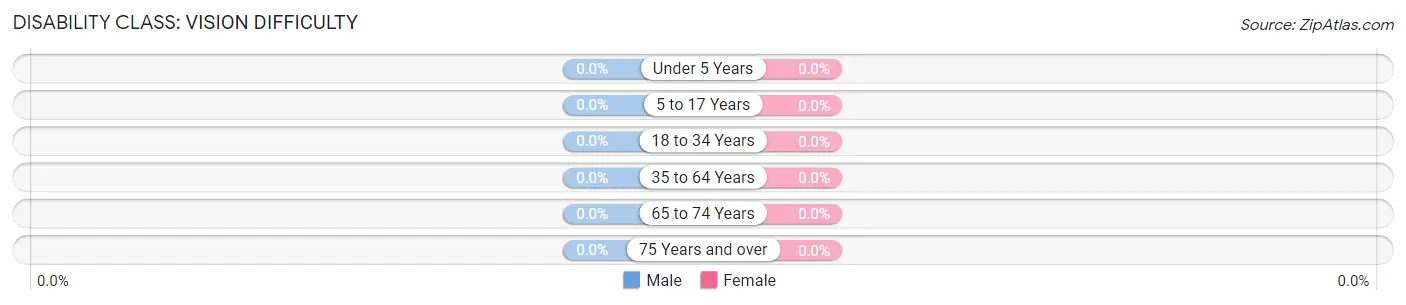
| Age Bracket | Male | Female |
| Under 5 Years | 0 (0.0%) | 0 (0.0%) |
| 5 to 17 Years | 0 (0.0%) | 0 (0.0%) |
| 18 to 34 Years | 0 (0.0%) | 0 (0.0%) |
| 35 to 64 Years | 0 (0.0%) | 0 (0.0%) |
| 65 to 74 Years | 0 (0.0%) | 0 (0.0%) |
| 75 Years and over | 0 (0.0%) | 0 (0.0%) |
Disability Class: Cognitive Difficulty
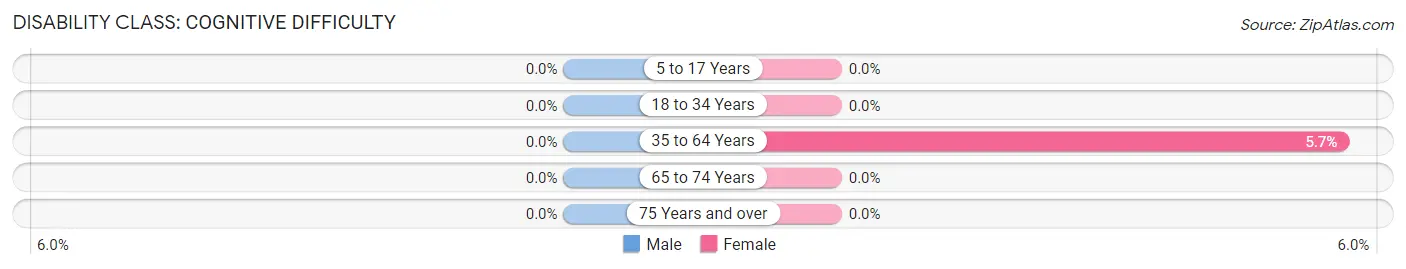
| Age Bracket | Male | Female |
| 5 to 17 Years | 0 (0.0%) | 0 (0.0%) |
| 18 to 34 Years | 0 (0.0%) | 0 (0.0%) |
| 35 to 64 Years | 0 (0.0%) | 19 (5.7%) |
| 65 to 74 Years | 0 (0.0%) | 0 (0.0%) |
| 75 Years and over | 0 (0.0%) | 0 (0.0%) |
Disability Class: Ambulatory Difficulty
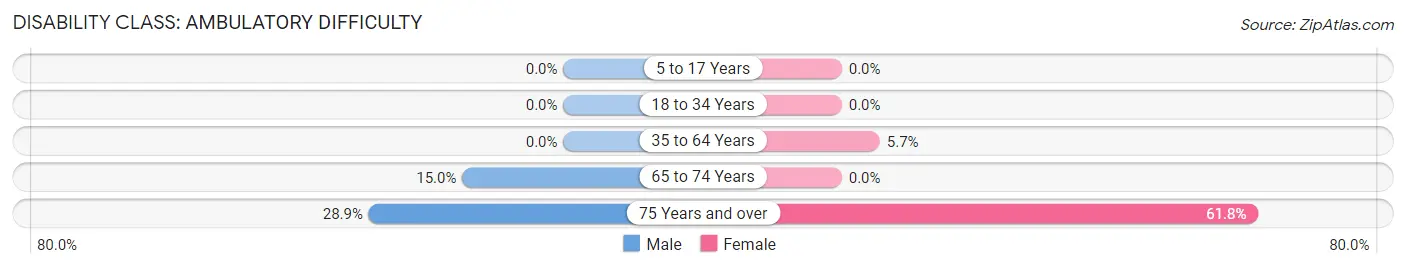
| Age Bracket | Male | Female |
| 5 to 17 Years | 0 (0.0%) | 0 (0.0%) |
| 18 to 34 Years | 0 (0.0%) | 0 (0.0%) |
| 35 to 64 Years | 0 (0.0%) | 19 (5.7%) |
| 65 to 74 Years | 24 (15.0%) | 0 (0.0%) |
| 75 Years and over | 13 (28.9%) | 47 (61.8%) |
Disability Class: Self-Care Difficulty
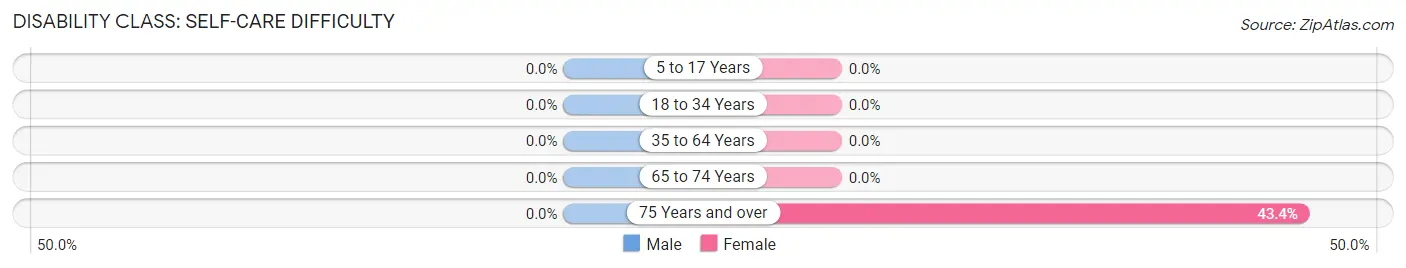
| Age Bracket | Male | Female |
| 5 to 17 Years | 0 (0.0%) | 0 (0.0%) |
| 18 to 34 Years | 0 (0.0%) | 0 (0.0%) |
| 35 to 64 Years | 0 (0.0%) | 0 (0.0%) |
| 65 to 74 Years | 0 (0.0%) | 0 (0.0%) |
| 75 Years and over | 0 (0.0%) | 33 (43.4%) |
Technology Access in Five Points
Computing Device Access in Five Points
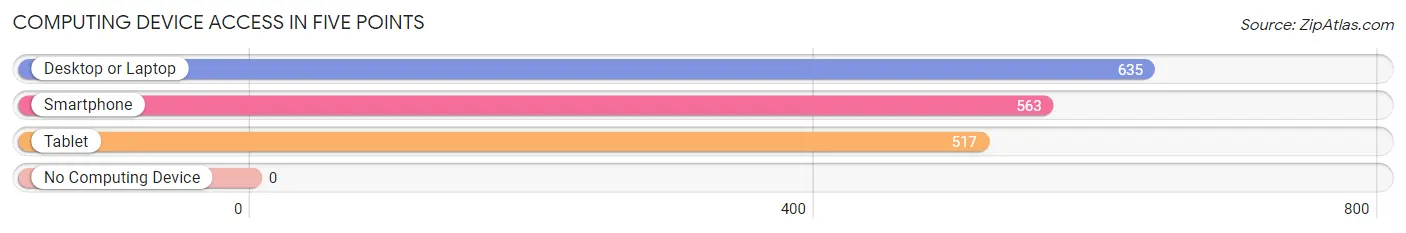
| Device Type | # Households | % Households |
| Desktop or Laptop | 635 | 100.0% |
| Smartphone | 563 | 88.7% |
| Tablet | 517 | 81.4% |
| No Computing Device | 0 | 0.0% |
| Total | 635 | 100.0% |
Internet Access in Five Points
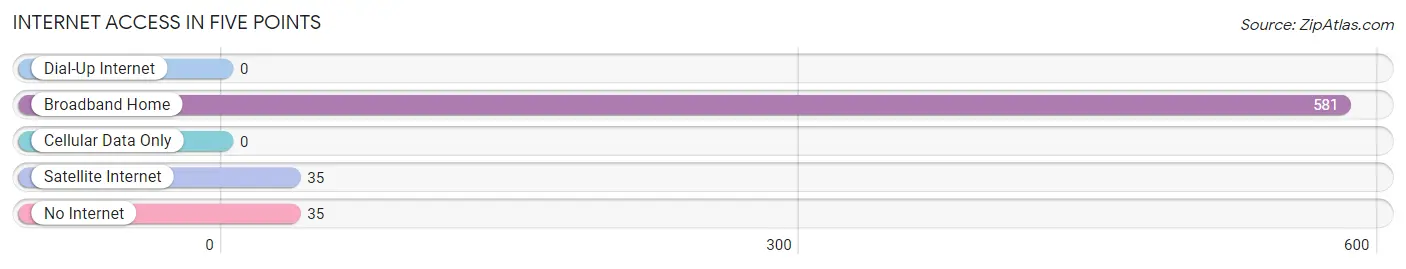
| Internet Type | # Households | % Households |
| Dial-Up Internet | 0 | 0.0% |
| Broadband Home | 581 | 91.5% |
| Cellular Data Only | 0 | 0.0% |
| Satellite Internet | 35 | 5.5% |
| No Internet | 35 | 5.5% |
| Total | 635 | 100.0% |
Five Points Summary
Five Points is a small unincorporated community located in the southeastern corner of Brown County, Ohio. It is situated along the Ohio River, approximately 10 miles south of the county seat of Georgetown. The community is named for the five points of intersection of the two roads that pass through it.
History
Five Points was first settled in the early 1800s by a group of German immigrants. The first settlers were primarily farmers, and the area was known for its fertile soil and abundant wildlife. The community was officially established in 1837, when the first post office was opened.
In the late 1800s, the area began to experience a period of growth and development. The Ohio River was a major transportation route, and the community became a hub for riverboat traffic. The town also became a popular destination for tourists, who came to enjoy the area’s natural beauty.
In the early 1900s, the town experienced a period of decline. The riverboat traffic decreased, and the population began to dwindle. However, the town was able to remain a viable community due to its proximity to the larger cities of Cincinnati and Dayton.
Geography
Five Points is located in the southeastern corner of Brown County, Ohio. It is situated along the Ohio River, approximately 10 miles south of the county seat of Georgetown. The community is surrounded by rolling hills and farmland, and is bordered by the towns of Russellville and Higginsport to the north and east, respectively.
The climate in Five Points is generally mild, with hot summers and cold winters. The average annual temperature is around 50 degrees Fahrenheit, and the average annual precipitation is around 40 inches.
Economy
The economy of Five Points is largely based on agriculture. The area is known for its fertile soil and abundant wildlife, and the town is home to several farms and agricultural businesses. The town also has a small manufacturing sector, which produces a variety of products, including furniture, clothing, and food products.
In addition to agriculture and manufacturing, Five Points is also home to a number of small businesses, including restaurants, retail stores, and service providers. The town also has a small tourism industry, which attracts visitors from nearby cities and towns.
Demographics
As of the 2010 census, the population of Five Points was 1,093. The racial makeup of the town was 97.3% White, 0.7% African American, 0.3% Native American, 0.2% Asian, and 1.5% from other races. The median household income was $37,917, and the median family income was $45,625.
The town is home to a variety of religious denominations, including Baptist, Methodist, and Catholic. The town also has a small Jewish population. The town is served by the Brown County School District, which includes two elementary schools, one middle school, and one high school.
Conclusion
Five Points is a small unincorporated community located in the southeastern corner of Brown County, Ohio. It is situated along the Ohio River, approximately 10 miles south of the county seat of Georgetown. The community is named for the five points of intersection of the two roads that pass through it. The economy of Five Points is largely based on agriculture, and the town is also home to a number of small businesses. The population of Five Points was 1,093 as of the 2010 census, and the town is home to a variety of religious denominations.
Common Questions
What is Per Capita Income in Five Points?
Per Capita income in Five Points is $69,195.
What is the Median Family Income in Five Points?
Median Family Income in Five Points is $152,533.
What is the Median Household income in Five Points?
Median Household Income in Five Points is $133,603.
What is Income or Wage Gap in Five Points?
Income or Wage Gap in Five Points is 69.1%.
Women in Five Points earn 30.9 cents for every dollar earned by a man.
What is Inequality or Gini Index in Five Points?
Inequality or Gini Index in Five Points is 0.40.
What is the Total Population of Five Points?
Total Population of Five Points is 1,652.
What is the Total Male Population of Five Points?
Total Male Population of Five Points is 748.
What is the Total Female Population of Five Points?
Total Female Population of Five Points is 904.
What is the Ratio of Males per 100 Females in Five Points?
There are 82.74 Males per 100 Females in Five Points.
What is the Ratio of Females per 100 Males in Five Points?
There are 120.86 Females per 100 Males in Five Points.
What is the Median Population Age in Five Points?
Median Population Age in Five Points is 44.7 Years.
What is the Average Family Size in Five Points
Average Family Size in Five Points is 2.8 People.
What is the Average Household Size in Five Points
Average Household Size in Five Points is 2.6 People.
How Large is the Labor Force in Five Points?
There are 745 People in the Labor Forcein in Five Points.
What is the Percentage of People in the Labor Force in Five Points?
59.4% of People are in the Labor Force in Five Points.
What is the Unemployment Rate in Five Points?
Unemployment Rate in Five Points is 7.6%.