Riverlea, OH Map & Demographics
Riverlea Map
Riverlea Overview
$80,265
PER CAPITA INCOME
$211,250
AVG FAMILY INCOME
$153,750
AVG HOUSEHOLD INCOME
39.1%
WAGE / INCOME GAP [ % ]
60.9¢/ $1
WAGE / INCOME GAP [ $ ]
0.39
INEQUALITY / GINI INDEX
515
TOTAL POPULATION
252
MALE POPULATION
263
FEMALE POPULATION
95.82
MALES / 100 FEMALES
104.37
FEMALES / 100 MALES
45.5
MEDIAN AGE
3.1
AVG FAMILY SIZE
2.5
AVG HOUSEHOLD SIZE
292
LABOR FORCE [ PEOPLE ]
74.1%
PERCENT IN LABOR FORCE
2.1%
UNEMPLOYMENT RATE
Income in Riverlea
Income Overview in Riverlea
Per Capita Income in Riverlea is $80,265, while median incomes of families and households are $211,250 and $153,750 respectively.
| Characteristic | Number | Measure |
| Per Capita Income | 515 | $80,265 |
| Median Family Income | 142 | $211,250 |
| Mean Family Income | 142 | $243,982 |
| Median Household Income | 207 | $153,750 |
| Mean Household Income | 207 | $194,999 |
| Income Deficit | 142 | $0 |
| Wage / Income Gap (%) | 515 | 39.11% |
| Wage / Income Gap ($) | 515 | 60.89¢ per $1 |
| Gini / Inequality Index | 515 | 0.39 |
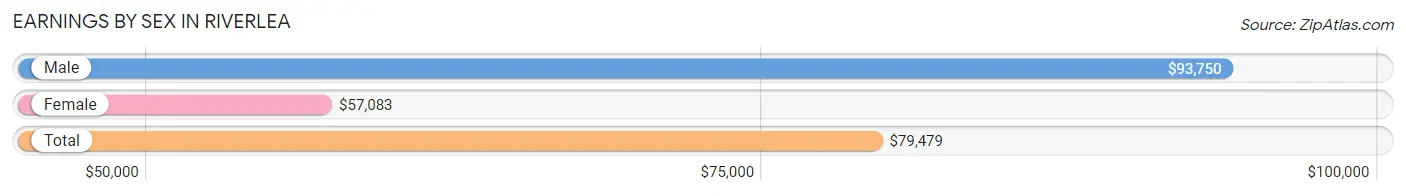
Earnings by Sex in Riverlea
Average Earnings in Riverlea are $79,479, $93,750 for men and $57,083 for women, a difference of 39.1%.
| Sex | Number | Average Earnings |
| Male | 160 (51.1%) | $93,750 |
| Female | 153 (48.9%) | $57,083 |
| Total | 313 (100.0%) | $79,479 |
Earnings by Sex by Income Bracket in Riverlea
The most common earnings brackets in Riverlea are $100,000+ for men (76 | 47.5%) and $100,000+ for women (45 | 29.4%).
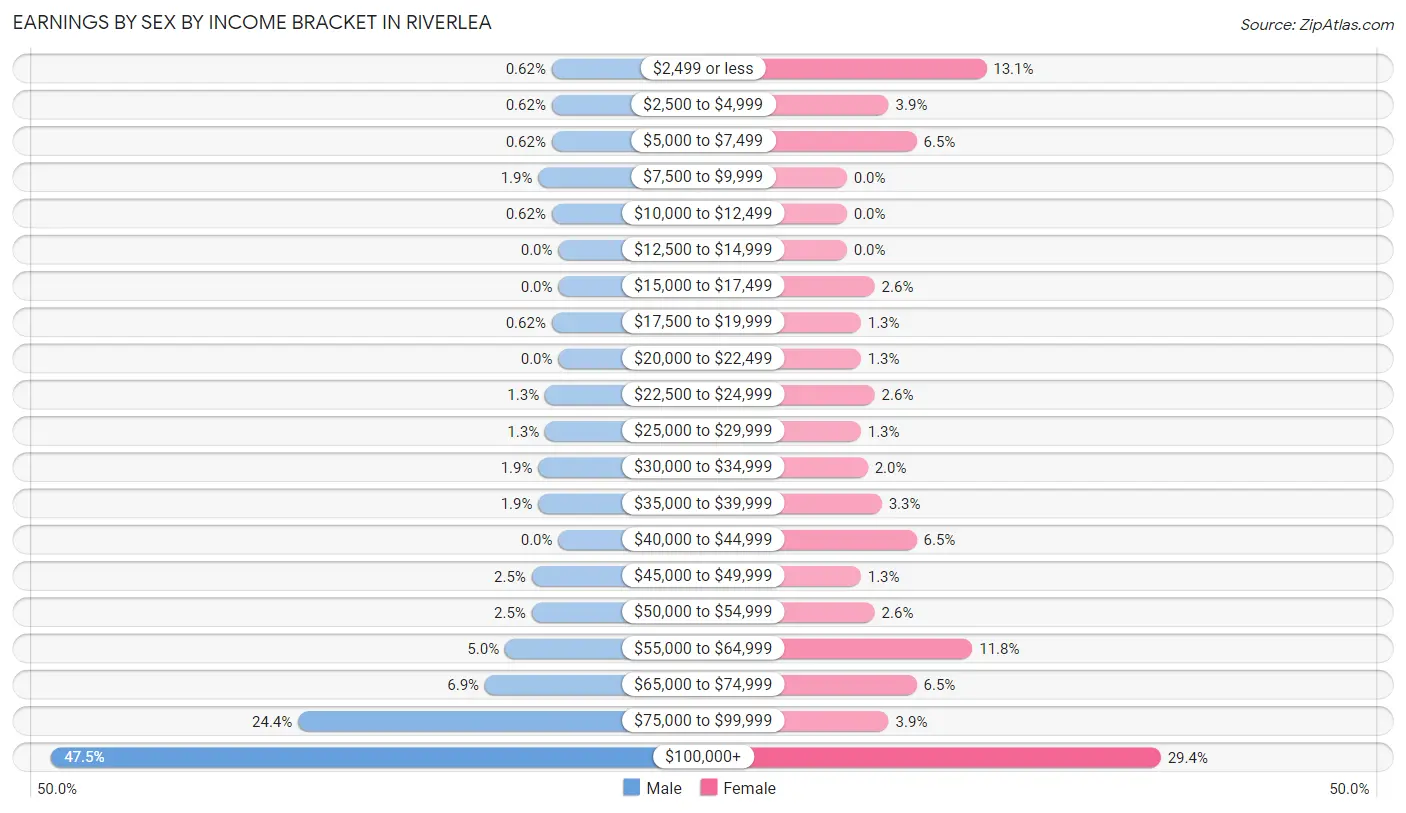
| Income | Male | Female |
| $2,499 or less | 1 (0.6%) | 20 (13.1%) |
| $2,500 to $4,999 | 1 (0.6%) | 6 (3.9%) |
| $5,000 to $7,499 | 1 (0.6%) | 10 (6.5%) |
| $7,500 to $9,999 | 3 (1.9%) | 0 (0.0%) |
| $10,000 to $12,499 | 1 (0.6%) | 0 (0.0%) |
| $12,500 to $14,999 | 0 (0.0%) | 0 (0.0%) |
| $15,000 to $17,499 | 0 (0.0%) | 4 (2.6%) |
| $17,500 to $19,999 | 1 (0.6%) | 2 (1.3%) |
| $20,000 to $22,499 | 0 (0.0%) | 2 (1.3%) |
| $22,500 to $24,999 | 2 (1.3%) | 4 (2.6%) |
| $25,000 to $29,999 | 2 (1.3%) | 2 (1.3%) |
| $30,000 to $34,999 | 3 (1.9%) | 3 (2.0%) |
| $35,000 to $39,999 | 3 (1.9%) | 5 (3.3%) |
| $40,000 to $44,999 | 0 (0.0%) | 10 (6.5%) |
| $45,000 to $49,999 | 4 (2.5%) | 2 (1.3%) |
| $50,000 to $54,999 | 4 (2.5%) | 4 (2.6%) |
| $55,000 to $64,999 | 8 (5.0%) | 18 (11.8%) |
| $65,000 to $74,999 | 11 (6.9%) | 10 (6.5%) |
| $75,000 to $99,999 | 39 (24.4%) | 6 (3.9%) |
| $100,000+ | 76 (47.5%) | 45 (29.4%) |
| Total | 160 (100.0%) | 153 (100.0%) |
Earnings by Sex by Educational Attainment in Riverlea
Average earnings in Riverlea are $94,375 for men and $62,083 for women, a difference of 34.2%. Men with an educational attainment of bachelor's degree enjoy the highest average annual earnings of $110,000, while those with college or associate's degree education earn the least with $48,750. Women with an educational attainment of bachelor's degree earn the most with the average annual earnings of $73,125, while those with graduate degree education have the smallest earnings of $67,500.
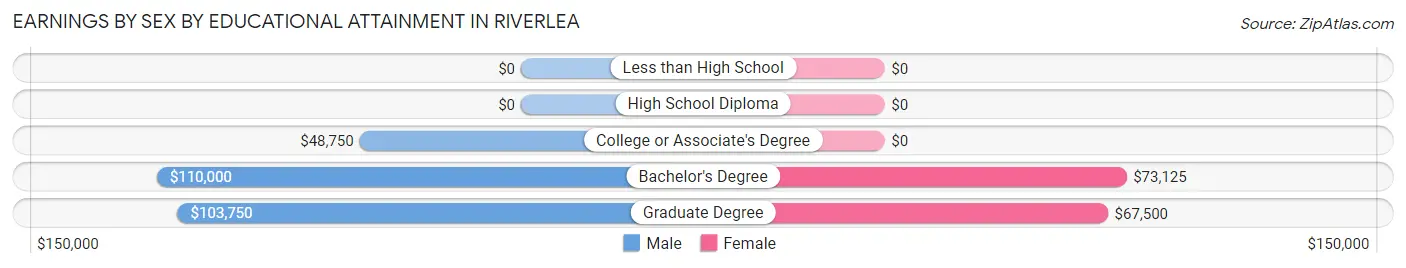
| Educational Attainment | Male Income | Female Income |
| Less than High School | - | - |
| High School Diploma | - | - |
| College or Associate's Degree | $48,750 | $0 |
| Bachelor's Degree | $110,000 | $73,125 |
| Graduate Degree | $103,750 | $67,500 |
| Total | $94,375 | $62,083 |
Family Income in Riverlea
Family Income Brackets in Riverlea
According to the Riverlea family income data, there are 80 families falling into the $200,000+ income range, which is the most common income bracket and makes up 56.3% of all families.
| Income Bracket | # Families | % Families |
| Less than $10,000 | 0 | 0.0% |
| $10,000 to $14,999 | 0 | 0.0% |
| $15,000 to $24,999 | 1 | 0.7% |
| $25,000 to $34,999 | 2 | 1.4% |
| $35,000 to $49,999 | 0 | 0.0% |
| $50,000 to $74,999 | 10 | 7.0% |
| $75,000 to $99,999 | 3 | 2.1% |
| $100,000 to $149,999 | 25 | 17.6% |
| $150,000 to $199,999 | 21 | 14.8% |
| $200,000+ | 80 | 56.3% |
Family Income by Famaliy Size in Riverlea
3-person families (37 | 26.1%) account for the highest median family income in Riverlea with $250,001 per family, while 3-person families (37 | 26.1%) have the highest median income of $83,334 per family member.
| Income Bracket | # Families | Median Income |
| 2-Person Families | 58 (40.8%) | $155,000 |
| 3-Person Families | 37 (26.1%) | $250,001 |
| 4-Person Families | 34 (23.9%) | $193,750 |
| 5-Person Families | 11 (7.7%) | $250,001 |
| 6-Person Families | 1 (0.7%) | $0 |
| 7+ Person Families | 1 (0.7%) | $0 |
| Total | 142 (100.0%) | $211,250 |
Family Income by Number of Earners in Riverlea
| Number of Earners | # Families | Median Income |
| No Earners | 12 (8.5%) | $103,750 |
| 1 Earner | 26 (18.3%) | $0 |
| 2 Earners | 81 (57.0%) | $243,750 |
| 3+ Earners | 23 (16.2%) | $232,292 |
| Total | 142 (100.0%) | $211,250 |
Household Income in Riverlea
Household Income Brackets in Riverlea
With 82 households falling in the category, the $200,000+ income range is the most frequent in Riverlea, accounting for 39.6% of all households.
| Income Bracket | # Households | % Households |
| Less than $10,000 | 0 | 0.0% |
| $10,000 to $14,999 | 0 | 0.0% |
| $15,000 to $24,999 | 4 | 1.9% |
| $25,000 to $34,999 | 4 | 1.9% |
| $35,000 to $49,999 | 8 | 3.9% |
| $50,000 to $74,999 | 21 | 10.1% |
| $75,000 to $99,999 | 27 | 13.0% |
| $100,000 to $149,999 | 36 | 17.4% |
| $150,000 to $199,999 | 25 | 12.1% |
| $200,000+ | 82 | 39.6% |
Household Income by Householder Age in Riverlea
The median household income in Riverlea is $153,750, with the highest median household income of $248,125 found in the 45 to 64 years age bracket for the primary householder. A total of 89 households (43.0%) fall into this category.
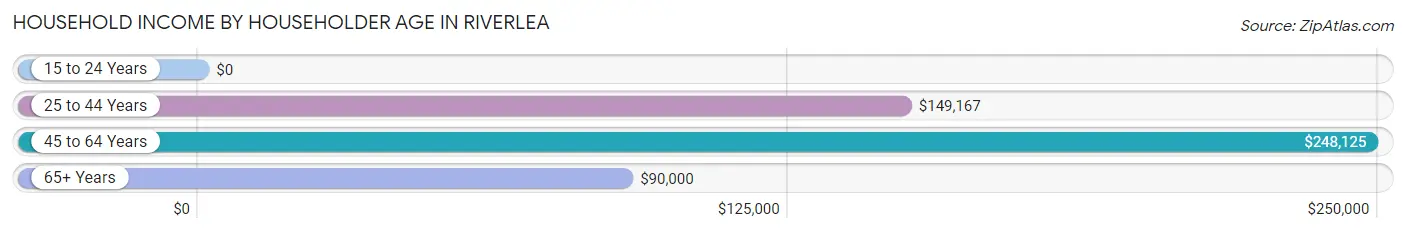
| Income Bracket | # Households | Median Income |
| 15 to 24 Years | 0 (0.0%) | $0 |
| 25 to 44 Years | 52 (25.1%) | $149,167 |
| 45 to 64 Years | 89 (43.0%) | $248,125 |
| 65+ Years | 66 (31.9%) | $90,000 |
| Total | 207 (100.0%) | $153,750 |
Poverty in Riverlea
Income Below Poverty by Sex and Age in Riverlea
With 1.2% poverty level for males and 0.8% for females among the residents of Riverlea, 65 to 74 year old males and 65 to 74 year old females are the most vulnerable to poverty, with 1 males (3.6%) and 2 females (6.1%) in their respective age groups living below the poverty level.
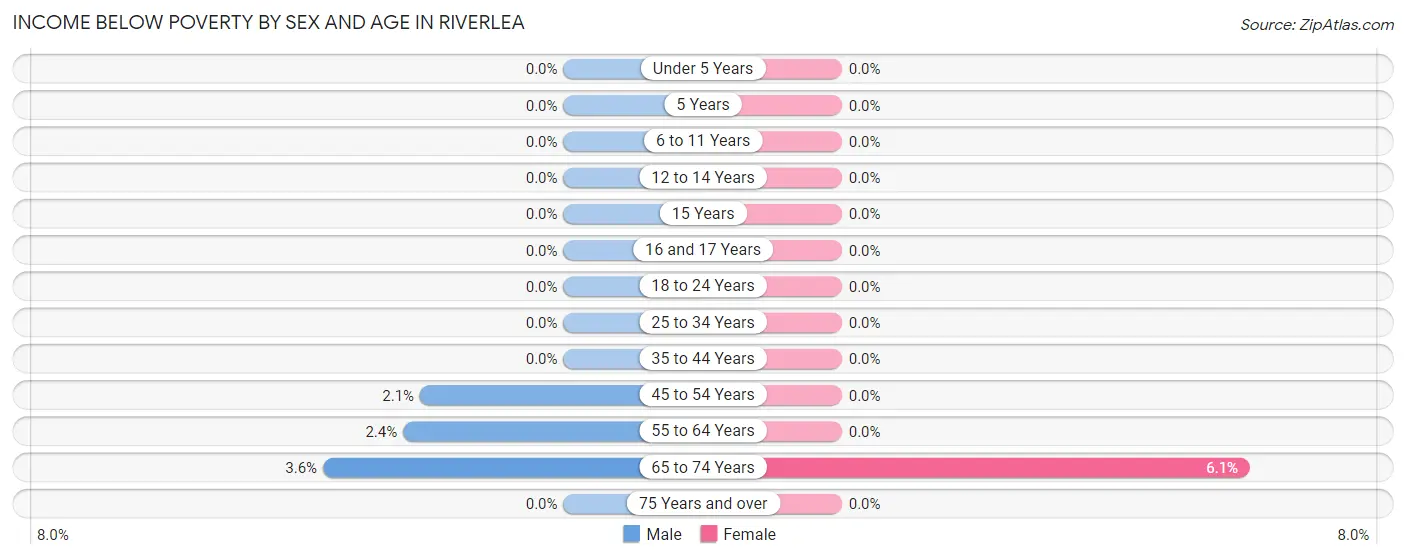
| Age Bracket | Male | Female |
| Under 5 Years | 0 (0.0%) | 0 (0.0%) |
| 5 Years | 0 (0.0%) | 0 (0.0%) |
| 6 to 11 Years | 0 (0.0%) | 0 (0.0%) |
| 12 to 14 Years | 0 (0.0%) | 0 (0.0%) |
| 15 Years | 0 (0.0%) | 0 (0.0%) |
| 16 and 17 Years | 0 (0.0%) | 0 (0.0%) |
| 18 to 24 Years | 0 (0.0%) | 0 (0.0%) |
| 25 to 34 Years | 0 (0.0%) | 0 (0.0%) |
| 35 to 44 Years | 0 (0.0%) | 0 (0.0%) |
| 45 to 54 Years | 1 (2.1%) | 0 (0.0%) |
| 55 to 64 Years | 1 (2.4%) | 0 (0.0%) |
| 65 to 74 Years | 1 (3.6%) | 2 (6.1%) |
| 75 Years and over | 0 (0.0%) | 0 (0.0%) |
| Total | 3 (1.2%) | 2 (0.8%) |
Income Above Poverty by Sex and Age in Riverlea
According to the poverty statistics in Riverlea, males aged under 5 years and females aged under 5 years are the age groups that are most secure financially, with 100.0% of males and 100.0% of females in these age groups living above the poverty line.
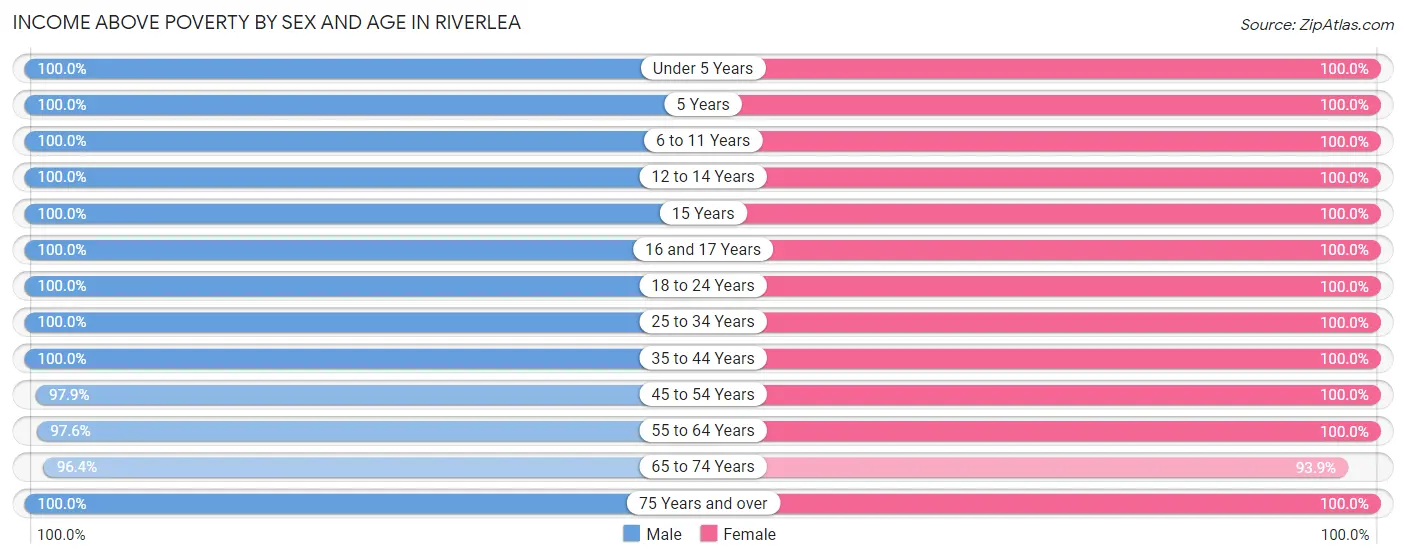
| Age Bracket | Male | Female |
| Under 5 Years | 5 (100.0%) | 12 (100.0%) |
| 5 Years | 6 (100.0%) | 3 (100.0%) |
| 6 to 11 Years | 24 (100.0%) | 13 (100.0%) |
| 12 to 14 Years | 20 (100.0%) | 24 (100.0%) |
| 15 Years | 6 (100.0%) | 5 (100.0%) |
| 16 and 17 Years | 5 (100.0%) | 8 (100.0%) |
| 18 to 24 Years | 7 (100.0%) | 20 (100.0%) |
| 25 to 34 Years | 12 (100.0%) | 8 (100.0%) |
| 35 to 44 Years | 36 (100.0%) | 38 (100.0%) |
| 45 to 54 Years | 46 (97.9%) | 33 (100.0%) |
| 55 to 64 Years | 41 (97.6%) | 43 (100.0%) |
| 65 to 74 Years | 27 (96.4%) | 31 (93.9%) |
| 75 Years and over | 11 (100.0%) | 23 (100.0%) |
| Total | 246 (98.8%) | 261 (99.2%) |
Income Below Poverty Among Married-Couple Families in Riverlea
The poverty statistics for married-couple families in Riverlea show that 0.8% or 1 of the total 131 families live below the poverty line. Families with no children have the highest poverty rate of 1.6%, comprising of 1 families. On the other hand, families with 1 or 2 children have the lowest poverty rate of 0.0%, which includes 0 families.
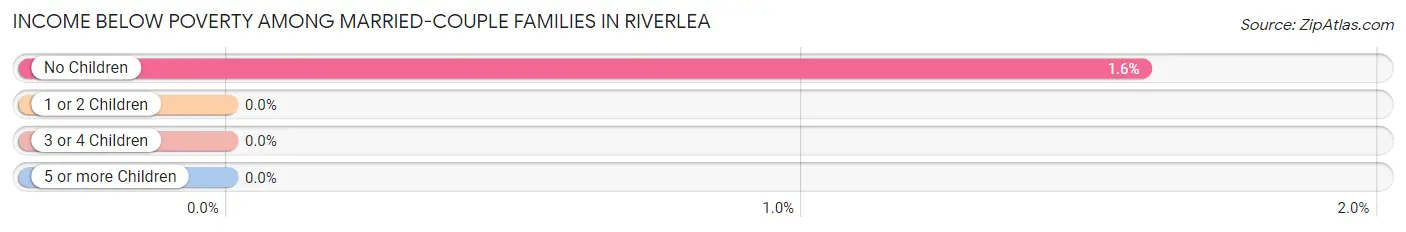
| Children | Above Poverty | Below Poverty |
| No Children | 62 (98.4%) | 1 (1.6%) |
| 1 or 2 Children | 60 (100.0%) | 0 (0.0%) |
| 3 or 4 Children | 7 (100.0%) | 0 (0.0%) |
| 5 or more Children | 1 (100.0%) | 0 (0.0%) |
| Total | 130 (99.2%) | 1 (0.8%) |
Income Below Poverty Among Single-Parent Households in Riverlea
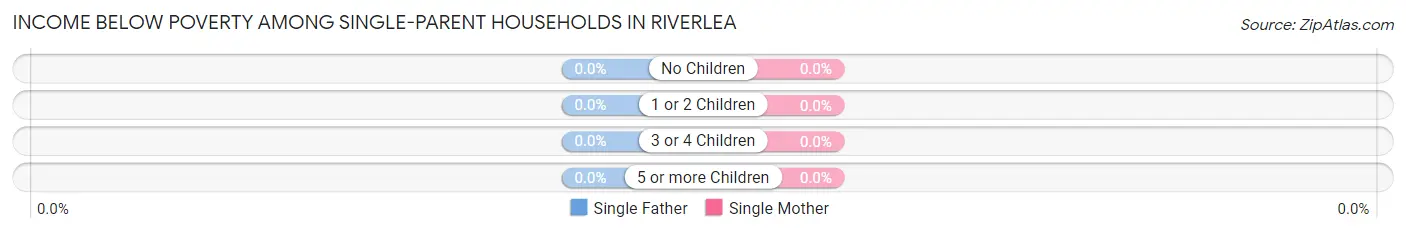
| Children | Single Father | Single Mother |
| No Children | 0 (0.0%) | 0 (0.0%) |
| 1 or 2 Children | 0 (0.0%) | 0 (0.0%) |
| 3 or 4 Children | 0 (0.0%) | 0 (0.0%) |
| 5 or more Children | 0 (0.0%) | 0 (0.0%) |
| Total | 0 (0.0%) | 0 (0.0%) |
Income Below Poverty Among Married-Couple vs Single-Parent Households in Riverlea
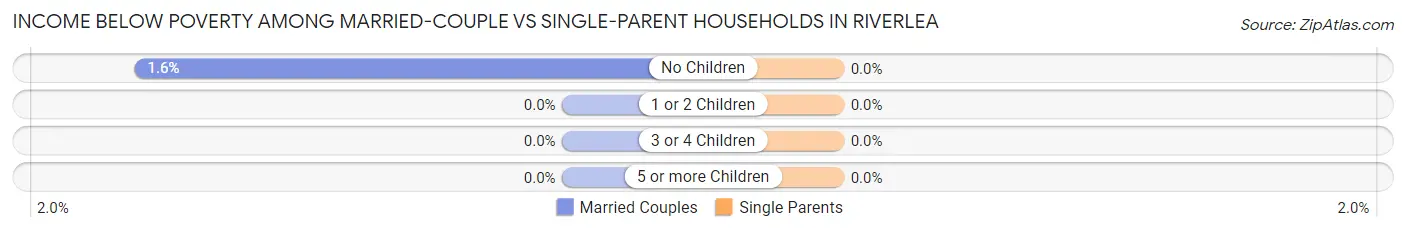
| Children | Married-Couple Families | Single-Parent Households |
| No Children | 1 (1.6%) | 0 (0.0%) |
| 1 or 2 Children | 0 (0.0%) | 0 (0.0%) |
| 3 or 4 Children | 0 (0.0%) | 0 (0.0%) |
| 5 or more Children | 0 (0.0%) | 0 (0.0%) |
| Total | 1 (0.8%) | 0 (0.0%) |
Race in Riverlea
The most populous races in Riverlea are White / Caucasian (472 | 91.6%), Two or more Races (21 | 4.1%), and Asian (10 | 1.9%).
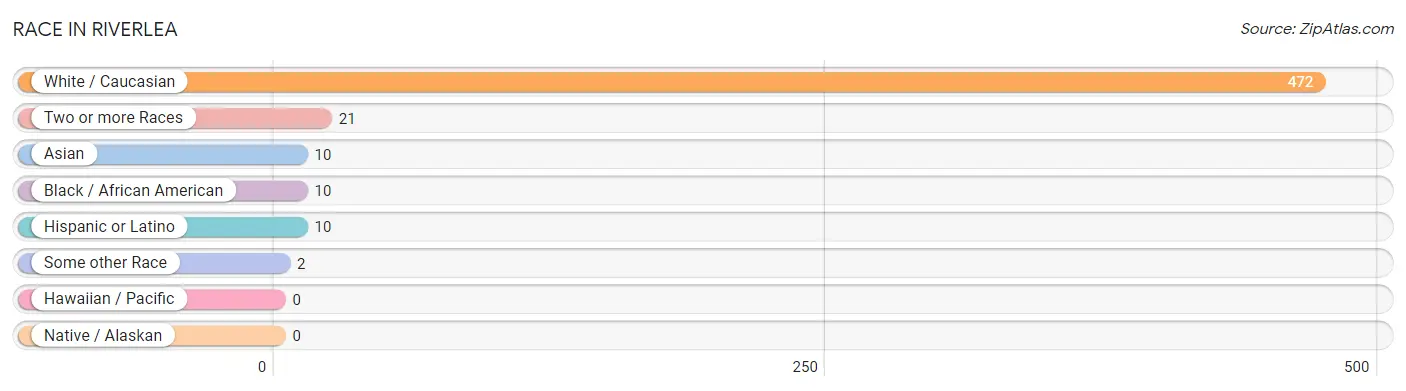
| Race | # Population | % Population |
| Asian | 10 | 1.9% |
| Black / African American | 10 | 1.9% |
| Hawaiian / Pacific | 0 | 0.0% |
| Hispanic or Latino | 10 | 1.9% |
| Native / Alaskan | 0 | 0.0% |
| White / Caucasian | 472 | 91.6% |
| Two or more Races | 21 | 4.1% |
| Some other Race | 2 | 0.4% |
| Total | 515 | 100.0% |
Ancestry in Riverlea
The most populous ancestries reported in Riverlea are German (138 | 26.8%), English (127 | 24.7%), Irish (106 | 20.6%), Scottish (35 | 6.8%), and European (33 | 6.4%), together accounting for 85.3% of all Riverlea residents.
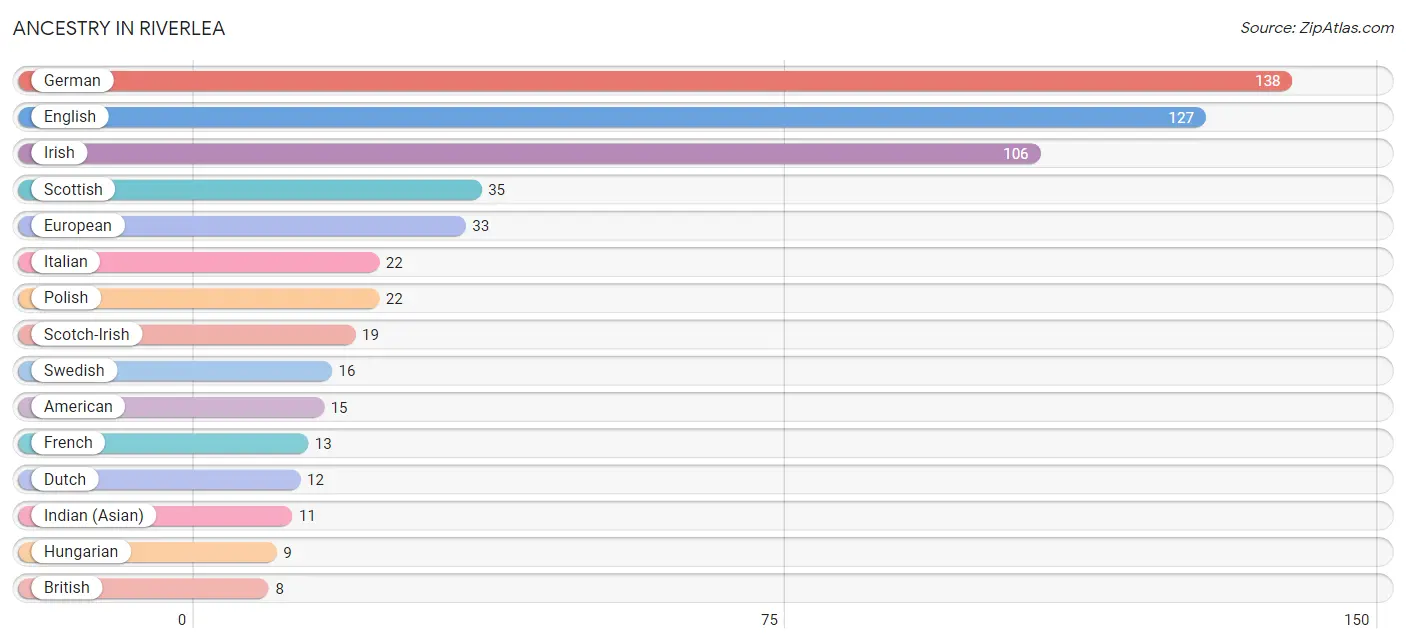
| Ancestry | # Population | % Population |
| American | 15 | 2.9% |
| Arab | 1 | 0.2% |
| Armenian | 5 | 1.0% |
| Austrian | 2 | 0.4% |
| British | 8 | 1.5% |
| Burmese | 5 | 1.0% |
| Central American | 3 | 0.6% |
| Czech | 3 | 0.6% |
| Danish | 4 | 0.8% |
| Dutch | 12 | 2.3% |
| Eastern European | 2 | 0.4% |
| English | 127 | 24.7% |
| European | 33 | 6.4% |
| French | 13 | 2.5% |
| German | 138 | 26.8% |
| Honduran | 3 | 0.6% |
| Hungarian | 9 | 1.8% |
| Indian (Asian) | 11 | 2.1% |
| Iranian | 3 | 0.6% |
| Irish | 106 | 20.6% |
| Italian | 22 | 4.3% |
| Laotian | 5 | 1.0% |
| Lebanese | 1 | 0.2% |
| Lithuanian | 5 | 1.0% |
| Malaysian | 4 | 0.8% |
| Mexican | 7 | 1.4% |
| Northern European | 1 | 0.2% |
| Norwegian | 6 | 1.2% |
| Polish | 22 | 4.3% |
| Russian | 3 | 0.6% |
| Scandinavian | 3 | 0.6% |
| Scotch-Irish | 19 | 3.7% |
| Scottish | 35 | 6.8% |
| Slovak | 4 | 0.8% |
| Slovene | 1 | 0.2% |
| Sri Lankan | 6 | 1.2% |
| Swedish | 16 | 3.1% |
| Swiss | 1 | 0.2% |
| Welsh | 7 | 1.4% | View All 39 Rows |
Immigrants in Riverlea
The most numerous immigrant groups reported in Riverlea came from Asia (8 | 1.5%), Europe (8 | 1.5%), South Eastern Asia (6 | 1.2%), Northern Europe (5 | 1.0%), and Vietnam (4 | 0.8%), together accounting for 6.0% of all Riverlea residents.
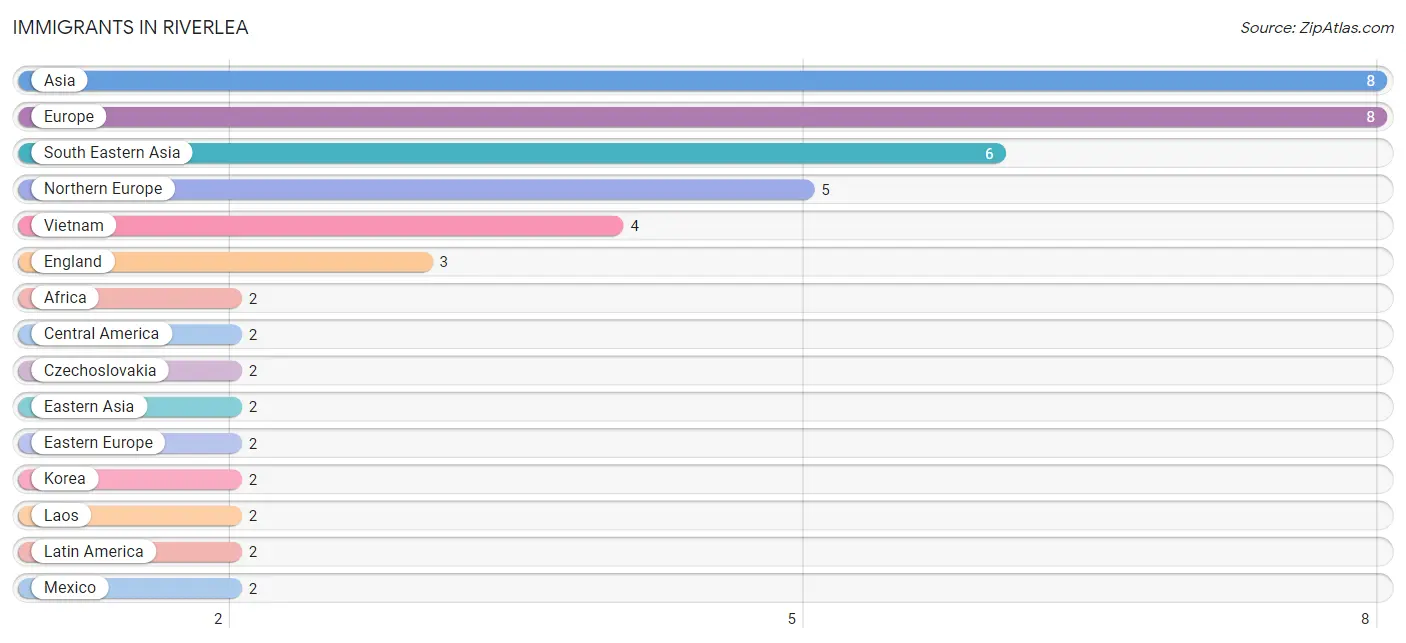
| Immigration Origin | # Population | % Population |
| Africa | 2 | 0.4% |
| Asia | 8 | 1.5% |
| Central America | 2 | 0.4% |
| Czechoslovakia | 2 | 0.4% |
| Eastern Asia | 2 | 0.4% |
| Eastern Europe | 2 | 0.4% |
| England | 3 | 0.6% |
| Europe | 8 | 1.5% |
| Germany | 1 | 0.2% |
| Korea | 2 | 0.4% |
| Laos | 2 | 0.4% |
| Latin America | 2 | 0.4% |
| Mexico | 2 | 0.4% |
| Northern Europe | 5 | 1.0% |
| Norway | 2 | 0.4% |
| South Africa | 2 | 0.4% |
| South Eastern Asia | 6 | 1.2% |
| Vietnam | 4 | 0.8% |
| Western Europe | 1 | 0.2% | View All 19 Rows |
Sex and Age in Riverlea
Sex and Age in Riverlea
The most populous age groups in Riverlea are 10 to 14 Years (37 | 14.7%) for men and 55 to 59 Years (34 | 12.9%) for women.
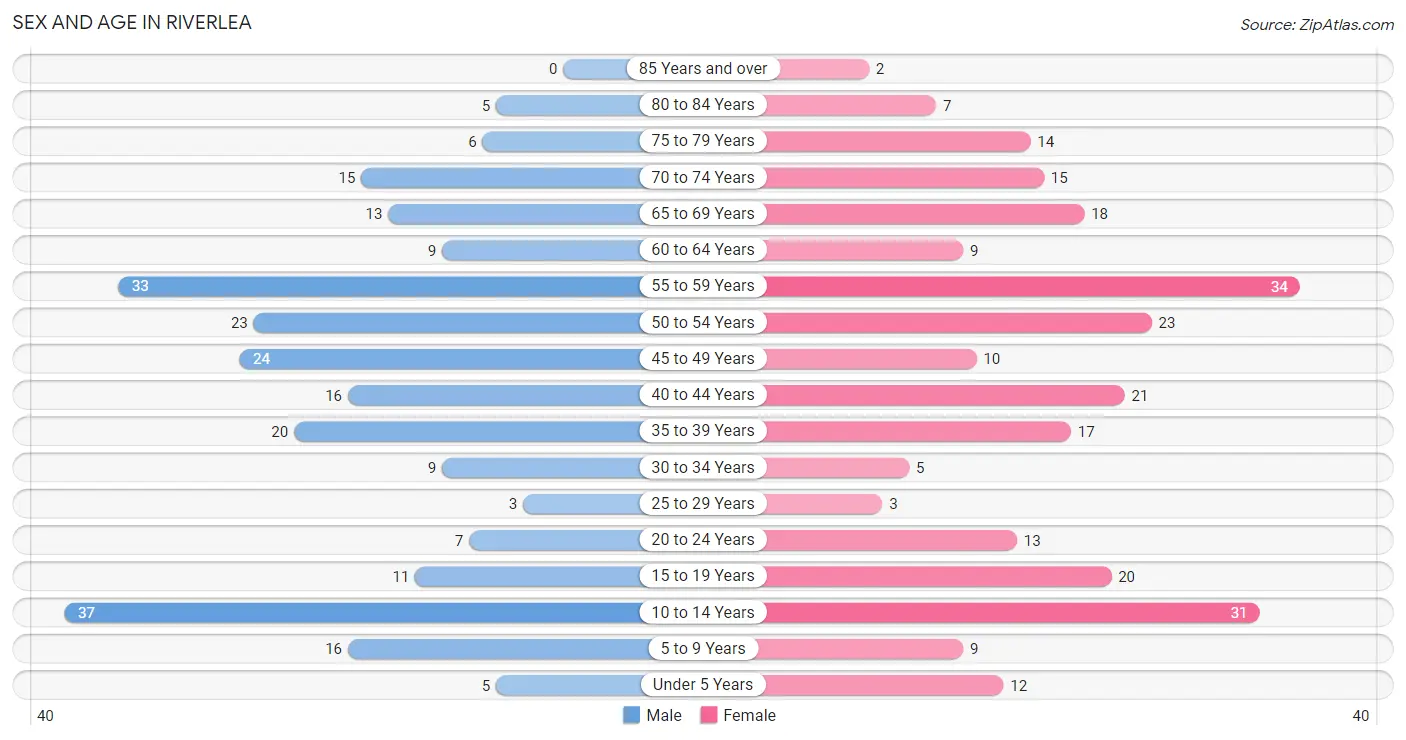
| Age Bracket | Male | Female |
| Under 5 Years | 5 (2.0%) | 12 (4.6%) |
| 5 to 9 Years | 16 (6.4%) | 9 (3.4%) |
| 10 to 14 Years | 37 (14.7%) | 31 (11.8%) |
| 15 to 19 Years | 11 (4.4%) | 20 (7.6%) |
| 20 to 24 Years | 7 (2.8%) | 13 (4.9%) |
| 25 to 29 Years | 3 (1.2%) | 3 (1.1%) |
| 30 to 34 Years | 9 (3.6%) | 5 (1.9%) |
| 35 to 39 Years | 20 (7.9%) | 17 (6.5%) |
| 40 to 44 Years | 16 (6.4%) | 21 (8.0%) |
| 45 to 49 Years | 24 (9.5%) | 10 (3.8%) |
| 50 to 54 Years | 23 (9.1%) | 23 (8.7%) |
| 55 to 59 Years | 33 (13.1%) | 34 (12.9%) |
| 60 to 64 Years | 9 (3.6%) | 9 (3.4%) |
| 65 to 69 Years | 13 (5.2%) | 18 (6.8%) |
| 70 to 74 Years | 15 (5.9%) | 15 (5.7%) |
| 75 to 79 Years | 6 (2.4%) | 14 (5.3%) |
| 80 to 84 Years | 5 (2.0%) | 7 (2.7%) |
| 85 Years and over | 0 (0.0%) | 2 (0.8%) |
| Total | 252 (100.0%) | 263 (100.0%) |
Families and Households in Riverlea
Median Family Size in Riverlea
The median family size in Riverlea is 3.09 persons per family, with married-couple families (131 | 92.2%) accounting for the largest median family size of 3.15 persons per family. On the other hand, single male/father families (3 | 2.1%) represent the smallest median family size with 2.00 persons per family.
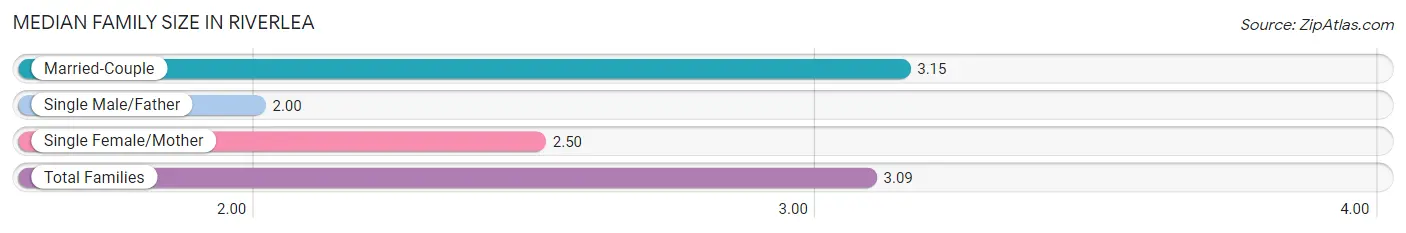
| Family Type | # Families | Family Size |
| Married-Couple | 131 (92.2%) | 3.15 |
| Single Male/Father | 3 (2.1%) | 2.00 |
| Single Female/Mother | 8 (5.6%) | 2.50 |
| Total Families | 142 (100.0%) | 3.09 |
Median Household Size in Riverlea
The median household size in Riverlea is 2.49 persons per household, with married-couple households (131 | 63.3%) accounting for the largest median household size of 3.18 persons per household. non-family households (65 | 31.4%) represent the smallest median household size with 1.12 persons per household.
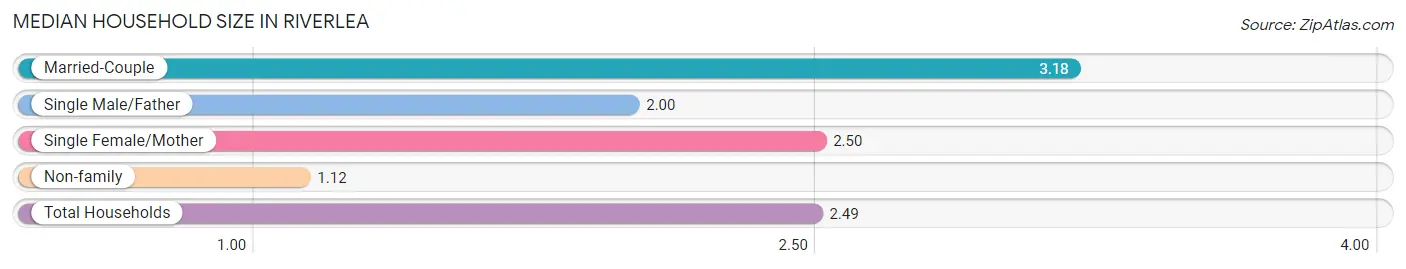
| Household Type | # Households | Household Size |
| Married-Couple | 131 (63.3%) | 3.18 |
| Single Male/Father | 3 (1.5%) | 2.00 |
| Single Female/Mother | 8 (3.9%) | 2.50 |
| Non-family | 65 (31.4%) | 1.12 |
| Total Households | 207 (100.0%) | 2.49 |
Household Size by Marriage Status in Riverlea
Out of a total of 207 households in Riverlea, 142 (68.6%) are family households, while 65 (31.4%) are nonfamily households. The most numerous type of family households are 2-person households, comprising 58, and the most common type of nonfamily households are 1-person households, comprising 57.
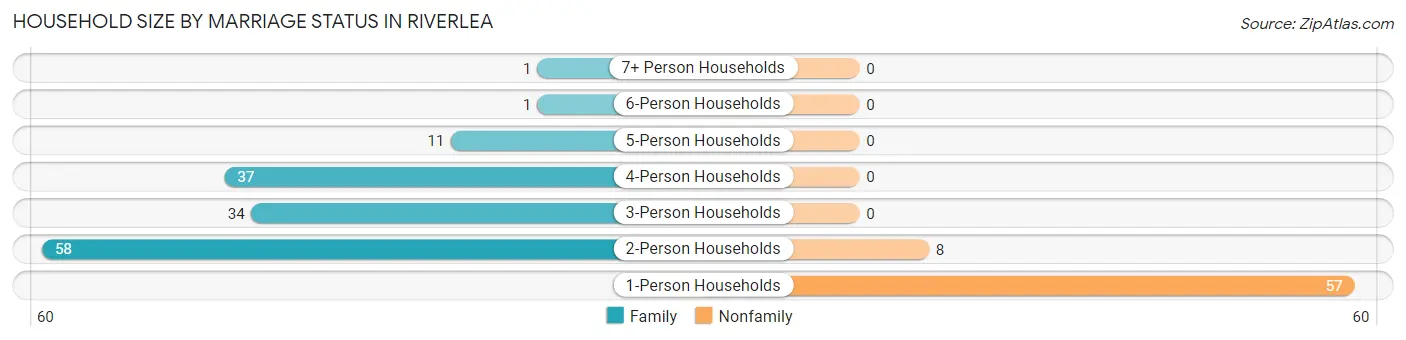
| Household Size | Family Households | Nonfamily Households |
| 1-Person Households | - | 57 (27.5%) |
| 2-Person Households | 58 (28.0%) | 8 (3.9%) |
| 3-Person Households | 34 (16.4%) | 0 (0.0%) |
| 4-Person Households | 37 (17.9%) | 0 (0.0%) |
| 5-Person Households | 11 (5.3%) | 0 (0.0%) |
| 6-Person Households | 1 (0.5%) | 0 (0.0%) |
| 7+ Person Households | 1 (0.5%) | 0 (0.0%) |
| Total | 142 (68.6%) | 65 (31.4%) |
Female Fertility in Riverlea
Fertility by Age in Riverlea
Average fertility rate in Riverlea is 21.0 births per 1,000 women. Women in the age bracket of 35 to 50 years have the highest fertility rate with 36.0 births per 1,000 women. Women in the age bracket of 35 to 50 years acount for 100.0% of all women with births.
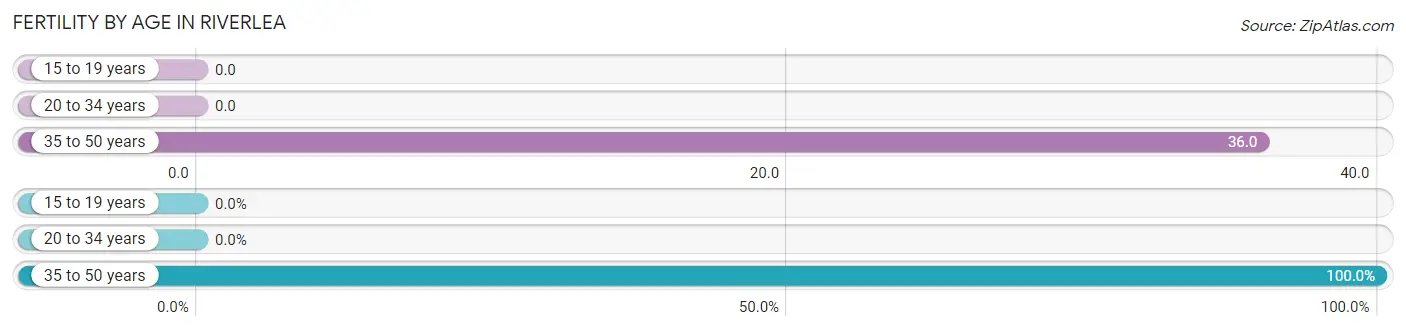
| Age Bracket | Women with Births | Births / 1,000 Women |
| 15 to 19 years | 0 (0.0%) | 0.0 |
| 20 to 34 years | 0 (0.0%) | 0.0 |
| 35 to 50 years | 2 (100.0%) | 36.0 |
| Total | 2 (100.0%) | 21.0 |
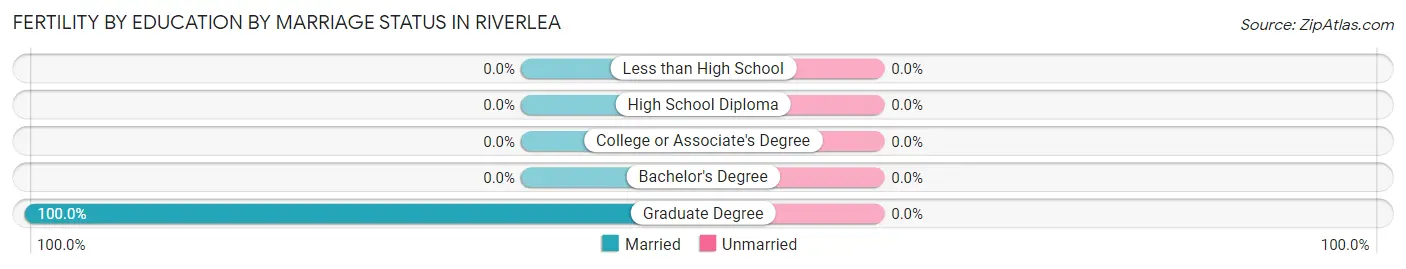
Fertility by Age by Marriage Status in Riverlea
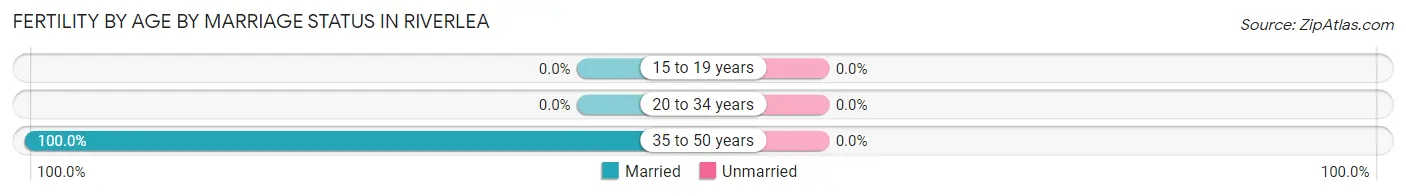
| Age Bracket | Married | Unmarried |
| 15 to 19 years | 0 (0.0%) | 0 (0.0%) |
| 20 to 34 years | 0 (0.0%) | 0 (0.0%) |
| 35 to 50 years | 2 (100.0%) | 0 (0.0%) |
| Total | 2 (100.0%) | 0 (0.0%) |
Fertility by Education in Riverlea
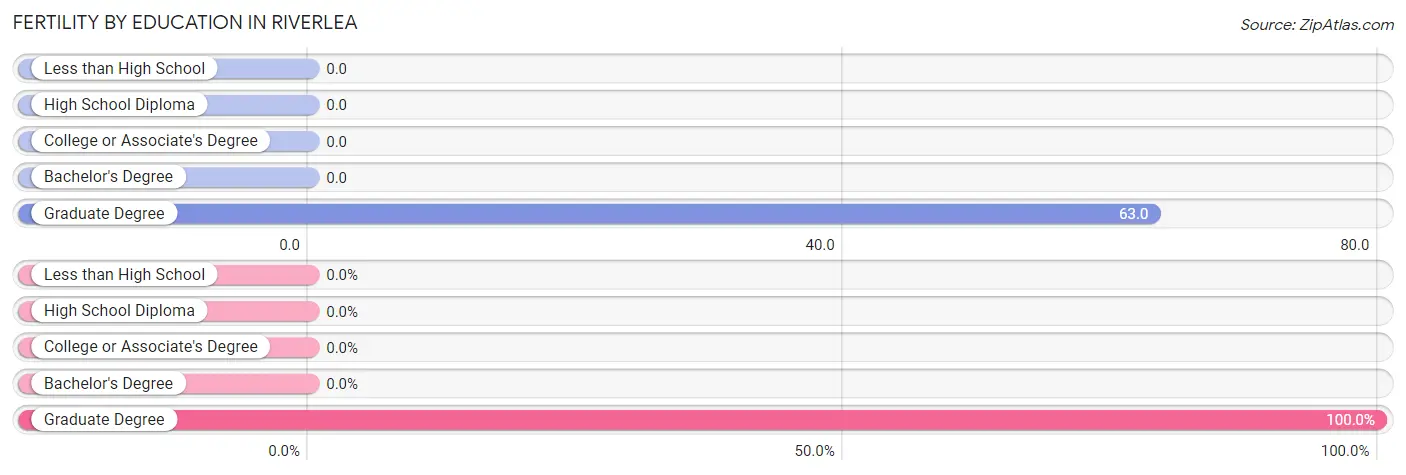
| Educational Attainment | Women with Births | Births / 1,000 Women |
| Less than High School | 0 (0.0%) | 0.0 |
| High School Diploma | 0 (0.0%) | 0.0 |
| College or Associate's Degree | 0 (0.0%) | 0.0 |
| Bachelor's Degree | 0 (0.0%) | 0.0 |
| Graduate Degree | 2 (100.0%) | 63.0 |
| Total | 2 (100.0%) | 21.0 |
Fertility by Education by Marriage Status in Riverlea
| Educational Attainment | Married | Unmarried |
| Less than High School | 0 (0.0%) | 0 (0.0%) |
| High School Diploma | 0 (0.0%) | 0 (0.0%) |
| College or Associate's Degree | 0 (0.0%) | 0 (0.0%) |
| Bachelor's Degree | 0 (0.0%) | 0 (0.0%) |
| Graduate Degree | 2 (100.0%) | 0 (0.0%) |
| Total | 2 (100.0%) | 0 (0.0%) |
Employment Characteristics in Riverlea
Employment by Class of Employer in Riverlea
Among the 283 employed individuals in Riverlea, private company employees (142 | 50.2%), not-for-profit organizations (44 | 15.5%), and self-employed (not incorporated) (31 | 11.0%) make up the most common classes of employment.
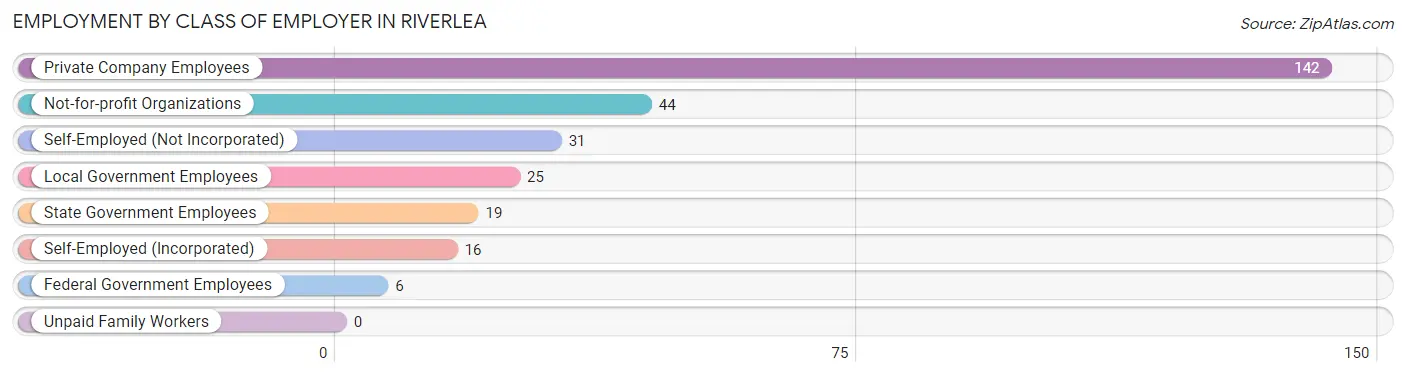
| Employer Class | # Employees | % Employees |
| Private Company Employees | 142 | 50.2% |
| Self-Employed (Incorporated) | 16 | 5.7% |
| Self-Employed (Not Incorporated) | 31 | 11.0% |
| Not-for-profit Organizations | 44 | 15.5% |
| Local Government Employees | 25 | 8.8% |
| State Government Employees | 19 | 6.7% |
| Federal Government Employees | 6 | 2.1% |
| Unpaid Family Workers | 0 | 0.0% |
| Total | 283 | 100.0% |
Employment Status by Age in Riverlea
According to the labor force statistics for Riverlea, out of the total population over 16 years of age (394), 74.1% or 292 individuals are in the labor force, with 2.1% or 6 of them unemployed. The age group with the highest labor force participation rate is 25 to 29 years, with 100.0% or 6 individuals in the labor force. Within the labor force, the 20 to 24 years age range has the highest percentage of unemployed individuals, with 20.0% or 2 of them being unemployed.
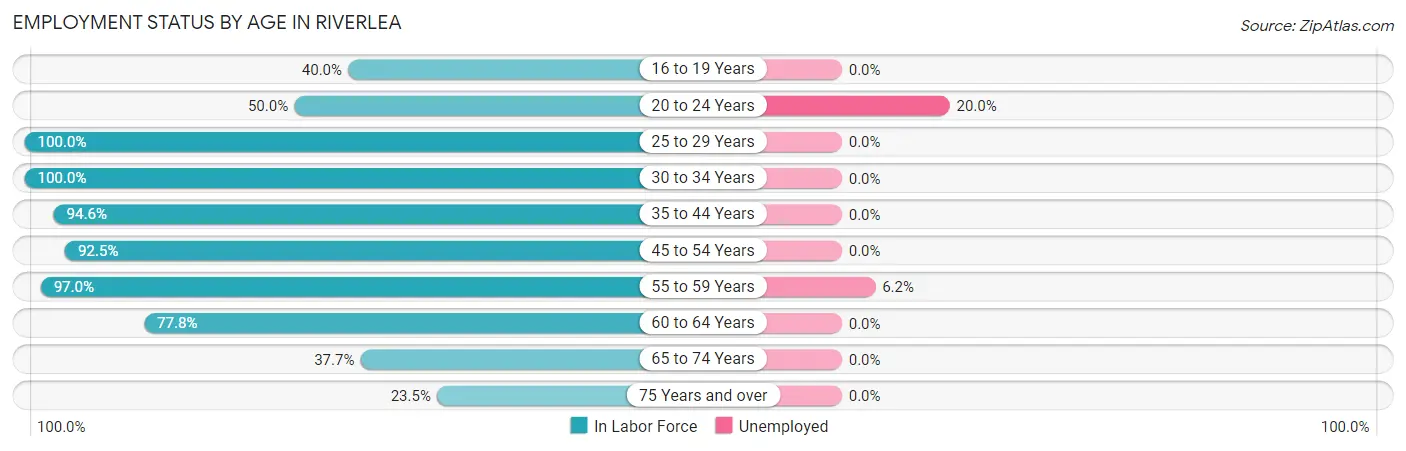
| Age Bracket | In Labor Force | Unemployed |
| 16 to 19 Years | 8 (40.0%) | 0 (0.0%) |
| 20 to 24 Years | 10 (50.0%) | 2 (20.0%) |
| 25 to 29 Years | 6 (100.0%) | 0 (0.0%) |
| 30 to 34 Years | 14 (100.0%) | 0 (0.0%) |
| 35 to 44 Years | 70 (94.6%) | 0 (0.0%) |
| 45 to 54 Years | 74 (92.5%) | 0 (0.0%) |
| 55 to 59 Years | 65 (97.0%) | 4 (6.2%) |
| 60 to 64 Years | 14 (77.8%) | 0 (0.0%) |
| 65 to 74 Years | 23 (37.7%) | 0 (0.0%) |
| 75 Years and over | 8 (23.5%) | 0 (0.0%) |
| Total | 292 (74.1%) | 6 (2.1%) |
Employment Status by Educational Attainment in Riverlea
According to labor force statistics for Riverlea, 93.8% of individuals (243) out of the total population between 25 and 64 years of age (259) are in the labor force, with 1.6% or 4 of them being unemployed. The group with the highest labor force participation rate are those with the educational attainment of less than high school, with 100.0% or 1 individuals in the labor force. Within the labor force, individuals with bachelor's degree or higher education have the highest percentage of unemployment, with 1.9% or 4 of them being unemployed.
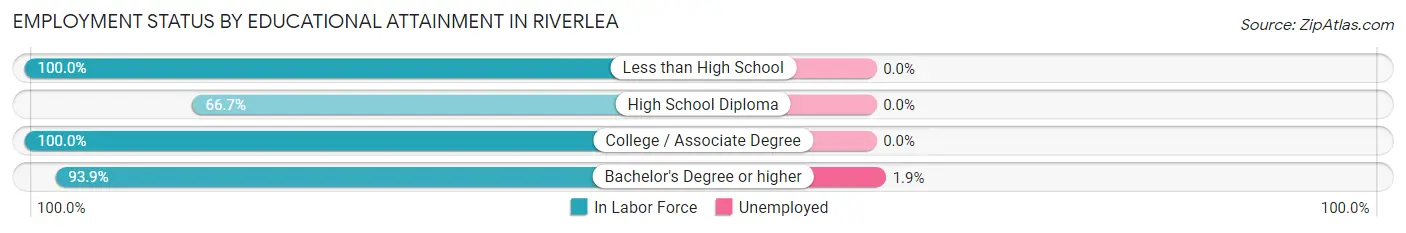
| Educational Attainment | In Labor Force | Unemployed |
| Less than High School | 1 (100.0%) | 0 (0.0%) |
| High School Diploma | 4 (66.7%) | 0 (0.0%) |
| College / Associate Degree | 23 (100.0%) | 0 (0.0%) |
| Bachelor's Degree or higher | 215 (93.9%) | 4 (1.9%) |
| Total | 243 (93.8%) | 4 (1.6%) |
Employment Occupations by Sex in Riverlea
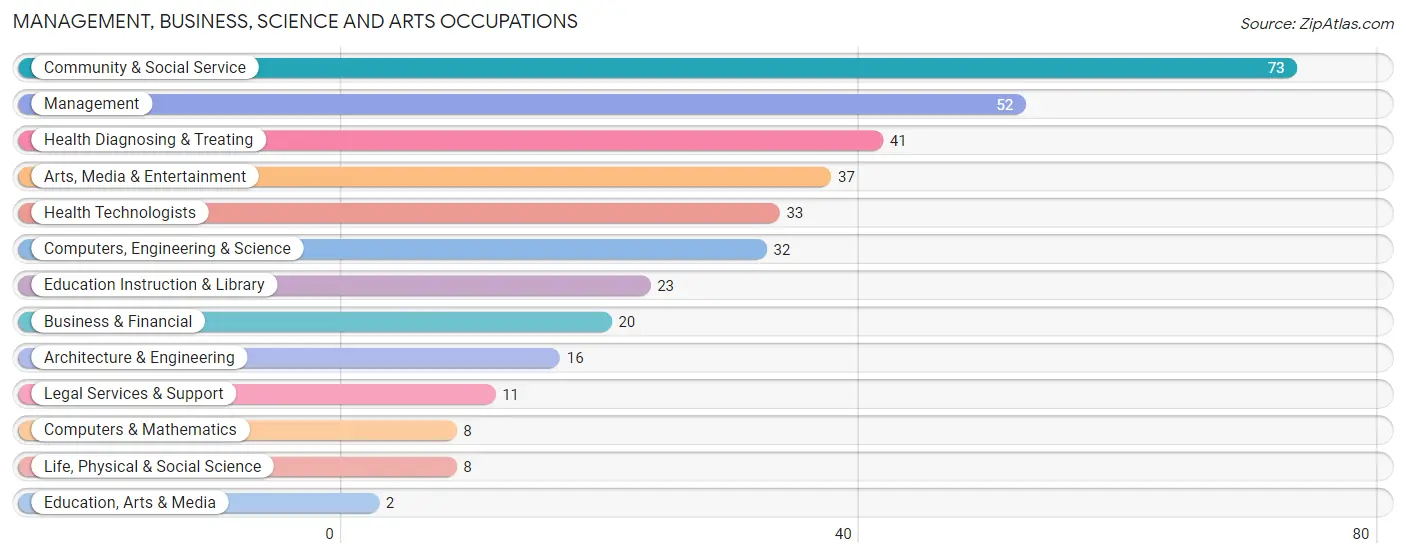
Management, Business, Science and Arts Occupations
The most common Management, Business, Science and Arts occupations in Riverlea are Community & Social Service (73 | 25.5%), Management (52 | 18.2%), Health Diagnosing & Treating (41 | 14.3%), Arts, Media & Entertainment (37 | 12.9%), and Health Technologists (33 | 11.5%).
Management, Business, Science and Arts Occupations by Sex
Within the Management, Business, Science and Arts occupations in Riverlea, the most male-oriented occupations are Computers & Mathematics (100.0%), Architecture & Engineering (100.0%), and Computers, Engineering & Science (84.4%), while the most female-oriented occupations are Education, Arts & Media (100.0%), Health Diagnosing & Treating (90.2%), and Health Technologists (87.9%).
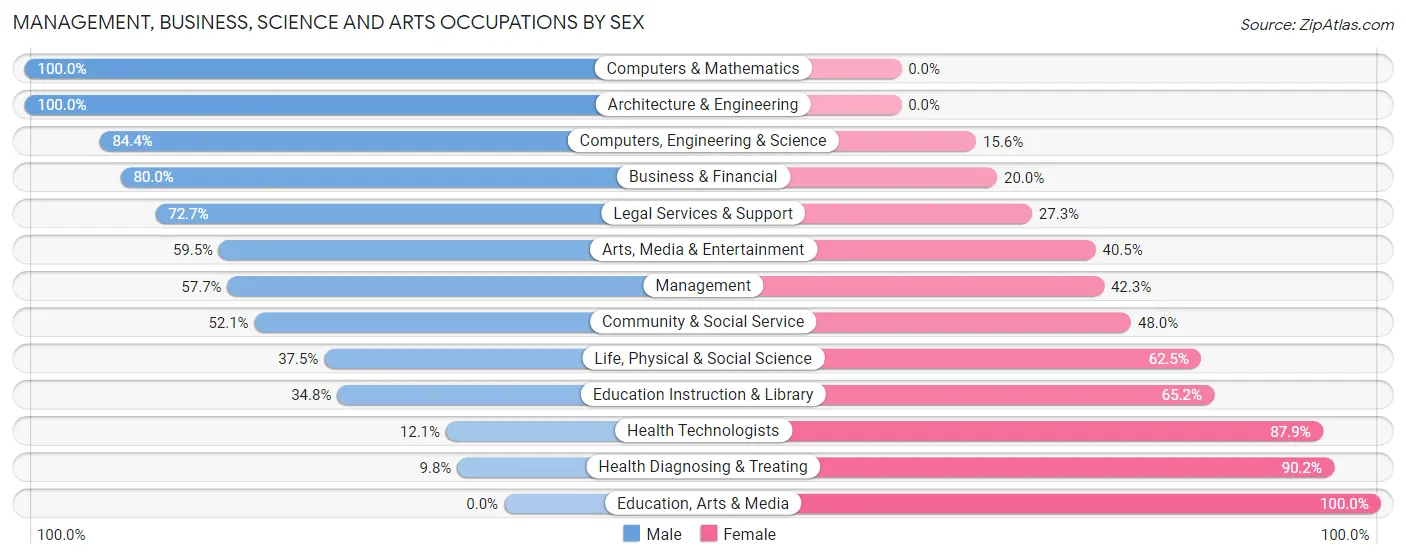
| Occupation | Male | Female |
| Management | 30 (57.7%) | 22 (42.3%) |
| Business & Financial | 16 (80.0%) | 4 (20.0%) |
| Computers, Engineering & Science | 27 (84.4%) | 5 (15.6%) |
| Computers & Mathematics | 8 (100.0%) | 0 (0.0%) |
| Architecture & Engineering | 16 (100.0%) | 0 (0.0%) |
| Life, Physical & Social Science | 3 (37.5%) | 5 (62.5%) |
| Community & Social Service | 38 (52.0%) | 35 (47.9%) |
| Education, Arts & Media | 0 (0.0%) | 2 (100.0%) |
| Legal Services & Support | 8 (72.7%) | 3 (27.3%) |
| Education Instruction & Library | 8 (34.8%) | 15 (65.2%) |
| Arts, Media & Entertainment | 22 (59.5%) | 15 (40.5%) |
| Health Diagnosing & Treating | 4 (9.8%) | 37 (90.2%) |
| Health Technologists | 4 (12.1%) | 29 (87.9%) |
| Total (Category) | 115 (52.7%) | 103 (47.2%) |
| Total (Overall) | 148 (51.7%) | 138 (48.2%) |
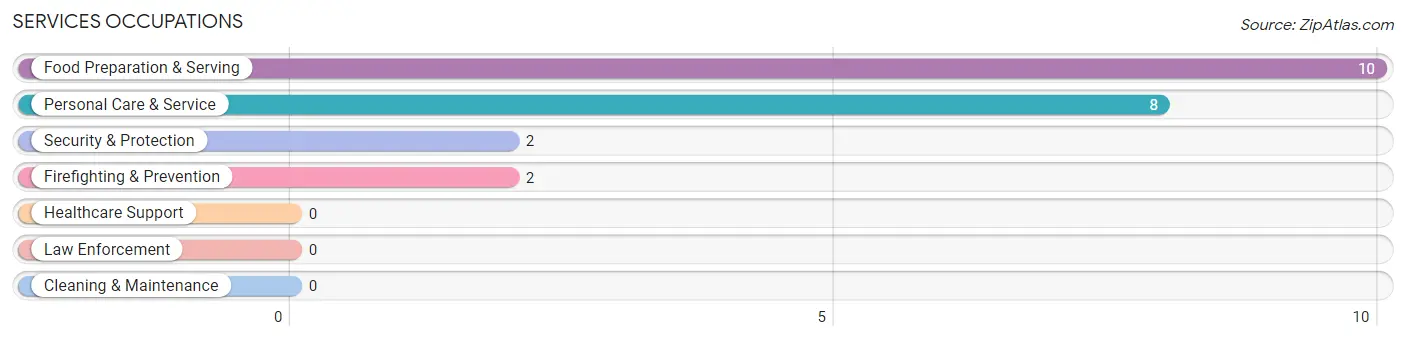
Services Occupations
The most common Services occupations in Riverlea are Food Preparation & Serving (10 | 3.5%), Personal Care & Service (8 | 2.8%), Security & Protection (2 | 0.7%), and Firefighting & Prevention (2 | 0.7%).
Services Occupations by Sex
Within the Services occupations in Riverlea, the most male-oriented occupations are Security & Protection (100.0%), Firefighting & Prevention (100.0%), and Food Preparation & Serving (10.0%), while the most female-oriented occupations are Personal Care & Service (100.0%), and Food Preparation & Serving (90.0%).
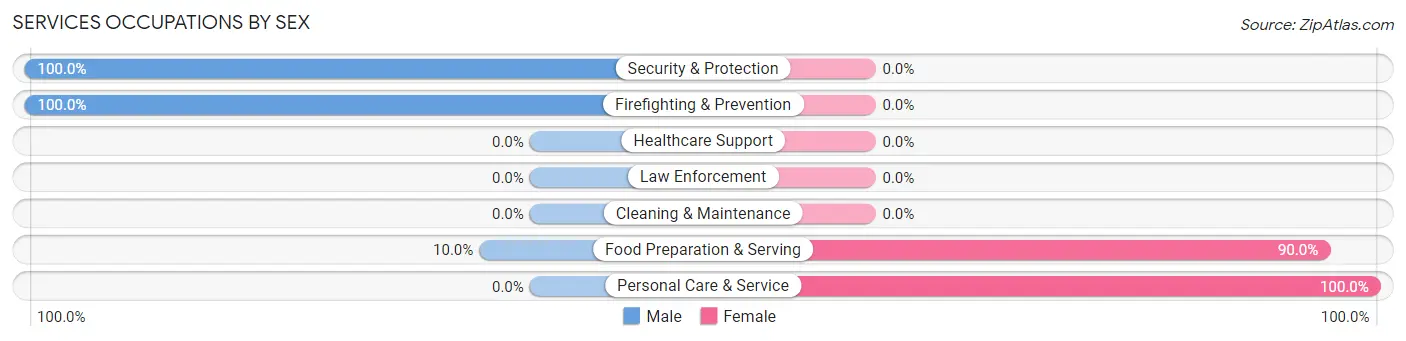
| Occupation | Male | Female |
| Healthcare Support | 0 (0.0%) | 0 (0.0%) |
| Security & Protection | 2 (100.0%) | 0 (0.0%) |
| Firefighting & Prevention | 2 (100.0%) | 0 (0.0%) |
| Law Enforcement | 0 (0.0%) | 0 (0.0%) |
| Food Preparation & Serving | 1 (10.0%) | 9 (90.0%) |
| Cleaning & Maintenance | 0 (0.0%) | 0 (0.0%) |
| Personal Care & Service | 0 (0.0%) | 8 (100.0%) |
| Total (Category) | 3 (15.0%) | 17 (85.0%) |
| Total (Overall) | 148 (51.7%) | 138 (48.2%) |
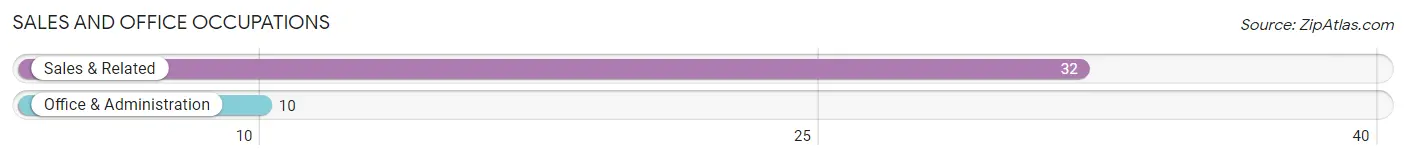
Sales and Office Occupations
The most common Sales and Office occupations in Riverlea are Sales & Related (32 | 11.2%), and Office & Administration (10 | 3.5%).
Sales and Office Occupations by Sex
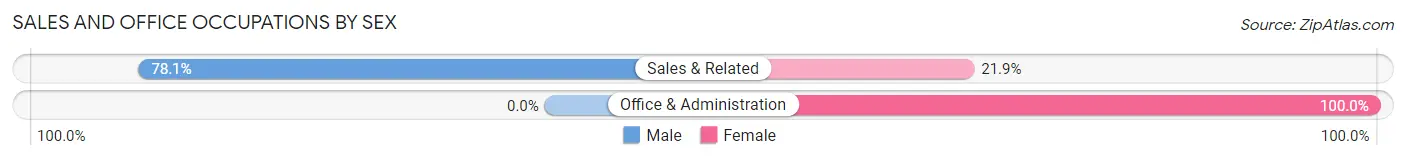
| Occupation | Male | Female |
| Sales & Related | 25 (78.1%) | 7 (21.9%) |
| Office & Administration | 0 (0.0%) | 10 (100.0%) |
| Total (Category) | 25 (59.5%) | 17 (40.5%) |
| Total (Overall) | 148 (51.7%) | 138 (48.2%) |
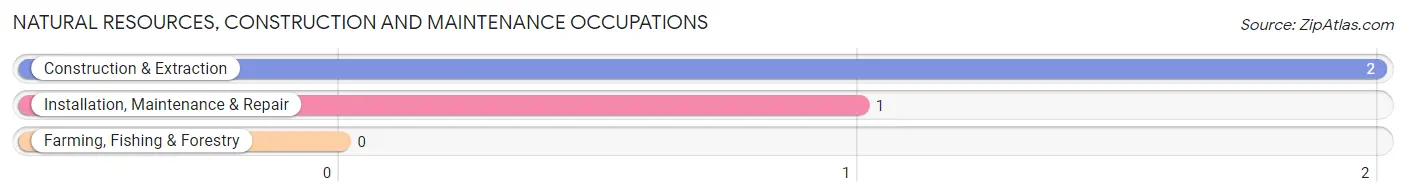
Natural Resources, Construction and Maintenance Occupations
The most common Natural Resources, Construction and Maintenance occupations in Riverlea are Construction & Extraction (2 | 0.7%), and Installation, Maintenance & Repair (1 | 0.4%).
Natural Resources, Construction and Maintenance Occupations by Sex
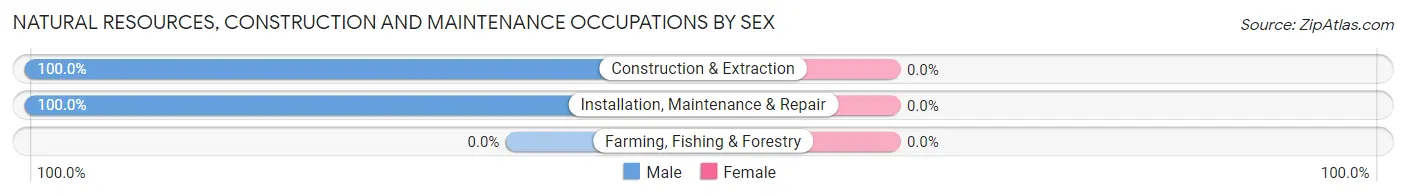
| Occupation | Male | Female |
| Farming, Fishing & Forestry | 0 (0.0%) | 0 (0.0%) |
| Construction & Extraction | 2 (100.0%) | 0 (0.0%) |
| Installation, Maintenance & Repair | 1 (100.0%) | 0 (0.0%) |
| Total (Category) | 3 (100.0%) | 0 (0.0%) |
| Total (Overall) | 148 (51.7%) | 138 (48.2%) |
Production, Transportation and Moving Occupations
The most common Production, Transportation and Moving occupations in Riverlea are , and Transportation (3 | 1.1%).
Production, Transportation and Moving Occupations by Sex
| Occupation | Male | Female |
| Production | 0 (0.0%) | 0 (0.0%) |
| Transportation | 2 (66.7%) | 1 (33.3%) |
| Material Moving | 0 (0.0%) | 0 (0.0%) |
| Total (Category) | 2 (66.7%) | 1 (33.3%) |
| Total (Overall) | 148 (51.7%) | 138 (48.2%) |
Employment Industries by Sex in Riverlea
Employment Industries in Riverlea
The major employment industries in Riverlea include Professional & Scientific (48 | 16.8%), Health Care & Social Assistance (48 | 16.8%), Educational Services (42 | 14.7%), Manufacturing (32 | 11.2%), and Public Administration (17 | 5.9%).
Employment Industries by Sex in Riverlea
The Riverlea industries that see more men than women are Agriculture, Fishing & Hunting (100.0%), Mining, Quarrying, & Extraction (100.0%), and Construction (100.0%), whereas the industries that tend to have a higher number of women are Accommodation & Food Services (100.0%), Arts, Entertainment & Recreation (92.3%), and Health Care & Social Assistance (83.3%).
| Industry | Male | Female |
| Agriculture, Fishing & Hunting | 2 (100.0%) | 0 (0.0%) |
| Mining, Quarrying, & Extraction | 2 (100.0%) | 0 (0.0%) |
| Construction | 6 (100.0%) | 0 (0.0%) |
| Manufacturing | 27 (84.4%) | 5 (15.6%) |
| Wholesale Trade | 7 (70.0%) | 3 (30.0%) |
| Retail Trade | 2 (33.3%) | 4 (66.7%) |
| Transportation & Warehousing | 2 (50.0%) | 2 (50.0%) |
| Utilities | 5 (100.0%) | 0 (0.0%) |
| Information | 8 (100.0%) | 0 (0.0%) |
| Finance & Insurance | 6 (54.5%) | 5 (45.5%) |
| Real Estate, Rental & Leasing | 6 (60.0%) | 4 (40.0%) |
| Professional & Scientific | 37 (77.1%) | 11 (22.9%) |
| Enterprise Management | 0 (0.0%) | 0 (0.0%) |
| Administrative & Support | 1 (100.0%) | 0 (0.0%) |
| Educational Services | 13 (30.9%) | 29 (69.1%) |
| Health Care & Social Assistance | 8 (16.7%) | 40 (83.3%) |
| Arts, Entertainment & Recreation | 1 (7.7%) | 12 (92.3%) |
| Accommodation & Food Services | 0 (0.0%) | 8 (100.0%) |
| Public Administration | 6 (35.3%) | 11 (64.7%) |
| Total | 148 (51.7%) | 138 (48.2%) |
Education in Riverlea
School Enrollment in Riverlea
The most common levels of schooling among the 148 students in Riverlea are high school (46 | 31.1%), middle school (43 | 29.0%), and elementary school (24 | 16.2%).
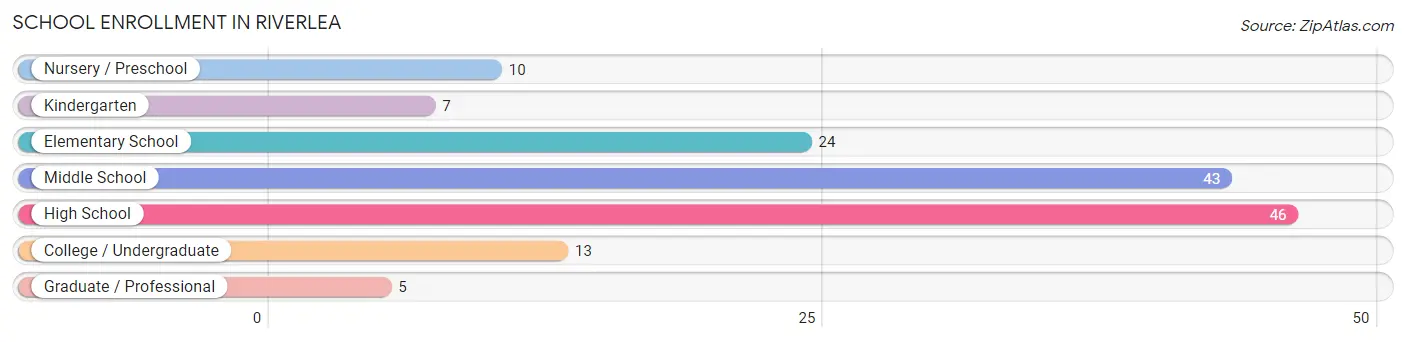
| School Level | # Students | % Students |
| Nursery / Preschool | 10 | 6.8% |
| Kindergarten | 7 | 4.7% |
| Elementary School | 24 | 16.2% |
| Middle School | 43 | 29.0% |
| High School | 46 | 31.1% |
| College / Undergraduate | 13 | 8.8% |
| Graduate / Professional | 5 | 3.4% |
| Total | 148 | 100.0% |
School Enrollment by Age by Funding Source in Riverlea
Out of a total of 148 students who are enrolled in schools in Riverlea, 23 (15.5%) attend a private institution, while the remaining 125 (84.5%) are enrolled in public schools. The age group of 20 to 24 year olds has the highest likelihood of being enrolled in private schools, with 8 (72.7% in the age bracket) enrolled. Conversely, the age group of 18 to 19 year olds has the lowest likelihood of being enrolled in a private school, with 7 (100.0% in the age bracket) attending a public institution.
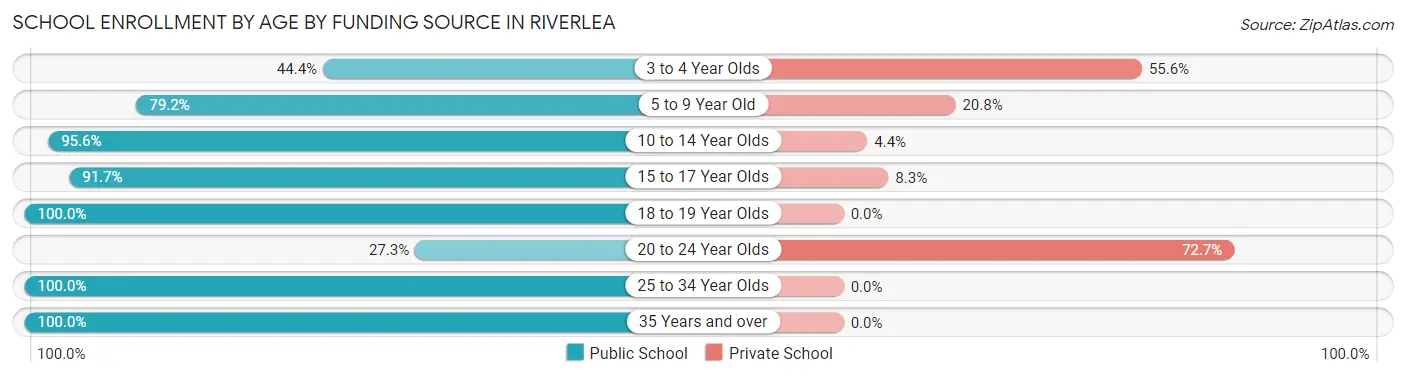
| Age Bracket | Public School | Private School |
| 3 to 4 Year Olds | 4 (44.4%) | 5 (55.6%) |
| 5 to 9 Year Old | 19 (79.2%) | 5 (20.8%) |
| 10 to 14 Year Olds | 65 (95.6%) | 3 (4.4%) |
| 15 to 17 Year Olds | 22 (91.7%) | 2 (8.3%) |
| 18 to 19 Year Olds | 7 (100.0%) | 0 (0.0%) |
| 20 to 24 Year Olds | 3 (27.3%) | 8 (72.7%) |
| 25 to 34 Year Olds | 2 (100.0%) | 0 (0.0%) |
| 35 Years and over | 3 (100.0%) | 0 (0.0%) |
| Total | 125 (84.5%) | 23 (15.5%) |
Educational Attainment by Field of Study in Riverlea
Business (60 | 19.2%), engineering (32 | 10.3%), visual & performing arts (32 | 10.3%), education (29 | 9.3%), and bio, nature & agricultural (26 | 8.3%) are the most common fields of study among 312 individuals in Riverlea who have obtained a bachelor's degree or higher.
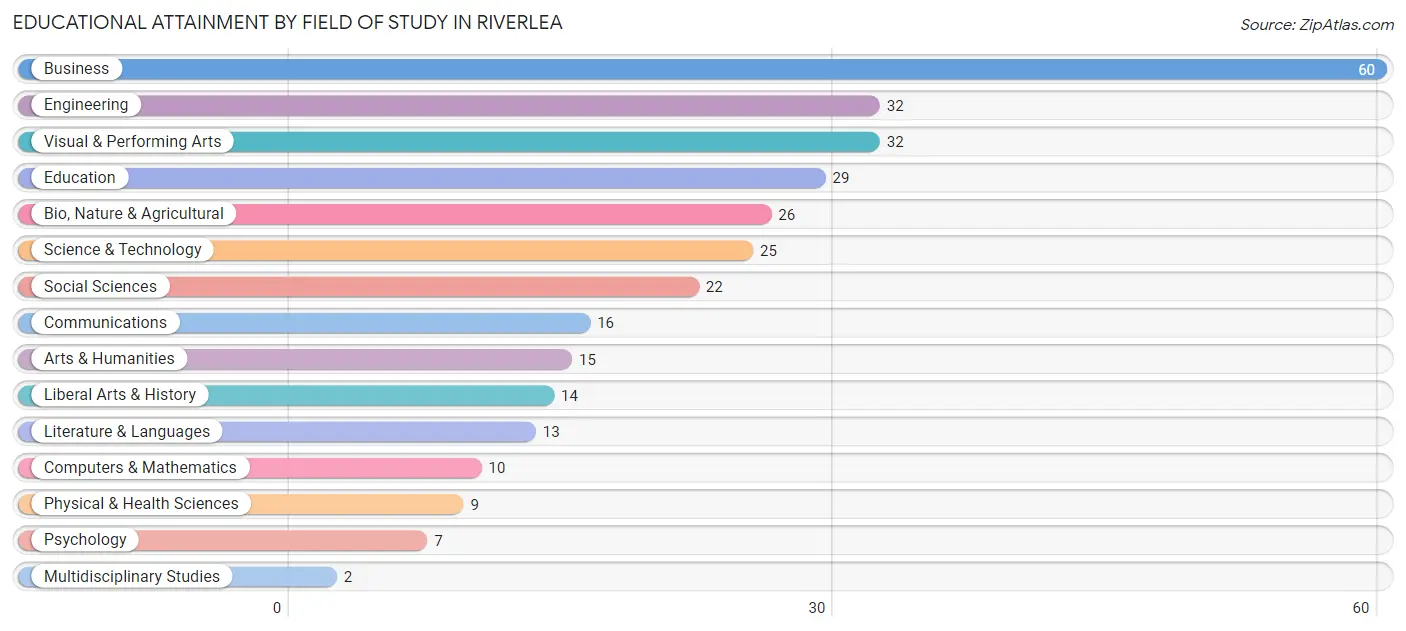
| Field of Study | # Graduates | % Graduates |
| Computers & Mathematics | 10 | 3.2% |
| Bio, Nature & Agricultural | 26 | 8.3% |
| Physical & Health Sciences | 9 | 2.9% |
| Psychology | 7 | 2.2% |
| Social Sciences | 22 | 7.0% |
| Engineering | 32 | 10.3% |
| Multidisciplinary Studies | 2 | 0.6% |
| Science & Technology | 25 | 8.0% |
| Business | 60 | 19.2% |
| Education | 29 | 9.3% |
| Literature & Languages | 13 | 4.2% |
| Liberal Arts & History | 14 | 4.5% |
| Visual & Performing Arts | 32 | 10.3% |
| Communications | 16 | 5.1% |
| Arts & Humanities | 15 | 4.8% |
| Total | 312 | 100.0% |
Transportation & Commute in Riverlea
Vehicle Availability by Sex in Riverlea
The most prevalent vehicle ownership categories in Riverlea are males with 2 vehicles (79, accounting for 53.4%) and females with 2 vehicles (70, making up 58.5%).
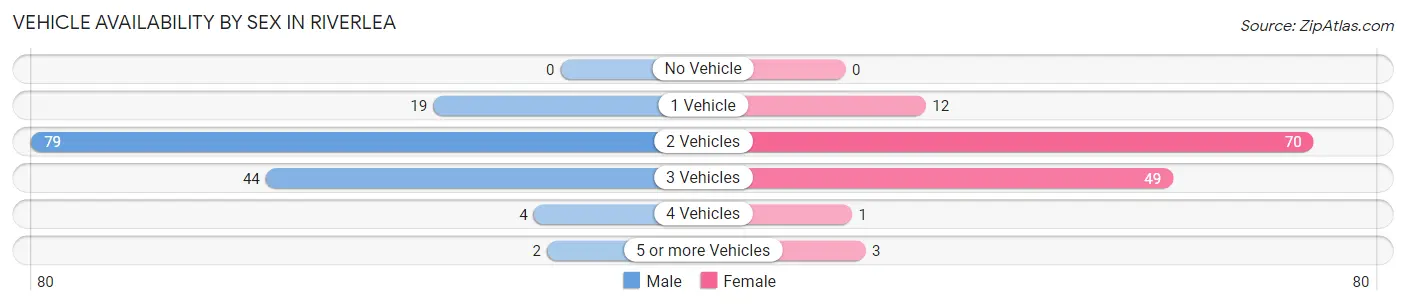
| Vehicles Available | Male | Female |
| No Vehicle | 0 (0.0%) | 0 (0.0%) |
| 1 Vehicle | 19 (12.8%) | 12 (8.9%) |
| 2 Vehicles | 79 (53.4%) | 70 (51.8%) |
| 3 Vehicles | 44 (29.7%) | 49 (36.3%) |
| 4 Vehicles | 4 (2.7%) | 1 (0.7%) |
| 5 or more Vehicles | 2 (1.3%) | 3 (2.2%) |
| Total | 148 (100.0%) | 135 (100.0%) |
Commute Time in Riverlea
The most frequently occuring commute durations in Riverlea are 20 to 24 minutes (80 commuters, 37.0%), 15 to 19 minutes (63 commuters, 29.2%), and 25 to 29 minutes (18 commuters, 8.3%).
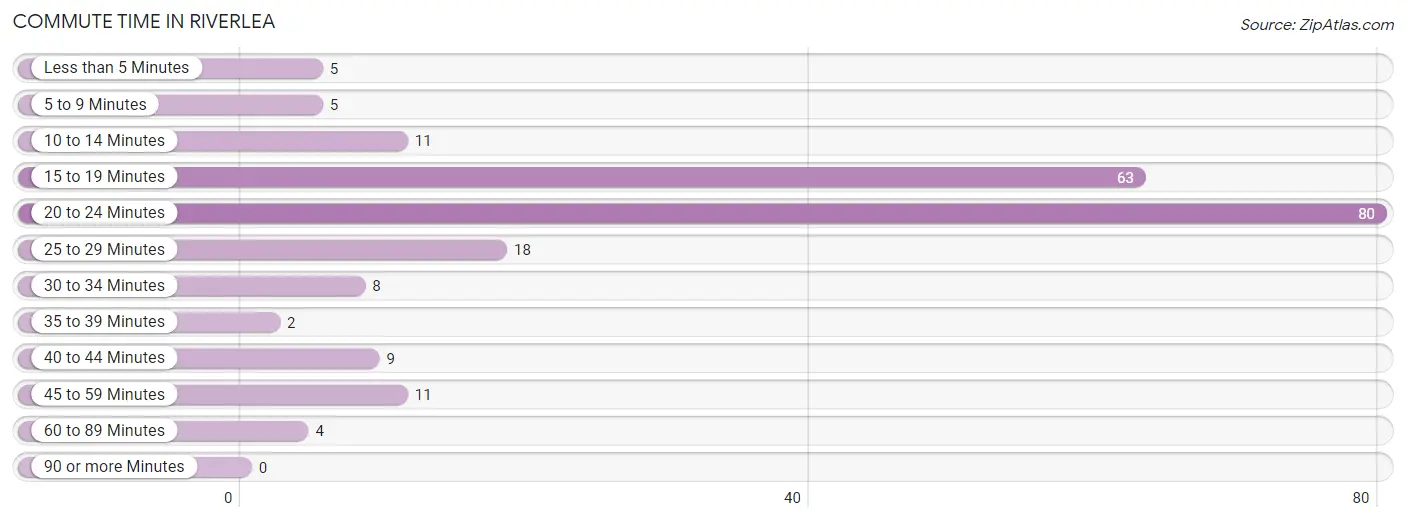
| Commute Time | # Commuters | % Commuters |
| Less than 5 Minutes | 5 | 2.3% |
| 5 to 9 Minutes | 5 | 2.3% |
| 10 to 14 Minutes | 11 | 5.1% |
| 15 to 19 Minutes | 63 | 29.2% |
| 20 to 24 Minutes | 80 | 37.0% |
| 25 to 29 Minutes | 18 | 8.3% |
| 30 to 34 Minutes | 8 | 3.7% |
| 35 to 39 Minutes | 2 | 0.9% |
| 40 to 44 Minutes | 9 | 4.2% |
| 45 to 59 Minutes | 11 | 5.1% |
| 60 to 89 Minutes | 4 | 1.8% |
| 90 or more Minutes | 0 | 0.0% |
Commute Time by Sex in Riverlea
The most common commute times in Riverlea are 20 to 24 minutes (37 commuters, 35.6%) for males and 20 to 24 minutes (43 commuters, 38.4%) for females.
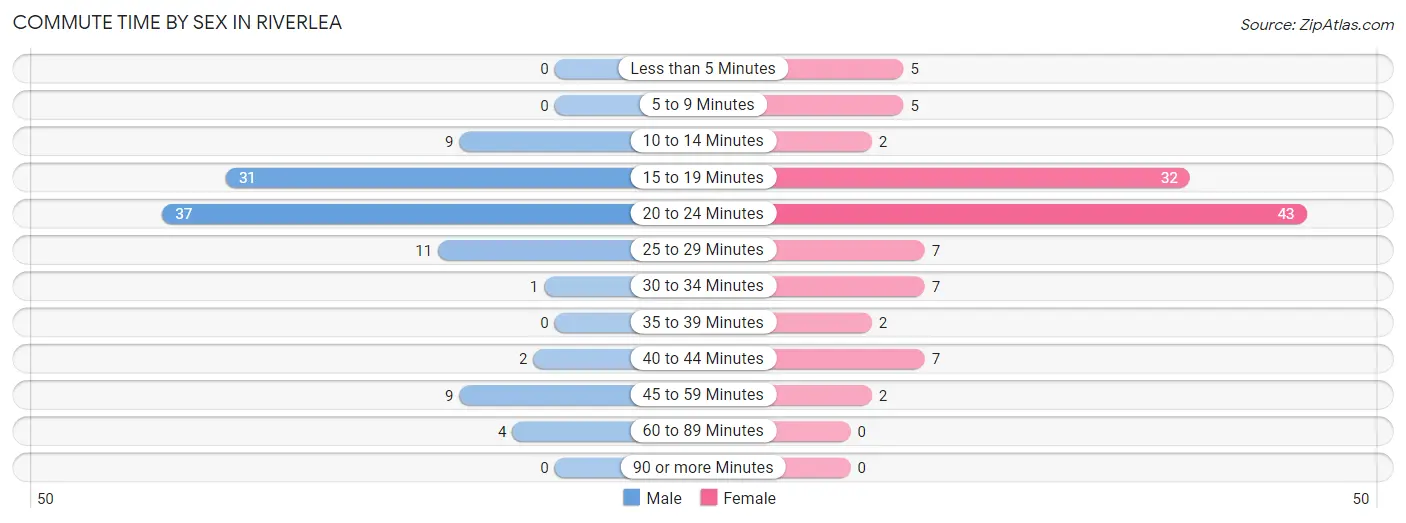
| Commute Time | Male | Female |
| Less than 5 Minutes | 0 (0.0%) | 5 (4.5%) |
| 5 to 9 Minutes | 0 (0.0%) | 5 (4.5%) |
| 10 to 14 Minutes | 9 (8.6%) | 2 (1.8%) |
| 15 to 19 Minutes | 31 (29.8%) | 32 (28.6%) |
| 20 to 24 Minutes | 37 (35.6%) | 43 (38.4%) |
| 25 to 29 Minutes | 11 (10.6%) | 7 (6.2%) |
| 30 to 34 Minutes | 1 (1.0%) | 7 (6.2%) |
| 35 to 39 Minutes | 0 (0.0%) | 2 (1.8%) |
| 40 to 44 Minutes | 2 (1.9%) | 7 (6.2%) |
| 45 to 59 Minutes | 9 (8.6%) | 2 (1.8%) |
| 60 to 89 Minutes | 4 (3.8%) | 0 (0.0%) |
| 90 or more Minutes | 0 (0.0%) | 0 (0.0%) |
Time of Departure to Work by Sex in Riverlea
The most frequent times of departure to work in Riverlea are 7:30 AM to 7:59 AM (19, 18.3%) for males and 7:30 AM to 7:59 AM (20, 17.9%) for females.
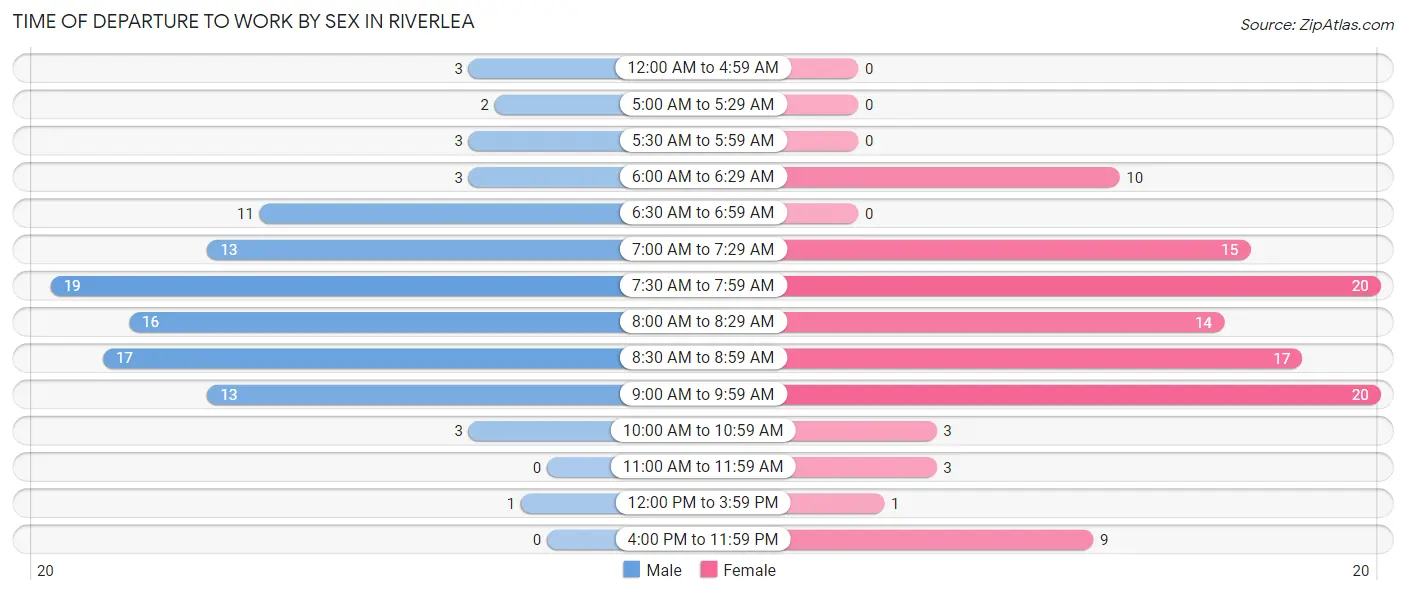
| Time of Departure | Male | Female |
| 12:00 AM to 4:59 AM | 3 (2.9%) | 0 (0.0%) |
| 5:00 AM to 5:29 AM | 2 (1.9%) | 0 (0.0%) |
| 5:30 AM to 5:59 AM | 3 (2.9%) | 0 (0.0%) |
| 6:00 AM to 6:29 AM | 3 (2.9%) | 10 (8.9%) |
| 6:30 AM to 6:59 AM | 11 (10.6%) | 0 (0.0%) |
| 7:00 AM to 7:29 AM | 13 (12.5%) | 15 (13.4%) |
| 7:30 AM to 7:59 AM | 19 (18.3%) | 20 (17.9%) |
| 8:00 AM to 8:29 AM | 16 (15.4%) | 14 (12.5%) |
| 8:30 AM to 8:59 AM | 17 (16.4%) | 17 (15.2%) |
| 9:00 AM to 9:59 AM | 13 (12.5%) | 20 (17.9%) |
| 10:00 AM to 10:59 AM | 3 (2.9%) | 3 (2.7%) |
| 11:00 AM to 11:59 AM | 0 (0.0%) | 3 (2.7%) |
| 12:00 PM to 3:59 PM | 1 (1.0%) | 1 (0.9%) |
| 4:00 PM to 11:59 PM | 0 (0.0%) | 9 (8.0%) |
| Total | 104 (100.0%) | 112 (100.0%) |
Housing Occupancy in Riverlea
Occupancy by Ownership in Riverlea
Of the total 207 dwellings in Riverlea, owner-occupied units account for 189 (91.3%), while renter-occupied units make up 18 (8.7%).
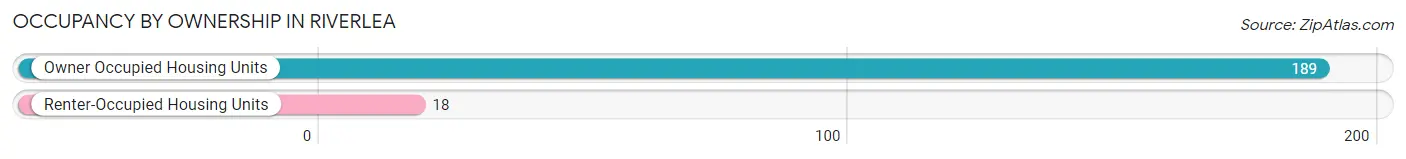
| Occupancy | # Housing Units | % Housing Units |
| Owner Occupied Housing Units | 189 | 91.3% |
| Renter-Occupied Housing Units | 18 | 8.7% |
| Total Occupied Housing Units | 207 | 100.0% |
Occupancy by Household Size in Riverlea
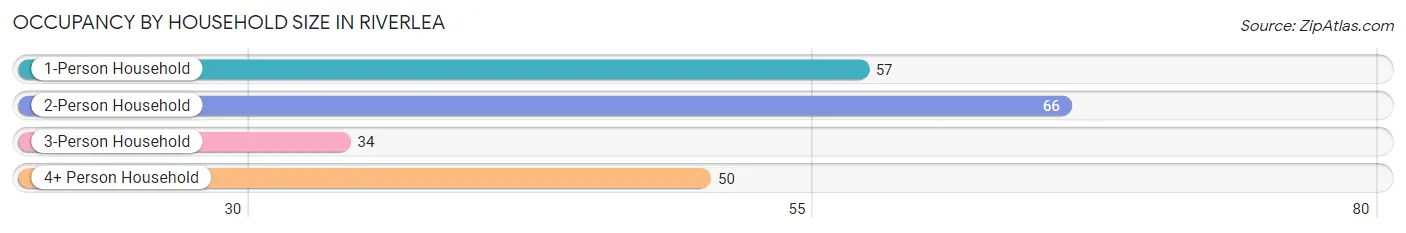
| Household Size | # Housing Units | % Housing Units |
| 1-Person Household | 57 | 27.5% |
| 2-Person Household | 66 | 31.9% |
| 3-Person Household | 34 | 16.4% |
| 4+ Person Household | 50 | 24.1% |
| Total Housing Units | 207 | 100.0% |
Occupancy by Ownership by Household Size in Riverlea
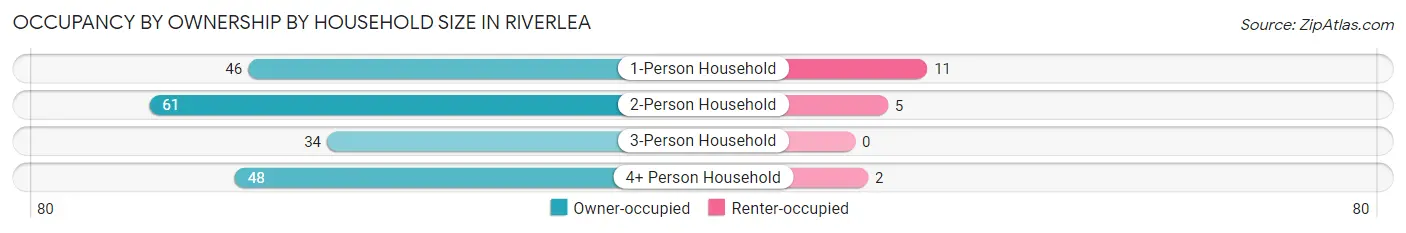
| Household Size | Owner-occupied | Renter-occupied |
| 1-Person Household | 46 (80.7%) | 11 (19.3%) |
| 2-Person Household | 61 (92.4%) | 5 (7.6%) |
| 3-Person Household | 34 (100.0%) | 0 (0.0%) |
| 4+ Person Household | 48 (96.0%) | 2 (4.0%) |
| Total Housing Units | 189 (91.3%) | 18 (8.7%) |
Occupancy by Educational Attainment in Riverlea
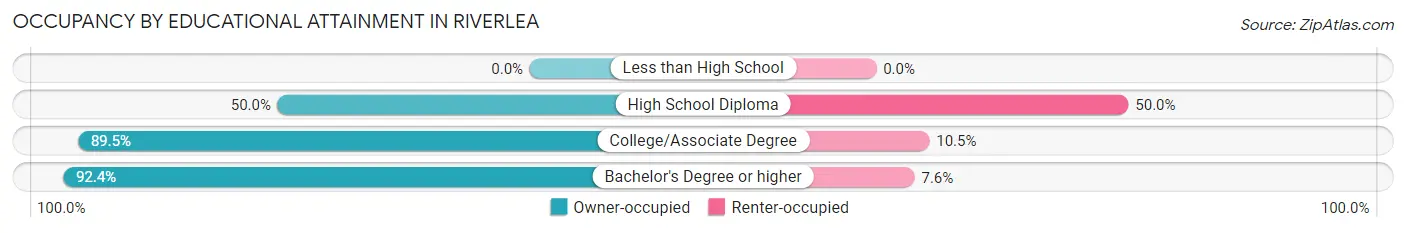
| Household Size | Owner-occupied | Renter-occupied |
| Less than High School | 0 (0.0%) | 0 (0.0%) |
| High School Diploma | 2 (50.0%) | 2 (50.0%) |
| College/Associate Degree | 17 (89.5%) | 2 (10.5%) |
| Bachelor's Degree or higher | 170 (92.4%) | 14 (7.6%) |
Occupancy by Age of Householder in Riverlea
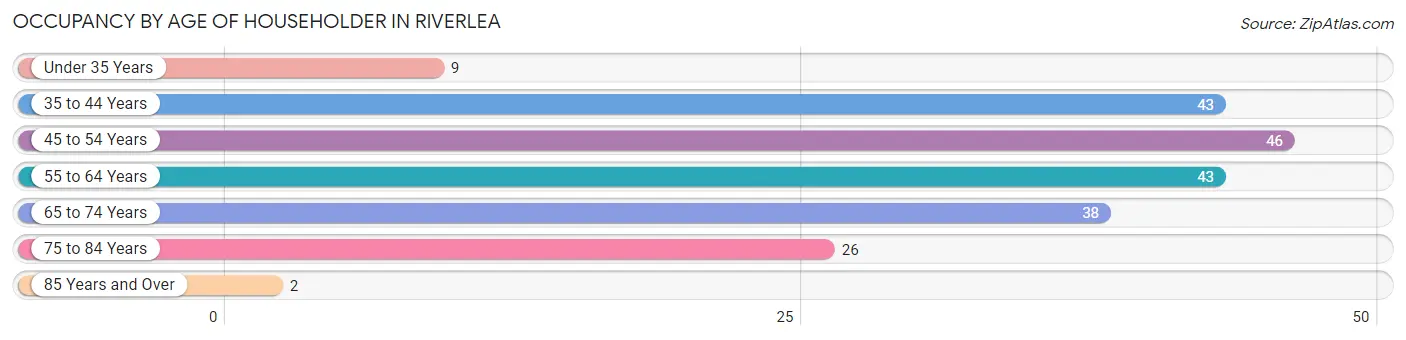
| Age Bracket | # Households | % Households |
| Under 35 Years | 9 | 4.3% |
| 35 to 44 Years | 43 | 20.8% |
| 45 to 54 Years | 46 | 22.2% |
| 55 to 64 Years | 43 | 20.8% |
| 65 to 74 Years | 38 | 18.4% |
| 75 to 84 Years | 26 | 12.6% |
| 85 Years and Over | 2 | 1.0% |
| Total | 207 | 100.0% |
Housing Finances in Riverlea
Median Income by Occupancy in Riverlea
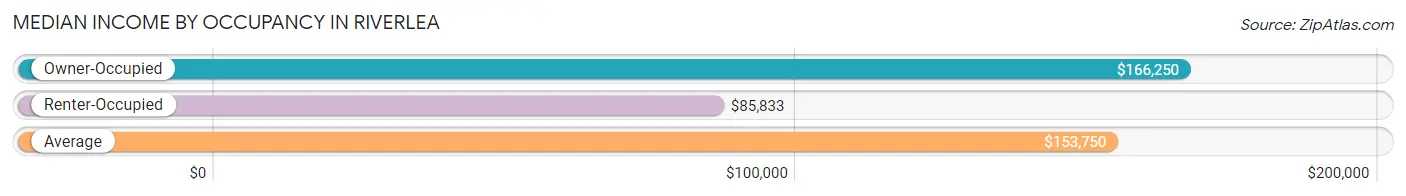
| Occupancy Type | # Households | Median Income |
| Owner-Occupied | 189 (91.3%) | $166,250 |
| Renter-Occupied | 18 (8.7%) | $85,833 |
| Average | 207 (100.0%) | $153,750 |
Occupancy by Householder Income Bracket in Riverlea
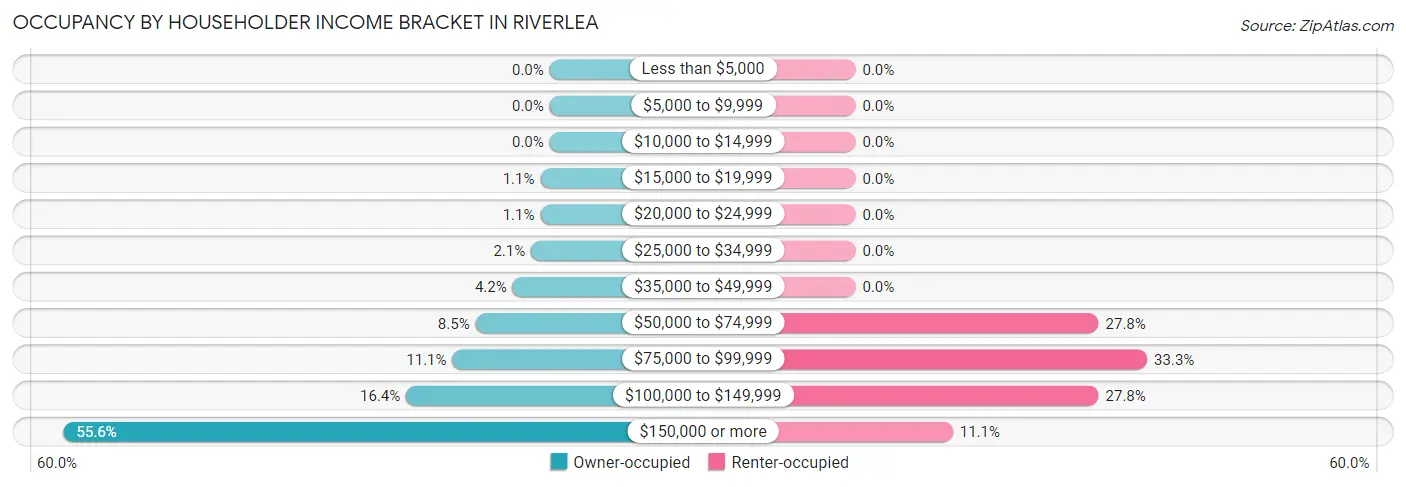
| Income Bracket | Owner-occupied | Renter-occupied |
| Less than $5,000 | 0 (0.0%) | 0 (0.0%) |
| $5,000 to $9,999 | 0 (0.0%) | 0 (0.0%) |
| $10,000 to $14,999 | 0 (0.0%) | 0 (0.0%) |
| $15,000 to $19,999 | 2 (1.1%) | 0 (0.0%) |
| $20,000 to $24,999 | 2 (1.1%) | 0 (0.0%) |
| $25,000 to $34,999 | 4 (2.1%) | 0 (0.0%) |
| $35,000 to $49,999 | 8 (4.2%) | 0 (0.0%) |
| $50,000 to $74,999 | 16 (8.5%) | 5 (27.8%) |
| $75,000 to $99,999 | 21 (11.1%) | 6 (33.3%) |
| $100,000 to $149,999 | 31 (16.4%) | 5 (27.8%) |
| $150,000 or more | 105 (55.6%) | 2 (11.1%) |
| Total | 189 (100.0%) | 18 (100.0%) |
Monthly Housing Cost Tiers in Riverlea
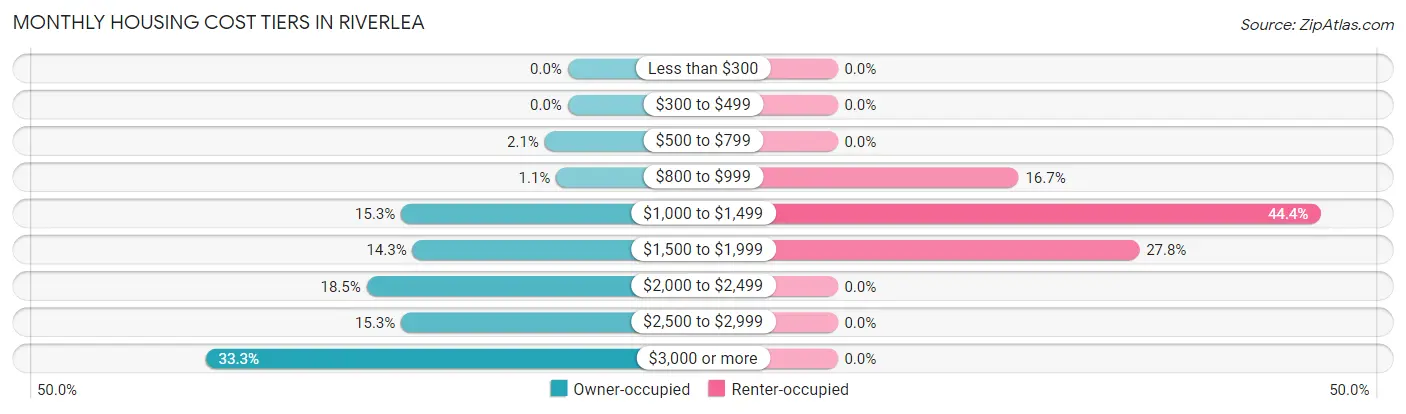
| Monthly Cost | Owner-occupied | Renter-occupied |
| Less than $300 | 0 (0.0%) | 0 (0.0%) |
| $300 to $499 | 0 (0.0%) | 0 (0.0%) |
| $500 to $799 | 4 (2.1%) | 0 (0.0%) |
| $800 to $999 | 2 (1.1%) | 3 (16.7%) |
| $1,000 to $1,499 | 29 (15.3%) | 8 (44.4%) |
| $1,500 to $1,999 | 27 (14.3%) | 5 (27.8%) |
| $2,000 to $2,499 | 35 (18.5%) | 0 (0.0%) |
| $2,500 to $2,999 | 29 (15.3%) | 0 (0.0%) |
| $3,000 or more | 63 (33.3%) | 0 (0.0%) |
| Total | 189 (100.0%) | 18 (100.0%) |
Physical Housing Characteristics in Riverlea
Housing Structures in Riverlea
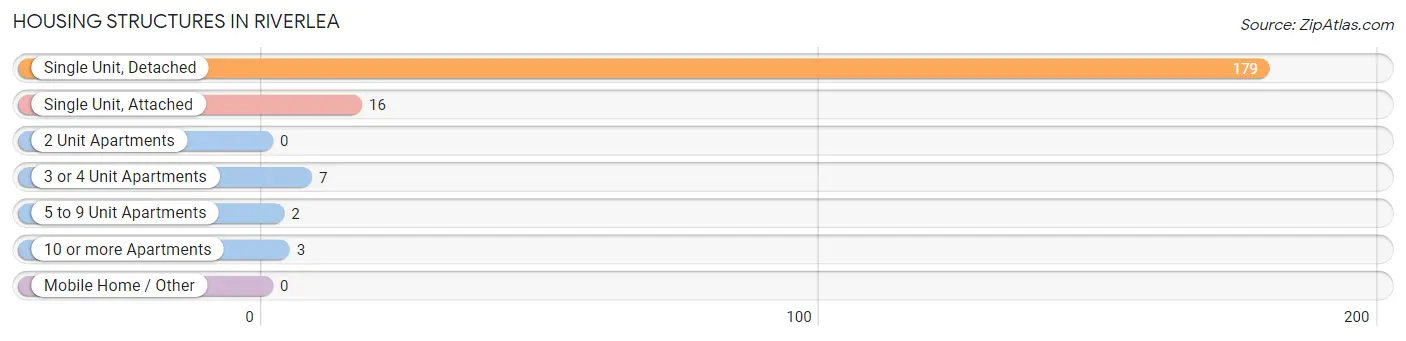
| Structure Type | # Housing Units | % Housing Units |
| Single Unit, Detached | 179 | 86.5% |
| Single Unit, Attached | 16 | 7.7% |
| 2 Unit Apartments | 0 | 0.0% |
| 3 or 4 Unit Apartments | 7 | 3.4% |
| 5 to 9 Unit Apartments | 2 | 1.0% |
| 10 or more Apartments | 3 | 1.5% |
| Mobile Home / Other | 0 | 0.0% |
| Total | 207 | 100.0% |
Housing Structures by Occupancy in Riverlea
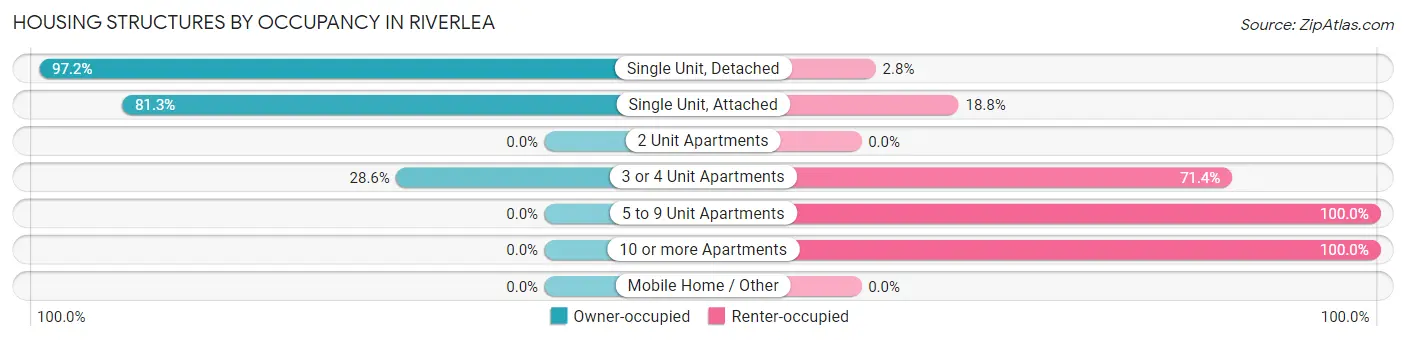
| Structure Type | Owner-occupied | Renter-occupied |
| Single Unit, Detached | 174 (97.2%) | 5 (2.8%) |
| Single Unit, Attached | 13 (81.2%) | 3 (18.8%) |
| 2 Unit Apartments | 0 (0.0%) | 0 (0.0%) |
| 3 or 4 Unit Apartments | 2 (28.6%) | 5 (71.4%) |
| 5 to 9 Unit Apartments | 0 (0.0%) | 2 (100.0%) |
| 10 or more Apartments | 0 (0.0%) | 3 (100.0%) |
| Mobile Home / Other | 0 (0.0%) | 0 (0.0%) |
| Total | 189 (91.3%) | 18 (8.7%) |
Housing Structures by Number of Rooms in Riverlea
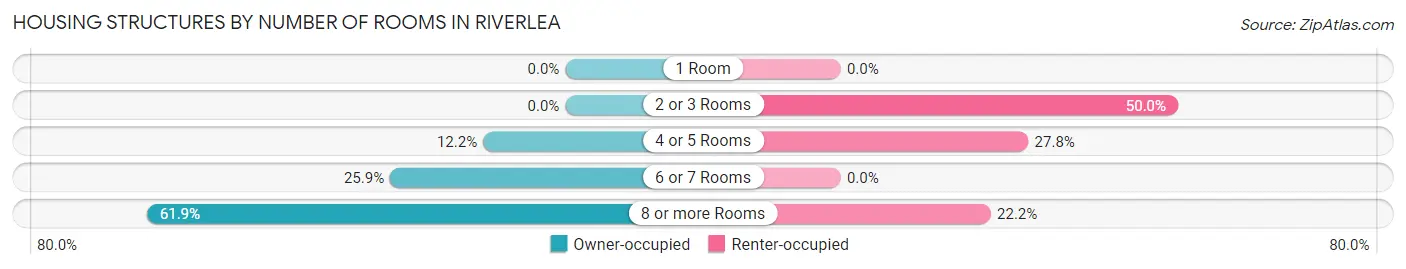
| Number of Rooms | Owner-occupied | Renter-occupied |
| 1 Room | 0 (0.0%) | 0 (0.0%) |
| 2 or 3 Rooms | 0 (0.0%) | 9 (50.0%) |
| 4 or 5 Rooms | 23 (12.2%) | 5 (27.8%) |
| 6 or 7 Rooms | 49 (25.9%) | 0 (0.0%) |
| 8 or more Rooms | 117 (61.9%) | 4 (22.2%) |
| Total | 189 (100.0%) | 18 (100.0%) |
Housing Structure by Heating Type in Riverlea
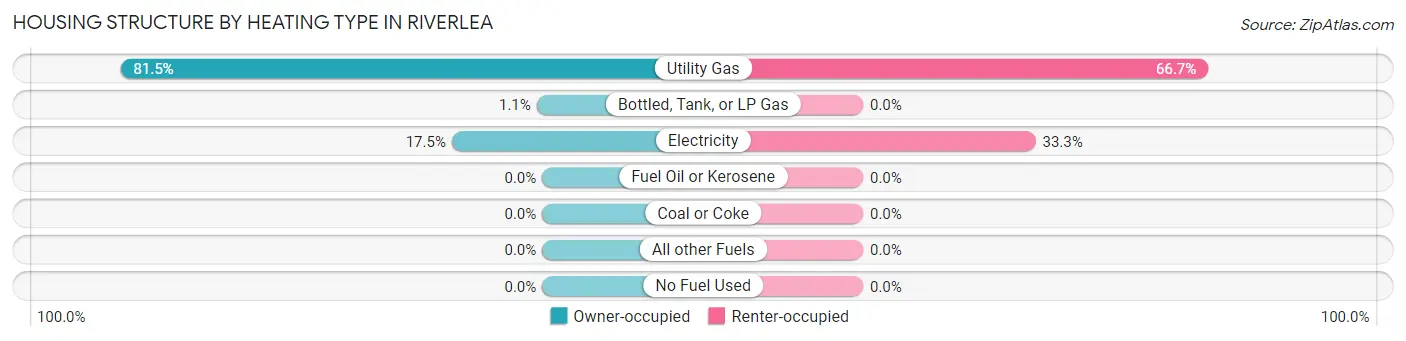
| Heating Type | Owner-occupied | Renter-occupied |
| Utility Gas | 154 (81.5%) | 12 (66.7%) |
| Bottled, Tank, or LP Gas | 2 (1.1%) | 0 (0.0%) |
| Electricity | 33 (17.5%) | 6 (33.3%) |
| Fuel Oil or Kerosene | 0 (0.0%) | 0 (0.0%) |
| Coal or Coke | 0 (0.0%) | 0 (0.0%) |
| All other Fuels | 0 (0.0%) | 0 (0.0%) |
| No Fuel Used | 0 (0.0%) | 0 (0.0%) |
| Total | 189 (100.0%) | 18 (100.0%) |
Household Vehicle Usage in Riverlea
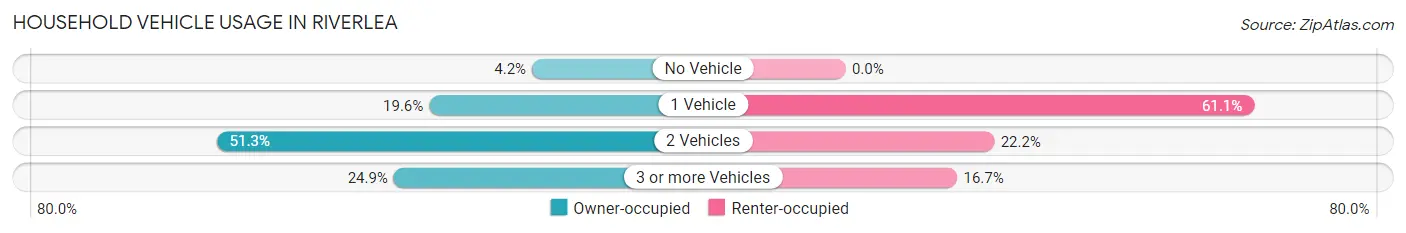
| Vehicles per Household | Owner-occupied | Renter-occupied |
| No Vehicle | 8 (4.2%) | 0 (0.0%) |
| 1 Vehicle | 37 (19.6%) | 11 (61.1%) |
| 2 Vehicles | 97 (51.3%) | 4 (22.2%) |
| 3 or more Vehicles | 47 (24.9%) | 3 (16.7%) |
| Total | 189 (100.0%) | 18 (100.0%) |
Real Estate & Mortgages in Riverlea
Real Estate and Mortgage Overview in Riverlea
| Characteristic | Without Mortgage | With Mortgage |
| Housing Units | 49 | 140 |
| Median Property Value | $461,100 | $465,800 |
| Median Household Income | $152,917 | $80 |
| Monthly Housing Costs | $1,288 | $63 |
| Real Estate Taxes | $10,001 | $0 |
Property Value by Mortgage Status in Riverlea
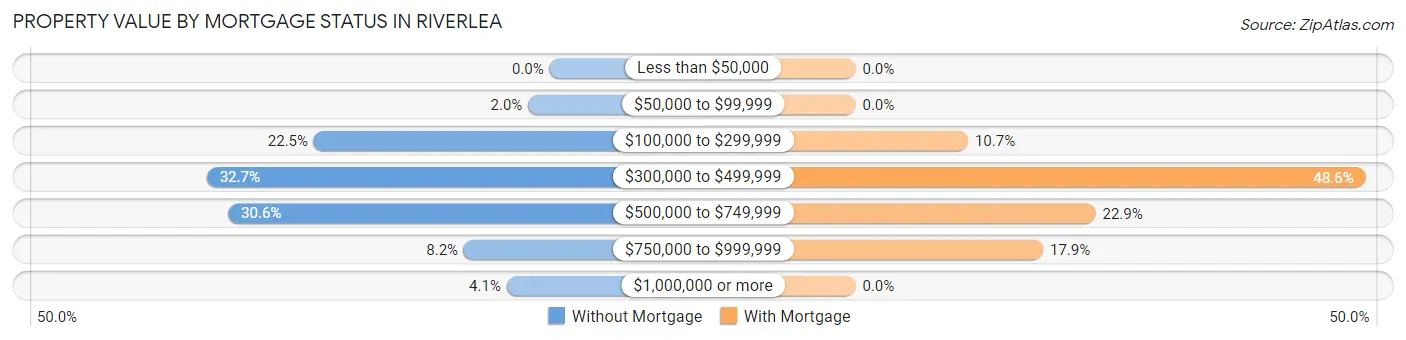
| Property Value | Without Mortgage | With Mortgage |
| Less than $50,000 | 0 (0.0%) | 0 (0.0%) |
| $50,000 to $99,999 | 1 (2.0%) | 0 (0.0%) |
| $100,000 to $299,999 | 11 (22.5%) | 15 (10.7%) |
| $300,000 to $499,999 | 16 (32.7%) | 68 (48.6%) |
| $500,000 to $749,999 | 15 (30.6%) | 32 (22.9%) |
| $750,000 to $999,999 | 4 (8.2%) | 25 (17.9%) |
| $1,000,000 or more | 2 (4.1%) | 0 (0.0%) |
| Total | 49 (100.0%) | 140 (100.0%) |
Household Income by Mortgage Status in Riverlea
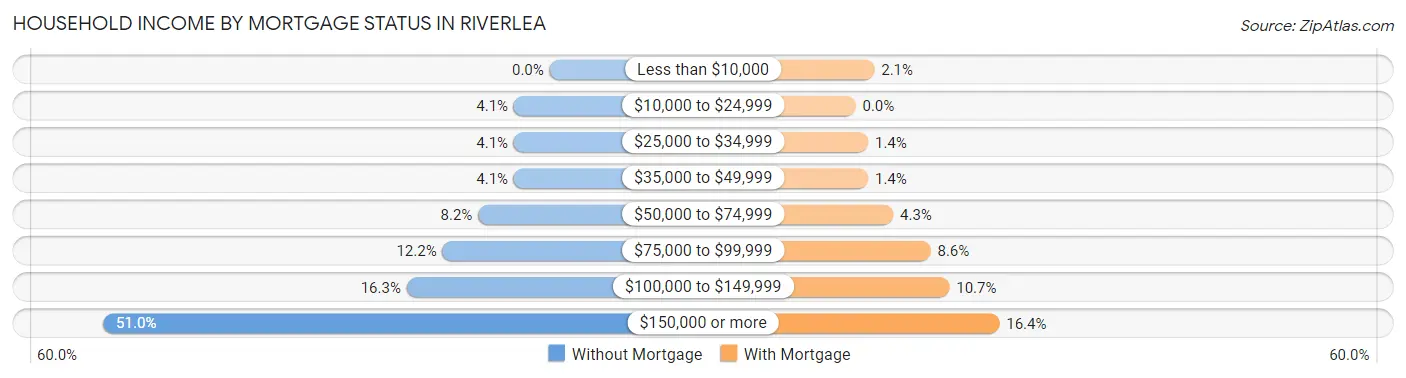
| Household Income | Without Mortgage | With Mortgage |
| Less than $10,000 | 0 (0.0%) | 3 (2.1%) |
| $10,000 to $24,999 | 2 (4.1%) | 0 (0.0%) |
| $25,000 to $34,999 | 2 (4.1%) | 2 (1.4%) |
| $35,000 to $49,999 | 2 (4.1%) | 2 (1.4%) |
| $50,000 to $74,999 | 4 (8.2%) | 6 (4.3%) |
| $75,000 to $99,999 | 6 (12.2%) | 12 (8.6%) |
| $100,000 to $149,999 | 8 (16.3%) | 15 (10.7%) |
| $150,000 or more | 25 (51.0%) | 23 (16.4%) |
| Total | 49 (100.0%) | 140 (100.0%) |
Property Value to Household Income Ratio in Riverlea
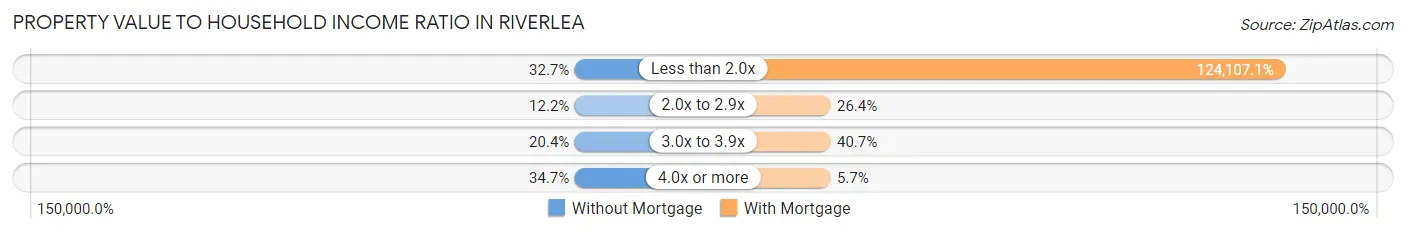
| Value-to-Income Ratio | Without Mortgage | With Mortgage |
| Less than 2.0x | 16 (32.7%) | 173,750 (124,107.1%) |
| 2.0x to 2.9x | 6 (12.2%) | 37 (26.4%) |
| 3.0x to 3.9x | 10 (20.4%) | 57 (40.7%) |
| 4.0x or more | 17 (34.7%) | 8 (5.7%) |
| Total | 49 (100.0%) | 140 (100.0%) |
Real Estate Taxes by Mortgage Status in Riverlea
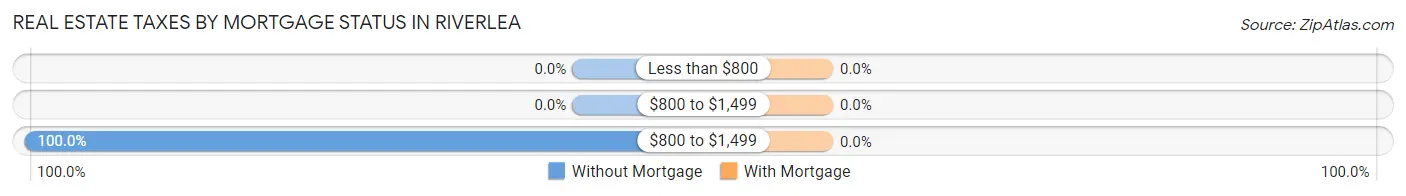
| Property Taxes | Without Mortgage | With Mortgage |
| Less than $800 | 0 (0.0%) | 0 (0.0%) |
| $800 to $1,499 | 0 (0.0%) | 0 (0.0%) |
| $800 to $1,499 | 49 (100.0%) | 0 (0.0%) |
| Total | 49 (100.0%) | 140 (100.0%) |
Health & Disability in Riverlea
Health Insurance Coverage by Age in Riverlea
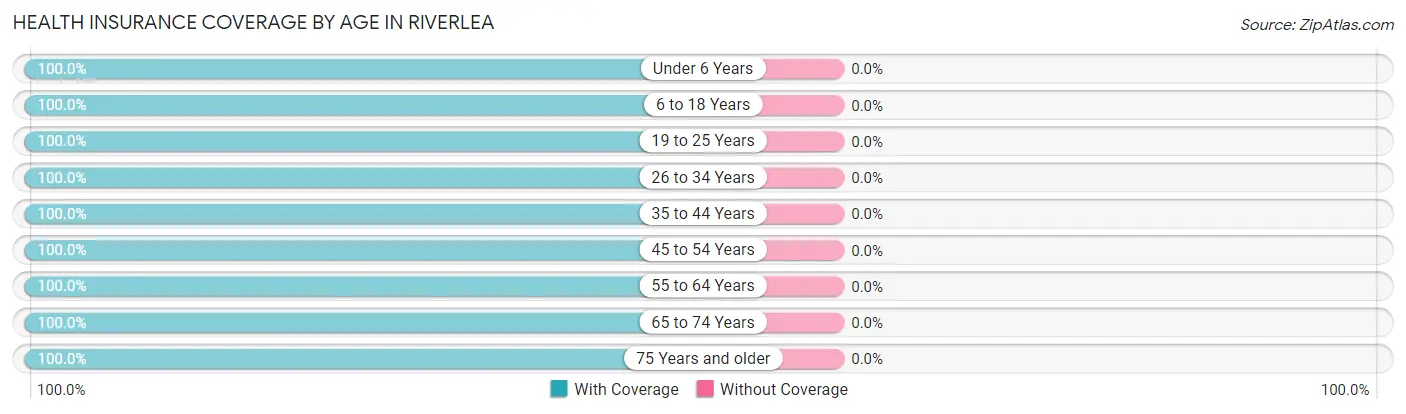
| Age Bracket | With Coverage | Without Coverage |
| Under 6 Years | 26 (100.0%) | 0 (0.0%) |
| 6 to 18 Years | 113 (100.0%) | 0 (0.0%) |
| 19 to 25 Years | 22 (100.0%) | 0 (0.0%) |
| 26 to 34 Years | 20 (100.0%) | 0 (0.0%) |
| 35 to 44 Years | 74 (100.0%) | 0 (0.0%) |
| 45 to 54 Years | 80 (100.0%) | 0 (0.0%) |
| 55 to 64 Years | 85 (100.0%) | 0 (0.0%) |
| 65 to 74 Years | 61 (100.0%) | 0 (0.0%) |
| 75 Years and older | 34 (100.0%) | 0 (0.0%) |
| Total | 515 (100.0%) | 0 (0.0%) |
Health Insurance Coverage by Citizenship Status in Riverlea
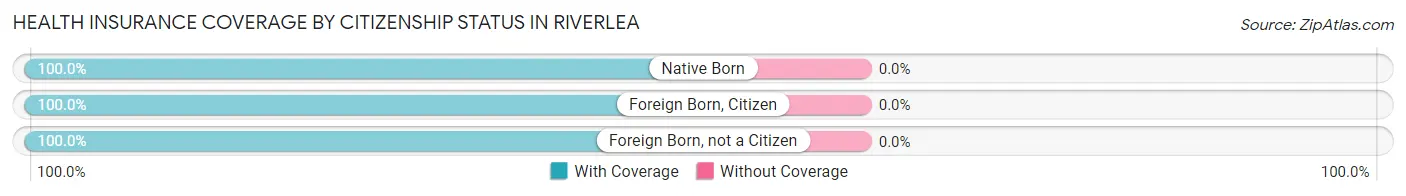
| Citizenship Status | With Coverage | Without Coverage |
| Native Born | 26 (100.0%) | 0 (0.0%) |
| Foreign Born, Citizen | 113 (100.0%) | 0 (0.0%) |
| Foreign Born, not a Citizen | 22 (100.0%) | 0 (0.0%) |
Health Insurance Coverage by Household Income in Riverlea
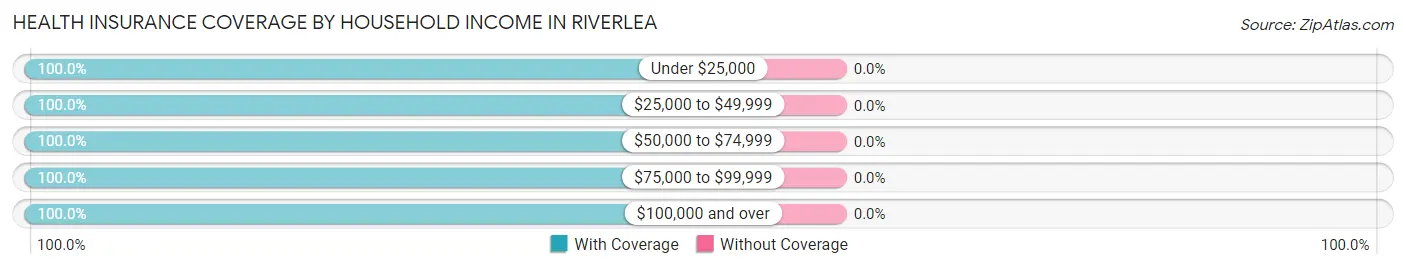
| Household Income | With Coverage | Without Coverage |
| Under $25,000 | 7 (100.0%) | 0 (0.0%) |
| $25,000 to $49,999 | 13 (100.0%) | 0 (0.0%) |
| $50,000 to $74,999 | 30 (100.0%) | 0 (0.0%) |
| $75,000 to $99,999 | 45 (100.0%) | 0 (0.0%) |
| $100,000 and over | 420 (100.0%) | 0 (0.0%) |
Public vs Private Health Insurance Coverage by Age in Riverlea
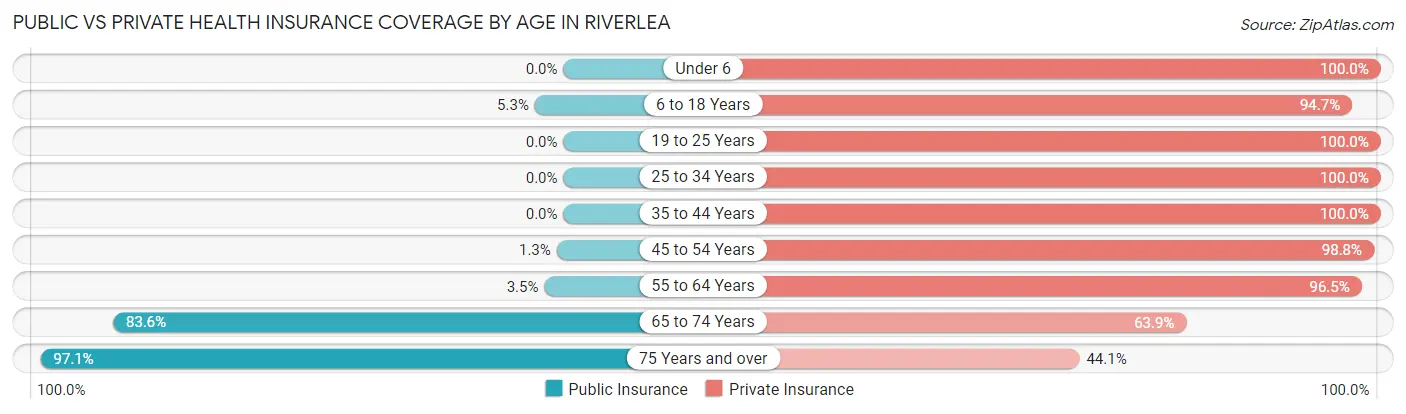
| Age Bracket | Public Insurance | Private Insurance |
| Under 6 | 0 (0.0%) | 26 (100.0%) |
| 6 to 18 Years | 6 (5.3%) | 107 (94.7%) |
| 19 to 25 Years | 0 (0.0%) | 22 (100.0%) |
| 25 to 34 Years | 0 (0.0%) | 20 (100.0%) |
| 35 to 44 Years | 0 (0.0%) | 74 (100.0%) |
| 45 to 54 Years | 1 (1.3%) | 79 (98.8%) |
| 55 to 64 Years | 3 (3.5%) | 82 (96.5%) |
| 65 to 74 Years | 51 (83.6%) | 39 (63.9%) |
| 75 Years and over | 33 (97.1%) | 15 (44.1%) |
| Total | 94 (18.2%) | 464 (90.1%) |
Disability Status by Sex by Age in Riverlea
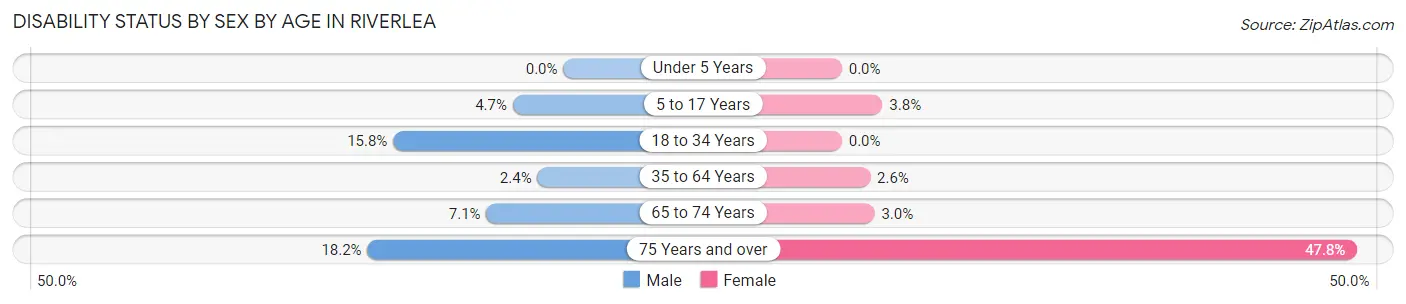
| Age Bracket | Male | Female |
| Under 5 Years | 0 (0.0%) | 0 (0.0%) |
| 5 to 17 Years | 3 (4.7%) | 2 (3.8%) |
| 18 to 34 Years | 3 (15.8%) | 0 (0.0%) |
| 35 to 64 Years | 3 (2.4%) | 3 (2.6%) |
| 65 to 74 Years | 2 (7.1%) | 1 (3.0%) |
| 75 Years and over | 2 (18.2%) | 11 (47.8%) |
Disability Class by Sex by Age in Riverlea
Disability Class: Hearing Difficulty
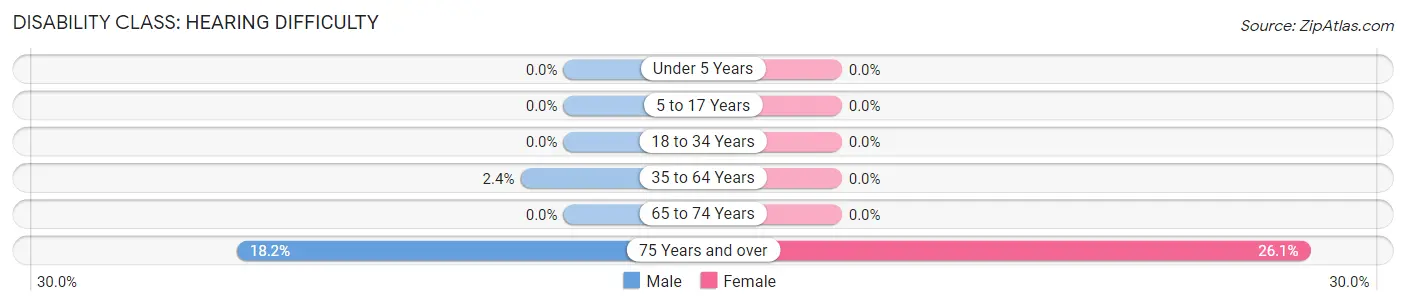
| Age Bracket | Male | Female |
| Under 5 Years | 0 (0.0%) | 0 (0.0%) |
| 5 to 17 Years | 0 (0.0%) | 0 (0.0%) |
| 18 to 34 Years | 0 (0.0%) | 0 (0.0%) |
| 35 to 64 Years | 3 (2.4%) | 0 (0.0%) |
| 65 to 74 Years | 0 (0.0%) | 0 (0.0%) |
| 75 Years and over | 2 (18.2%) | 6 (26.1%) |
Disability Class: Vision Difficulty
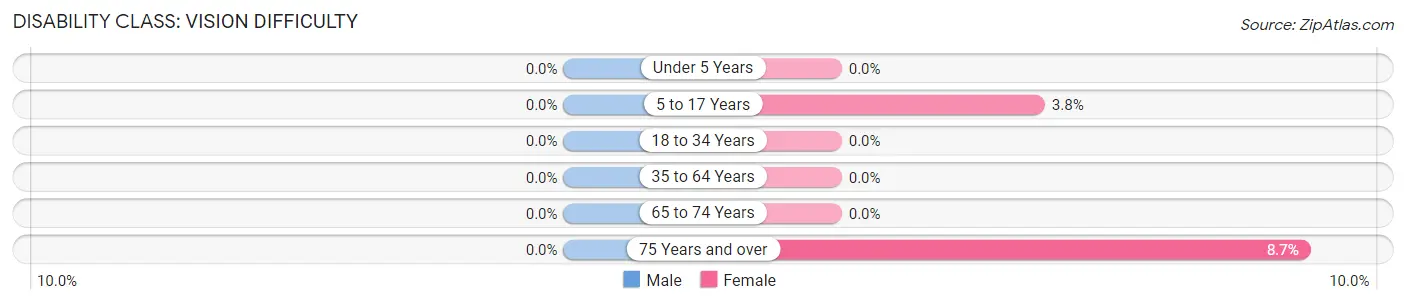
| Age Bracket | Male | Female |
| Under 5 Years | 0 (0.0%) | 0 (0.0%) |
| 5 to 17 Years | 0 (0.0%) | 2 (3.8%) |
| 18 to 34 Years | 0 (0.0%) | 0 (0.0%) |
| 35 to 64 Years | 0 (0.0%) | 0 (0.0%) |
| 65 to 74 Years | 0 (0.0%) | 0 (0.0%) |
| 75 Years and over | 0 (0.0%) | 2 (8.7%) |
Disability Class: Cognitive Difficulty
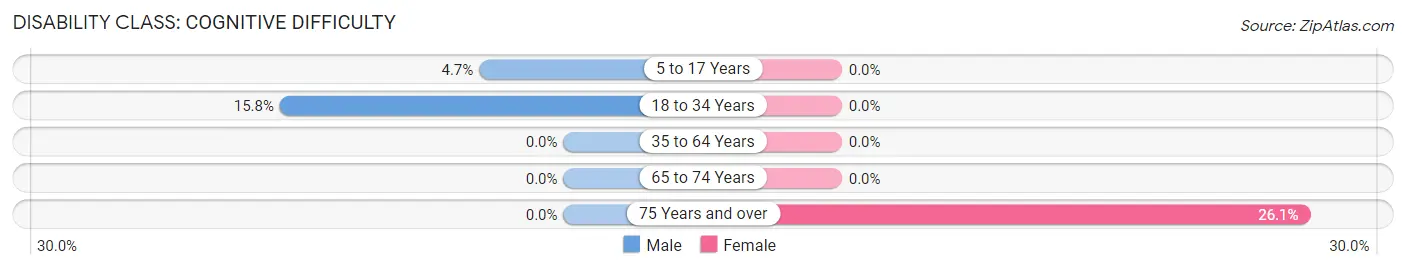
| Age Bracket | Male | Female |
| 5 to 17 Years | 3 (4.7%) | 0 (0.0%) |
| 18 to 34 Years | 3 (15.8%) | 0 (0.0%) |
| 35 to 64 Years | 0 (0.0%) | 0 (0.0%) |
| 65 to 74 Years | 0 (0.0%) | 0 (0.0%) |
| 75 Years and over | 0 (0.0%) | 6 (26.1%) |
Disability Class: Ambulatory Difficulty
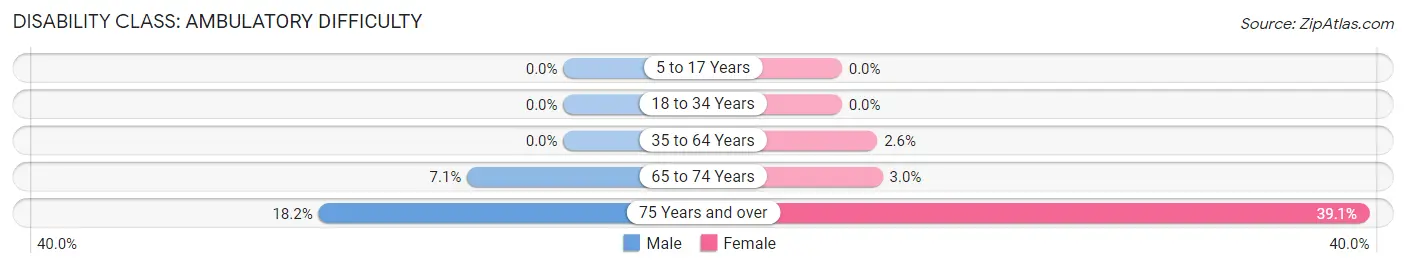
| Age Bracket | Male | Female |
| 5 to 17 Years | 0 (0.0%) | 0 (0.0%) |
| 18 to 34 Years | 0 (0.0%) | 0 (0.0%) |
| 35 to 64 Years | 0 (0.0%) | 3 (2.6%) |
| 65 to 74 Years | 2 (7.1%) | 1 (3.0%) |
| 75 Years and over | 2 (18.2%) | 9 (39.1%) |
Disability Class: Self-Care Difficulty
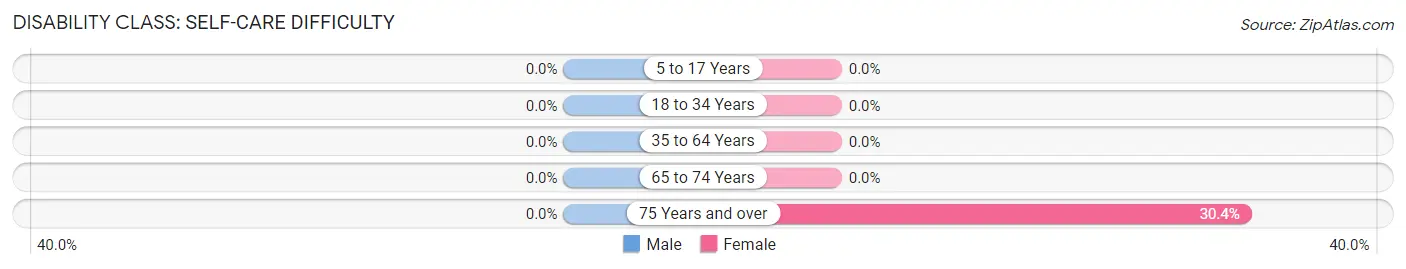
| Age Bracket | Male | Female |
| 5 to 17 Years | 0 (0.0%) | 0 (0.0%) |
| 18 to 34 Years | 0 (0.0%) | 0 (0.0%) |
| 35 to 64 Years | 0 (0.0%) | 0 (0.0%) |
| 65 to 74 Years | 0 (0.0%) | 0 (0.0%) |
| 75 Years and over | 0 (0.0%) | 7 (30.4%) |
Technology Access in Riverlea
Computing Device Access in Riverlea
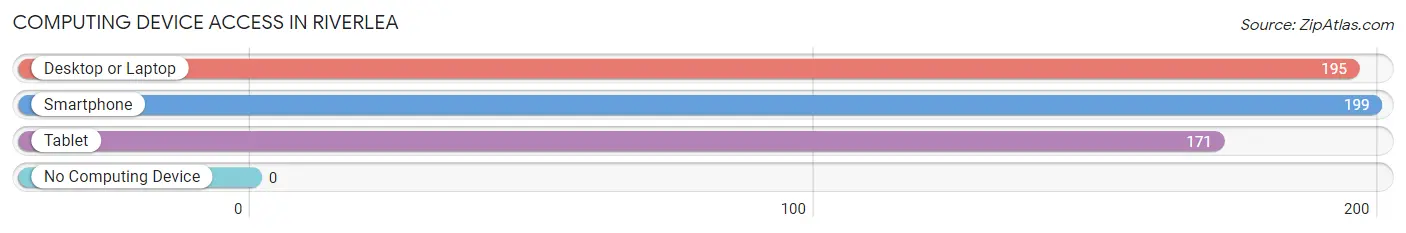
| Device Type | # Households | % Households |
| Desktop or Laptop | 195 | 94.2% |
| Smartphone | 199 | 96.1% |
| Tablet | 171 | 82.6% |
| No Computing Device | 0 | 0.0% |
| Total | 207 | 100.0% |
Internet Access in Riverlea
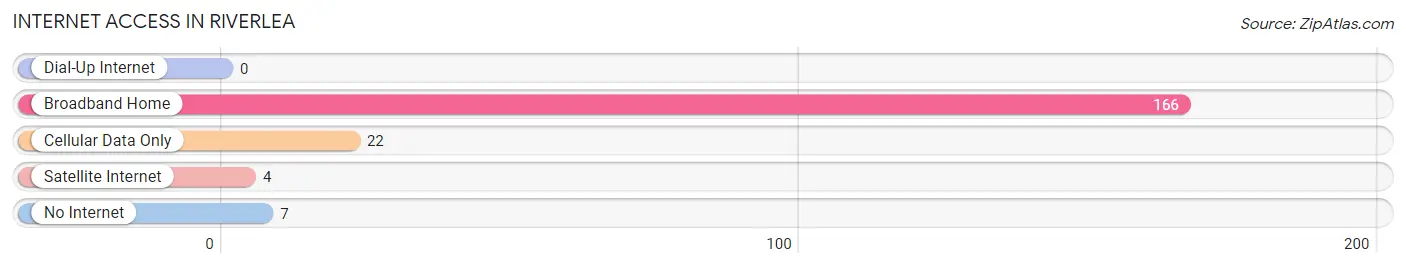
| Internet Type | # Households | % Households |
| Dial-Up Internet | 0 | 0.0% |
| Broadband Home | 166 | 80.2% |
| Cellular Data Only | 22 | 10.6% |
| Satellite Internet | 4 | 1.9% |
| No Internet | 7 | 3.4% |
| Total | 207 | 100.0% |
Riverlea Summary
Riverlea is a village located in Franklin County, Ohio, United States. The population was 1,068 at the 2010 census. It is a suburb of Columbus, the state capital.
Geography
Riverlea is located at 40 4 17 N 83 7 17 W 40 071445 83 121445
According to the United States Census Bureau, the village has a total area of 0.37 square miles (0.96 km2), all land.
History
Riverlea was founded in 1924 by a group of investors who wanted to create a residential community near the Olentangy River. The village was incorporated in 1925 and was named after the river.
The village was originally planned as a residential community, but it soon became a popular destination for businesses. The first business to open in Riverlea was a grocery store in 1925. Other businesses soon followed, including a gas station, a bank, a post office, and a movie theater.
In the 1950s, Riverlea began to experience rapid growth. The population increased from 1,000 in 1950 to more than 3,000 in 1960. This growth was due in part to the construction of Interstate 270, which provided easy access to the village from Columbus.
Economy
Riverlea is a primarily residential community, but it does have a few businesses. The largest employer in the village is the Riverlea Country Club, which employs about 50 people. Other businesses in the village include a gas station, a bank, a post office, and a few restaurants.
Demographics
As of the census of 2010, there were 1,068 people, 441 households, and 315 families residing in the village. The population density was 2,890.9 people per square mile (1,118.2/km2). There were 471 housing units at an average density of 1,269.7 per square mile (489.2/km2). The racial makeup of the village was 97.2% White, 0.7% African American, 0.2% Native American, 0.7% Asian, 0.2% from other races, and 1.0% from two or more races. Hispanic or Latino of any race were 0.7% of the population.
There were 441 households, out of which 28.2% had children under the age of 18 living with them, 58.2% were married couples living together, 8.2% had a female householder with no husband present, and 30.2% were non-families. 25.2% of all households were made up of individuals, and 11.3% had someone living alone who was 65 years of age or older. The average household size was 2.42 and the average family size was 2.90.
In the village, the population was spread out, with 22.7% under the age of 18, 5.2% from 18 to 24, 24.2% from 25 to 44, 30.2% from 45 to 64, and 17.7% who were 65 years of age or older. The median age was 43 years. For every 100 females, there were 92.2 males. For every 100 females age 18 and over, there were 88.2 males.
The median income for a household in the village was $76,250, and the median income for a family was $90,000. Males had a median income of $60,000 versus $41,250 for females. The per capita income for the village was $37,845. About 2.2% of families and 3.2% of the population were below the poverty line, including 4.2% of those under age 18 and 4.2% of those age 65 or over.
Common Questions
What is Per Capita Income in Riverlea?
Per Capita income in Riverlea is $80,265.
What is the Median Family Income in Riverlea?
Median Family Income in Riverlea is $211,250.
What is the Median Household income in Riverlea?
Median Household Income in Riverlea is $153,750.
What is Income or Wage Gap in Riverlea?
Income or Wage Gap in Riverlea is 39.1%.
Women in Riverlea earn 60.9 cents for every dollar earned by a man.
What is Inequality or Gini Index in Riverlea?
Inequality or Gini Index in Riverlea is 0.39.
What is the Total Population of Riverlea?
Total Population of Riverlea is 515.
What is the Total Male Population of Riverlea?
Total Male Population of Riverlea is 252.
What is the Total Female Population of Riverlea?
Total Female Population of Riverlea is 263.
What is the Ratio of Males per 100 Females in Riverlea?
There are 95.82 Males per 100 Females in Riverlea.
What is the Ratio of Females per 100 Males in Riverlea?
There are 104.37 Females per 100 Males in Riverlea.
What is the Median Population Age in Riverlea?
Median Population Age in Riverlea is 45.5 Years.
What is the Average Family Size in Riverlea
Average Family Size in Riverlea is 3.1 People.
What is the Average Household Size in Riverlea
Average Household Size in Riverlea is 2.5 People.
How Large is the Labor Force in Riverlea?
There are 292 People in the Labor Forcein in Riverlea.
What is the Percentage of People in the Labor Force in Riverlea?
74.1% of People are in the Labor Force in Riverlea.
What is the Unemployment Rate in Riverlea?
Unemployment Rate in Riverlea is 2.1%.