Cities with the Largest Hispanic or Latino Community in Ohio
RELATED REPORTS & OPTIONS
Hispanic or Latino
Ohio
Compare Cities
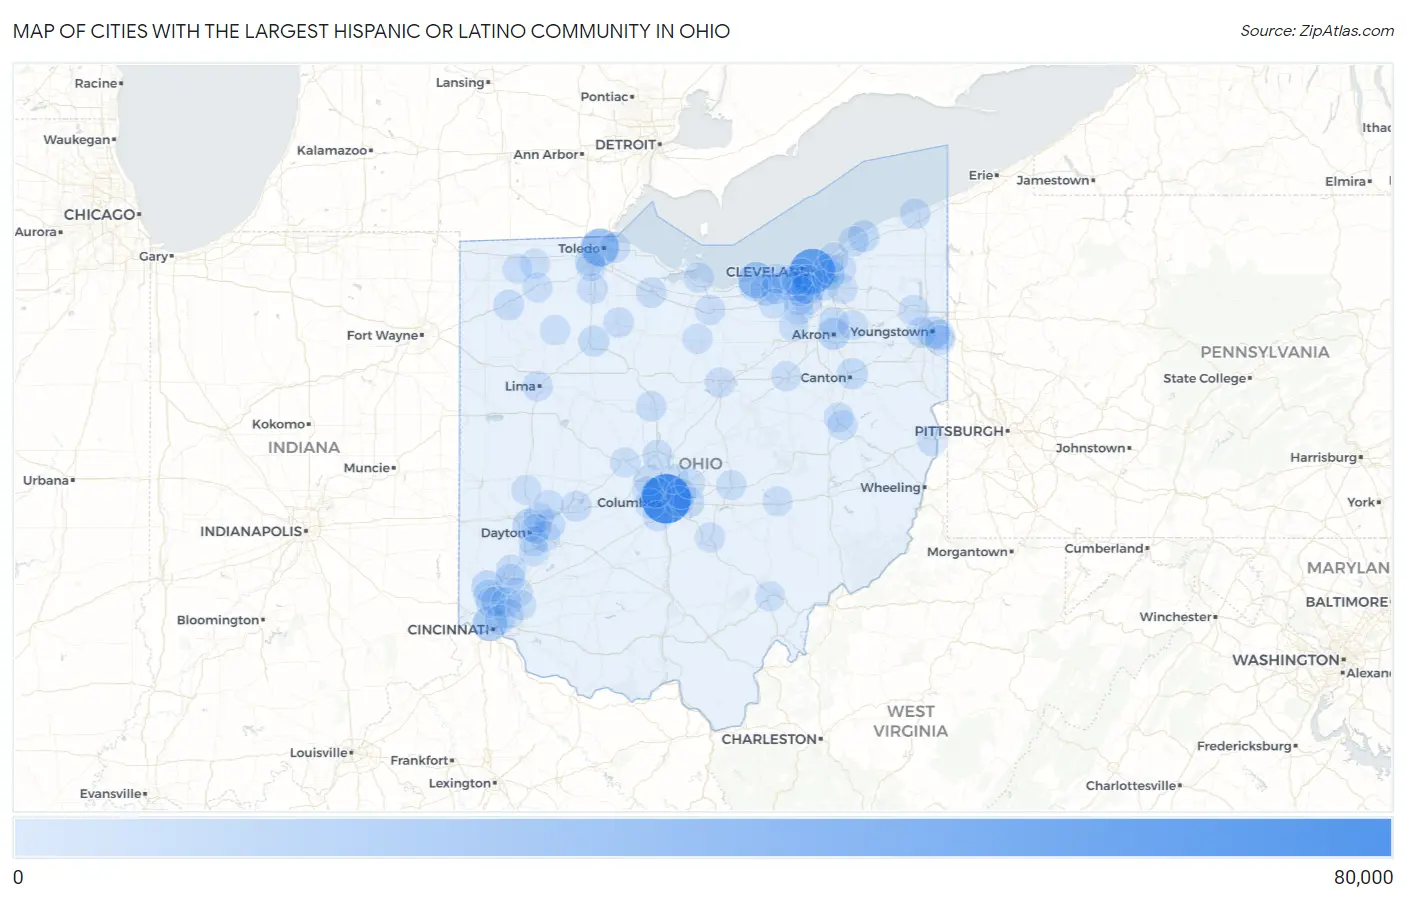
Map of Cities with the Largest Hispanic or Latino Community in Ohio
0
80,000
Cities with the Largest Hispanic or Latino Community in Ohio
| City | Hispanic or Latino | vs State | vs National | |
| 1. | Columbus | 60,228 | 494,625(12.18%)#1 | 61,755,866(0.10%)#124 |
| 2. | Cleveland | 46,349 | 494,625(9.37%)#2 | 61,755,866(0.08%)#182 |
| 3. | Toledo | 24,076 | 494,625(4.87%)#3 | 61,755,866(0.04%)#395 |
| 4. | Lorain | 18,364 | 494,625(3.71%)#4 | 61,755,866(0.03%)#511 |
| 5. | Cincinnati | 14,114 | 494,625(2.85%)#5 | 61,755,866(0.02%)#659 |
| 6. | Dayton | 7,172 | 494,625(1.45%)#6 | 61,755,866(0.01%)#1,195 |
| 7. | Youngstown | 6,729 | 494,625(1.36%)#7 | 61,755,866(0.01%)#1,254 |
| 8. | Akron | 6,479 | 494,625(1.31%)#8 | 61,755,866(0.01%)#1,289 |
| 9. | Hamilton | 5,898 | 494,625(1.19%)#9 | 61,755,866(0.01%)#1,384 |
| 10. | Parma | 5,887 | 494,625(1.19%)#10 | 61,755,866(0.01%)#1,388 |
| 11. | Elyria | 5,245 | 494,625(1.06%)#11 | 61,755,866(0.01%)#1,507 |
| 12. | Painesville | 4,949 | 494,625(1.00%)#12 | 61,755,866(0.01%)#1,574 |
| 13. | Canton | 3,623 | 494,625(0.73%)#13 | 61,755,866(0.01%)#2,012 |
| 14. | Findlay | 3,300 | 494,625(0.67%)#14 | 61,755,866(0.01%)#2,149 |
| 15. | Fairfield | 3,282 | 494,625(0.66%)#15 | 61,755,866(0.01%)#2,163 |
| 16. | Reynoldsburg | 2,967 | 494,625(0.60%)#16 | 61,755,866(0.00%)#2,307 |
| 17. | Springfield | 2,893 | 494,625(0.58%)#17 | 61,755,866(0.00%)#2,348 |
| 18. | Defiance | 2,535 | 494,625(0.51%)#18 | 61,755,866(0.00%)#2,586 |
| 19. | North Ridgeville | 2,401 | 494,625(0.49%)#19 | 61,755,866(0.00%)#2,673 |
| 20. | Fremont | 2,334 | 494,625(0.47%)#20 | 61,755,866(0.00%)#2,712 |
| 21. | Forest Park | 2,302 | 494,625(0.47%)#21 | 61,755,866(0.00%)#2,733 |
| 22. | Lakewood | 2,290 | 494,625(0.46%)#22 | 61,755,866(0.00%)#2,743 |
| 23. | Ashtabula | 2,283 | 494,625(0.46%)#23 | 61,755,866(0.00%)#2,753 |
| 24. | North Olmsted | 2,234 | 494,625(0.45%)#24 | 61,755,866(0.00%)#2,797 |
| 25. | Middletown | 2,183 | 494,625(0.44%)#25 | 61,755,866(0.00%)#2,841 |
| 26. | Dublin | 2,078 | 494,625(0.42%)#26 | 61,755,866(0.00%)#2,953 |
| 27. | Campbell | 2,077 | 494,625(0.42%)#27 | 61,755,866(0.00%)#2,956 |
| 28. | Bowling Green | 2,052 | 494,625(0.41%)#28 | 61,755,866(0.00%)#2,974 |
| 29. | Whitehall | 2,033 | 494,625(0.41%)#29 | 61,755,866(0.00%)#2,996 |
| 30. | Oregon | 1,957 | 494,625(0.40%)#30 | 61,755,866(0.00%)#3,081 |
| 31. | Lima | 1,901 | 494,625(0.38%)#31 | 61,755,866(0.00%)#3,148 |
| 32. | Fostoria | 1,743 | 494,625(0.35%)#32 | 61,755,866(0.00%)#3,309 |
| 33. | Beavercreek | 1,707 | 494,625(0.35%)#33 | 61,755,866(0.00%)#3,357 |
| 34. | Austintown | 1,696 | 494,625(0.34%)#34 | 61,755,866(0.00%)#3,368 |
| 35. | Sandusky | 1,624 | 494,625(0.33%)#35 | 61,755,866(0.00%)#3,457 |
| 36. | Marion | 1,623 | 494,625(0.33%)#36 | 61,755,866(0.00%)#3,459 |
| 37. | Brooklyn | 1,578 | 494,625(0.32%)#37 | 61,755,866(0.00%)#3,516 |
| 38. | Cuyahoga Falls | 1,542 | 494,625(0.31%)#38 | 61,755,866(0.00%)#3,566 |
| 39. | Hilliard | 1,482 | 494,625(0.30%)#39 | 61,755,866(0.00%)#3,659 |
| 40. | Delaware | 1,480 | 494,625(0.30%)#40 | 61,755,866(0.00%)#3,664 |
| 41. | Garfield Heights | 1,468 | 494,625(0.30%)#41 | 61,755,866(0.00%)#3,675 |
| 42. | Springdale | 1,449 | 494,625(0.29%)#42 | 61,755,866(0.00%)#3,705 |
| 43. | New Philadelphia | 1,448 | 494,625(0.29%)#43 | 61,755,866(0.00%)#3,708 |
| 44. | North Royalton | 1,443 | 494,625(0.29%)#44 | 61,755,866(0.00%)#3,715 |
| 45. | Norwalk | 1,441 | 494,625(0.29%)#45 | 61,755,866(0.00%)#3,720 |
| 46. | Warren | 1,436 | 494,625(0.29%)#46 | 61,755,866(0.00%)#3,727 |
| 47. | Lincoln Village | 1,405 | 494,625(0.28%)#47 | 61,755,866(0.00%)#3,780 |
| 48. | Strongsville | 1,403 | 494,625(0.28%)#48 | 61,755,866(0.00%)#3,787 |
| 49. | Fairborn | 1,396 | 494,625(0.28%)#49 | 61,755,866(0.00%)#3,796 |
| 50. | Mansfield | 1,393 | 494,625(0.28%)#50 | 61,755,866(0.00%)#3,801 |
| 51. | Mentor | 1,345 | 494,625(0.27%)#51 | 61,755,866(0.00%)#3,889 |
| 52. | Kettering | 1,317 | 494,625(0.27%)#52 | 61,755,866(0.00%)#3,936 |
| 53. | Newark | 1,317 | 494,625(0.27%)#53 | 61,755,866(0.00%)#3,937 |
| 54. | Brook Park | 1,242 | 494,625(0.25%)#54 | 61,755,866(0.00%)#4,066 |
| 55. | Huber Heights | 1,234 | 494,625(0.25%)#55 | 61,755,866(0.00%)#4,079 |
| 56. | Cleveland Heights | 1,229 | 494,625(0.25%)#56 | 61,755,866(0.00%)#4,091 |
| 57. | Brunswick | 1,218 | 494,625(0.25%)#57 | 61,755,866(0.00%)#4,118 |
| 58. | Mason | 1,158 | 494,625(0.23%)#58 | 61,755,866(0.00%)#4,246 |
| 59. | Grove City | 1,151 | 494,625(0.23%)#59 | 61,755,866(0.00%)#4,250 |
| 60. | Upper Arlington | 1,143 | 494,625(0.23%)#60 | 61,755,866(0.00%)#4,271 |
| 61. | Sharonville | 1,136 | 494,625(0.23%)#61 | 61,755,866(0.00%)#4,278 |
| 62. | Willard | 1,127 | 494,625(0.23%)#62 | 61,755,866(0.00%)#4,300 |
| 63. | Mayfield Heights | 1,114 | 494,625(0.23%)#63 | 61,755,866(0.00%)#4,326 |
| 64. | Westlake | 1,091 | 494,625(0.22%)#64 | 61,755,866(0.00%)#4,379 |
| 65. | Parma Heights | 1,077 | 494,625(0.22%)#65 | 61,755,866(0.00%)#4,421 |
| 66. | Centerville | 1,062 | 494,625(0.21%)#66 | 61,755,866(0.00%)#4,459 |
| 67. | Perrysburg | 1,045 | 494,625(0.21%)#67 | 61,755,866(0.00%)#4,504 |
| 68. | Norwood | 1,037 | 494,625(0.21%)#68 | 61,755,866(0.00%)#4,522 |
| 69. | Solon | 1,020 | 494,625(0.21%)#69 | 61,755,866(0.00%)#4,564 |
| 70. | Wauseon | 1,012 | 494,625(0.20%)#70 | 61,755,866(0.00%)#4,581 |
| 71. | Medina | 1,009 | 494,625(0.20%)#71 | 61,755,866(0.00%)#4,588 |
| 72. | Shaker Heights | 1,002 | 494,625(0.20%)#72 | 61,755,866(0.00%)#4,610 |
| 73. | Marysville | 993 | 494,625(0.20%)#73 | 61,755,866(0.00%)#4,633 |
| 74. | Middleburg Heights | 992 | 494,625(0.20%)#74 | 61,755,866(0.00%)#4,636 |
| 75. | Lancaster | 973 | 494,625(0.20%)#75 | 61,755,866(0.00%)#4,702 |
| 76. | Avon | 967 | 494,625(0.20%)#76 | 61,755,866(0.00%)#4,717 |
| 77. | Kenwood | 950 | 494,625(0.19%)#77 | 61,755,866(0.00%)#4,764 |
| 78. | Leipsic | 904 | 494,625(0.18%)#78 | 61,755,866(0.00%)#4,910 |
| 79. | Gahanna | 899 | 494,625(0.18%)#79 | 61,755,866(0.00%)#4,922 |
| 80. | Monroe | 883 | 494,625(0.18%)#80 | 61,755,866(0.00%)#4,965 |
| 81. | Amherst | 879 | 494,625(0.18%)#81 | 61,755,866(0.00%)#4,978 |
| 82. | Maumee | 878 | 494,625(0.18%)#82 | 61,755,866(0.00%)#4,979 |
| 83. | Riverside | 864 | 494,625(0.17%)#83 | 61,755,866(0.00%)#5,025 |
| 84. | Fairview Park | 859 | 494,625(0.17%)#84 | 61,755,866(0.00%)#5,037 |
| 85. | Westerville | 857 | 494,625(0.17%)#85 | 61,755,866(0.00%)#5,045 |
| 86. | Steubenville | 797 | 494,625(0.16%)#86 | 61,755,866(0.00%)#5,245 |
| 87. | Dover | 790 | 494,625(0.16%)#87 | 61,755,866(0.00%)#5,271 |
| 88. | Euclid | 776 | 494,625(0.16%)#88 | 61,755,866(0.00%)#5,322 |
| 89. | Struthers | 774 | 494,625(0.16%)#89 | 61,755,866(0.00%)#5,334 |
| 90. | Kent | 768 | 494,625(0.16%)#90 | 61,755,866(0.00%)#5,357 |
| 91. | Troy | 759 | 494,625(0.15%)#91 | 61,755,866(0.00%)#5,387 |
| 92. | Wooster | 747 | 494,625(0.15%)#92 | 61,755,866(0.00%)#5,424 |
| 93. | New Albany | 736 | 494,625(0.15%)#93 | 61,755,866(0.00%)#5,478 |
| 94. | New Carlisle | 729 | 494,625(0.15%)#94 | 61,755,866(0.00%)#5,503 |
| 95. | Napoleon | 720 | 494,625(0.15%)#95 | 61,755,866(0.00%)#5,541 |
| 96. | Archbold | 720 | 494,625(0.15%)#96 | 61,755,866(0.00%)#5,542 |
| 97. | Zanesville | 714 | 494,625(0.14%)#97 | 61,755,866(0.00%)#5,567 |
| 98. | Loveland | 710 | 494,625(0.14%)#98 | 61,755,866(0.00%)#5,584 |
| 99. | Athens | 708 | 494,625(0.14%)#99 | 61,755,866(0.00%)#5,590 |
| 100. | Grafton | 697 | 494,625(0.14%)#100 | 61,755,866(0.00%)#5,638 |
Common Questions
What are the Top 10 Cities with the Largest Hispanic or Latino Community in Ohio?
Top 10 Cities with the Largest Hispanic or Latino Community in Ohio are:
#1
60,228
#2
46,349
#3
24,076
#4
18,364
#5
14,114
#6
7,172
#7
6,729
#8
6,479
#9
5,898
#10
5,887
What city has the Largest Hispanic or Latino Community in Ohio?
Columbus has the Largest Hispanic or Latino Community in Ohio with 60,228.
What is the Total Hispanic or Latino Population in the State of Ohio?
Total Hispanic or Latino Population in Ohio is 494,625.
What is the Total Hispanic or Latino Population in the United States?
Total Hispanic or Latino Population in the United States is 61,755,866.