Cities with the Largest Central American Community in Ohio
RELATED REPORTS & OPTIONS
Central American
Ohio
Compare Cities
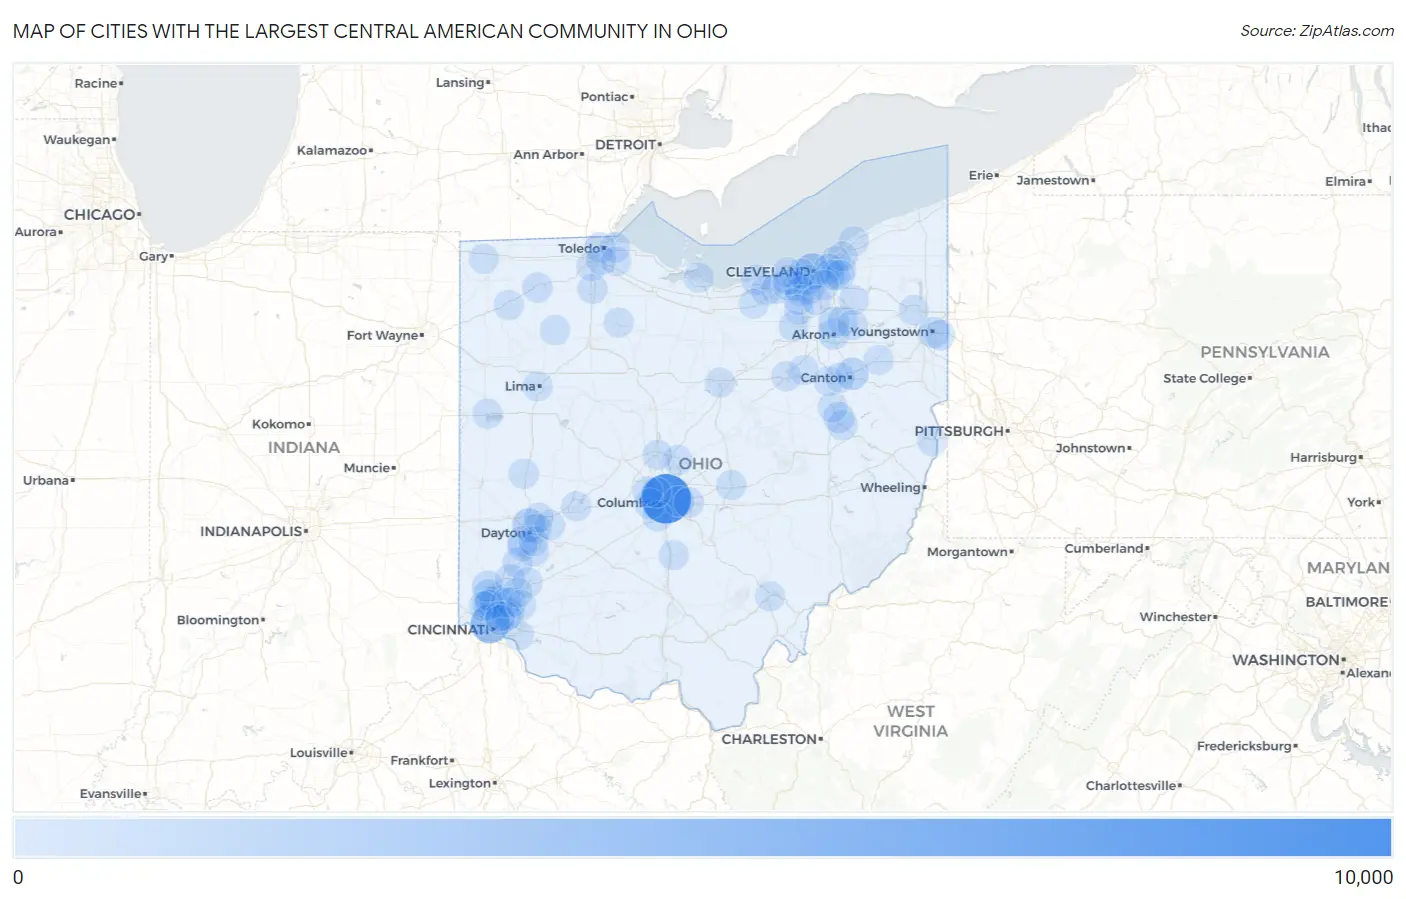
Map of Cities with the Largest Central American Community in Ohio
0
10,000
Cities with the Largest Central American Community in Ohio
| City | Central American | vs State | vs National | |
| 1. | Columbus | 9,557 | 45,623(20.95%)#1 | 6,002,595(0.16%)#72 |
| 2. | Cincinnati | 4,263 | 45,623(9.34%)#2 | 6,002,595(0.07%)#213 |
| 3. | Cleveland | 2,794 | 45,623(6.12%)#3 | 6,002,595(0.05%)#340 |
| 4. | Dayton | 1,525 | 45,623(3.34%)#4 | 6,002,595(0.03%)#597 |
| 5. | Canton | 1,125 | 45,623(2.47%)#5 | 6,002,595(0.02%)#763 |
| 6. | Springdale | 853 | 45,623(1.87%)#6 | 6,002,595(0.01%)#933 |
| 7. | Forest Park | 713 | 45,623(1.56%)#7 | 6,002,595(0.01%)#1,097 |
| 8. | Fairfield | 623 | 45,623(1.37%)#8 | 6,002,595(0.01%)#1,193 |
| 9. | Akron | 612 | 45,623(1.34%)#9 | 6,002,595(0.01%)#1,212 |
| 10. | Hamilton | 584 | 45,623(1.28%)#10 | 6,002,595(0.01%)#1,249 |
| 11. | Dover | 563 | 45,623(1.23%)#11 | 6,002,595(0.01%)#1,290 |
| 12. | Youngstown | 517 | 45,623(1.13%)#12 | 6,002,595(0.01%)#1,365 |
| 13. | Cuyahoga Falls | 495 | 45,623(1.08%)#13 | 6,002,595(0.01%)#1,407 |
| 14. | Kenwood | 486 | 45,623(1.07%)#14 | 6,002,595(0.01%)#1,433 |
| 15. | Moraine | 403 | 45,623(0.88%)#15 | 6,002,595(0.01%)#1,606 |
| 16. | New Burlington | 357 | 45,623(0.78%)#16 | 6,002,595(0.01%)#1,715 |
| 17. | Parma | 317 | 45,623(0.69%)#17 | 6,002,595(0.01%)#1,852 |
| 18. | Lincoln Village | 307 | 45,623(0.67%)#18 | 6,002,595(0.01%)#1,890 |
| 19. | Whitehall | 293 | 45,623(0.64%)#19 | 6,002,595(0.00%)#1,933 |
| 20. | Lorain | 292 | 45,623(0.64%)#20 | 6,002,595(0.00%)#1,938 |
| 21. | New Philadelphia | 286 | 45,623(0.63%)#21 | 6,002,595(0.00%)#1,971 |
| 22. | Toledo | 253 | 45,623(0.55%)#22 | 6,002,595(0.00%)#2,121 |
| 23. | Reynoldsburg | 223 | 45,623(0.49%)#23 | 6,002,595(0.00%)#2,296 |
| 24. | Brooklyn | 215 | 45,623(0.47%)#24 | 6,002,595(0.00%)#2,346 |
| 25. | Elyria | 212 | 45,623(0.46%)#25 | 6,002,595(0.00%)#2,366 |
| 26. | Centerville | 205 | 45,623(0.45%)#26 | 6,002,595(0.00%)#2,410 |
| 27. | North Ridgeville | 201 | 45,623(0.44%)#27 | 6,002,595(0.00%)#2,439 |
| 28. | Napoleon | 197 | 45,623(0.43%)#28 | 6,002,595(0.00%)#2,472 |
| 29. | Campbell | 194 | 45,623(0.43%)#29 | 6,002,595(0.00%)#2,489 |
| 30. | Franklin | 190 | 45,623(0.42%)#30 | 6,002,595(0.00%)#2,511 |
| 31. | Monroe | 157 | 45,623(0.34%)#31 | 6,002,595(0.00%)#2,802 |
| 32. | Grove City | 150 | 45,623(0.33%)#32 | 6,002,595(0.00%)#2,866 |
| 33. | Newark | 145 | 45,623(0.32%)#33 | 6,002,595(0.00%)#2,902 |
| 34. | Riverside | 141 | 45,623(0.31%)#34 | 6,002,595(0.00%)#2,944 |
| 35. | Bowling Green | 140 | 45,623(0.31%)#35 | 6,002,595(0.00%)#2,951 |
| 36. | Oregon | 139 | 45,623(0.30%)#36 | 6,002,595(0.00%)#2,972 |
| 37. | Sharonville | 136 | 45,623(0.30%)#37 | 6,002,595(0.00%)#3,010 |
| 38. | Northgate | 132 | 45,623(0.29%)#38 | 6,002,595(0.00%)#3,063 |
| 39. | Medina | 130 | 45,623(0.28%)#39 | 6,002,595(0.00%)#3,083 |
| 40. | North Olmsted | 128 | 45,623(0.28%)#40 | 6,002,595(0.00%)#3,113 |
| 41. | Strasburg | 128 | 45,623(0.28%)#41 | 6,002,595(0.00%)#3,123 |
| 42. | Steubenville | 122 | 45,623(0.27%)#42 | 6,002,595(0.00%)#3,176 |
| 43. | Brecon | 122 | 45,623(0.27%)#43 | 6,002,595(0.00%)#3,185 |
| 44. | Celina | 119 | 45,623(0.26%)#44 | 6,002,595(0.00%)#3,212 |
| 45. | Brook Park | 118 | 45,623(0.26%)#45 | 6,002,595(0.00%)#3,225 |
| 46. | Richmond Heights | 118 | 45,623(0.26%)#46 | 6,002,595(0.00%)#3,227 |
| 47. | Middleburg Heights | 116 | 45,623(0.25%)#47 | 6,002,595(0.00%)#3,252 |
| 48. | Brunswick | 114 | 45,623(0.25%)#48 | 6,002,595(0.00%)#3,278 |
| 49. | Leipsic | 113 | 45,623(0.25%)#49 | 6,002,595(0.00%)#3,300 |
| 50. | Strongsville | 112 | 45,623(0.25%)#50 | 6,002,595(0.00%)#3,303 |
| 51. | Upper Arlington | 111 | 45,623(0.24%)#51 | 6,002,595(0.00%)#3,322 |
| 52. | Sunbury | 111 | 45,623(0.24%)#52 | 6,002,595(0.00%)#3,328 |
| 53. | West Carrollton | 109 | 45,623(0.24%)#53 | 6,002,595(0.00%)#3,353 |
| 54. | Orrville | 108 | 45,623(0.24%)#54 | 6,002,595(0.00%)#3,371 |
| 55. | Defiance | 107 | 45,623(0.23%)#55 | 6,002,595(0.00%)#3,385 |
| 56. | Massillon | 103 | 45,623(0.23%)#56 | 6,002,595(0.00%)#3,450 |
| 57. | Stow | 101 | 45,623(0.22%)#57 | 6,002,595(0.00%)#3,472 |
| 58. | Mayfield Heights | 101 | 45,623(0.22%)#58 | 6,002,595(0.00%)#3,474 |
| 59. | Sandusky | 100 | 45,623(0.22%)#59 | 6,002,595(0.00%)#3,489 |
| 60. | Lima | 99 | 45,623(0.22%)#60 | 6,002,595(0.00%)#3,498 |
| 61. | Piqua | 97 | 45,623(0.21%)#61 | 6,002,595(0.00%)#3,531 |
| 62. | Cleveland Heights | 96 | 45,623(0.21%)#62 | 6,002,595(0.00%)#3,550 |
| 63. | Wooster | 94 | 45,623(0.21%)#63 | 6,002,595(0.00%)#3,582 |
| 64. | Withamsville | 94 | 45,623(0.21%)#64 | 6,002,595(0.00%)#3,588 |
| 65. | Kettering | 93 | 45,623(0.20%)#65 | 6,002,595(0.00%)#3,593 |
| 66. | Athens | 88 | 45,623(0.19%)#66 | 6,002,595(0.00%)#3,677 |
| 67. | Westlake | 87 | 45,623(0.19%)#67 | 6,002,595(0.00%)#3,698 |
| 68. | Lakewood | 86 | 45,623(0.19%)#68 | 6,002,595(0.00%)#3,715 |
| 69. | Hilliard | 86 | 45,623(0.19%)#69 | 6,002,595(0.00%)#3,717 |
| 70. | Delaware | 81 | 45,623(0.18%)#70 | 6,002,595(0.00%)#3,805 |
| 71. | Circleville | 81 | 45,623(0.18%)#71 | 6,002,595(0.00%)#3,810 |
| 72. | Shaker Heights | 80 | 45,623(0.18%)#72 | 6,002,595(0.00%)#3,829 |
| 73. | Mentor | 79 | 45,623(0.17%)#73 | 6,002,595(0.00%)#3,854 |
| 74. | Silverton | 78 | 45,623(0.17%)#74 | 6,002,595(0.00%)#3,888 |
| 75. | Warren | 76 | 45,623(0.17%)#75 | 6,002,595(0.00%)#3,920 |
| 76. | Fairborn | 76 | 45,623(0.17%)#76 | 6,002,595(0.00%)#3,921 |
| 77. | Perrysburg | 74 | 45,623(0.16%)#77 | 6,002,595(0.00%)#3,973 |
| 78. | Alliance | 74 | 45,623(0.16%)#78 | 6,002,595(0.00%)#3,975 |
| 79. | Montpelier | 71 | 45,623(0.16%)#79 | 6,002,595(0.00%)#4,055 |
| 80. | Aurora | 68 | 45,623(0.15%)#80 | 6,002,595(0.00%)#4,111 |
| 81. | Beachwood | 68 | 45,623(0.15%)#81 | 6,002,595(0.00%)#4,114 |
| 82. | Lebanon | 66 | 45,623(0.14%)#82 | 6,002,595(0.00%)#4,160 |
| 83. | Willoughby Hills | 66 | 45,623(0.14%)#83 | 6,002,595(0.00%)#4,169 |
| 84. | Springfield | 65 | 45,623(0.14%)#84 | 6,002,595(0.00%)#4,186 |
| 85. | Kent | 64 | 45,623(0.14%)#85 | 6,002,595(0.00%)#4,222 |
| 86. | Perry Heights | 62 | 45,623(0.14%)#86 | 6,002,595(0.00%)#4,300 |
| 87. | Pepper Pike | 62 | 45,623(0.14%)#87 | 6,002,595(0.00%)#4,303 |
| 88. | Bay Village | 61 | 45,623(0.13%)#88 | 6,002,595(0.00%)#4,330 |
| 89. | Rossford | 61 | 45,623(0.13%)#89 | 6,002,595(0.00%)#4,343 |
| 90. | Golf Manor | 59 | 45,623(0.13%)#90 | 6,002,595(0.00%)#4,407 |
| 91. | Garfield Heights | 58 | 45,623(0.13%)#91 | 6,002,595(0.00%)#4,418 |
| 92. | Oberlin | 58 | 45,623(0.13%)#92 | 6,002,595(0.00%)#4,436 |
| 93. | Fostoria | 57 | 45,623(0.12%)#93 | 6,002,595(0.00%)#4,467 |
| 94. | Millbury | 56 | 45,623(0.12%)#94 | 6,002,595(0.00%)#4,516 |
| 95. | Mason | 55 | 45,623(0.12%)#95 | 6,002,595(0.00%)#4,518 |
| 96. | Norwood | 54 | 45,623(0.12%)#96 | 6,002,595(0.00%)#4,553 |
| 97. | Broadview Heights | 53 | 45,623(0.12%)#97 | 6,002,595(0.00%)#4,597 |
| 98. | Mansfield | 52 | 45,623(0.11%)#98 | 6,002,595(0.00%)#4,622 |
| 99. | Loveland | 51 | 45,623(0.11%)#99 | 6,002,595(0.00%)#4,665 |
| 100. | Huber Heights | 50 | 45,623(0.11%)#100 | 6,002,595(0.00%)#4,689 |
Common Questions
What are the Top 10 Cities with the Largest Central American Community in Ohio?
Top 10 Cities with the Largest Central American Community in Ohio are:
#1
9,557
#2
4,263
#3
2,794
#4
1,525
#5
1,125
#6
853
#7
713
#8
623
#9
612
#10
584
What city has the Largest Central American Community in Ohio?
Columbus has the Largest Central American Community in Ohio with 9,557.
What is the Total Central American Population in the State of Ohio?
Total Central American Population in Ohio is 45,623.
What is the Total Central American Population in the United States?
Total Central American Population in the United States is 6,002,595.