Zip Codes with the Highest Percentage of Population Employed in Architecture & Engineering in Cincinnati, OH
RELATED REPORTS & OPTIONS
Architecture & Engineering
Cincinnati
Compare Zip Codes
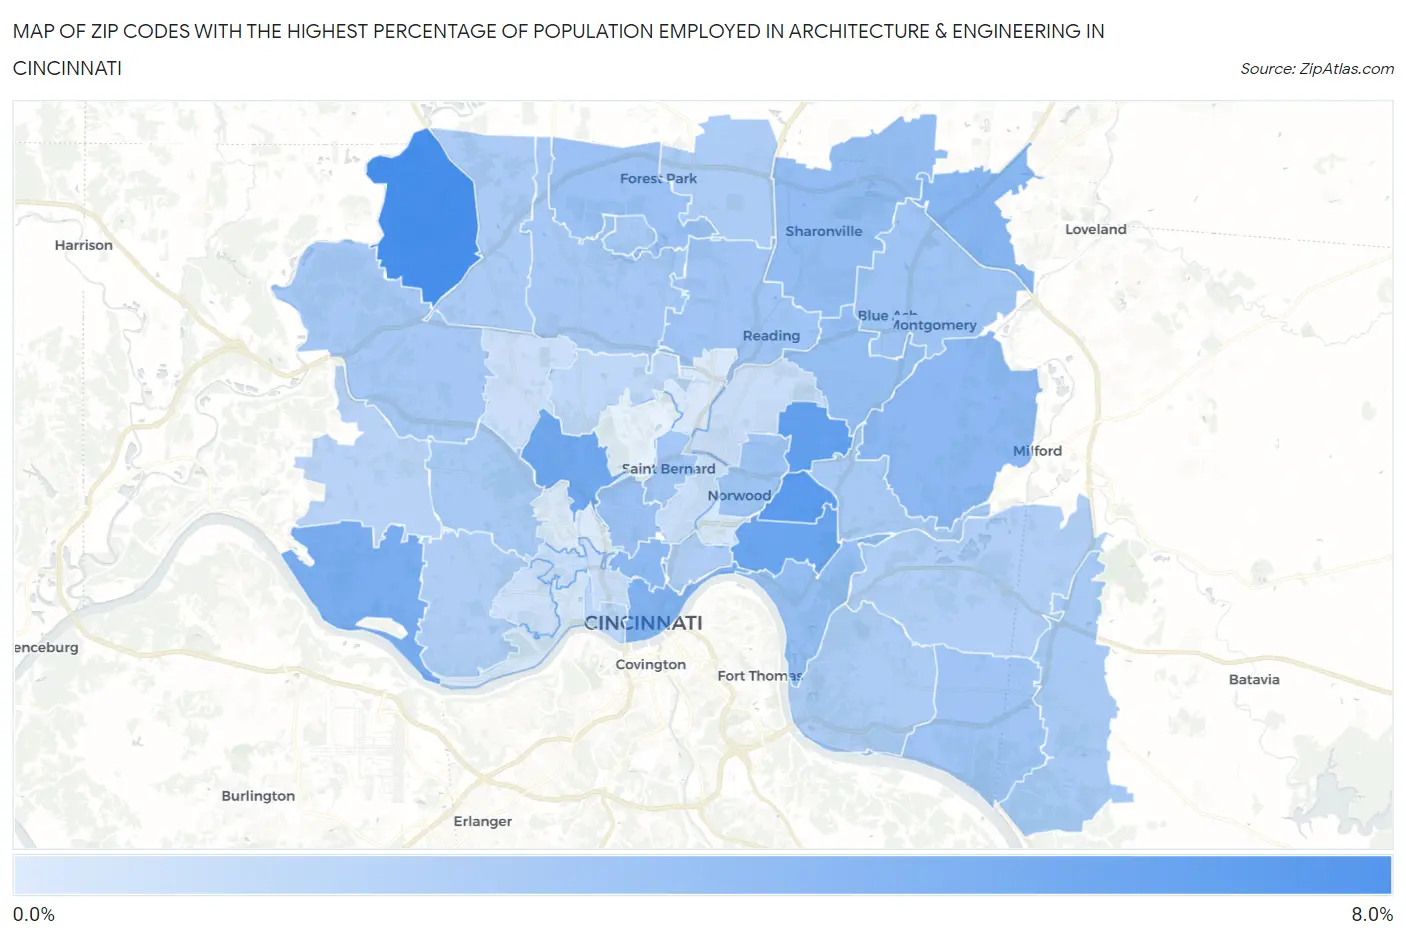
Map of Zip Codes with the Highest Percentage of Population Employed in Architecture & Engineering in Cincinnati
0.22%
7.0%
Zip Codes with the Highest Percentage of Population Employed in Architecture & Engineering in Cincinnati, OH
| Zip Code | % Employed | vs State | vs National | |
| 1. | 45252 | 7.0% | 2.1%(+4.82)#24 | 2.1%(+4.81)#760 |
| 2. | 45209 | 6.0% | 2.1%(+3.90)#32 | 2.1%(+3.88)#1,065 |
| 3. | 45213 | 5.7% | 2.1%(+3.59)#43 | 2.1%(+3.58)#1,207 |
| 4. | 45208 | 5.2% | 2.1%(+3.11)#54 | 2.1%(+3.10)#1,491 |
| 5. | 45223 | 4.9% | 2.1%(+2.77)#68 | 2.1%(+2.76)#1,727 |
| 6. | 45233 | 4.6% | 2.1%(+2.45)#85 | 2.1%(+2.44)#2,028 |
| 7. | 45202 | 4.4% | 2.1%(+2.23)#97 | 2.1%(+2.21)#2,306 |
| 8. | 45249 | 4.0% | 2.1%(+1.84)#119 | 2.1%(+1.82)#2,814 |
| 9. | 45243 | 3.8% | 2.1%(+1.68)#128 | 2.1%(+1.66)#3,068 |
| 10. | 45219 | 3.7% | 2.1%(+1.57)#138 | 2.1%(+1.55)#3,288 |
| 11. | 45241 | 3.5% | 2.1%(+1.37)#158 | 2.1%(+1.36)#3,722 |
| 12. | 45226 | 3.4% | 2.1%(+1.30)#164 | 2.1%(+1.28)#3,900 |
| 13. | 45236 | 3.4% | 2.1%(+1.30)#165 | 2.1%(+1.28)#3,901 |
| 14. | 45220 | 3.2% | 2.1%(+1.08)#188 | 2.1%(+1.07)#4,425 |
| 15. | 45240 | 3.0% | 2.1%(+0.908)#207 | 2.1%(+0.893)#4,919 |
| 16. | 45212 | 3.0% | 2.1%(+0.869)#213 | 2.1%(+0.854)#5,052 |
| 17. | 45242 | 2.9% | 2.1%(+0.786)#229 | 2.1%(+0.771)#5,356 |
| 18. | 45215 | 2.9% | 2.1%(+0.766)#234 | 2.1%(+0.751)#5,421 |
| 19. | 45255 | 2.9% | 2.1%(+0.749)#241 | 2.1%(+0.733)#5,487 |
| 20. | 45217 | 2.8% | 2.1%(+0.649)#257 | 2.1%(+0.634)#5,848 |
| 21. | 45231 | 2.7% | 2.1%(+0.533)#273 | 2.1%(+0.517)#6,306 |
| 22. | 45247 | 2.6% | 2.1%(+0.489)#281 | 2.1%(+0.474)#6,478 |
| 23. | 45211 | 2.6% | 2.1%(+0.463)#285 | 2.1%(+0.447)#6,588 |
| 24. | 45227 | 2.5% | 2.1%(+0.414)#303 | 2.1%(+0.398)#6,799 |
| 25. | 45218 | 2.5% | 2.1%(+0.398)#305 | 2.1%(+0.382)#6,866 |
| 26. | 45245 | 2.5% | 2.1%(+0.373)#311 | 2.1%(+0.357)#6,961 |
| 27. | 45251 | 2.5% | 2.1%(+0.357)#315 | 2.1%(+0.341)#7,038 |
| 28. | 45230 | 2.4% | 2.1%(+0.225)#342 | 2.1%(+0.210)#7,673 |
| 29. | 45246 | 2.4% | 2.1%(+0.224)#343 | 2.1%(+0.209)#7,678 |
| 30. | 45238 | 2.3% | 2.1%(+0.158)#355 | 2.1%(+0.143)#7,995 |
| 31. | 45206 | 2.2% | 2.1%(+0.079)#372 | 2.1%(+0.064)#8,418 |
| 32. | 45244 | 2.1% | 2.1%(-0.010)#397 | 2.1%(-0.025)#8,899 |
| 33. | 45248 | 1.9% | 2.1%(-0.277)#459 | 2.1%(-0.292)#10,503 |
| 34. | 45203 | 1.7% | 2.1%(-0.403)#497 | 2.1%(-0.419)#11,288 |
| 35. | 45224 | 1.5% | 2.1%(-0.646)#551 | 2.1%(-0.661)#12,976 |
| 36. | 45214 | 1.2% | 2.1%(-0.964)#661 | 2.1%(-0.980)#15,329 |
| 37. | 45237 | 1.1% | 2.1%(-1.02)#675 | 2.1%(-1.04)#15,768 |
| 38. | 45229 | 1.1% | 2.1%(-1.02)#676 | 2.1%(-1.04)#15,778 |
| 39. | 45239 | 1.1% | 2.1%(-1.08)#689 | 2.1%(-1.10)#16,226 |
| 40. | 45205 | 0.91% | 2.1%(-1.23)#723 | 2.1%(-1.24)#17,305 |
| 41. | 45204 | 0.60% | 2.1%(-1.54)#817 | 2.1%(-1.55)#19,648 |
| 42. | 45207 | 0.57% | 2.1%(-1.56)#822 | 2.1%(-1.58)#19,820 |
| 43. | 45216 | 0.36% | 2.1%(-1.77)#880 | 2.1%(-1.79)#21,205 |
| 44. | 45225 | 0.22% | 2.1%(-1.91)#899 | 2.1%(-1.93)#21,933 |
1
Common Questions
What are the Top 10 Zip Codes with the Highest Percentage of Population Employed in Architecture & Engineering in Cincinnati, OH?
Top 10 Zip Codes with the Highest Percentage of Population Employed in Architecture & Engineering in Cincinnati, OH are:
What zip code has the Highest Percentage of Population Employed in Architecture & Engineering in Cincinnati, OH?
45252 has the Highest Percentage of Population Employed in Architecture & Engineering in Cincinnati, OH with 7.0%.
What is the Percentage of Population Employed in Architecture & Engineering in Cincinnati, OH?
Percentage of Population Employed in Architecture & Engineering in Cincinnati is 2.8%.
What is the Percentage of Population Employed in Architecture & Engineering in Ohio?
Percentage of Population Employed in Architecture & Engineering in Ohio is 2.1%.
What is the Percentage of Population Employed in Architecture & Engineering in the United States?
Percentage of Population Employed in Architecture & Engineering in the United States is 2.1%.