Cities with the Most Immigrants from Philippines in Ohio
RELATED REPORTS & OPTIONS
Philippines
Ohio
Compare Cities
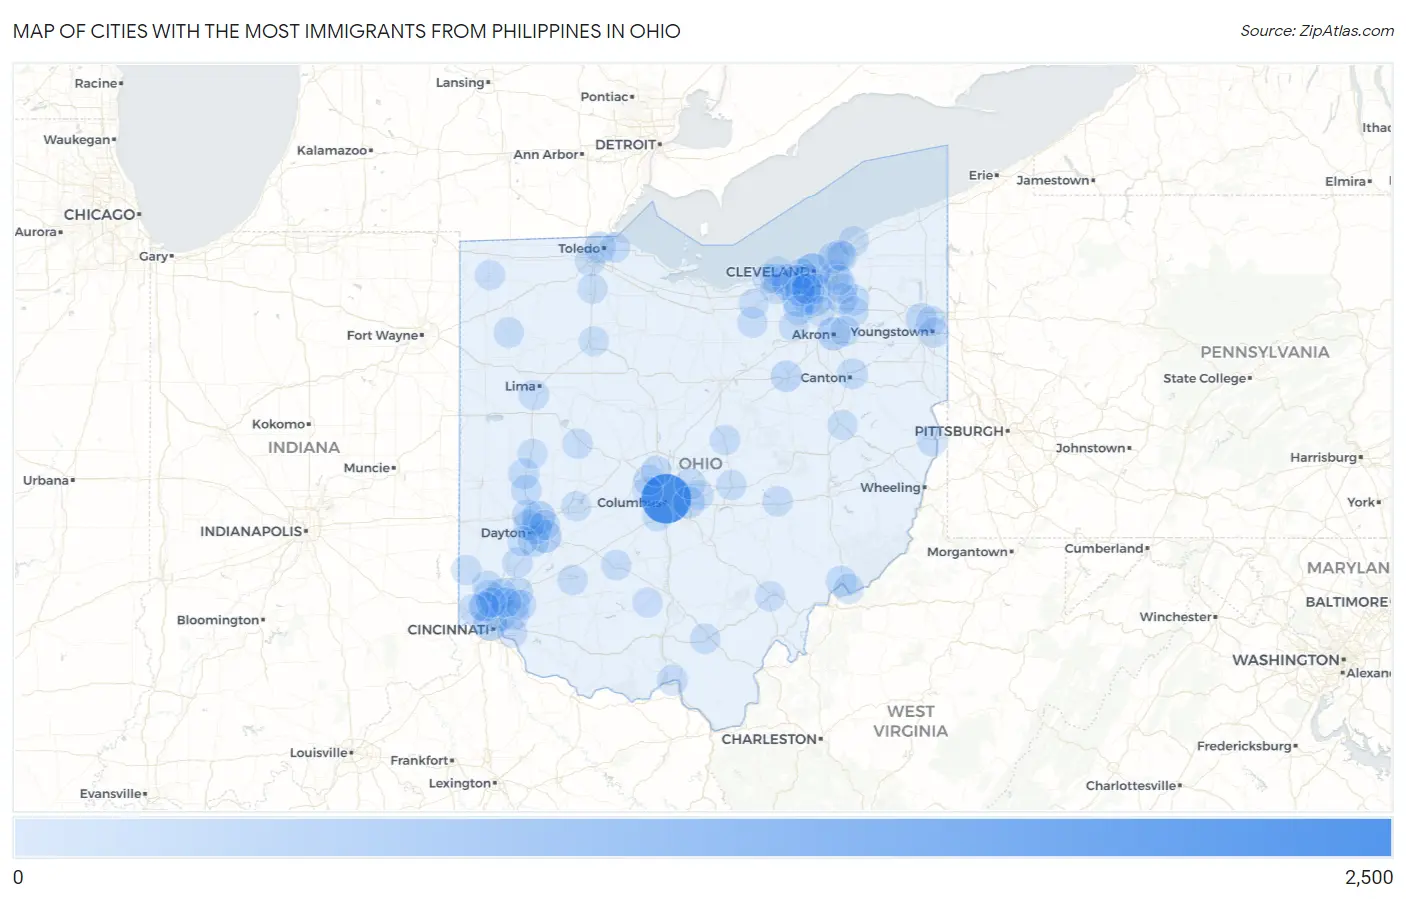
Map of Cities with the Most Immigrants from Philippines in Ohio
0
2,500
Cities with the Most Immigrants from Philippines in Ohio
| City | Philippines | vs State | vs National | |
| 1. | Columbus | 2,064 | 17,818(11.58%)#1 | 1,985,710(0.10%)#133 |
| 2. | Cleveland | 618 | 17,818(3.47%)#2 | 1,985,710(0.03%)#460 |
| 3. | Strongsville | 387 | 17,818(2.17%)#3 | 1,985,710(0.02%)#682 |
| 4. | Cincinnati | 380 | 17,818(2.13%)#4 | 1,985,710(0.02%)#691 |
| 5. | Huber Heights | 347 | 17,818(1.95%)#5 | 1,985,710(0.02%)#737 |
| 6. | Akron | 344 | 17,818(1.93%)#6 | 1,985,710(0.02%)#743 |
| 7. | Beavercreek | 332 | 17,818(1.86%)#7 | 1,985,710(0.02%)#761 |
| 8. | Westlake | 216 | 17,818(1.21%)#8 | 1,985,710(0.01%)#1,089 |
| 9. | Parma | 213 | 17,818(1.20%)#9 | 1,985,710(0.01%)#1,098 |
| 10. | Brooklyn | 196 | 17,818(1.10%)#10 | 1,985,710(0.01%)#1,185 |
| 11. | Toledo | 188 | 17,818(1.06%)#11 | 1,985,710(0.01%)#1,223 |
| 12. | Reynoldsburg | 187 | 17,818(1.05%)#12 | 1,985,710(0.01%)#1,231 |
| 13. | Euclid | 182 | 17,818(1.02%)#13 | 1,985,710(0.01%)#1,261 |
| 14. | Niles | 165 | 17,818(0.93%)#14 | 1,985,710(0.01%)#1,351 |
| 15. | Wooster | 155 | 17,818(0.87%)#15 | 1,985,710(0.01%)#1,415 |
| 16. | Springdale | 154 | 17,818(0.86%)#16 | 1,985,710(0.01%)#1,425 |
| 17. | Kettering | 152 | 17,818(0.85%)#17 | 1,985,710(0.01%)#1,430 |
| 18. | Hamilton | 145 | 17,818(0.81%)#18 | 1,985,710(0.01%)#1,475 |
| 19. | Mason | 140 | 17,818(0.79%)#19 | 1,985,710(0.01%)#1,517 |
| 20. | Riverside | 136 | 17,818(0.76%)#20 | 1,985,710(0.01%)#1,548 |
| 21. | Broadview Heights | 134 | 17,818(0.75%)#21 | 1,985,710(0.01%)#1,571 |
| 22. | Marietta | 119 | 17,818(0.67%)#22 | 1,985,710(0.01%)#1,719 |
| 23. | Aurora | 118 | 17,818(0.66%)#23 | 1,985,710(0.01%)#1,724 |
| 24. | Canton | 115 | 17,818(0.65%)#24 | 1,985,710(0.01%)#1,739 |
| 25. | Twinsburg | 115 | 17,818(0.65%)#25 | 1,985,710(0.01%)#1,742 |
| 26. | Dayton | 111 | 17,818(0.62%)#26 | 1,985,710(0.01%)#1,778 |
| 27. | Piqua | 111 | 17,818(0.62%)#27 | 1,985,710(0.01%)#1,783 |
| 28. | New Albany | 108 | 17,818(0.61%)#28 | 1,985,710(0.01%)#1,819 |
| 29. | Portsmouth | 104 | 17,818(0.58%)#29 | 1,985,710(0.01%)#1,862 |
| 30. | Dublin | 102 | 17,818(0.57%)#30 | 1,985,710(0.01%)#1,885 |
| 31. | North Royalton | 101 | 17,818(0.57%)#31 | 1,985,710(0.01%)#1,898 |
| 32. | Lakewood | 100 | 17,818(0.56%)#32 | 1,985,710(0.01%)#1,911 |
| 33. | Vandalia | 96 | 17,818(0.54%)#33 | 1,985,710(0.00%)#1,976 |
| 34. | Powell | 95 | 17,818(0.53%)#34 | 1,985,710(0.00%)#1,988 |
| 35. | Troy | 93 | 17,818(0.52%)#35 | 1,985,710(0.00%)#2,018 |
| 36. | Beckett Ridge | 91 | 17,818(0.51%)#36 | 1,985,710(0.00%)#2,056 |
| 37. | Golf Manor | 83 | 17,818(0.47%)#37 | 1,985,710(0.00%)#2,170 |
| 38. | Maria Stein | 80 | 17,818(0.45%)#38 | 1,985,710(0.00%)#2,225 |
| 39. | Fairfield | 78 | 17,818(0.44%)#39 | 1,985,710(0.00%)#2,244 |
| 40. | Oakwood | 76 | 17,818(0.43%)#40 | 1,985,710(0.00%)#2,291 |
| 41. | Jackson | 76 | 17,818(0.43%)#41 | 1,985,710(0.00%)#2,295 |
| 42. | Mount Vernon | 75 | 17,818(0.42%)#42 | 1,985,710(0.00%)#2,310 |
| 43. | Sixteen Mile Stand | 73 | 17,818(0.41%)#43 | 1,985,710(0.00%)#2,347 |
| 44. | North Olmsted | 72 | 17,818(0.40%)#44 | 1,985,710(0.00%)#2,357 |
| 45. | Mentor | 70 | 17,818(0.39%)#45 | 1,985,710(0.00%)#2,405 |
| 46. | Fort Shawnee | 69 | 17,818(0.39%)#46 | 1,985,710(0.00%)#2,431 |
| 47. | Beachwood | 68 | 17,818(0.38%)#47 | 1,985,710(0.00%)#2,441 |
| 48. | The Village Of Indian Hill | 64 | 17,818(0.36%)#48 | 1,985,710(0.00%)#2,530 |
| 49. | Zanesville | 63 | 17,818(0.35%)#49 | 1,985,710(0.00%)#2,546 |
| 50. | Reno | 63 | 17,818(0.35%)#50 | 1,985,710(0.00%)#2,560 |
| 51. | Steubenville | 62 | 17,818(0.35%)#51 | 1,985,710(0.00%)#2,568 |
| 52. | Brunswick | 61 | 17,818(0.34%)#52 | 1,985,710(0.00%)#2,588 |
| 53. | Loveland | 61 | 17,818(0.34%)#53 | 1,985,710(0.00%)#2,597 |
| 54. | Solon | 60 | 17,818(0.34%)#54 | 1,985,710(0.00%)#2,610 |
| 55. | Wilmington | 60 | 17,818(0.34%)#55 | 1,985,710(0.00%)#2,613 |
| 56. | Avon | 59 | 17,818(0.33%)#56 | 1,985,710(0.00%)#2,634 |
| 57. | Wellington | 59 | 17,818(0.33%)#57 | 1,985,710(0.00%)#2,650 |
| 58. | Northbrook | 58 | 17,818(0.33%)#58 | 1,985,710(0.00%)#2,663 |
| 59. | Franklin | 57 | 17,818(0.32%)#59 | 1,985,710(0.00%)#2,689 |
| 60. | Tallmadge | 56 | 17,818(0.31%)#60 | 1,985,710(0.00%)#2,706 |
| 61. | Seven Hills | 56 | 17,818(0.31%)#61 | 1,985,710(0.00%)#2,713 |
| 62. | Sharonville | 55 | 17,818(0.31%)#62 | 1,985,710(0.00%)#2,730 |
| 63. | Bellefontaine | 55 | 17,818(0.31%)#63 | 1,985,710(0.00%)#2,731 |
| 64. | Grove City | 54 | 17,818(0.30%)#64 | 1,985,710(0.00%)#2,750 |
| 65. | Oregon | 54 | 17,818(0.30%)#65 | 1,985,710(0.00%)#2,755 |
| 66. | Youngstown | 53 | 17,818(0.30%)#66 | 1,985,710(0.00%)#2,781 |
| 67. | Newark | 53 | 17,818(0.30%)#67 | 1,985,710(0.00%)#2,783 |
| 68. | North Ridgeville | 53 | 17,818(0.30%)#68 | 1,985,710(0.00%)#2,785 |
| 69. | Washington Court House | 52 | 17,818(0.29%)#69 | 1,985,710(0.00%)#2,832 |
| 70. | Churchill | 51 | 17,818(0.29%)#70 | 1,985,710(0.00%)#2,866 |
| 71. | Wickliffe | 50 | 17,818(0.28%)#71 | 1,985,710(0.00%)#2,885 |
| 72. | Avon Lake | 48 | 17,818(0.27%)#72 | 1,985,710(0.00%)#2,942 |
| 73. | Pataskala | 47 | 17,818(0.26%)#73 | 1,985,710(0.00%)#2,974 |
| 74. | Forestville | 47 | 17,818(0.26%)#74 | 1,985,710(0.00%)#2,981 |
| 75. | Northgate | 47 | 17,818(0.26%)#75 | 1,985,710(0.00%)#2,989 |
| 76. | Forest Park | 46 | 17,818(0.26%)#76 | 1,985,710(0.00%)#3,000 |
| 77. | Fairview Park | 46 | 17,818(0.26%)#77 | 1,985,710(0.00%)#3,003 |
| 78. | Athens | 45 | 17,818(0.25%)#78 | 1,985,710(0.00%)#3,030 |
| 79. | New Philadelphia | 45 | 17,818(0.25%)#79 | 1,985,710(0.00%)#3,033 |
| 80. | Oxford | 44 | 17,818(0.25%)#80 | 1,985,710(0.00%)#3,066 |
| 81. | Bryan | 43 | 17,818(0.24%)#81 | 1,985,710(0.00%)#3,121 |
| 82. | Medina | 42 | 17,818(0.24%)#82 | 1,985,710(0.00%)#3,149 |
| 83. | Sheffield | 42 | 17,818(0.24%)#83 | 1,985,710(0.00%)#3,175 |
| 84. | Streetsboro | 41 | 17,818(0.23%)#84 | 1,985,710(0.00%)#3,198 |
| 85. | Middleburg Heights | 41 | 17,818(0.23%)#85 | 1,985,710(0.00%)#3,200 |
| 86. | Richfield | 41 | 17,818(0.23%)#86 | 1,985,710(0.00%)#3,219 |
| 87. | Springfield | 40 | 17,818(0.22%)#87 | 1,985,710(0.00%)#3,230 |
| 88. | Hilliard | 40 | 17,818(0.22%)#88 | 1,985,710(0.00%)#3,234 |
| 89. | Parma Heights | 40 | 17,818(0.22%)#89 | 1,985,710(0.00%)#3,242 |
| 90. | Wright Patterson Afb | 40 | 17,818(0.22%)#90 | 1,985,710(0.00%)#3,272 |
| 91. | Bourneville | 40 | 17,818(0.22%)#91 | 1,985,710(0.00%)#3,273 |
| 92. | Sidney | 39 | 17,818(0.22%)#92 | 1,985,710(0.00%)#3,280 |
| 93. | Maumee | 39 | 17,818(0.22%)#93 | 1,985,710(0.00%)#3,291 |
| 94. | Findlay | 38 | 17,818(0.21%)#94 | 1,985,710(0.00%)#3,322 |
| 95. | Willoughby Hills | 38 | 17,818(0.21%)#95 | 1,985,710(0.00%)#3,346 |
| 96. | Oberlin | 38 | 17,818(0.21%)#96 | 1,985,710(0.00%)#3,352 |
| 97. | Taylor Creek | 38 | 17,818(0.21%)#97 | 1,985,710(0.00%)#3,363 |
| 98. | Bowling Green | 37 | 17,818(0.21%)#98 | 1,985,710(0.00%)#3,372 |
| 99. | Orange | 36 | 17,818(0.20%)#99 | 1,985,710(0.00%)#3,447 |
| 100. | Moraine | 35 | 17,818(0.20%)#100 | 1,985,710(0.00%)#3,492 |
Common Questions
What are the Top 10 Cities with the Most Immigrants from Philippines in Ohio?
Top 10 Cities with the Most Immigrants from Philippines in Ohio are:
#1
2,064
#2
618
#3
387
#4
380
#5
347
#6
344
#7
332
#8
216
#9
213
#10
196
What city has the Most Immigrants from Philippines in Ohio?
Columbus has the Most Immigrants from Philippines in Ohio with 2,064.
What is the Total Immigrants from Philippines in the State of Ohio?
Total Immigrants from Philippines in Ohio is 17,818.
What is the Total Immigrants from Philippines in the United States?
Total Immigrants from Philippines in the United States is 1,985,710.