Cities with the Highest Percentage of Belgian Population in Ohio
RELATED REPORTS & OPTIONS
Belgian
Ohio
Compare Cities
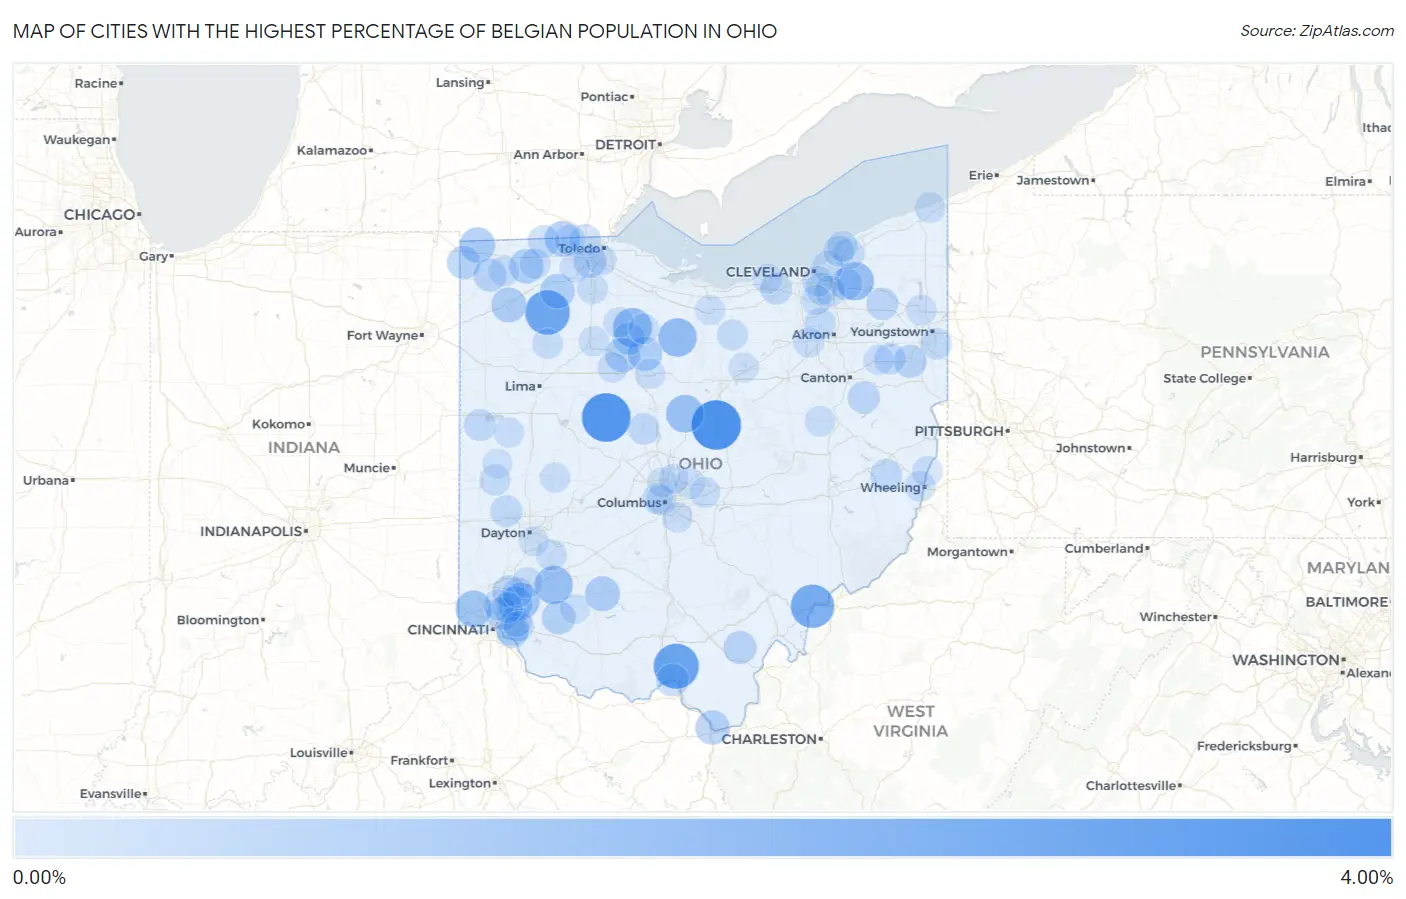
Map of Cities with the Highest Percentage of Belgian Population in Ohio
0.00%
4.00%
Cities with the Highest Percentage of Belgian Population in Ohio
| City | Belgian | vs State | vs National | |
| 1. | Fredericktown | 3.67% | 0.071%(+3.60)#1 | 0.099%(+3.57)#150 |
| 2. | Mount Victory | 3.51% | 0.071%(+3.44)#2 | 0.099%(+3.41)#163 |
| 3. | Clarktown | 2.86% | 0.071%(+2.79)#3 | 0.099%(+2.76)#211 |
| 4. | Hamler | 2.77% | 0.071%(+2.70)#4 | 0.099%(+2.67)#215 |
| 5. | Little Hocking | 2.54% | 0.071%(+2.47)#5 | 0.099%(+2.44)#242 |
| 6. | Bascom | 1.74% | 0.071%(+1.67)#6 | 0.099%(+1.64)#391 |
| 7. | Attica | 1.68% | 0.071%(+1.61)#7 | 0.099%(+1.58)#413 |
| 8. | Clarksville | 1.60% | 0.071%(+1.53)#8 | 0.099%(+1.50)#443 |
| 9. | South Russell | 1.59% | 0.071%(+1.52)#9 | 0.099%(+1.49)#446 |
| 10. | Mount Gilead | 1.54% | 0.071%(+1.47)#10 | 0.099%(+1.44)#470 |
| 11. | Loveland Park | 1.37% | 0.071%(+1.30)#11 | 0.099%(+1.27)#533 |
| 12. | Taylor Creek | 1.30% | 0.071%(+1.23)#12 | 0.099%(+1.21)#568 |
| 13. | Metamora | 1.12% | 0.071%(+1.05)#13 | 0.099%(+1.02)#670 |
| 14. | Lake Seneca | 1.11% | 0.071%(+1.03)#14 | 0.099%(+1.01)#680 |
| 15. | Sixteen Mile Stand | 1.06% | 0.071%(+0.989)#15 | 0.099%(+0.962)#704 |
| 16. | Leesburg | 1.02% | 0.071%(+0.952)#16 | 0.099%(+0.925)#727 |
| 17. | Defiance | 1.01% | 0.071%(+0.943)#17 | 0.099%(+0.916)#738 |
| 18. | Carey | 0.99% | 0.071%(+0.923)#18 | 0.099%(+0.896)#757 |
| 19. | Mcclure | 0.98% | 0.071%(+0.905)#19 | 0.099%(+0.878)#772 |
| 20. | Sycamore | 0.95% | 0.071%(+0.883)#20 | 0.099%(+0.856)#788 |
| 21. | Pettisville | 0.95% | 0.071%(+0.875)#21 | 0.099%(+0.848)#798 |
| 22. | South Point | 0.90% | 0.071%(+0.829)#22 | 0.099%(+0.801)#841 |
| 23. | Fayetteville | 0.83% | 0.071%(+0.758)#23 | 0.099%(+0.731)#906 |
| 24. | Edon | 0.78% | 0.071%(+0.705)#24 | 0.099%(+0.677)#969 |
| 25. | Dry Run | 0.77% | 0.071%(+0.697)#25 | 0.099%(+0.670)#978 |
| 26. | Bryan | 0.74% | 0.071%(+0.667)#26 | 0.099%(+0.639)#1,015 |
| 27. | Salem | 0.70% | 0.071%(+0.628)#27 | 0.099%(+0.601)#1,060 |
| 28. | Vinton | 0.69% | 0.071%(+0.623)#28 | 0.099%(+0.596)#1,068 |
| 29. | Maumee | 0.66% | 0.071%(+0.587)#29 | 0.099%(+0.559)#1,133 |
| 30. | Portsmouth | 0.63% | 0.071%(+0.557)#30 | 0.099%(+0.530)#1,177 |
| 31. | Amberley | 0.63% | 0.071%(+0.556)#31 | 0.099%(+0.529)#1,181 |
| 32. | New Riegel | 0.61% | 0.071%(+0.538)#32 | 0.099%(+0.511)#1,207 |
| 33. | Bentleyville | 0.57% | 0.071%(+0.501)#33 | 0.099%(+0.473)#1,266 |
| 34. | Wetherington | 0.57% | 0.071%(+0.494)#34 | 0.099%(+0.467)#1,279 |
| 35. | Waynesburg | 0.55% | 0.071%(+0.478)#35 | 0.099%(+0.451)#1,318 |
| 36. | Garrettsville | 0.54% | 0.071%(+0.469)#36 | 0.099%(+0.441)#1,341 |
| 37. | Flushing | 0.52% | 0.071%(+0.446)#37 | 0.099%(+0.418)#1,406 |
| 38. | Coldwater | 0.51% | 0.071%(+0.438)#38 | 0.099%(+0.411)#1,420 |
| 39. | Lyons | 0.51% | 0.071%(+0.438)#39 | 0.099%(+0.411)#1,421 |
| 40. | Phillipsburg | 0.50% | 0.071%(+0.431)#40 | 0.099%(+0.404)#1,439 |
| 41. | North Ridgeville | 0.49% | 0.071%(+0.416)#41 | 0.099%(+0.389)#1,481 |
| 42. | Prospect | 0.47% | 0.071%(+0.402)#42 | 0.099%(+0.375)#1,515 |
| 43. | Forestville | 0.46% | 0.071%(+0.385)#43 | 0.099%(+0.358)#1,551 |
| 44. | Sebring | 0.45% | 0.071%(+0.383)#44 | 0.099%(+0.355)#1,555 |
| 45. | Sylvania | 0.45% | 0.071%(+0.380)#45 | 0.099%(+0.353)#1,562 |
| 46. | Poland | 0.43% | 0.071%(+0.356)#46 | 0.099%(+0.329)#1,625 |
| 47. | Independence | 0.42% | 0.071%(+0.353)#47 | 0.099%(+0.326)#1,639 |
| 48. | Montrose Ghent | 0.39% | 0.071%(+0.321)#48 | 0.099%(+0.294)#1,739 |
| 49. | East Cleveland | 0.37% | 0.071%(+0.302)#49 | 0.099%(+0.275)#1,816 |
| 50. | Terrace Park | 0.37% | 0.071%(+0.301)#50 | 0.099%(+0.273)#1,821 |
| 51. | Glendale | 0.37% | 0.071%(+0.300)#51 | 0.099%(+0.273)#1,828 |
| 52. | Waite Hill | 0.36% | 0.071%(+0.290)#52 | 0.099%(+0.262)#1,860 |
| 53. | New London | 0.36% | 0.071%(+0.284)#53 | 0.099%(+0.257)#1,882 |
| 54. | Willowick | 0.35% | 0.071%(+0.280)#54 | 0.099%(+0.253)#1,894 |
| 55. | Gettysburg | 0.35% | 0.071%(+0.277)#55 | 0.099%(+0.250)#1,918 |
| 56. | Spring Valley | 0.33% | 0.071%(+0.259)#56 | 0.099%(+0.231)#1,999 |
| 57. | Wauseon | 0.33% | 0.071%(+0.257)#57 | 0.099%(+0.230)#2,009 |
| 58. | Walton Hills | 0.33% | 0.071%(+0.256)#58 | 0.099%(+0.228)#2,019 |
| 59. | Berkey | 0.32% | 0.071%(+0.251)#59 | 0.099%(+0.224)#2,042 |
| 60. | Cuyahoga Heights | 0.32% | 0.071%(+0.247)#60 | 0.099%(+0.220)#2,054 |
| 61. | Beechwood Trails | 0.31% | 0.071%(+0.238)#61 | 0.099%(+0.211)#2,099 |
| 62. | Fort Mckinley | 0.31% | 0.071%(+0.235)#62 | 0.099%(+0.208)#2,117 |
| 63. | Timberlake | 0.31% | 0.071%(+0.234)#63 | 0.099%(+0.207)#2,123 |
| 64. | Bowling Green | 0.30% | 0.071%(+0.230)#64 | 0.099%(+0.203)#2,138 |
| 65. | Brookside | 0.30% | 0.071%(+0.229)#65 | 0.099%(+0.202)#2,145 |
| 66. | Blue Ash | 0.30% | 0.071%(+0.229)#66 | 0.099%(+0.201)#2,149 |
| 67. | Marble Cliff | 0.30% | 0.071%(+0.226)#67 | 0.099%(+0.198)#2,164 |
| 68. | Tiltonsville | 0.29% | 0.071%(+0.223)#68 | 0.099%(+0.195)#2,180 |
| 69. | Ottawa | 0.29% | 0.071%(+0.221)#69 | 0.099%(+0.193)#2,195 |
| 70. | Sugarcreek | 0.29% | 0.071%(+0.220)#70 | 0.099%(+0.193)#2,198 |
| 71. | North Kingsville | 0.29% | 0.071%(+0.220)#71 | 0.099%(+0.192)#2,202 |
| 72. | Lebanon | 0.29% | 0.071%(+0.219)#72 | 0.099%(+0.192)#2,209 |
| 73. | Stryker | 0.29% | 0.071%(+0.217)#73 | 0.099%(+0.189)#2,222 |
| 74. | Rossford | 0.29% | 0.071%(+0.214)#74 | 0.099%(+0.186)#2,240 |
| 75. | Whitehouse | 0.27% | 0.071%(+0.201)#75 | 0.099%(+0.174)#2,321 |
| 76. | Howland Center | 0.27% | 0.071%(+0.200)#76 | 0.099%(+0.172)#2,328 |
| 77. | Wadsworth | 0.27% | 0.071%(+0.199)#77 | 0.099%(+0.171)#2,335 |
| 78. | Grandview Heights | 0.27% | 0.071%(+0.195)#78 | 0.099%(+0.168)#2,364 |
| 79. | Nevada | 0.27% | 0.071%(+0.195)#79 | 0.099%(+0.167)#2,366 |
| 80. | Summerside | 0.27% | 0.071%(+0.194)#80 | 0.099%(+0.167)#2,369 |
| 81. | Mason | 0.26% | 0.071%(+0.193)#81 | 0.099%(+0.166)#2,378 |
| 82. | Alliance | 0.26% | 0.071%(+0.192)#82 | 0.099%(+0.165)#2,387 |
| 83. | Fostoria | 0.26% | 0.071%(+0.192)#83 | 0.099%(+0.165)#2,392 |
| 84. | Tiffin | 0.26% | 0.071%(+0.191)#84 | 0.099%(+0.164)#2,399 |
| 85. | Wharton | 0.26% | 0.071%(+0.191)#85 | 0.099%(+0.164)#2,403 |
| 86. | Oakwood Village Cuyahoga County | 0.25% | 0.071%(+0.182)#86 | 0.099%(+0.155)#2,463 |
| 87. | Groveport | 0.25% | 0.071%(+0.182)#87 | 0.099%(+0.154)#2,466 |
| 88. | New Bremen | 0.25% | 0.071%(+0.174)#88 | 0.099%(+0.147)#2,513 |
| 89. | Findlay | 0.24% | 0.071%(+0.169)#89 | 0.099%(+0.141)#2,548 |
| 90. | Sheffield | 0.24% | 0.071%(+0.165)#90 | 0.099%(+0.138)#2,580 |
| 91. | St Paris | 0.23% | 0.071%(+0.162)#91 | 0.099%(+0.135)#2,603 |
| 92. | Broadview Heights | 0.23% | 0.071%(+0.161)#92 | 0.099%(+0.133)#2,618 |
| 93. | Ashland | 0.23% | 0.071%(+0.157)#93 | 0.099%(+0.129)#2,642 |
| 94. | Norwalk | 0.22% | 0.071%(+0.146)#94 | 0.099%(+0.118)#2,731 |
| 95. | Worthington | 0.21% | 0.071%(+0.142)#95 | 0.099%(+0.115)#2,763 |
| 96. | New Albany | 0.21% | 0.071%(+0.138)#96 | 0.099%(+0.110)#2,788 |
| 97. | Westerville | 0.21% | 0.071%(+0.137)#97 | 0.099%(+0.109)#2,795 |
| 98. | Lynchburg | 0.21% | 0.071%(+0.136)#98 | 0.099%(+0.109)#2,799 |
| 99. | Versailles | 0.20% | 0.071%(+0.132)#99 | 0.099%(+0.105)#2,833 |
| 100. | Kettering | 0.20% | 0.071%(+0.130)#100 | 0.099%(+0.102)#2,855 |
Common Questions
What are the Top 10 Cities with the Highest Percentage of Belgian Population in Ohio?
Top 10 Cities with the Highest Percentage of Belgian Population in Ohio are:
#1
3.67%
#2
3.51%
#3
2.86%
#4
2.77%
#5
2.54%
#6
1.74%
#7
1.68%
#8
1.60%
#9
1.59%
#10
1.54%
What city has the Highest Percentage of Belgian Population in Ohio?
Fredericktown has the Highest Percentage of Belgian Population in Ohio with 3.67%.
What is the Percentage of Belgian Population in the State of Ohio?
Percentage of Belgian Population in Ohio is 0.071%.
What is the Percentage of Belgian Population in the United States?
Percentage of Belgian Population in the United States is 0.099%.