Collins, OH Map & Demographics
Collins Map
Collins Overview
$28,073
PER CAPITA INCOME
$62,604
AVG FAMILY INCOME
$82,656
AVG HOUSEHOLD INCOME
45.6%
WAGE / INCOME GAP [ % ]
54.4¢/ $1
WAGE / INCOME GAP [ $ ]
0.27
INEQUALITY / GINI INDEX
442
TOTAL POPULATION
234
MALE POPULATION
208
FEMALE POPULATION
112.50
MALES / 100 FEMALES
88.89
FEMALES / 100 MALES
35.3
MEDIAN AGE
3.1
AVG FAMILY SIZE
3.1
AVG HOUSEHOLD SIZE
235
LABOR FORCE [ PEOPLE ]
73.4%
PERCENT IN LABOR FORCE
Collins Zip Codes
Income in Collins
Income Overview in Collins
Per Capita Income in Collins is $28,073, while median incomes of families and households are $62,604 and $82,656 respectively.
| Characteristic | Number | Measure |
| Per Capita Income | 442 | $28,073 |
| Median Family Income | 131 | $62,604 |
| Mean Family Income | 131 | $76,947 |
| Median Household Income | 142 | $82,656 |
| Mean Household Income | 142 | $87,514 |
| Income Deficit | 131 | $0 |
| Wage / Income Gap (%) | 442 | 45.55% |
| Wage / Income Gap ($) | 442 | 54.45¢ per $1 |
| Gini / Inequality Index | 442 | 0.27 |
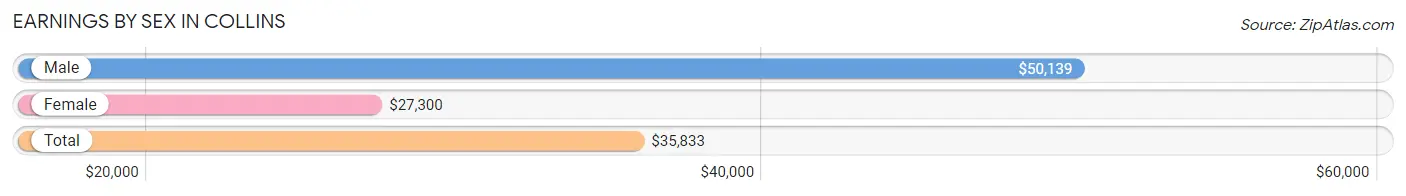
Earnings by Sex in Collins
Average Earnings in Collins are $35,833, $50,139 for men and $27,300 for women, a difference of 45.6%.
| Sex | Number | Average Earnings |
| Male | 118 (46.5%) | $50,139 |
| Female | 136 (53.5%) | $27,300 |
| Total | 254 (100.0%) | $35,833 |
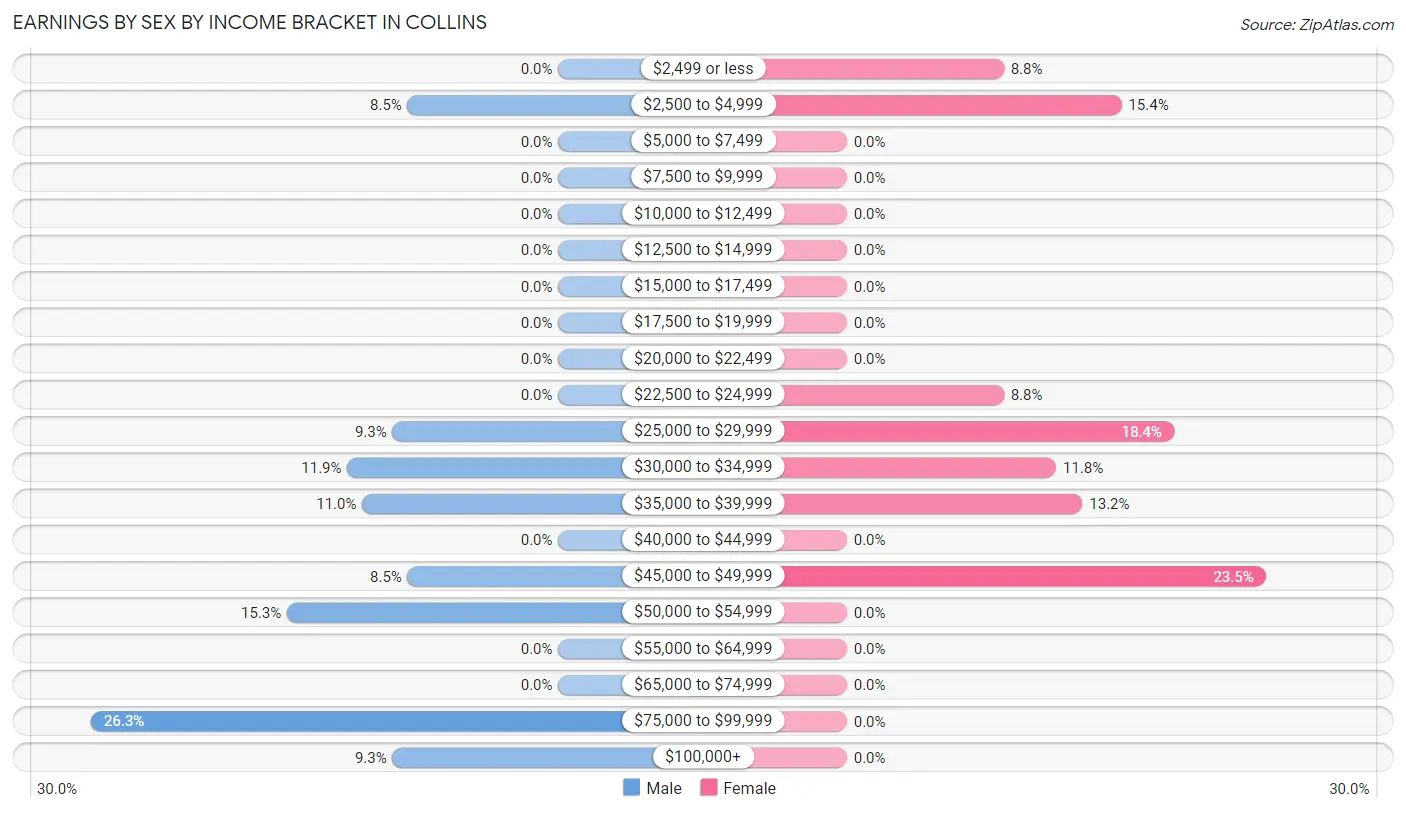
Earnings by Sex by Income Bracket in Collins
The most common earnings brackets in Collins are $75,000 to $99,999 for men (31 | 26.3%) and $45,000 to $49,999 for women (32 | 23.5%).
| Income | Male | Female |
| $2,499 or less | 0 (0.0%) | 12 (8.8%) |
| $2,500 to $4,999 | 10 (8.5%) | 21 (15.4%) |
| $5,000 to $7,499 | 0 (0.0%) | 0 (0.0%) |
| $7,500 to $9,999 | 0 (0.0%) | 0 (0.0%) |
| $10,000 to $12,499 | 0 (0.0%) | 0 (0.0%) |
| $12,500 to $14,999 | 0 (0.0%) | 0 (0.0%) |
| $15,000 to $17,499 | 0 (0.0%) | 0 (0.0%) |
| $17,500 to $19,999 | 0 (0.0%) | 0 (0.0%) |
| $20,000 to $22,499 | 0 (0.0%) | 0 (0.0%) |
| $22,500 to $24,999 | 0 (0.0%) | 12 (8.8%) |
| $25,000 to $29,999 | 11 (9.3%) | 25 (18.4%) |
| $30,000 to $34,999 | 14 (11.9%) | 16 (11.8%) |
| $35,000 to $39,999 | 13 (11.0%) | 18 (13.2%) |
| $40,000 to $44,999 | 0 (0.0%) | 0 (0.0%) |
| $45,000 to $49,999 | 10 (8.5%) | 32 (23.5%) |
| $50,000 to $54,999 | 18 (15.2%) | 0 (0.0%) |
| $55,000 to $64,999 | 0 (0.0%) | 0 (0.0%) |
| $65,000 to $74,999 | 0 (0.0%) | 0 (0.0%) |
| $75,000 to $99,999 | 31 (26.3%) | 0 (0.0%) |
| $100,000+ | 11 (9.3%) | 0 (0.0%) |
| Total | 118 (100.0%) | 136 (100.0%) |
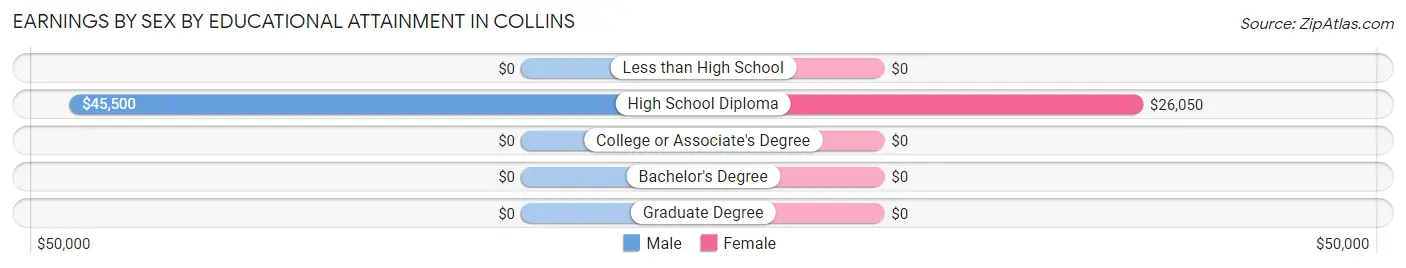
Earnings by Sex by Educational Attainment in Collins
Average earnings in Collins are $50,139 for men and $31,641 for women, a difference of 36.9%. Men with an educational attainment of high school diploma enjoy the highest average annual earnings of $45,500, while those with high school diploma education earn the least with $45,500. Women with an educational attainment of high school diploma earn the most with the average annual earnings of $26,050, while those with high school diploma education have the smallest earnings of $26,050.
| Educational Attainment | Male Income | Female Income |
| Less than High School | - | - |
| High School Diploma | $45,500 | $26,050 |
| College or Associate's Degree | - | - |
| Bachelor's Degree | - | - |
| Graduate Degree | - | - |
| Total | $50,139 | $31,641 |
Family Income in Collins
Family Income Brackets in Collins
According to the Collins family income data, there are 55 families falling into the $35,000 to $49,999 income range, which is the most common income bracket and makes up 42.0% of all families.
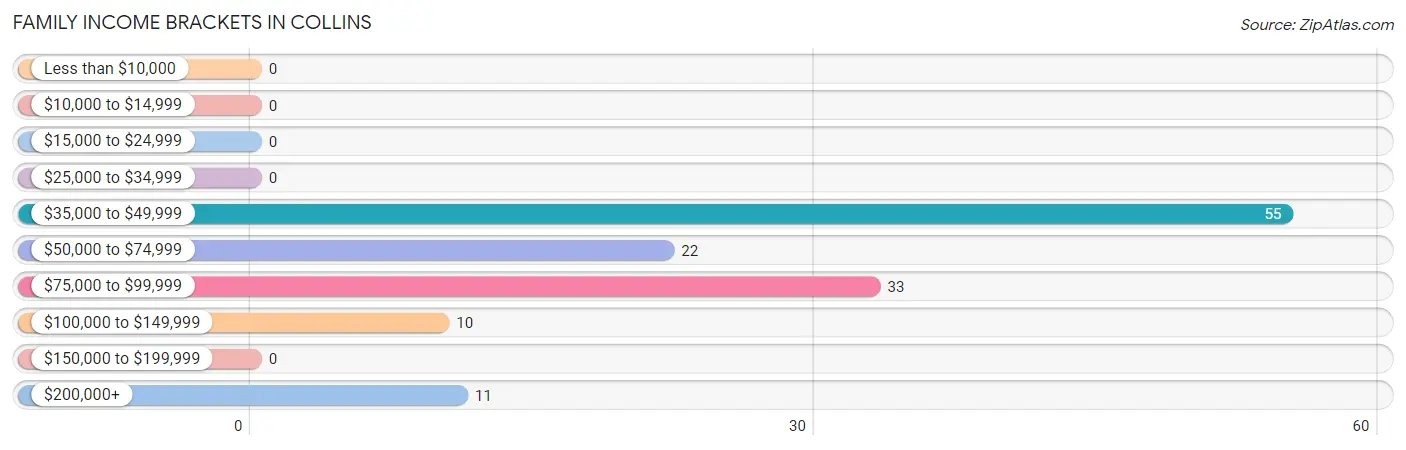
| Income Bracket | # Families | % Families |
| Less than $10,000 | 0 | 0.0% |
| $10,000 to $14,999 | 0 | 0.0% |
| $15,000 to $24,999 | 0 | 0.0% |
| $25,000 to $34,999 | 0 | 0.0% |
| $35,000 to $49,999 | 55 | 42.0% |
| $50,000 to $74,999 | 22 | 16.8% |
| $75,000 to $99,999 | 33 | 25.2% |
| $100,000 to $149,999 | 10 | 7.6% |
| $150,000 to $199,999 | 0 | 0.0% |
| $200,000+ | 11 | 8.4% |
Family Income by Famaliy Size in Collins
4-person families (44 | 33.6%) account for the highest median family income in Collins with $88,382 per family, while 2-person families (49 | 37.4%) have the highest median income of $23,884 per family member.
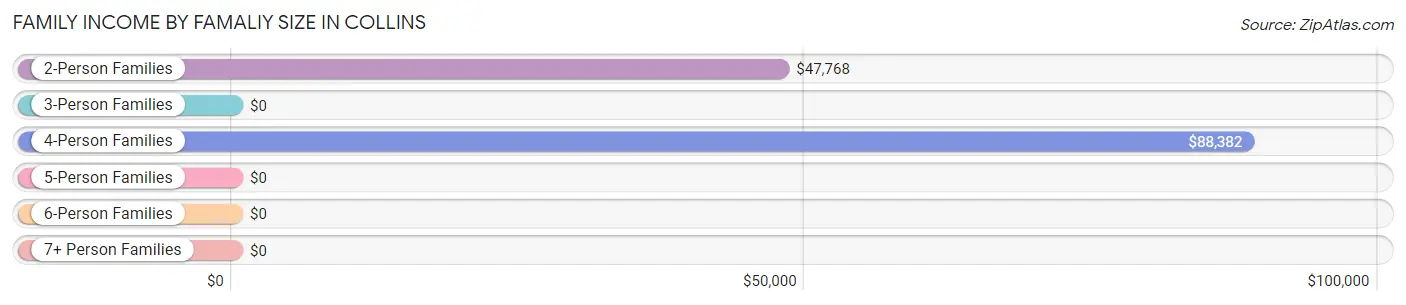
| Income Bracket | # Families | Median Income |
| 2-Person Families | 49 (37.4%) | $47,768 |
| 3-Person Families | 38 (29.0%) | $0 |
| 4-Person Families | 44 (33.6%) | $88,382 |
| 5-Person Families | 0 (0.0%) | $0 |
| 6-Person Families | 0 (0.0%) | $0 |
| 7+ Person Families | 0 (0.0%) | $0 |
| Total | 131 (100.0%) | $62,604 |
Family Income by Number of Earners in Collins
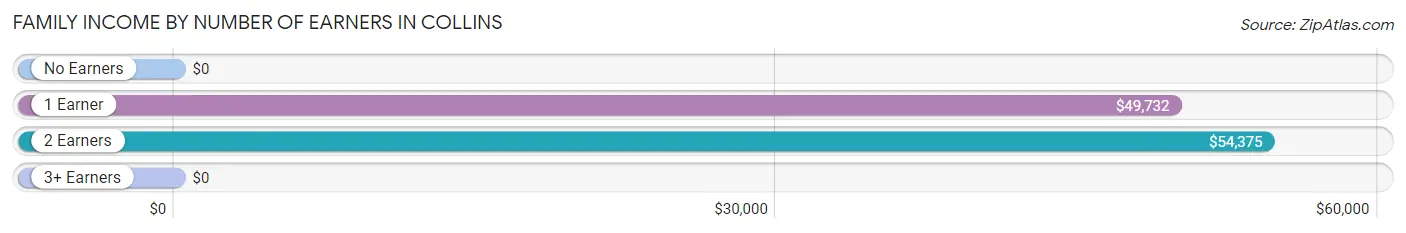
| Number of Earners | # Families | Median Income |
| No Earners | 12 (9.2%) | $0 |
| 1 Earner | 61 (46.6%) | $49,732 |
| 2 Earners | 37 (28.2%) | $54,375 |
| 3+ Earners | 21 (16.0%) | $0 |
| Total | 131 (100.0%) | $62,604 |
Household Income in Collins
Household Income Brackets in Collins
With 37 households falling in the category, the $35,000 to $49,999 income range is the most frequent in Collins, accounting for 26.1% of all households.
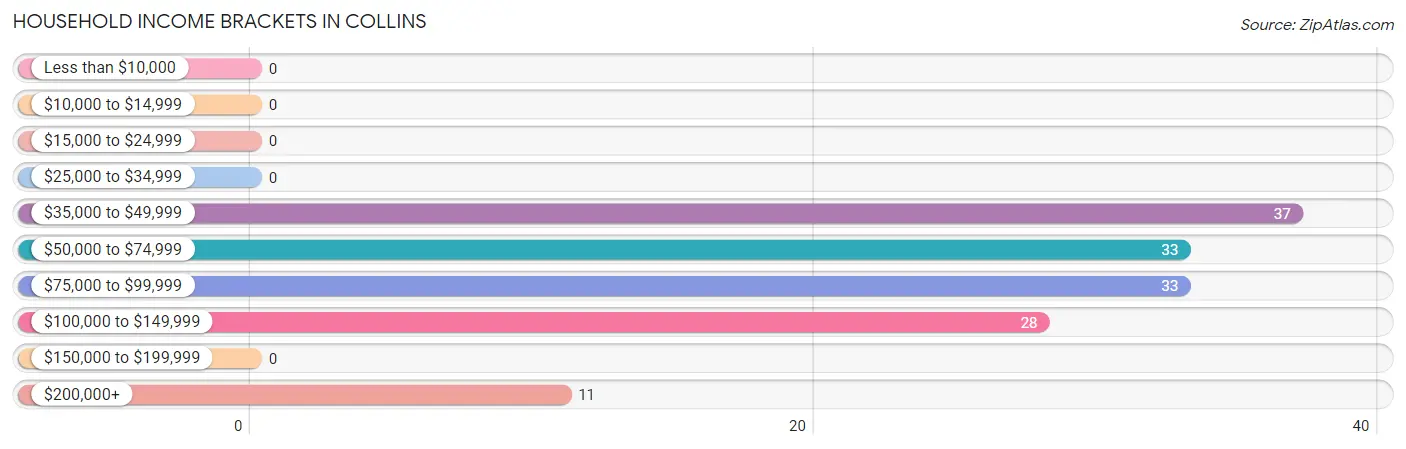
| Income Bracket | # Households | % Households |
| Less than $10,000 | 0 | 0.0% |
| $10,000 to $14,999 | 0 | 0.0% |
| $15,000 to $24,999 | 0 | 0.0% |
| $25,000 to $34,999 | 0 | 0.0% |
| $35,000 to $49,999 | 37 | 26.1% |
| $50,000 to $74,999 | 33 | 23.2% |
| $75,000 to $99,999 | 33 | 23.2% |
| $100,000 to $149,999 | 28 | 19.7% |
| $150,000 to $199,999 | 0 | 0.0% |
| $200,000+ | 11 | 7.7% |
Household Income by Householder Age in Collins
The median household income in Collins is $82,656, with the highest median household income of $88,971 found in the 25 to 44 years age bracket for the primary householder. A total of 72 households (50.7%) fall into this category.
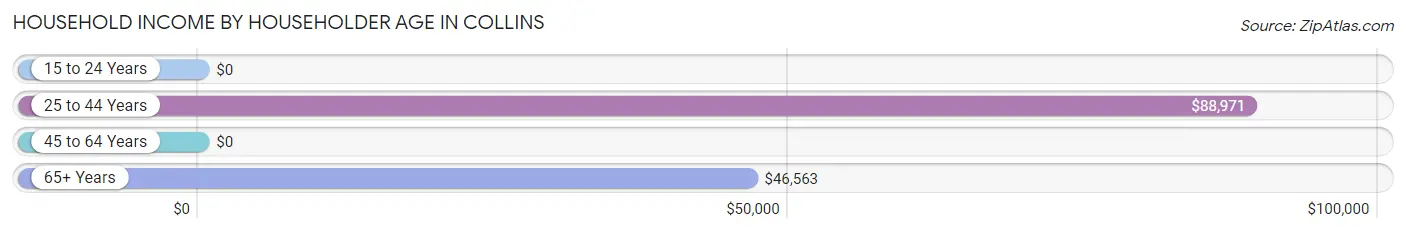
| Income Bracket | # Households | Median Income |
| 15 to 24 Years | 0 (0.0%) | $0 |
| 25 to 44 Years | 72 (50.7%) | $88,971 |
| 45 to 64 Years | 33 (23.2%) | $0 |
| 65+ Years | 37 (26.1%) | $46,563 |
| Total | 142 (100.0%) | $82,656 |
Poverty in Collins
Income Below Poverty by Sex and Age in Collins
| Age Bracket | Male | Female |
| Under 5 Years | 0 (0.0%) | 0 (0.0%) |
| 5 Years | 0 (0.0%) | 0 (0.0%) |
| 6 to 11 Years | 0 (0.0%) | 0 (0.0%) |
| 12 to 14 Years | 0 (0.0%) | 0 (0.0%) |
| 15 Years | 0 (0.0%) | 0 (0.0%) |
| 16 and 17 Years | 0 (0.0%) | 0 (0.0%) |
| 18 to 24 Years | 0 (0.0%) | 0 (0.0%) |
| 25 to 34 Years | 0 (0.0%) | 0 (0.0%) |
| 35 to 44 Years | 0 (0.0%) | 0 (0.0%) |
| 45 to 54 Years | 0 (0.0%) | 0 (0.0%) |
| 55 to 64 Years | 0 (0.0%) | 0 (0.0%) |
| 65 to 74 Years | 0 (0.0%) | 0 (0.0%) |
| 75 Years and over | 0 (0.0%) | 0 (0.0%) |
| Total | 0 (0.0%) | 0 (0.0%) |
Income Above Poverty by Sex and Age in Collins
According to the poverty statistics in Collins, males aged under 5 years and females aged under 5 years are the age groups that are most secure financially, with 100.0% of males and 100.0% of females in these age groups living above the poverty line.
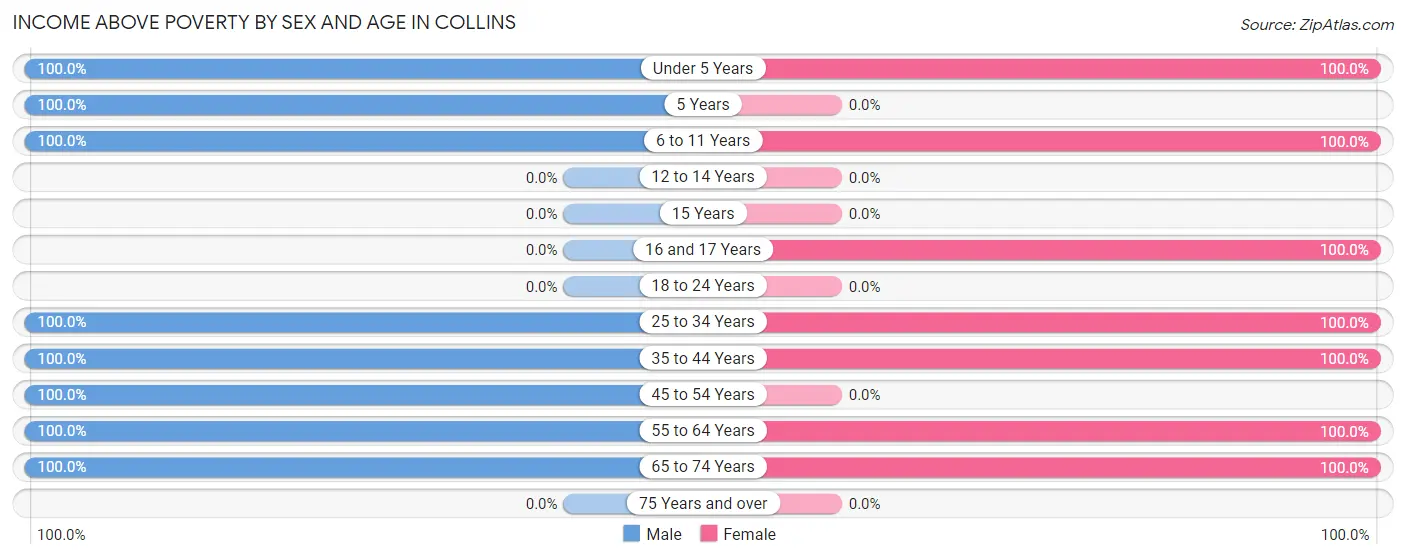
| Age Bracket | Male | Female |
| Under 5 Years | 38 (100.0%) | 13 (100.0%) |
| 5 Years | 18 (100.0%) | 0 (0.0%) |
| 6 to 11 Years | 21 (100.0%) | 32 (100.0%) |
| 12 to 14 Years | 0 (0.0%) | 0 (0.0%) |
| 15 Years | 0 (0.0%) | 0 (0.0%) |
| 16 and 17 Years | 0 (0.0%) | 25 (100.0%) |
| 18 to 24 Years | 0 (0.0%) | 0 (0.0%) |
| 25 to 34 Years | 31 (100.0%) | 35 (100.0%) |
| 35 to 44 Years | 39 (100.0%) | 38 (100.0%) |
| 45 to 54 Years | 27 (100.0%) | 0 (0.0%) |
| 55 to 64 Years | 23 (100.0%) | 41 (100.0%) |
| 65 to 74 Years | 37 (100.0%) | 24 (100.0%) |
| 75 Years and over | 0 (0.0%) | 0 (0.0%) |
| Total | 234 (100.0%) | 208 (100.0%) |
Income Below Poverty Among Married-Couple Families in Collins
| Children | Above Poverty | Below Poverty |
| No Children | 59 (100.0%) | 0 (0.0%) |
| 1 or 2 Children | 54 (100.0%) | 0 (0.0%) |
| 3 or 4 Children | 0 (0.0%) | 0 (0.0%) |
| 5 or more Children | 0 (0.0%) | 0 (0.0%) |
| Total | 113 (100.0%) | 0 (0.0%) |
Income Below Poverty Among Single-Parent Households in Collins
| Children | Single Father | Single Mother |
| No Children | 0 (0.0%) | 0 (0.0%) |
| 1 or 2 Children | 0 (0.0%) | 0 (0.0%) |
| 3 or 4 Children | 0 (0.0%) | 0 (0.0%) |
| 5 or more Children | 0 (0.0%) | 0 (0.0%) |
| Total | 0 (0.0%) | 0 (0.0%) |
Income Below Poverty Among Married-Couple vs Single-Parent Households in Collins
| Children | Married-Couple Families | Single-Parent Households |
| No Children | 0 (0.0%) | 0 (0.0%) |
| 1 or 2 Children | 0 (0.0%) | 0 (0.0%) |
| 3 or 4 Children | 0 (0.0%) | 0 (0.0%) |
| 5 or more Children | 0 (0.0%) | 0 (0.0%) |
| Total | 0 (0.0%) | 0 (0.0%) |
Race in Collins
The most populous races in Collins are White / Caucasian (429 | 97.1%), Hispanic or Latino (13 | 2.9%), and Some other Race (13 | 2.9%).
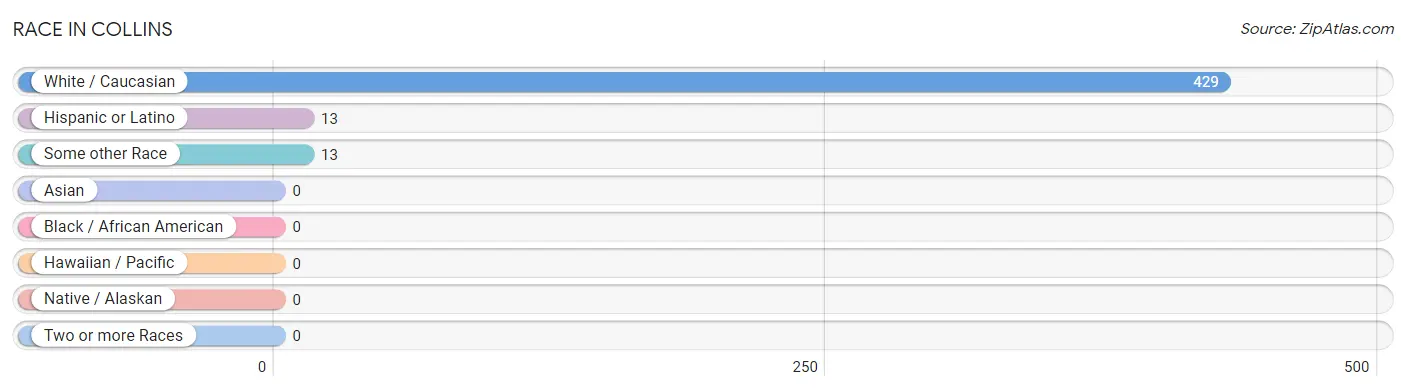
| Race | # Population | % Population |
| Asian | 0 | 0.0% |
| Black / African American | 0 | 0.0% |
| Hawaiian / Pacific | 0 | 0.0% |
| Hispanic or Latino | 13 | 2.9% |
| Native / Alaskan | 0 | 0.0% |
| White / Caucasian | 429 | 97.1% |
| Two or more Races | 0 | 0.0% |
| Some other Race | 13 | 2.9% |
| Total | 442 | 100.0% |
Ancestry in Collins
The most populous ancestries reported in Collins are German (154 | 34.8%), English (109 | 24.7%), American (39 | 8.8%), Polish (28 | 6.3%), and Swiss (24 | 5.4%), together accounting for 80.1% of all Collins residents.
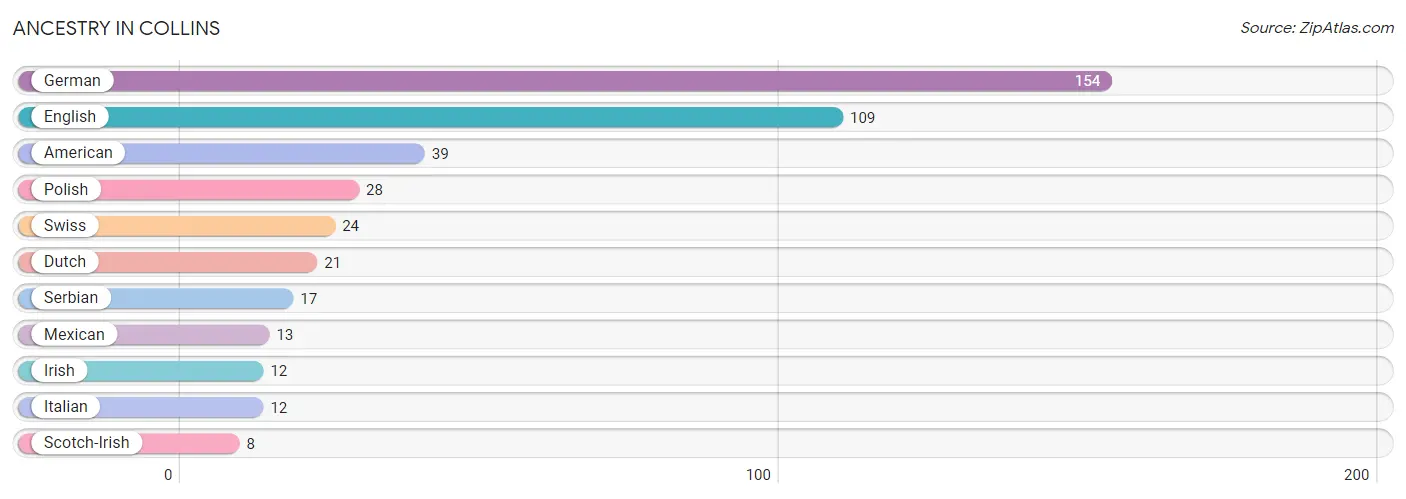
| Ancestry | # Population | % Population |
| American | 39 | 8.8% |
| Dutch | 21 | 4.8% |
| English | 109 | 24.7% |
| German | 154 | 34.8% |
| Irish | 12 | 2.7% |
| Italian | 12 | 2.7% |
| Mexican | 13 | 2.9% |
| Polish | 28 | 6.3% |
| Scotch-Irish | 8 | 1.8% |
| Serbian | 17 | 3.8% |
| Swiss | 24 | 5.4% | View All 11 Rows |
Immigrants in Collins
The most numerous immigrant groups reported in Collins came from Eastern Europe (11 | 2.5%), Europe (11 | 2.5%), and Poland (11 | 2.5%), together accounting for 7.5% of all Collins residents.
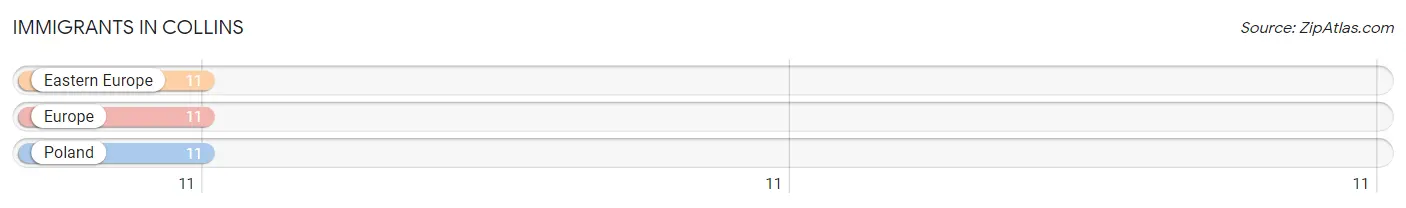
| Immigration Origin | # Population | % Population |
| Eastern Europe | 11 | 2.5% |
| Europe | 11 | 2.5% |
| Poland | 11 | 2.5% | View All 3 Rows |
Sex and Age in Collins
Sex and Age in Collins
The most populous age groups in Collins are Under 5 Years (38 | 16.2%) for men and 60 to 64 Years (41 | 19.7%) for women.
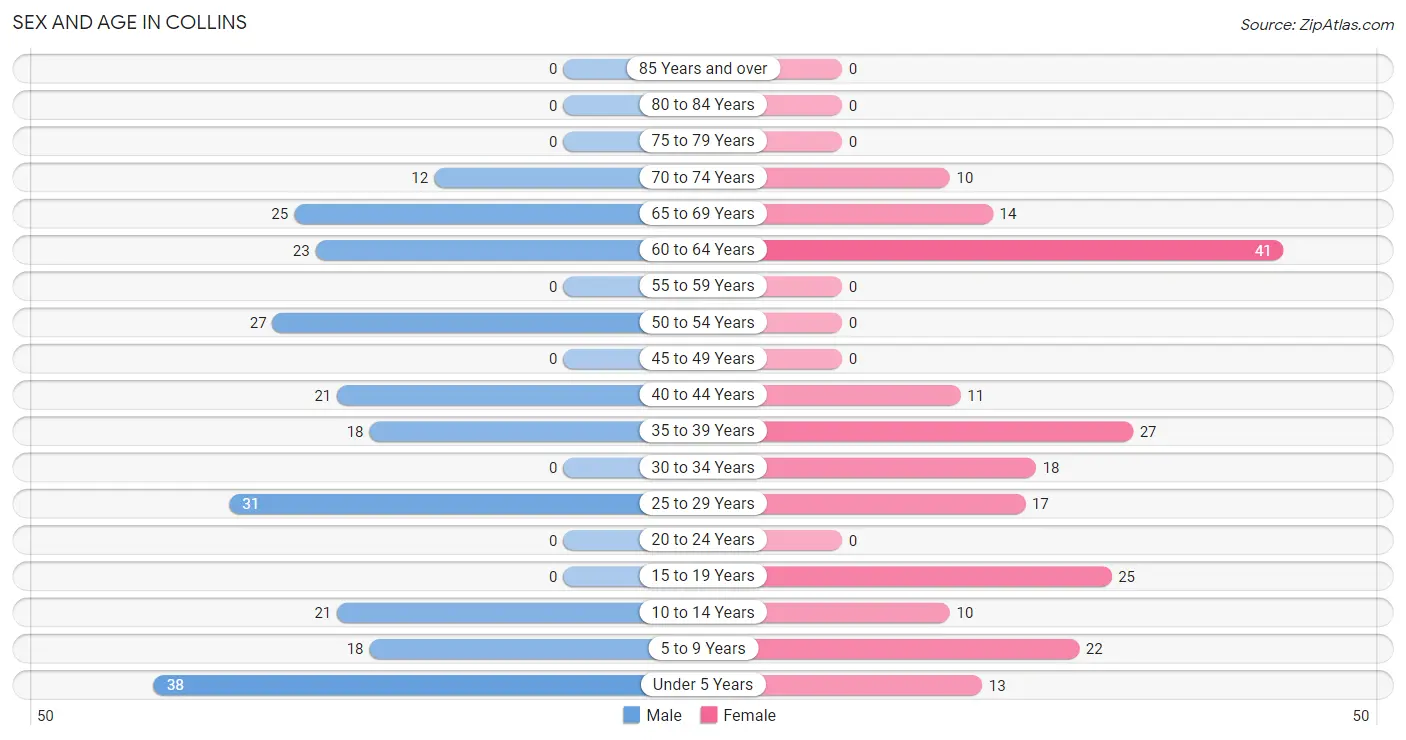
| Age Bracket | Male | Female |
| Under 5 Years | 38 (16.2%) | 13 (6.2%) |
| 5 to 9 Years | 18 (7.7%) | 22 (10.6%) |
| 10 to 14 Years | 21 (9.0%) | 10 (4.8%) |
| 15 to 19 Years | 0 (0.0%) | 25 (12.0%) |
| 20 to 24 Years | 0 (0.0%) | 0 (0.0%) |
| 25 to 29 Years | 31 (13.3%) | 17 (8.2%) |
| 30 to 34 Years | 0 (0.0%) | 18 (8.6%) |
| 35 to 39 Years | 18 (7.7%) | 27 (13.0%) |
| 40 to 44 Years | 21 (9.0%) | 11 (5.3%) |
| 45 to 49 Years | 0 (0.0%) | 0 (0.0%) |
| 50 to 54 Years | 27 (11.5%) | 0 (0.0%) |
| 55 to 59 Years | 0 (0.0%) | 0 (0.0%) |
| 60 to 64 Years | 23 (9.8%) | 41 (19.7%) |
| 65 to 69 Years | 25 (10.7%) | 14 (6.7%) |
| 70 to 74 Years | 12 (5.1%) | 10 (4.8%) |
| 75 to 79 Years | 0 (0.0%) | 0 (0.0%) |
| 80 to 84 Years | 0 (0.0%) | 0 (0.0%) |
| 85 Years and over | 0 (0.0%) | 0 (0.0%) |
| Total | 234 (100.0%) | 208 (100.0%) |
Families and Households in Collins
Median Family Size in Collins
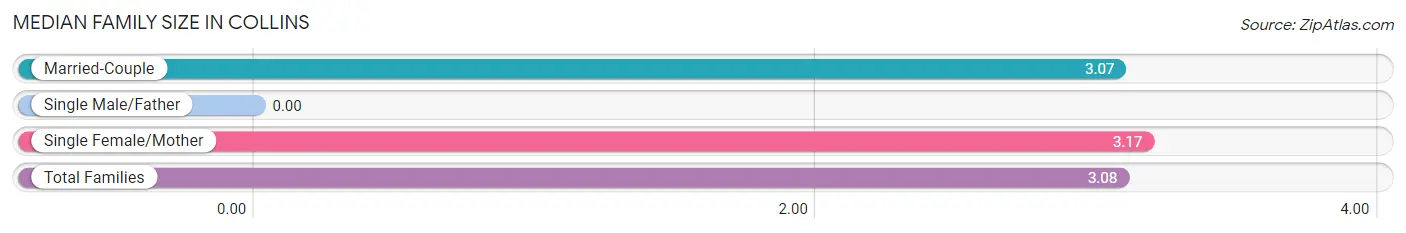
| Family Type | # Families | Family Size |
| Married-Couple | 113 (86.3%) | 3.07 |
| Single Male/Father | 0 (0.0%) | - |
| Single Female/Mother | 18 (13.7%) | 3.17 |
| Total Families | 131 (100.0%) | 3.08 |
Median Household Size in Collins
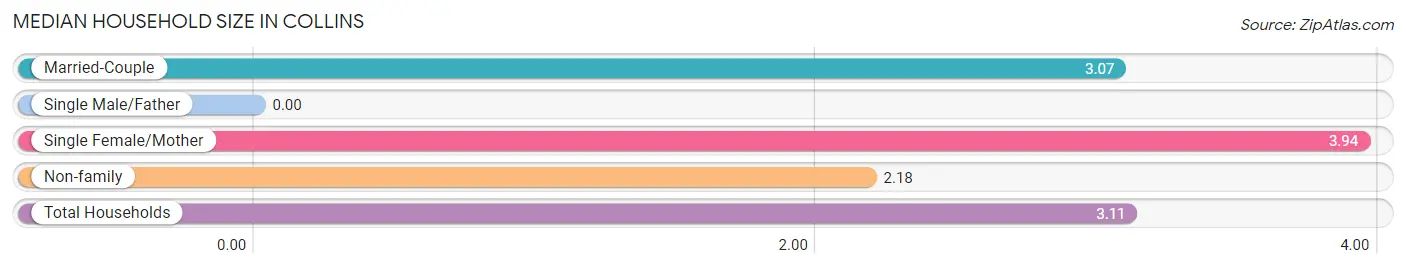
| Household Type | # Households | Household Size |
| Married-Couple | 113 (79.6%) | 3.07 |
| Single Male/Father | 0 (0.0%) | - |
| Single Female/Mother | 18 (12.7%) | 3.94 |
| Non-family | 11 (7.7%) | 2.18 |
| Total Households | 142 (100.0%) | 3.11 |
Household Size by Marriage Status in Collins
Out of a total of 142 households in Collins, 131 (92.2%) are family households, while 11 (7.7%) are nonfamily households. The most numerous type of family households are 4-person households, comprising 62, and the most common type of nonfamily households are 2-person households, comprising 11.
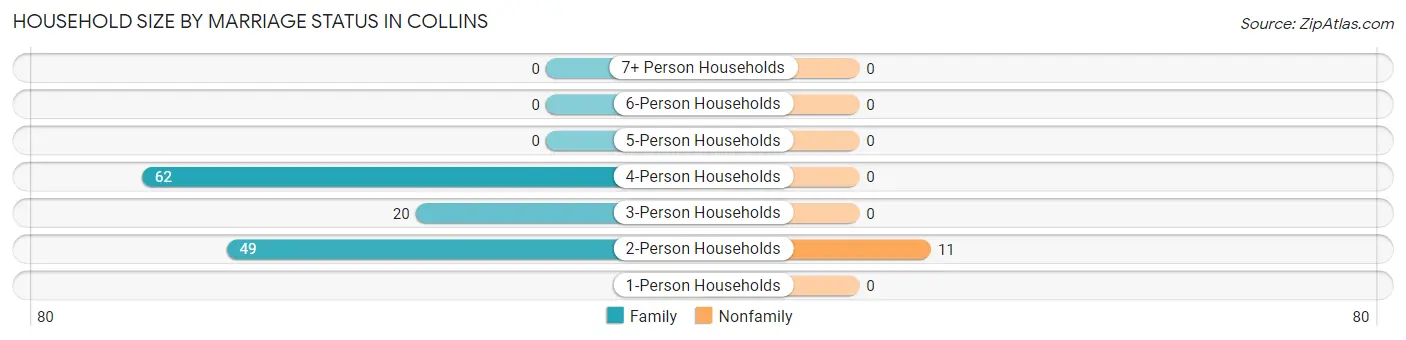
| Household Size | Family Households | Nonfamily Households |
| 1-Person Households | - | 0 (0.0%) |
| 2-Person Households | 49 (34.5%) | 11 (7.7%) |
| 3-Person Households | 20 (14.1%) | 0 (0.0%) |
| 4-Person Households | 62 (43.7%) | 0 (0.0%) |
| 5-Person Households | 0 (0.0%) | 0 (0.0%) |
| 6-Person Households | 0 (0.0%) | 0 (0.0%) |
| 7+ Person Households | 0 (0.0%) | 0 (0.0%) |
| Total | 131 (92.2%) | 11 (7.7%) |
Female Fertility in Collins
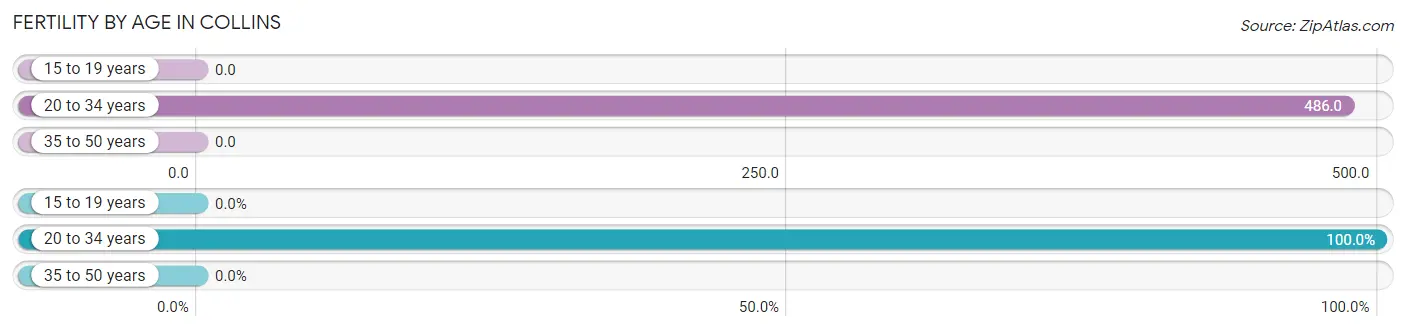
Fertility by Age in Collins
Average fertility rate in Collins is 173.0 births per 1,000 women. Women in the age bracket of 20 to 34 years have the highest fertility rate with 486.0 births per 1,000 women. Women in the age bracket of 20 to 34 years acount for 100.0% of all women with births.
| Age Bracket | Women with Births | Births / 1,000 Women |
| 15 to 19 years | 0 (0.0%) | 0.0 |
| 20 to 34 years | 17 (100.0%) | 486.0 |
| 35 to 50 years | 0 (0.0%) | 0.0 |
| Total | 17 (100.0%) | 173.0 |
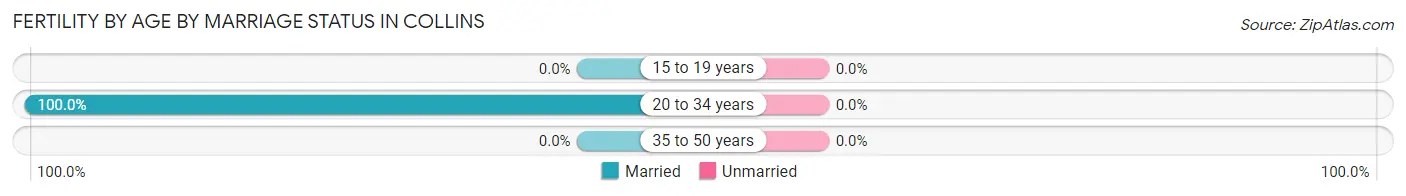
Fertility by Age by Marriage Status in Collins
| Age Bracket | Married | Unmarried |
| 15 to 19 years | 0 (0.0%) | 0 (0.0%) |
| 20 to 34 years | 17 (100.0%) | 0 (0.0%) |
| 35 to 50 years | 0 (0.0%) | 0 (0.0%) |
| Total | 17 (100.0%) | 0 (0.0%) |
Fertility by Education in Collins
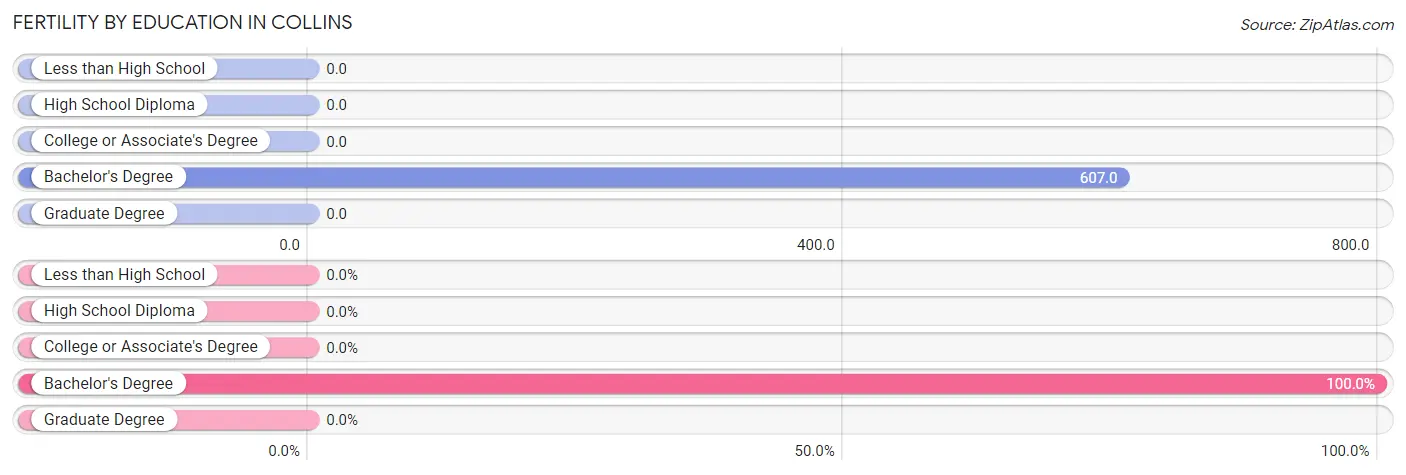
| Educational Attainment | Women with Births | Births / 1,000 Women |
| Less than High School | 0 (0.0%) | 0.0 |
| High School Diploma | 0 (0.0%) | 0.0 |
| College or Associate's Degree | 0 (0.0%) | 0.0 |
| Bachelor's Degree | 17 (100.0%) | 607.0 |
| Graduate Degree | 0 (0.0%) | 0.0 |
| Total | 17 (100.0%) | 173.0 |
Fertility by Education by Marriage Status in Collins
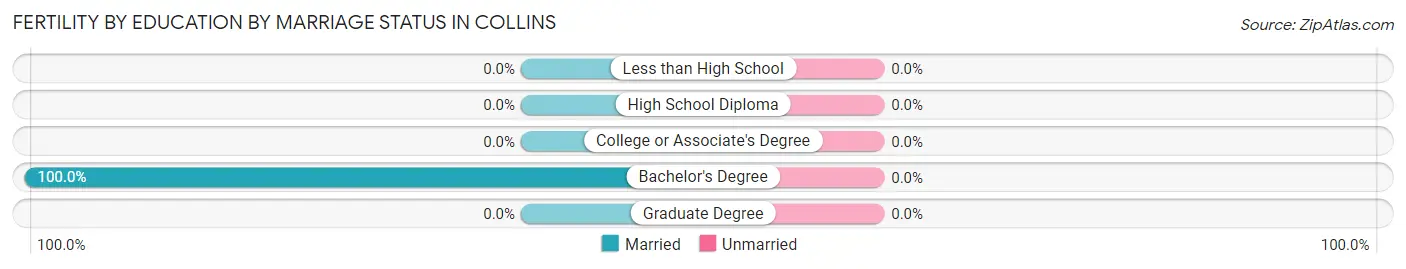
| Educational Attainment | Married | Unmarried |
| Less than High School | 0 (0.0%) | 0 (0.0%) |
| High School Diploma | 0 (0.0%) | 0 (0.0%) |
| College or Associate's Degree | 0 (0.0%) | 0 (0.0%) |
| Bachelor's Degree | 17 (100.0%) | 0 (0.0%) |
| Graduate Degree | 0 (0.0%) | 0 (0.0%) |
| Total | 17 (100.0%) | 0 (0.0%) |
Employment Characteristics in Collins
Employment by Class of Employer in Collins
Among the 235 employed individuals in Collins, private company employees (193 | 82.1%), local government employees (20 | 8.5%), and not-for-profit organizations (12 | 5.1%) make up the most common classes of employment.
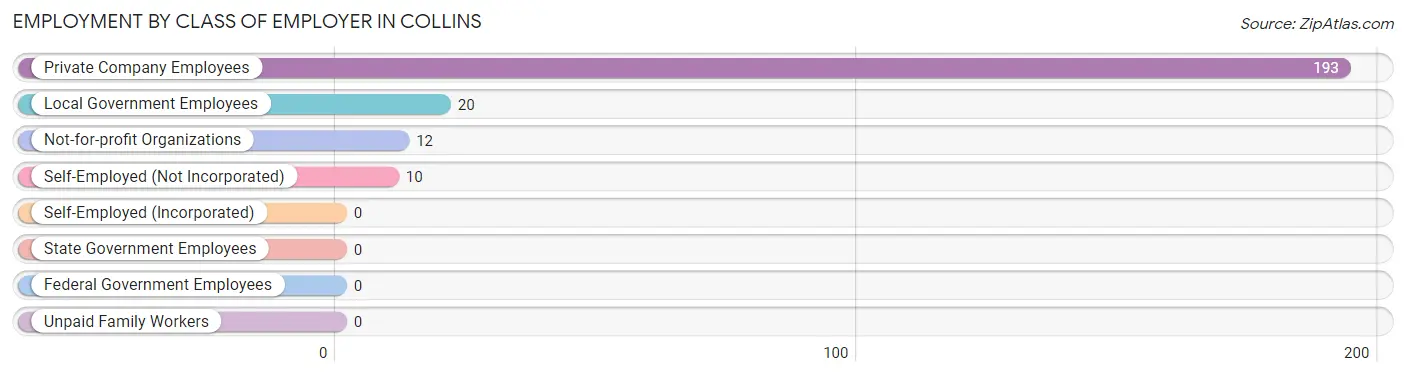
| Employer Class | # Employees | % Employees |
| Private Company Employees | 193 | 82.1% |
| Self-Employed (Incorporated) | 0 | 0.0% |
| Self-Employed (Not Incorporated) | 10 | 4.3% |
| Not-for-profit Organizations | 12 | 5.1% |
| Local Government Employees | 20 | 8.5% |
| State Government Employees | 0 | 0.0% |
| Federal Government Employees | 0 | 0.0% |
| Unpaid Family Workers | 0 | 0.0% |
| Total | 235 | 100.0% |
Employment Status by Age in Collins
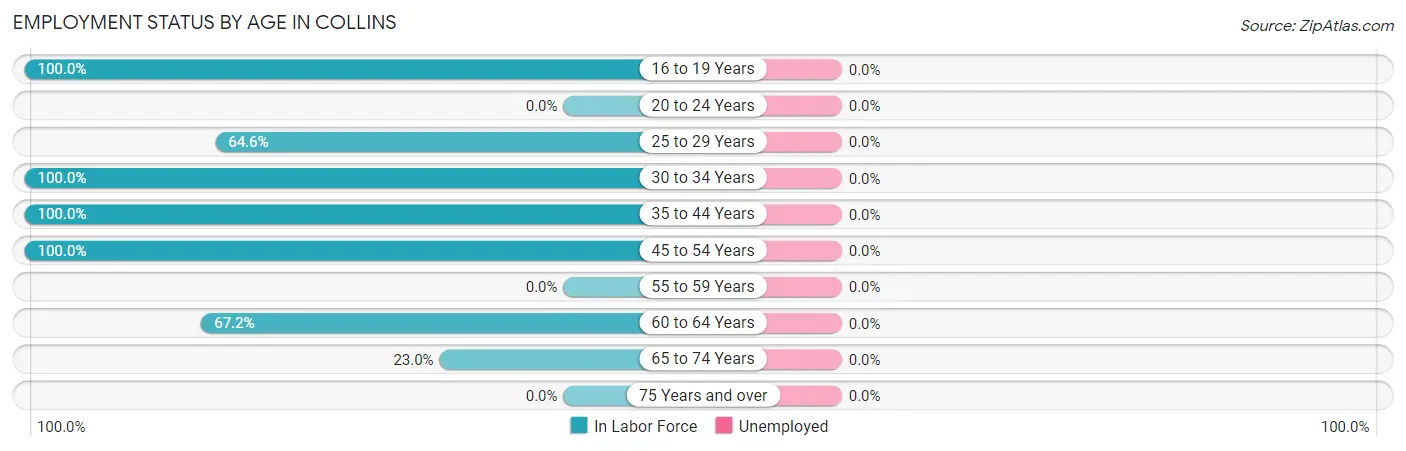
| Age Bracket | In Labor Force | Unemployed |
| 16 to 19 Years | 25 (100.0%) | 0 (0.0%) |
| 20 to 24 Years | 0 (0.0%) | 0 (0.0%) |
| 25 to 29 Years | 31 (64.6%) | 0 (0.0%) |
| 30 to 34 Years | 18 (100.0%) | 0 (0.0%) |
| 35 to 44 Years | 77 (100.0%) | 0 (0.0%) |
| 45 to 54 Years | 27 (100.0%) | 0 (0.0%) |
| 55 to 59 Years | 0 (0.0%) | 0 (0.0%) |
| 60 to 64 Years | 43 (67.2%) | 0 (0.0%) |
| 65 to 74 Years | 14 (23.0%) | 0 (0.0%) |
| 75 Years and over | 0 (0.0%) | 0 (0.0%) |
| Total | 235 (73.4%) | 0 (0.0%) |
Employment Status by Educational Attainment in Collins
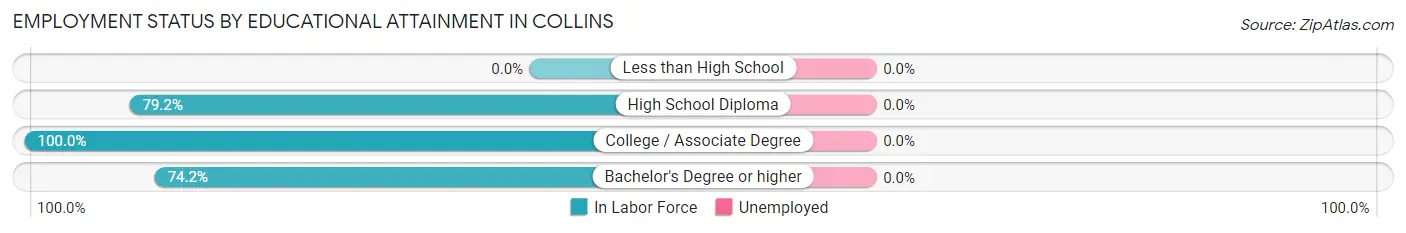
| Educational Attainment | In Labor Force | Unemployed |
| Less than High School | 0 (0.0%) | 0 (0.0%) |
| High School Diploma | 80 (79.2%) | 0 (0.0%) |
| College / Associate Degree | 67 (100.0%) | 0 (0.0%) |
| Bachelor's Degree or higher | 49 (74.2%) | 0 (0.0%) |
| Total | 196 (83.8%) | 0 (0.0%) |
Employment Occupations by Sex in Collins
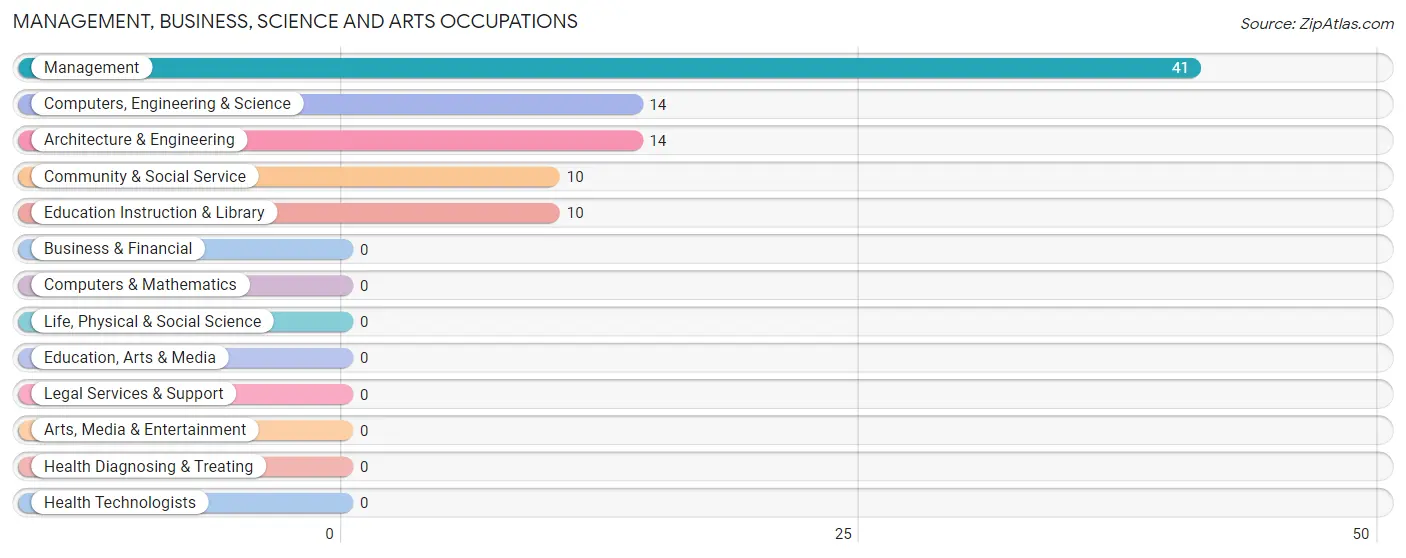
Management, Business, Science and Arts Occupations
The most common Management, Business, Science and Arts occupations in Collins are Management (41 | 17.4%), Computers, Engineering & Science (14 | 6.0%), Architecture & Engineering (14 | 6.0%), Community & Social Service (10 | 4.3%), and Education Instruction & Library (10 | 4.3%).
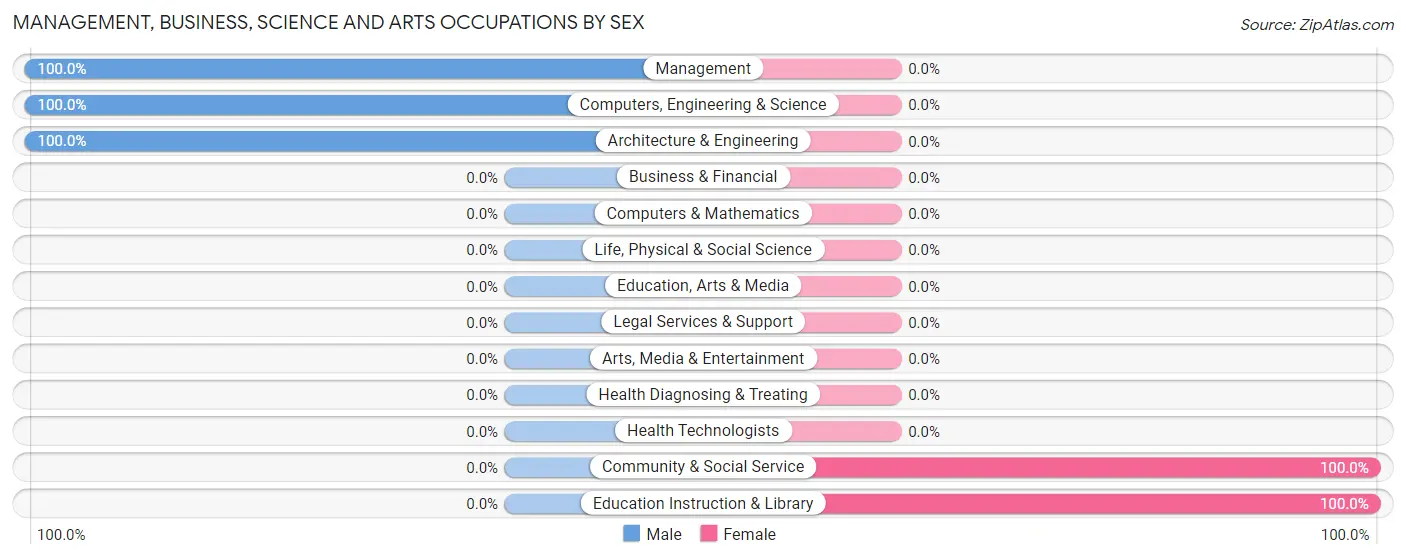
Management, Business, Science and Arts Occupations by Sex
Within the Management, Business, Science and Arts occupations in Collins, the most male-oriented occupations are Management (100.0%), Computers, Engineering & Science (100.0%), and Architecture & Engineering (100.0%), while the most female-oriented occupations are Community & Social Service (100.0%), and Education Instruction & Library (100.0%).
| Occupation | Male | Female |
| Management | 41 (100.0%) | 0 (0.0%) |
| Business & Financial | 0 (0.0%) | 0 (0.0%) |
| Computers, Engineering & Science | 14 (100.0%) | 0 (0.0%) |
| Computers & Mathematics | 0 (0.0%) | 0 (0.0%) |
| Architecture & Engineering | 14 (100.0%) | 0 (0.0%) |
| Life, Physical & Social Science | 0 (0.0%) | 0 (0.0%) |
| Community & Social Service | 0 (0.0%) | 10 (100.0%) |
| Education, Arts & Media | 0 (0.0%) | 0 (0.0%) |
| Legal Services & Support | 0 (0.0%) | 0 (0.0%) |
| Education Instruction & Library | 0 (0.0%) | 10 (100.0%) |
| Arts, Media & Entertainment | 0 (0.0%) | 0 (0.0%) |
| Health Diagnosing & Treating | 0 (0.0%) | 0 (0.0%) |
| Health Technologists | 0 (0.0%) | 0 (0.0%) |
| Total (Category) | 55 (84.6%) | 10 (15.4%) |
| Total (Overall) | 107 (45.5%) | 128 (54.5%) |
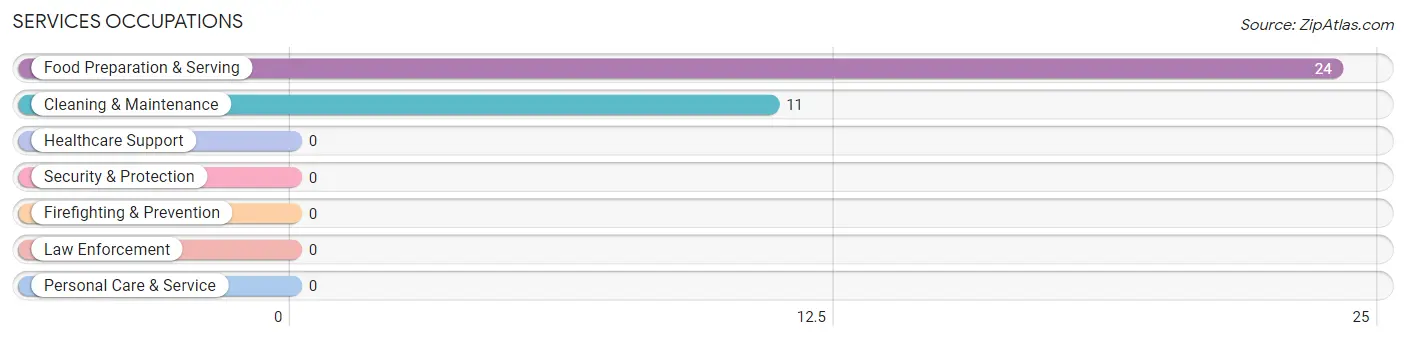
Services Occupations
The most common Services occupations in Collins are Food Preparation & Serving (24 | 10.2%), and Cleaning & Maintenance (11 | 4.7%).
Services Occupations by Sex
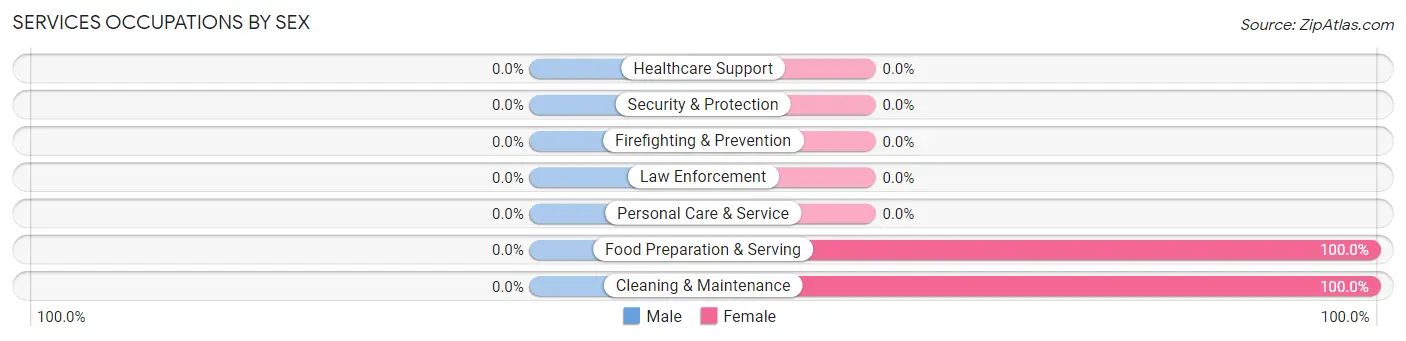
| Occupation | Male | Female |
| Healthcare Support | 0 (0.0%) | 0 (0.0%) |
| Security & Protection | 0 (0.0%) | 0 (0.0%) |
| Firefighting & Prevention | 0 (0.0%) | 0 (0.0%) |
| Law Enforcement | 0 (0.0%) | 0 (0.0%) |
| Food Preparation & Serving | 0 (0.0%) | 24 (100.0%) |
| Cleaning & Maintenance | 0 (0.0%) | 11 (100.0%) |
| Personal Care & Service | 0 (0.0%) | 0 (0.0%) |
| Total (Category) | 0 (0.0%) | 35 (100.0%) |
| Total (Overall) | 107 (45.5%) | 128 (54.5%) |
Sales and Office Occupations
The most common Sales and Office occupations in Collins are Sales & Related (27 | 11.5%), and Office & Administration (27 | 11.5%).
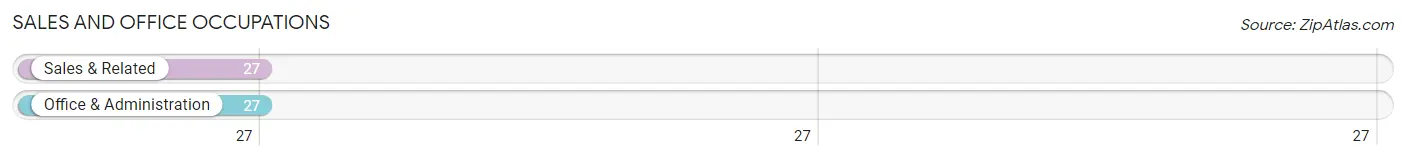
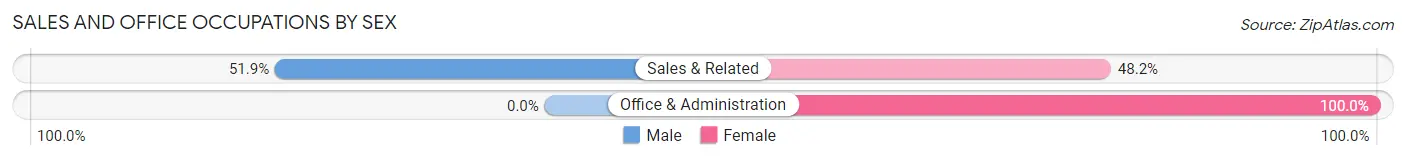
Sales and Office Occupations by Sex
| Occupation | Male | Female |
| Sales & Related | 14 (51.8%) | 13 (48.1%) |
| Office & Administration | 0 (0.0%) | 27 (100.0%) |
| Total (Category) | 14 (25.9%) | 40 (74.1%) |
| Total (Overall) | 107 (45.5%) | 128 (54.5%) |
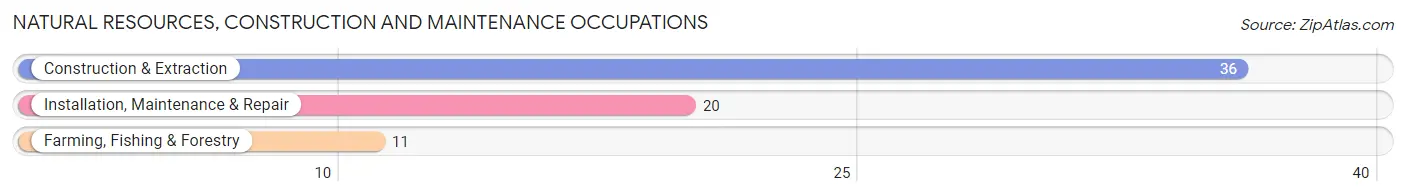
Natural Resources, Construction and Maintenance Occupations
The most common Natural Resources, Construction and Maintenance occupations in Collins are Construction & Extraction (36 | 15.3%), Installation, Maintenance & Repair (20 | 8.5%), and Farming, Fishing & Forestry (11 | 4.7%).
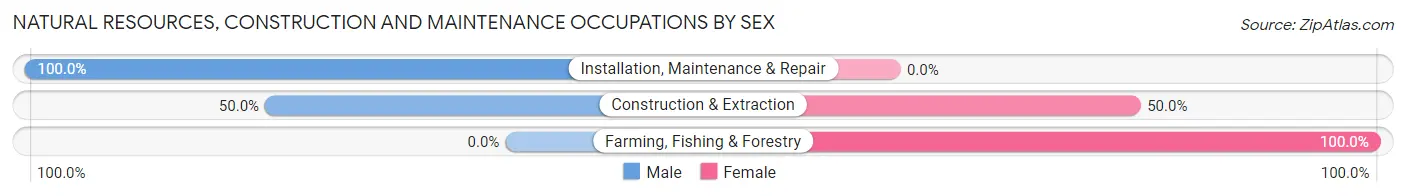
Natural Resources, Construction and Maintenance Occupations by Sex
| Occupation | Male | Female |
| Farming, Fishing & Forestry | 0 (0.0%) | 11 (100.0%) |
| Construction & Extraction | 18 (50.0%) | 18 (50.0%) |
| Installation, Maintenance & Repair | 20 (100.0%) | 0 (0.0%) |
| Total (Category) | 38 (56.7%) | 29 (43.3%) |
| Total (Overall) | 107 (45.5%) | 128 (54.5%) |
Production, Transportation and Moving Occupations
The most common Production, Transportation and Moving occupations in Collins are , and Production (14 | 6.0%).
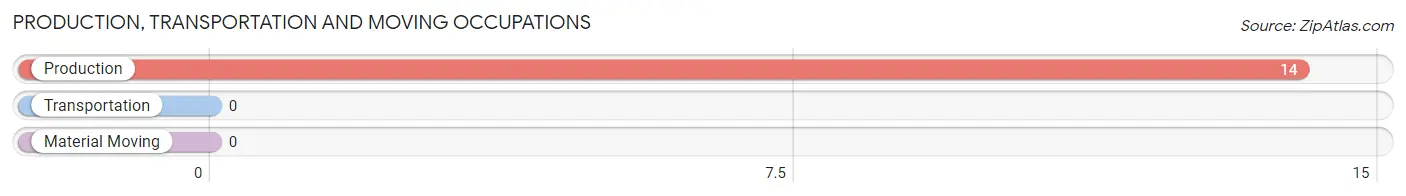
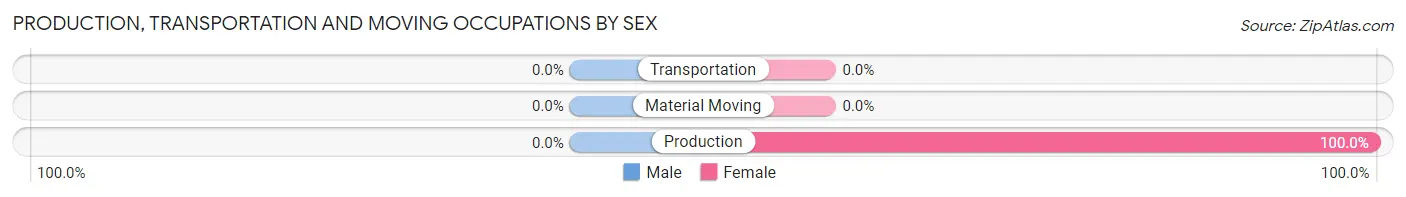
Production, Transportation and Moving Occupations by Sex
| Occupation | Male | Female |
| Production | 0 (0.0%) | 14 (100.0%) |
| Transportation | 0 (0.0%) | 0 (0.0%) |
| Material Moving | 0 (0.0%) | 0 (0.0%) |
| Total (Category) | 0 (0.0%) | 14 (100.0%) |
| Total (Overall) | 107 (45.5%) | 128 (54.5%) |
Employment Industries by Sex in Collins
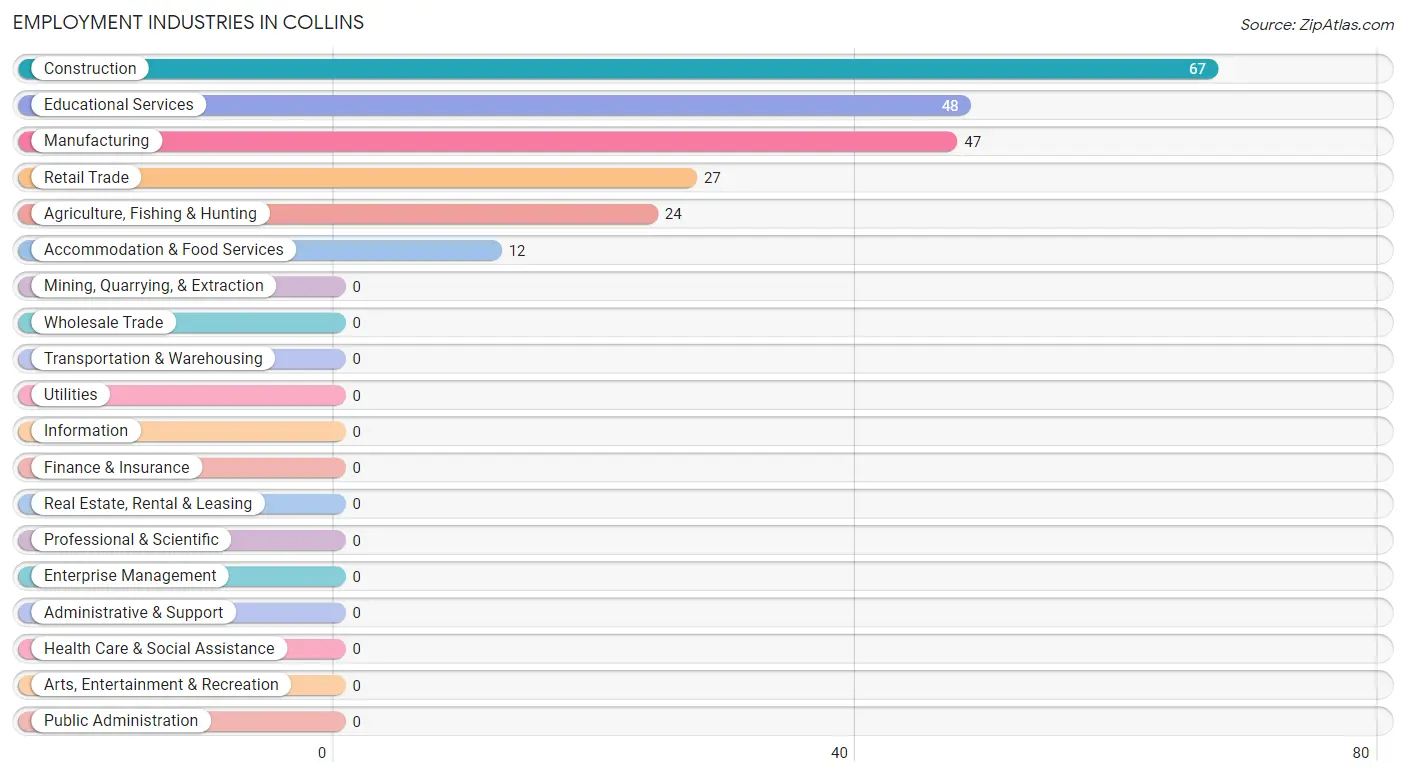
Employment Industries in Collins
The major employment industries in Collins include Construction (67 | 28.5%), Educational Services (48 | 20.4%), Manufacturing (47 | 20.0%), Retail Trade (27 | 11.5%), and Agriculture, Fishing & Hunting (24 | 10.2%).
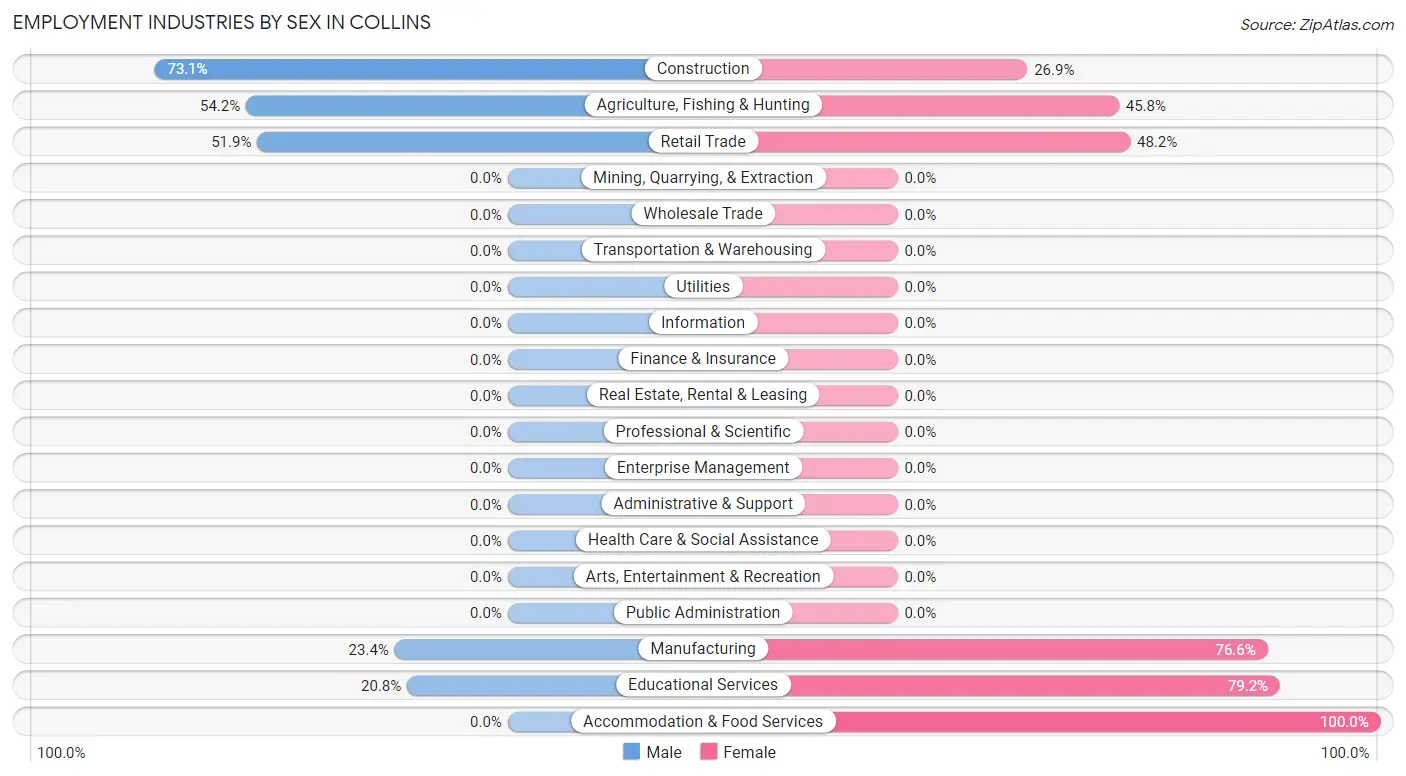
Employment Industries by Sex in Collins
The Collins industries that see more men than women are Construction (73.1%), Agriculture, Fishing & Hunting (54.2%), and Retail Trade (51.8%), whereas the industries that tend to have a higher number of women are Accommodation & Food Services (100.0%), Educational Services (79.2%), and Manufacturing (76.6%).
| Industry | Male | Female |
| Agriculture, Fishing & Hunting | 13 (54.2%) | 11 (45.8%) |
| Mining, Quarrying, & Extraction | 0 (0.0%) | 0 (0.0%) |
| Construction | 49 (73.1%) | 18 (26.9%) |
| Manufacturing | 11 (23.4%) | 36 (76.6%) |
| Wholesale Trade | 0 (0.0%) | 0 (0.0%) |
| Retail Trade | 14 (51.8%) | 13 (48.1%) |
| Transportation & Warehousing | 0 (0.0%) | 0 (0.0%) |
| Utilities | 0 (0.0%) | 0 (0.0%) |
| Information | 0 (0.0%) | 0 (0.0%) |
| Finance & Insurance | 0 (0.0%) | 0 (0.0%) |
| Real Estate, Rental & Leasing | 0 (0.0%) | 0 (0.0%) |
| Professional & Scientific | 0 (0.0%) | 0 (0.0%) |
| Enterprise Management | 0 (0.0%) | 0 (0.0%) |
| Administrative & Support | 0 (0.0%) | 0 (0.0%) |
| Educational Services | 10 (20.8%) | 38 (79.2%) |
| Health Care & Social Assistance | 0 (0.0%) | 0 (0.0%) |
| Arts, Entertainment & Recreation | 0 (0.0%) | 0 (0.0%) |
| Accommodation & Food Services | 0 (0.0%) | 12 (100.0%) |
| Public Administration | 0 (0.0%) | 0 (0.0%) |
| Total | 107 (45.5%) | 128 (54.5%) |
Education in Collins
School Enrollment in Collins
The most common levels of schooling among the 117 students in Collins are elementary school (53 | 45.3%), nursery / preschool (39 | 33.3%), and high school (25 | 21.4%).
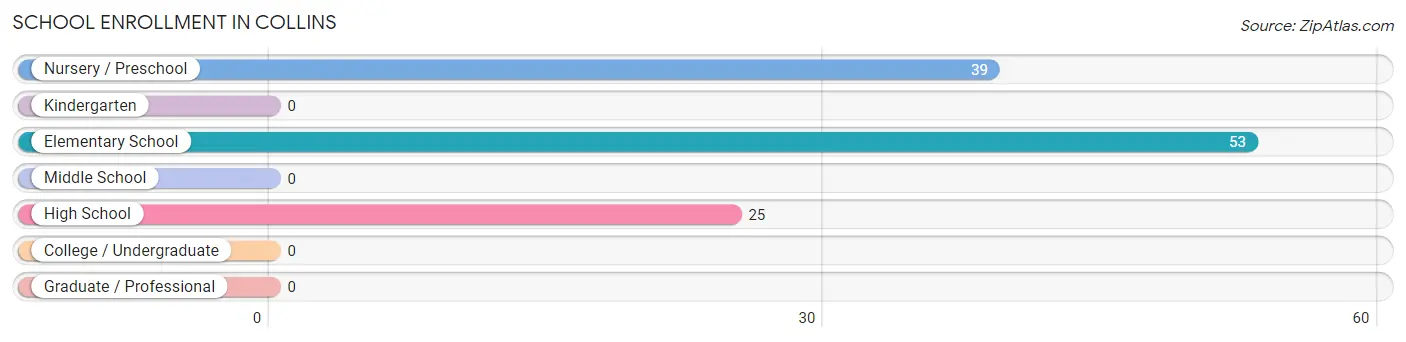
| School Level | # Students | % Students |
| Nursery / Preschool | 39 | 33.3% |
| Kindergarten | 0 | 0.0% |
| Elementary School | 53 | 45.3% |
| Middle School | 0 | 0.0% |
| High School | 25 | 21.4% |
| College / Undergraduate | 0 | 0.0% |
| Graduate / Professional | 0 | 0.0% |
| Total | 117 | 100.0% |
School Enrollment by Age by Funding Source in Collins
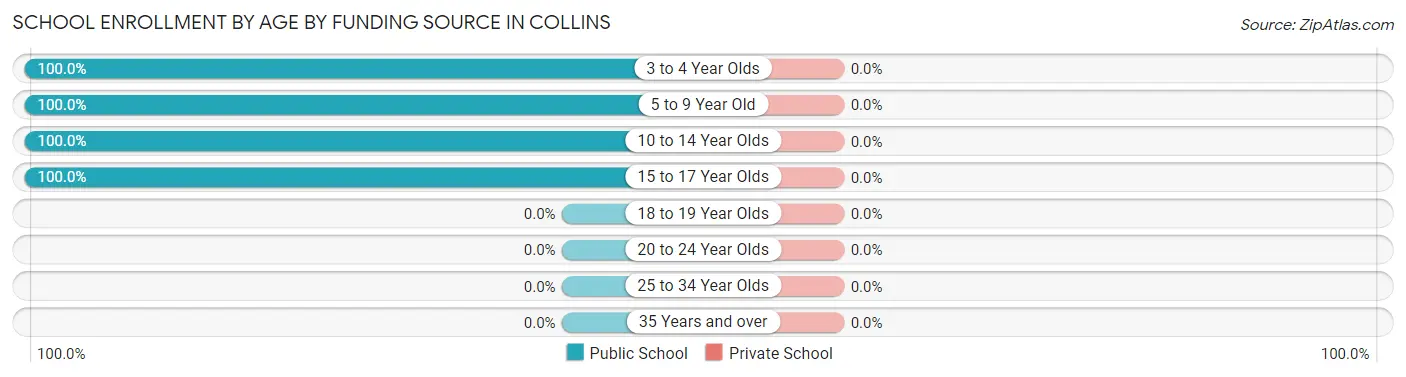
| Age Bracket | Public School | Private School |
| 3 to 4 Year Olds | 21 (100.0%) | 0 (0.0%) |
| 5 to 9 Year Old | 40 (100.0%) | 0 (0.0%) |
| 10 to 14 Year Olds | 31 (100.0%) | 0 (0.0%) |
| 15 to 17 Year Olds | 25 (100.0%) | 0 (0.0%) |
| 18 to 19 Year Olds | 0 (0.0%) | 0 (0.0%) |
| 20 to 24 Year Olds | 0 (0.0%) | 0 (0.0%) |
| 25 to 34 Year Olds | 0 (0.0%) | 0 (0.0%) |
| 35 Years and over | 0 (0.0%) | 0 (0.0%) |
| Total | 117 (100.0%) | 0 (0.0%) |
Educational Attainment by Field of Study in Collins
Bio, nature & agricultural (17 | 25.8%), arts & humanities (17 | 25.8%), engineering (11 | 16.7%), business (11 | 16.7%), and education (10 | 15.1%) are the most common fields of study among 66 individuals in Collins who have obtained a bachelor's degree or higher.
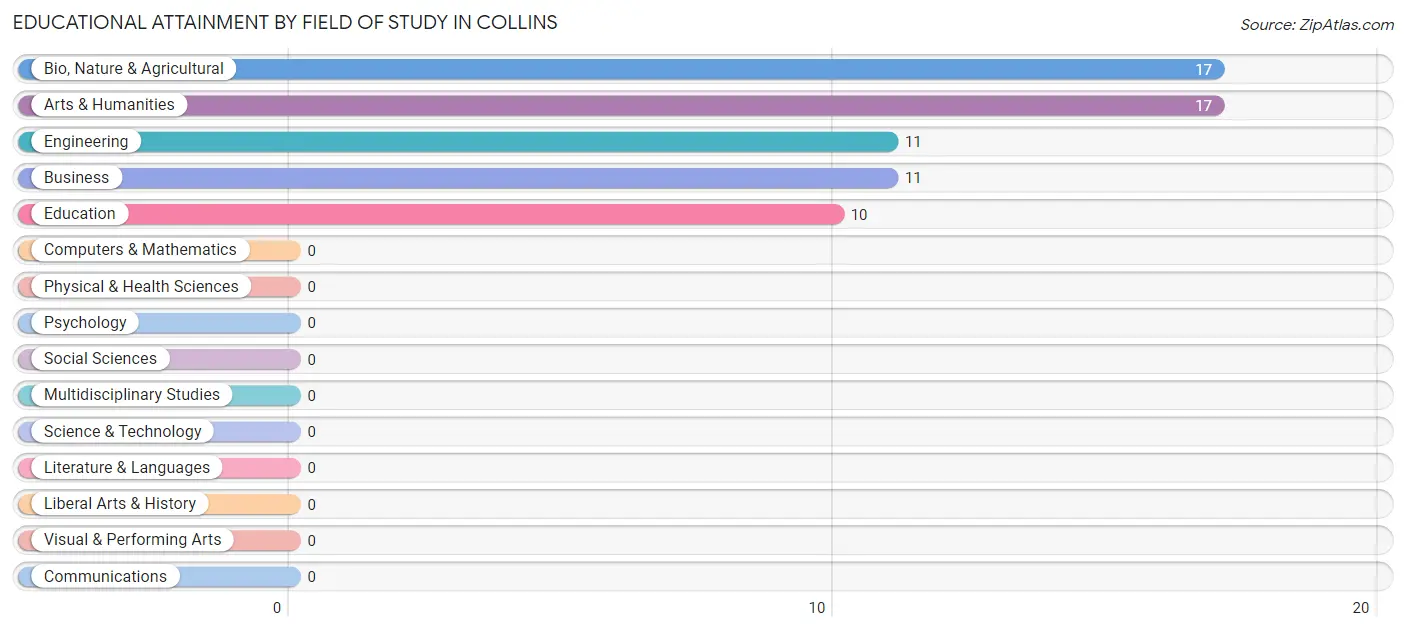
| Field of Study | # Graduates | % Graduates |
| Computers & Mathematics | 0 | 0.0% |
| Bio, Nature & Agricultural | 17 | 25.8% |
| Physical & Health Sciences | 0 | 0.0% |
| Psychology | 0 | 0.0% |
| Social Sciences | 0 | 0.0% |
| Engineering | 11 | 16.7% |
| Multidisciplinary Studies | 0 | 0.0% |
| Science & Technology | 0 | 0.0% |
| Business | 11 | 16.7% |
| Education | 10 | 15.1% |
| Literature & Languages | 0 | 0.0% |
| Liberal Arts & History | 0 | 0.0% |
| Visual & Performing Arts | 0 | 0.0% |
| Communications | 0 | 0.0% |
| Arts & Humanities | 17 | 25.8% |
| Total | 66 | 100.0% |
Transportation & Commute in Collins
Vehicle Availability by Sex in Collins
The most prevalent vehicle ownership categories in Collins are males with 3 vehicles (51, accounting for 47.7%) and females with 3 vehicles (58, making up 39.8%).
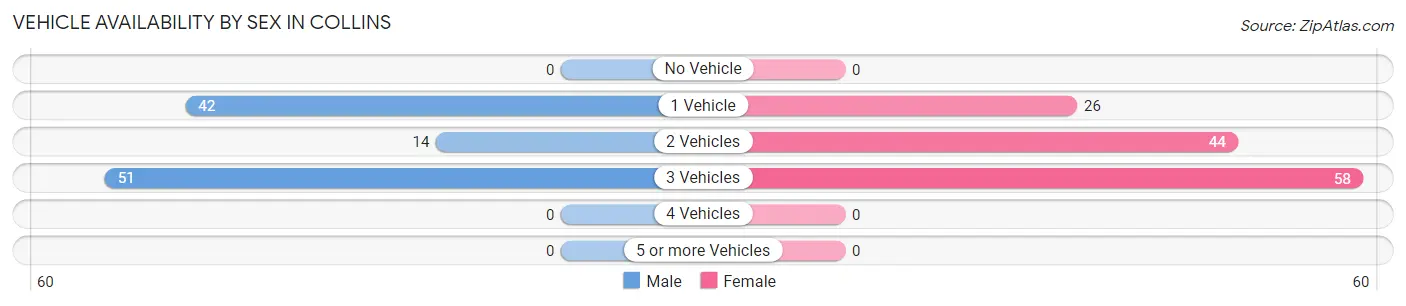
| Vehicles Available | Male | Female |
| No Vehicle | 0 (0.0%) | 0 (0.0%) |
| 1 Vehicle | 42 (39.3%) | 26 (20.3%) |
| 2 Vehicles | 14 (13.1%) | 44 (34.4%) |
| 3 Vehicles | 51 (47.7%) | 58 (45.3%) |
| 4 Vehicles | 0 (0.0%) | 0 (0.0%) |
| 5 or more Vehicles | 0 (0.0%) | 0 (0.0%) |
| Total | 107 (100.0%) | 128 (100.0%) |
Commute Time in Collins
The most frequently occuring commute durations in Collins are 20 to 24 minutes (59 commuters, 25.1%), 30 to 34 minutes (47 commuters, 20.0%), and 5 to 9 minutes (42 commuters, 17.9%).
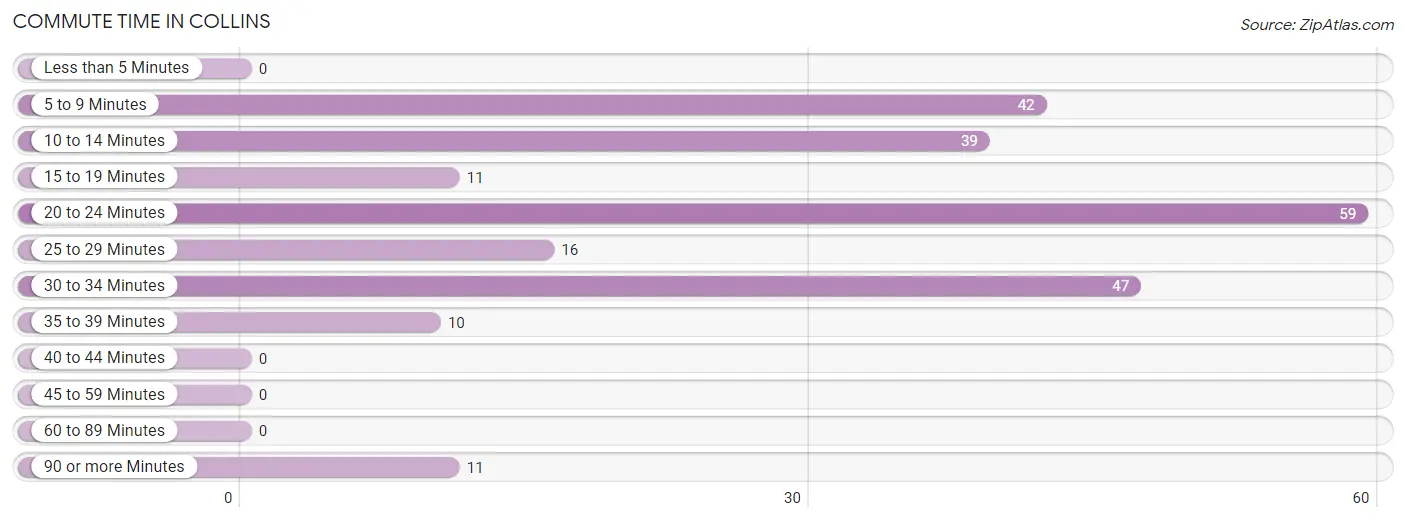
| Commute Time | # Commuters | % Commuters |
| Less than 5 Minutes | 0 | 0.0% |
| 5 to 9 Minutes | 42 | 17.9% |
| 10 to 14 Minutes | 39 | 16.6% |
| 15 to 19 Minutes | 11 | 4.7% |
| 20 to 24 Minutes | 59 | 25.1% |
| 25 to 29 Minutes | 16 | 6.8% |
| 30 to 34 Minutes | 47 | 20.0% |
| 35 to 39 Minutes | 10 | 4.3% |
| 40 to 44 Minutes | 0 | 0.0% |
| 45 to 59 Minutes | 0 | 0.0% |
| 60 to 89 Minutes | 0 | 0.0% |
| 90 or more Minutes | 11 | 4.7% |
Commute Time by Sex in Collins
The most common commute times in Collins are 20 to 24 minutes (59 commuters, 55.1%) for males and 30 to 34 minutes (36 commuters, 28.1%) for females.
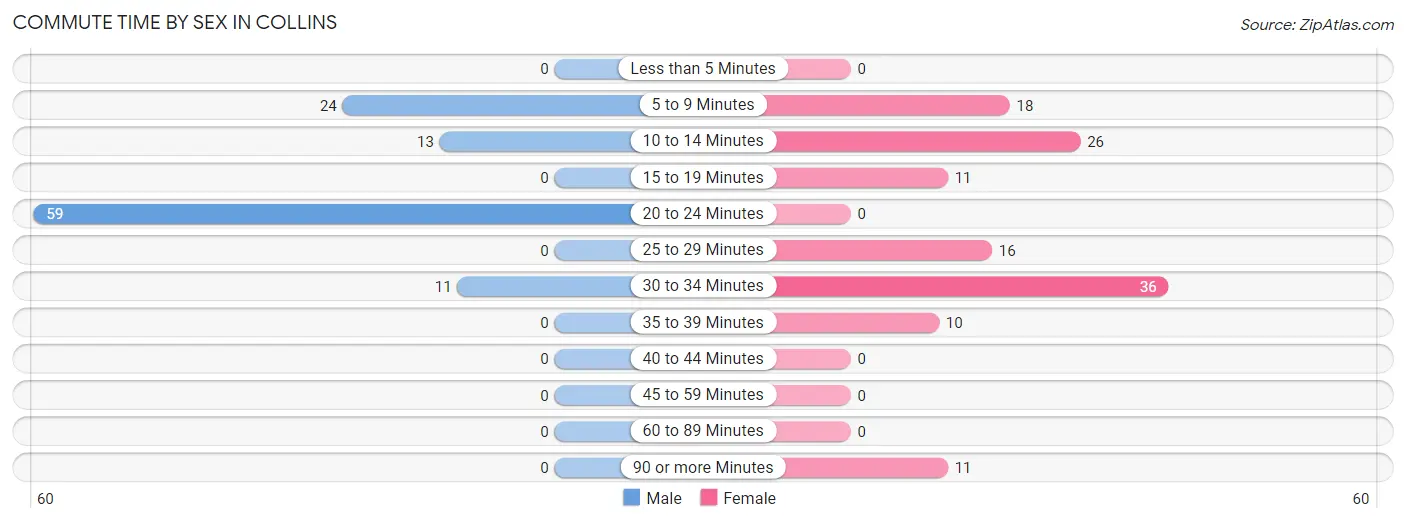
| Commute Time | Male | Female |
| Less than 5 Minutes | 0 (0.0%) | 0 (0.0%) |
| 5 to 9 Minutes | 24 (22.4%) | 18 (14.1%) |
| 10 to 14 Minutes | 13 (12.1%) | 26 (20.3%) |
| 15 to 19 Minutes | 0 (0.0%) | 11 (8.6%) |
| 20 to 24 Minutes | 59 (55.1%) | 0 (0.0%) |
| 25 to 29 Minutes | 0 (0.0%) | 16 (12.5%) |
| 30 to 34 Minutes | 11 (10.3%) | 36 (28.1%) |
| 35 to 39 Minutes | 0 (0.0%) | 10 (7.8%) |
| 40 to 44 Minutes | 0 (0.0%) | 0 (0.0%) |
| 45 to 59 Minutes | 0 (0.0%) | 0 (0.0%) |
| 60 to 89 Minutes | 0 (0.0%) | 0 (0.0%) |
| 90 or more Minutes | 0 (0.0%) | 11 (8.6%) |
Time of Departure to Work by Sex in Collins
The most frequent times of departure to work in Collins are 5:00 AM to 5:29 AM (41, 38.3%) for males and 6:30 AM to 6:59 AM (35, 27.3%) for females.
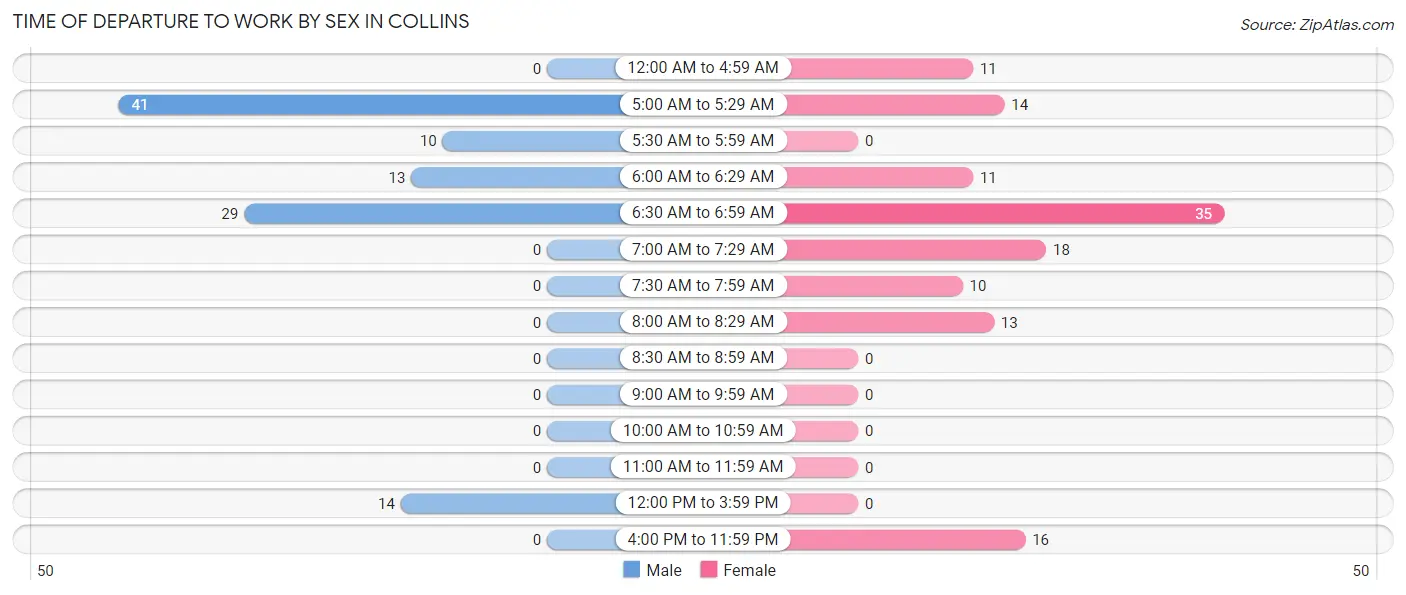
| Time of Departure | Male | Female |
| 12:00 AM to 4:59 AM | 0 (0.0%) | 11 (8.6%) |
| 5:00 AM to 5:29 AM | 41 (38.3%) | 14 (10.9%) |
| 5:30 AM to 5:59 AM | 10 (9.3%) | 0 (0.0%) |
| 6:00 AM to 6:29 AM | 13 (12.1%) | 11 (8.6%) |
| 6:30 AM to 6:59 AM | 29 (27.1%) | 35 (27.3%) |
| 7:00 AM to 7:29 AM | 0 (0.0%) | 18 (14.1%) |
| 7:30 AM to 7:59 AM | 0 (0.0%) | 10 (7.8%) |
| 8:00 AM to 8:29 AM | 0 (0.0%) | 13 (10.2%) |
| 8:30 AM to 8:59 AM | 0 (0.0%) | 0 (0.0%) |
| 9:00 AM to 9:59 AM | 0 (0.0%) | 0 (0.0%) |
| 10:00 AM to 10:59 AM | 0 (0.0%) | 0 (0.0%) |
| 11:00 AM to 11:59 AM | 0 (0.0%) | 0 (0.0%) |
| 12:00 PM to 3:59 PM | 14 (13.1%) | 0 (0.0%) |
| 4:00 PM to 11:59 PM | 0 (0.0%) | 16 (12.5%) |
| Total | 107 (100.0%) | 128 (100.0%) |
Housing Occupancy in Collins
Occupancy by Ownership in Collins
Of the total 142 dwellings in Collins, owner-occupied units account for 132 (93.0%), while renter-occupied units make up 10 (7.0%).
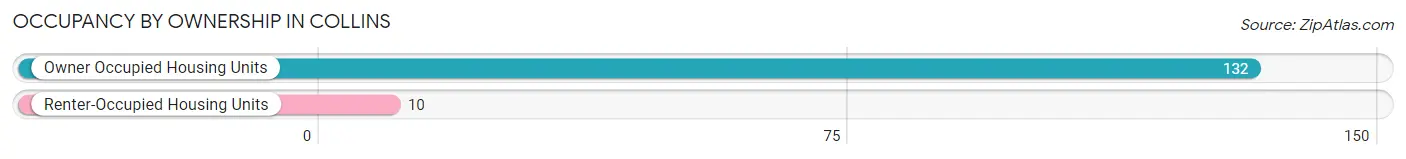
| Occupancy | # Housing Units | % Housing Units |
| Owner Occupied Housing Units | 132 | 93.0% |
| Renter-Occupied Housing Units | 10 | 7.0% |
| Total Occupied Housing Units | 142 | 100.0% |
Occupancy by Household Size in Collins
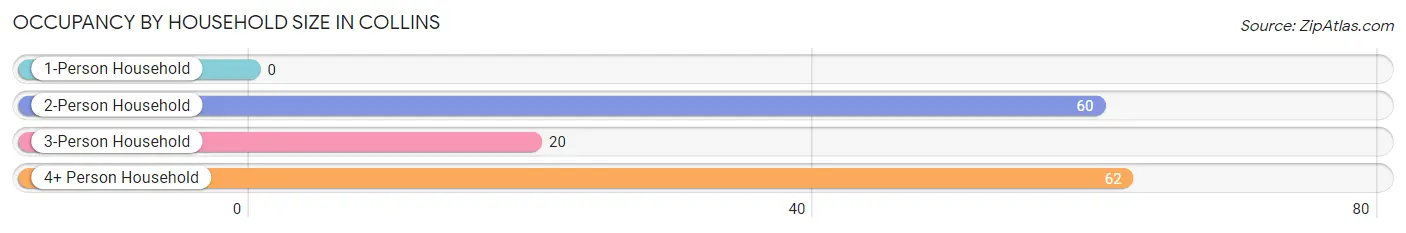
| Household Size | # Housing Units | % Housing Units |
| 1-Person Household | 0 | 0.0% |
| 2-Person Household | 60 | 42.2% |
| 3-Person Household | 20 | 14.1% |
| 4+ Person Household | 62 | 43.7% |
| Total Housing Units | 142 | 100.0% |
Occupancy by Ownership by Household Size in Collins
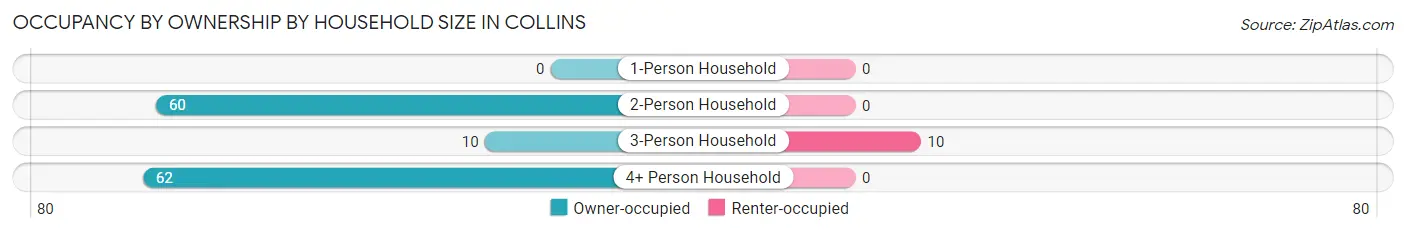
| Household Size | Owner-occupied | Renter-occupied |
| 1-Person Household | 0 (0.0%) | 0 (0.0%) |
| 2-Person Household | 60 (100.0%) | 0 (0.0%) |
| 3-Person Household | 10 (50.0%) | 10 (50.0%) |
| 4+ Person Household | 62 (100.0%) | 0 (0.0%) |
| Total Housing Units | 132 (93.0%) | 10 (7.0%) |
Occupancy by Educational Attainment in Collins
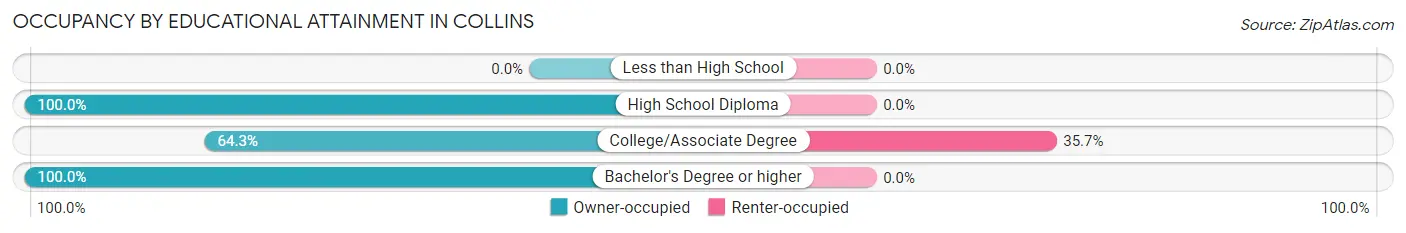
| Household Size | Owner-occupied | Renter-occupied |
| Less than High School | 0 (0.0%) | 0 (0.0%) |
| High School Diploma | 76 (100.0%) | 0 (0.0%) |
| College/Associate Degree | 18 (64.3%) | 10 (35.7%) |
| Bachelor's Degree or higher | 38 (100.0%) | 0 (0.0%) |
Occupancy by Age of Householder in Collins
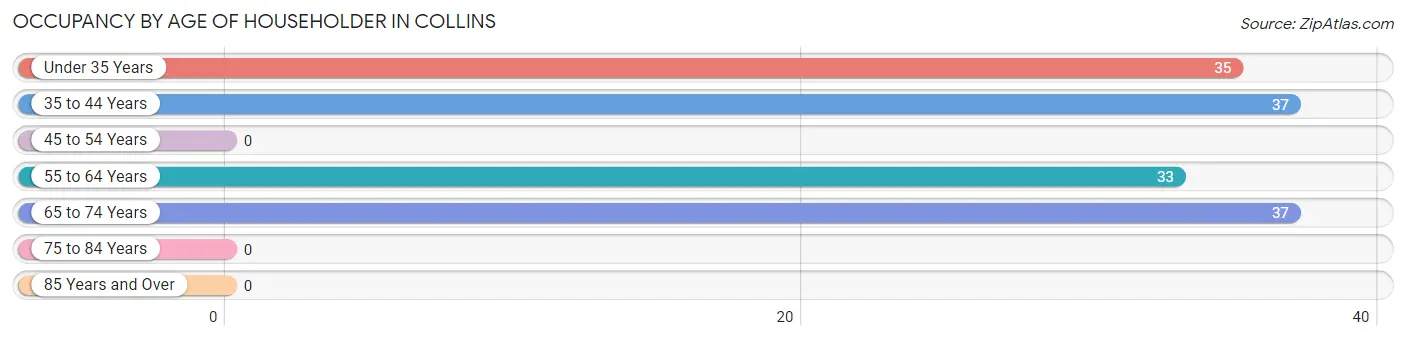
| Age Bracket | # Households | % Households |
| Under 35 Years | 35 | 24.6% |
| 35 to 44 Years | 37 | 26.1% |
| 45 to 54 Years | 0 | 0.0% |
| 55 to 64 Years | 33 | 23.2% |
| 65 to 74 Years | 37 | 26.1% |
| 75 to 84 Years | 0 | 0.0% |
| 85 Years and Over | 0 | 0.0% |
| Total | 142 | 100.0% |
Housing Finances in Collins
Median Income by Occupancy in Collins
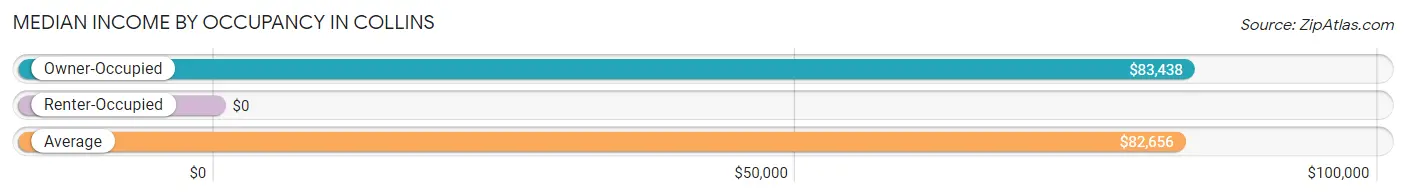
| Occupancy Type | # Households | Median Income |
| Owner-Occupied | 132 (93.0%) | $83,438 |
| Renter-Occupied | 10 (7.0%) | $0 |
| Average | 142 (100.0%) | $82,656 |
Occupancy by Householder Income Bracket in Collins
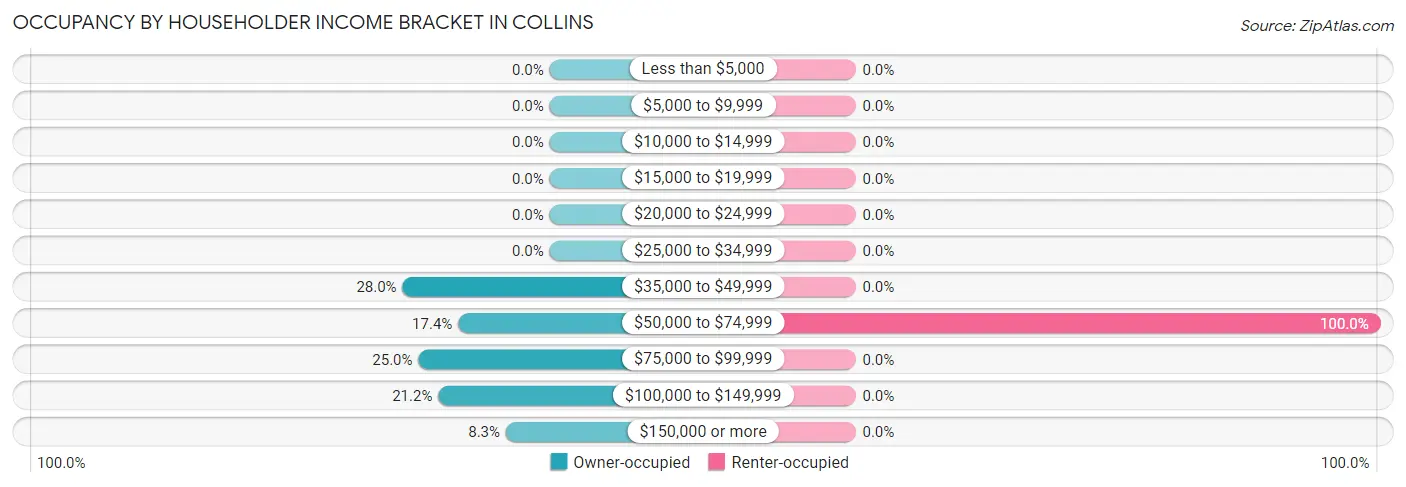
| Income Bracket | Owner-occupied | Renter-occupied |
| Less than $5,000 | 0 (0.0%) | 0 (0.0%) |
| $5,000 to $9,999 | 0 (0.0%) | 0 (0.0%) |
| $10,000 to $14,999 | 0 (0.0%) | 0 (0.0%) |
| $15,000 to $19,999 | 0 (0.0%) | 0 (0.0%) |
| $20,000 to $24,999 | 0 (0.0%) | 0 (0.0%) |
| $25,000 to $34,999 | 0 (0.0%) | 0 (0.0%) |
| $35,000 to $49,999 | 37 (28.0%) | 0 (0.0%) |
| $50,000 to $74,999 | 23 (17.4%) | 10 (100.0%) |
| $75,000 to $99,999 | 33 (25.0%) | 0 (0.0%) |
| $100,000 to $149,999 | 28 (21.2%) | 0 (0.0%) |
| $150,000 or more | 11 (8.3%) | 0 (0.0%) |
| Total | 132 (100.0%) | 10 (100.0%) |
Monthly Housing Cost Tiers in Collins
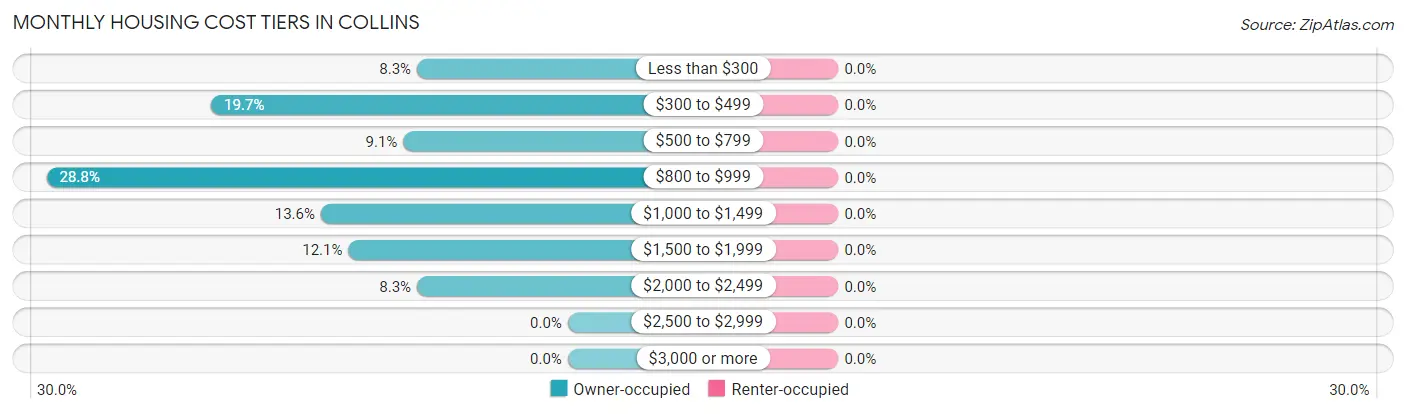
| Monthly Cost | Owner-occupied | Renter-occupied |
| Less than $300 | 11 (8.3%) | 0 (0.0%) |
| $300 to $499 | 26 (19.7%) | 0 (0.0%) |
| $500 to $799 | 12 (9.1%) | 0 (0.0%) |
| $800 to $999 | 38 (28.8%) | 0 (0.0%) |
| $1,000 to $1,499 | 18 (13.6%) | 0 (0.0%) |
| $1,500 to $1,999 | 16 (12.1%) | 0 (0.0%) |
| $2,000 to $2,499 | 11 (8.3%) | 0 (0.0%) |
| $2,500 to $2,999 | 0 (0.0%) | 0 (0.0%) |
| $3,000 or more | 0 (0.0%) | 0 (0.0%) |
| Total | 132 (100.0%) | 10 (100.0%) |
Physical Housing Characteristics in Collins
Housing Structures in Collins
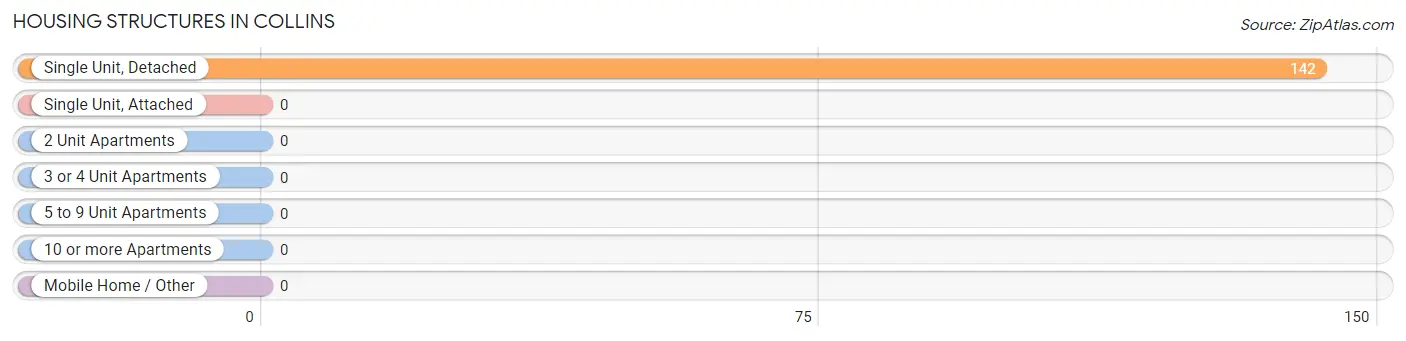
| Structure Type | # Housing Units | % Housing Units |
| Single Unit, Detached | 142 | 100.0% |
| Single Unit, Attached | 0 | 0.0% |
| 2 Unit Apartments | 0 | 0.0% |
| 3 or 4 Unit Apartments | 0 | 0.0% |
| 5 to 9 Unit Apartments | 0 | 0.0% |
| 10 or more Apartments | 0 | 0.0% |
| Mobile Home / Other | 0 | 0.0% |
| Total | 142 | 100.0% |
Housing Structures by Occupancy in Collins
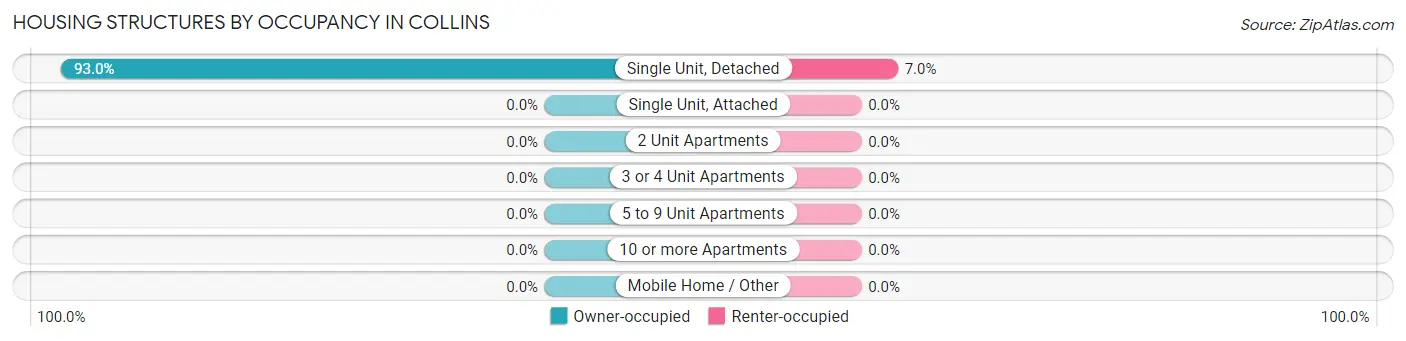
| Structure Type | Owner-occupied | Renter-occupied |
| Single Unit, Detached | 132 (93.0%) | 10 (7.0%) |
| Single Unit, Attached | 0 (0.0%) | 0 (0.0%) |
| 2 Unit Apartments | 0 (0.0%) | 0 (0.0%) |
| 3 or 4 Unit Apartments | 0 (0.0%) | 0 (0.0%) |
| 5 to 9 Unit Apartments | 0 (0.0%) | 0 (0.0%) |
| 10 or more Apartments | 0 (0.0%) | 0 (0.0%) |
| Mobile Home / Other | 0 (0.0%) | 0 (0.0%) |
| Total | 132 (93.0%) | 10 (7.0%) |
Housing Structures by Number of Rooms in Collins
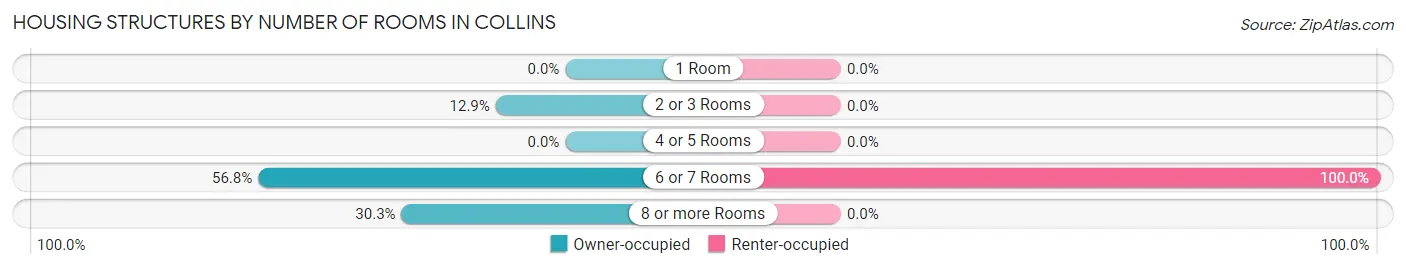
| Number of Rooms | Owner-occupied | Renter-occupied |
| 1 Room | 0 (0.0%) | 0 (0.0%) |
| 2 or 3 Rooms | 17 (12.9%) | 0 (0.0%) |
| 4 or 5 Rooms | 0 (0.0%) | 0 (0.0%) |
| 6 or 7 Rooms | 75 (56.8%) | 10 (100.0%) |
| 8 or more Rooms | 40 (30.3%) | 0 (0.0%) |
| Total | 132 (100.0%) | 10 (100.0%) |
Housing Structure by Heating Type in Collins
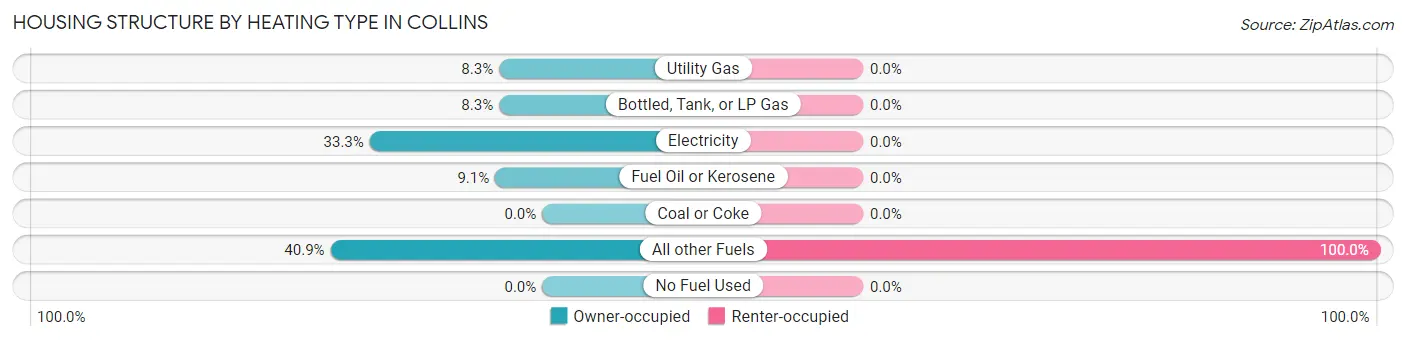
| Heating Type | Owner-occupied | Renter-occupied |
| Utility Gas | 11 (8.3%) | 0 (0.0%) |
| Bottled, Tank, or LP Gas | 11 (8.3%) | 0 (0.0%) |
| Electricity | 44 (33.3%) | 0 (0.0%) |
| Fuel Oil or Kerosene | 12 (9.1%) | 0 (0.0%) |
| Coal or Coke | 0 (0.0%) | 0 (0.0%) |
| All other Fuels | 54 (40.9%) | 10 (100.0%) |
| No Fuel Used | 0 (0.0%) | 0 (0.0%) |
| Total | 132 (100.0%) | 10 (100.0%) |
Household Vehicle Usage in Collins
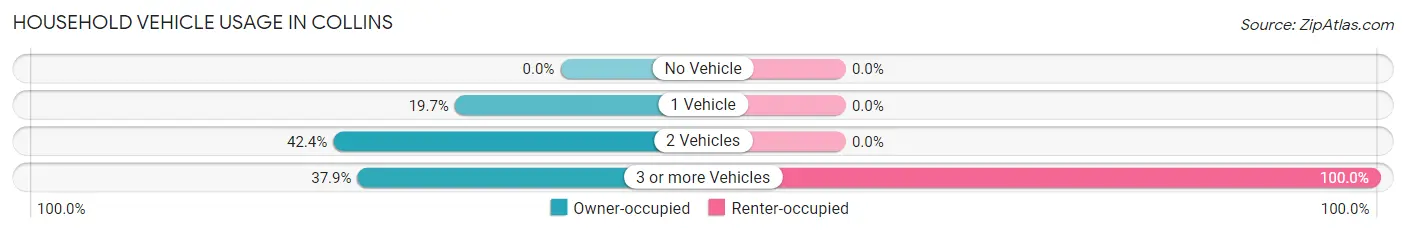
| Vehicles per Household | Owner-occupied | Renter-occupied |
| No Vehicle | 0 (0.0%) | 0 (0.0%) |
| 1 Vehicle | 26 (19.7%) | 0 (0.0%) |
| 2 Vehicles | 56 (42.4%) | 0 (0.0%) |
| 3 or more Vehicles | 50 (37.9%) | 10 (100.0%) |
| Total | 132 (100.0%) | 10 (100.0%) |
Real Estate & Mortgages in Collins
Real Estate and Mortgage Overview in Collins
| Characteristic | Without Mortgage | With Mortgage |
| Housing Units | 49 | 83 |
| Median Property Value | - | - |
| Median Household Income | $47,768 | $11 |
| Monthly Housing Costs | $411 | $0 |
| Real Estate Taxes | $1,760 | $0 |
Property Value by Mortgage Status in Collins
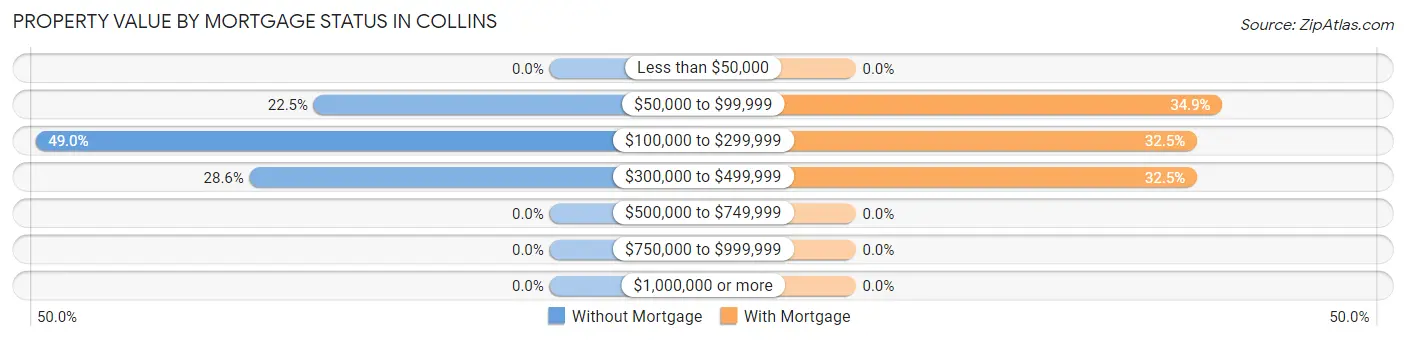
| Property Value | Without Mortgage | With Mortgage |
| Less than $50,000 | 0 (0.0%) | 0 (0.0%) |
| $50,000 to $99,999 | 11 (22.5%) | 29 (34.9%) |
| $100,000 to $299,999 | 24 (49.0%) | 27 (32.5%) |
| $300,000 to $499,999 | 14 (28.6%) | 27 (32.5%) |
| $500,000 to $749,999 | 0 (0.0%) | 0 (0.0%) |
| $750,000 to $999,999 | 0 (0.0%) | 0 (0.0%) |
| $1,000,000 or more | 0 (0.0%) | 0 (0.0%) |
| Total | 49 (100.0%) | 83 (100.0%) |
Household Income by Mortgage Status in Collins
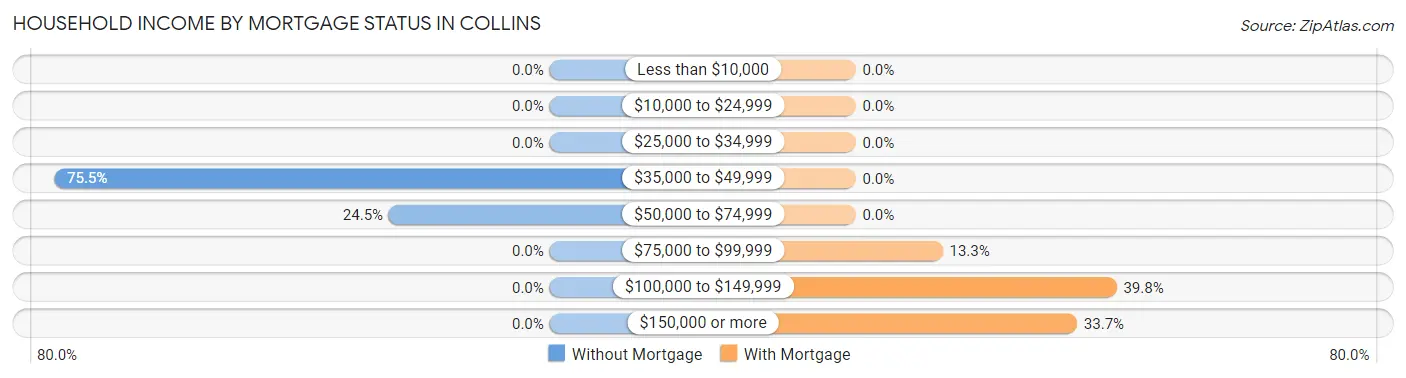
| Household Income | Without Mortgage | With Mortgage |
| Less than $10,000 | 0 (0.0%) | 0 (0.0%) |
| $10,000 to $24,999 | 0 (0.0%) | 0 (0.0%) |
| $25,000 to $34,999 | 0 (0.0%) | 0 (0.0%) |
| $35,000 to $49,999 | 37 (75.5%) | 0 (0.0%) |
| $50,000 to $74,999 | 12 (24.5%) | 0 (0.0%) |
| $75,000 to $99,999 | 0 (0.0%) | 11 (13.3%) |
| $100,000 to $149,999 | 0 (0.0%) | 33 (39.8%) |
| $150,000 or more | 0 (0.0%) | 28 (33.7%) |
| Total | 49 (100.0%) | 83 (100.0%) |
Property Value to Household Income Ratio in Collins
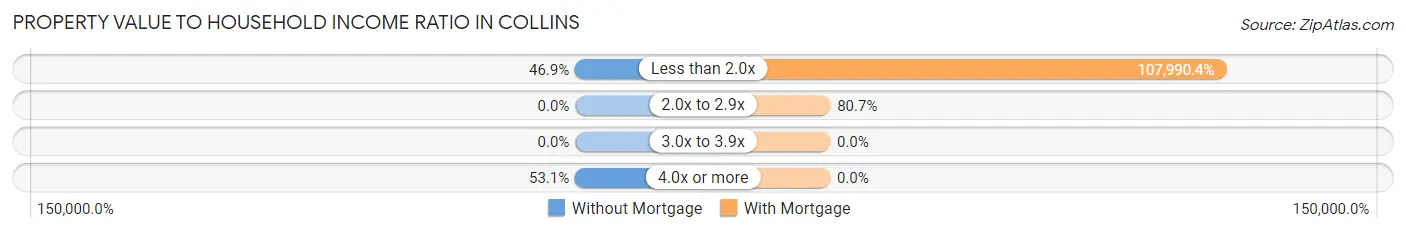
| Value-to-Income Ratio | Without Mortgage | With Mortgage |
| Less than 2.0x | 23 (46.9%) | 89,632 (107,990.4%) |
| 2.0x to 2.9x | 0 (0.0%) | 67 (80.7%) |
| 3.0x to 3.9x | 0 (0.0%) | 0 (0.0%) |
| 4.0x or more | 26 (53.1%) | 0 (0.0%) |
| Total | 49 (100.0%) | 83 (100.0%) |
Real Estate Taxes by Mortgage Status in Collins
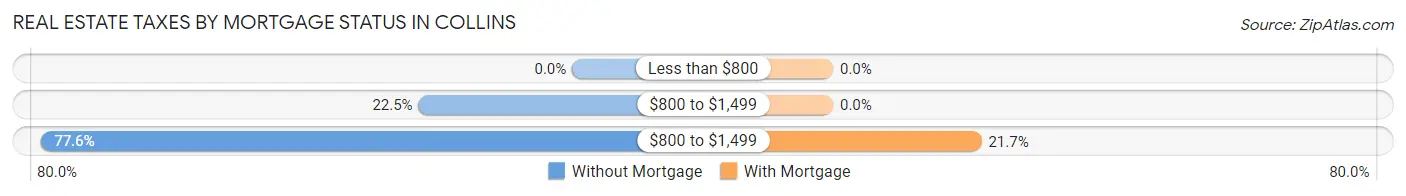
| Property Taxes | Without Mortgage | With Mortgage |
| Less than $800 | 0 (0.0%) | 0 (0.0%) |
| $800 to $1,499 | 11 (22.5%) | 0 (0.0%) |
| $800 to $1,499 | 38 (77.5%) | 18 (21.7%) |
| Total | 49 (100.0%) | 83 (100.0%) |
Health & Disability in Collins
Health Insurance Coverage by Age in Collins
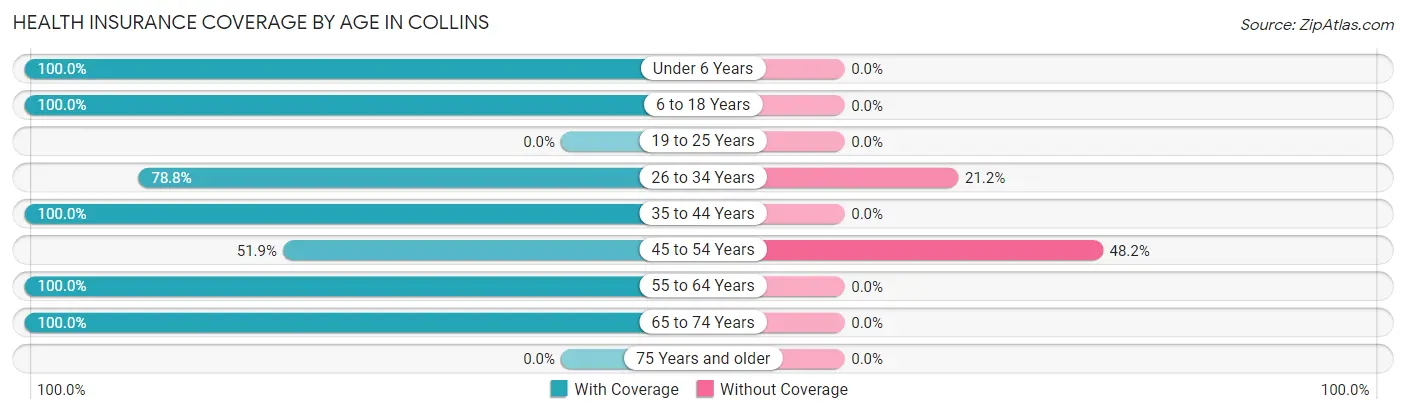
| Age Bracket | With Coverage | Without Coverage |
| Under 6 Years | 69 (100.0%) | 0 (0.0%) |
| 6 to 18 Years | 78 (100.0%) | 0 (0.0%) |
| 19 to 25 Years | 0 (0.0%) | 0 (0.0%) |
| 26 to 34 Years | 52 (78.8%) | 14 (21.2%) |
| 35 to 44 Years | 77 (100.0%) | 0 (0.0%) |
| 45 to 54 Years | 14 (51.8%) | 13 (48.1%) |
| 55 to 64 Years | 64 (100.0%) | 0 (0.0%) |
| 65 to 74 Years | 61 (100.0%) | 0 (0.0%) |
| 75 Years and older | 0 (0.0%) | 0 (0.0%) |
| Total | 415 (93.9%) | 27 (6.1%) |
Health Insurance Coverage by Citizenship Status in Collins
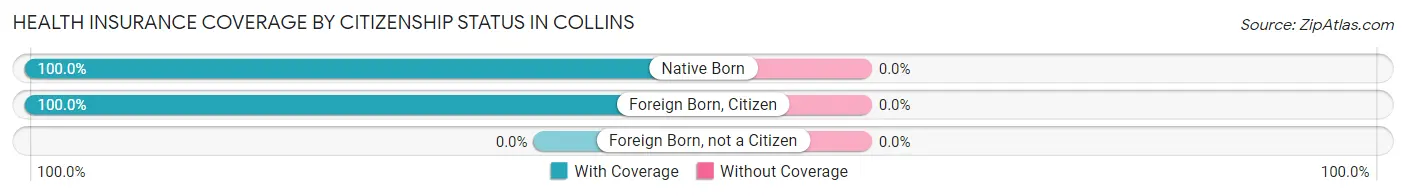
| Citizenship Status | With Coverage | Without Coverage |
| Native Born | 69 (100.0%) | 0 (0.0%) |
| Foreign Born, Citizen | 78 (100.0%) | 0 (0.0%) |
| Foreign Born, not a Citizen | 0 (0.0%) | 0 (0.0%) |
Health Insurance Coverage by Household Income in Collins
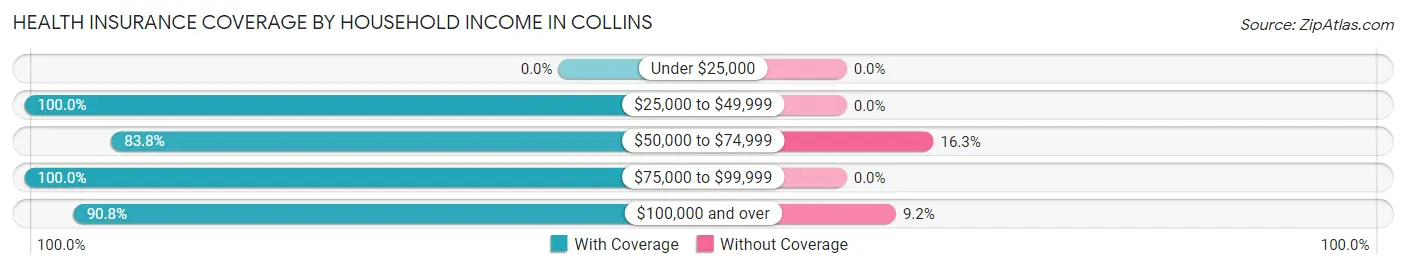
| Household Income | With Coverage | Without Coverage |
| Under $25,000 | 0 (0.0%) | 0 (0.0%) |
| $25,000 to $49,999 | 69 (100.0%) | 0 (0.0%) |
| $50,000 to $74,999 | 67 (83.8%) | 13 (16.3%) |
| $75,000 to $99,999 | 141 (100.0%) | 0 (0.0%) |
| $100,000 and over | 138 (90.8%) | 14 (9.2%) |
Public vs Private Health Insurance Coverage by Age in Collins
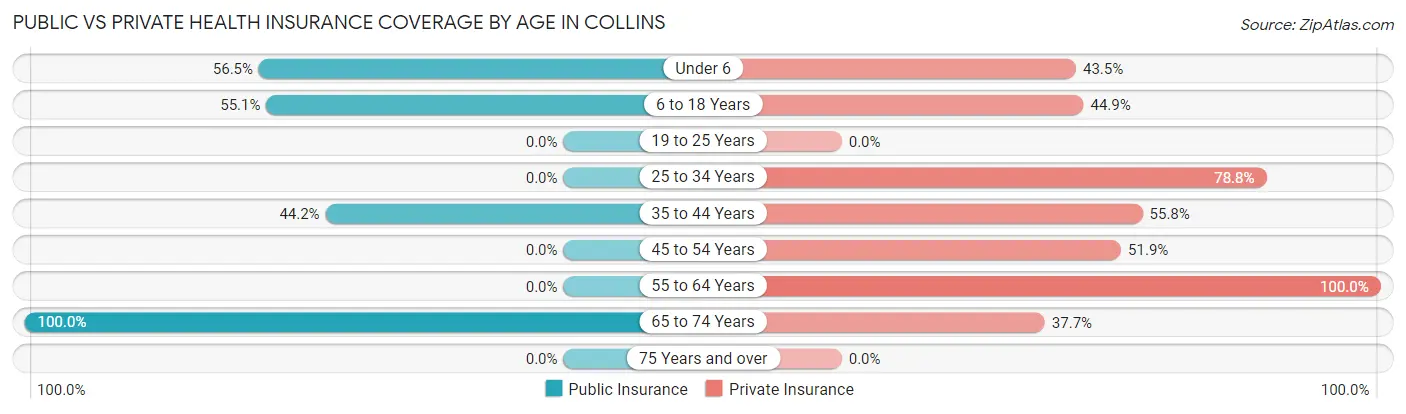
| Age Bracket | Public Insurance | Private Insurance |
| Under 6 | 39 (56.5%) | 30 (43.5%) |
| 6 to 18 Years | 43 (55.1%) | 35 (44.9%) |
| 19 to 25 Years | 0 (0.0%) | 0 (0.0%) |
| 25 to 34 Years | 0 (0.0%) | 52 (78.8%) |
| 35 to 44 Years | 34 (44.2%) | 43 (55.8%) |
| 45 to 54 Years | 0 (0.0%) | 14 (51.8%) |
| 55 to 64 Years | 0 (0.0%) | 64 (100.0%) |
| 65 to 74 Years | 61 (100.0%) | 23 (37.7%) |
| 75 Years and over | 0 (0.0%) | 0 (0.0%) |
| Total | 177 (40.1%) | 261 (59.1%) |
Disability Status by Sex by Age in Collins
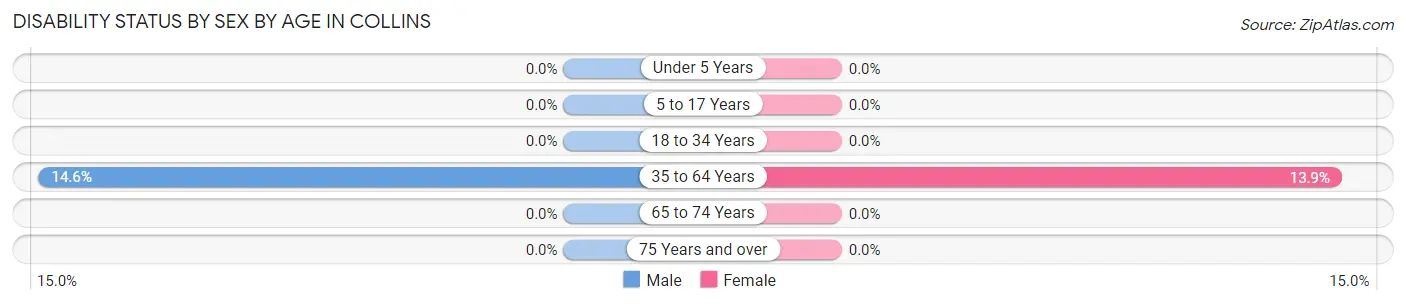
| Age Bracket | Male | Female |
| Under 5 Years | 0 (0.0%) | 0 (0.0%) |
| 5 to 17 Years | 0 (0.0%) | 0 (0.0%) |
| 18 to 34 Years | 0 (0.0%) | 0 (0.0%) |
| 35 to 64 Years | 13 (14.6%) | 11 (13.9%) |
| 65 to 74 Years | 0 (0.0%) | 0 (0.0%) |
| 75 Years and over | 0 (0.0%) | 0 (0.0%) |
Disability Class by Sex by Age in Collins
Disability Class: Hearing Difficulty
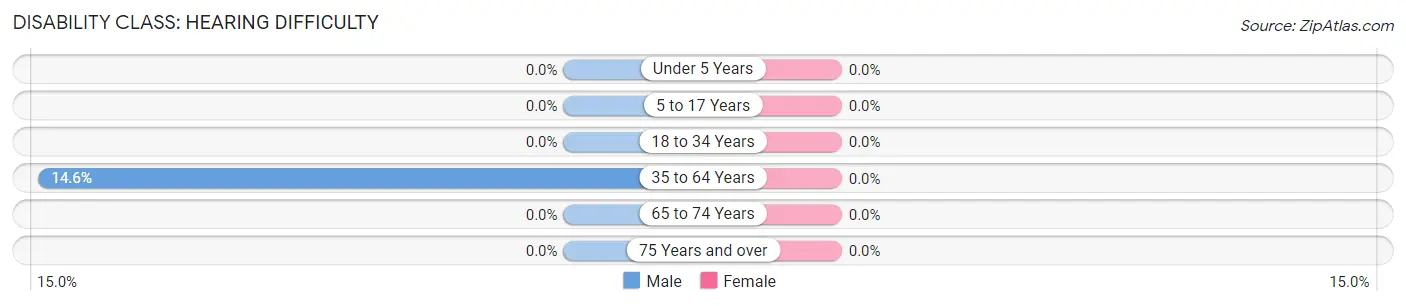
| Age Bracket | Male | Female |
| Under 5 Years | 0 (0.0%) | 0 (0.0%) |
| 5 to 17 Years | 0 (0.0%) | 0 (0.0%) |
| 18 to 34 Years | 0 (0.0%) | 0 (0.0%) |
| 35 to 64 Years | 13 (14.6%) | 0 (0.0%) |
| 65 to 74 Years | 0 (0.0%) | 0 (0.0%) |
| 75 Years and over | 0 (0.0%) | 0 (0.0%) |
Disability Class: Vision Difficulty
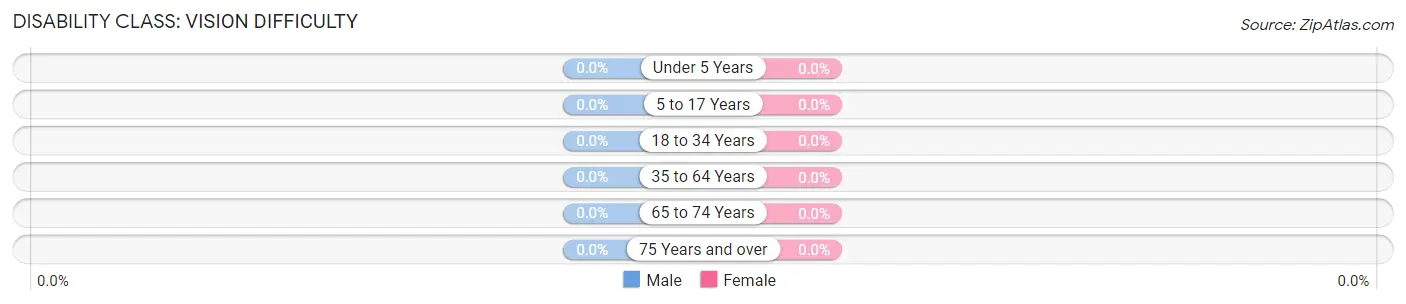
| Age Bracket | Male | Female |
| Under 5 Years | 0 (0.0%) | 0 (0.0%) |
| 5 to 17 Years | 0 (0.0%) | 0 (0.0%) |
| 18 to 34 Years | 0 (0.0%) | 0 (0.0%) |
| 35 to 64 Years | 0 (0.0%) | 0 (0.0%) |
| 65 to 74 Years | 0 (0.0%) | 0 (0.0%) |
| 75 Years and over | 0 (0.0%) | 0 (0.0%) |
Disability Class: Cognitive Difficulty
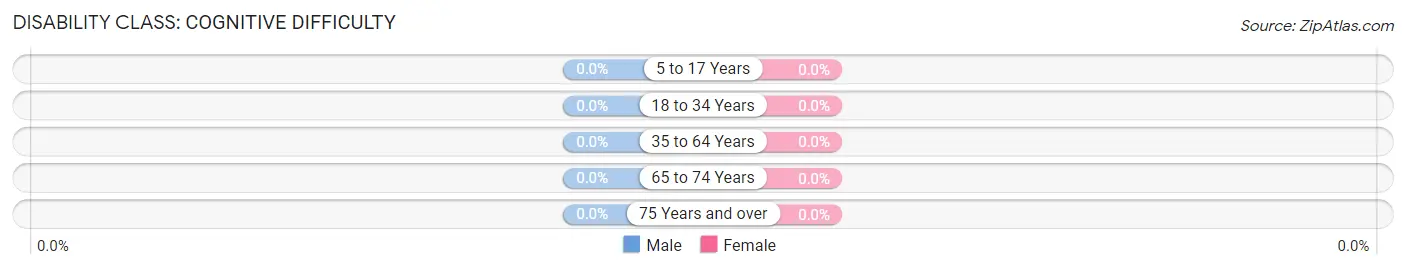
| Age Bracket | Male | Female |
| 5 to 17 Years | 0 (0.0%) | 0 (0.0%) |
| 18 to 34 Years | 0 (0.0%) | 0 (0.0%) |
| 35 to 64 Years | 0 (0.0%) | 0 (0.0%) |
| 65 to 74 Years | 0 (0.0%) | 0 (0.0%) |
| 75 Years and over | 0 (0.0%) | 0 (0.0%) |
Disability Class: Ambulatory Difficulty
| Age Bracket | Male | Female |
| 5 to 17 Years | 0 (0.0%) | 0 (0.0%) |
| 18 to 34 Years | 0 (0.0%) | 0 (0.0%) |
| 35 to 64 Years | 0 (0.0%) | 0 (0.0%) |
| 65 to 74 Years | 0 (0.0%) | 0 (0.0%) |
| 75 Years and over | 0 (0.0%) | 0 (0.0%) |
Disability Class: Self-Care Difficulty
| Age Bracket | Male | Female |
| 5 to 17 Years | 0 (0.0%) | 0 (0.0%) |
| 18 to 34 Years | 0 (0.0%) | 0 (0.0%) |
| 35 to 64 Years | 0 (0.0%) | 0 (0.0%) |
| 65 to 74 Years | 0 (0.0%) | 0 (0.0%) |
| 75 Years and over | 0 (0.0%) | 0 (0.0%) |
Technology Access in Collins
Computing Device Access in Collins
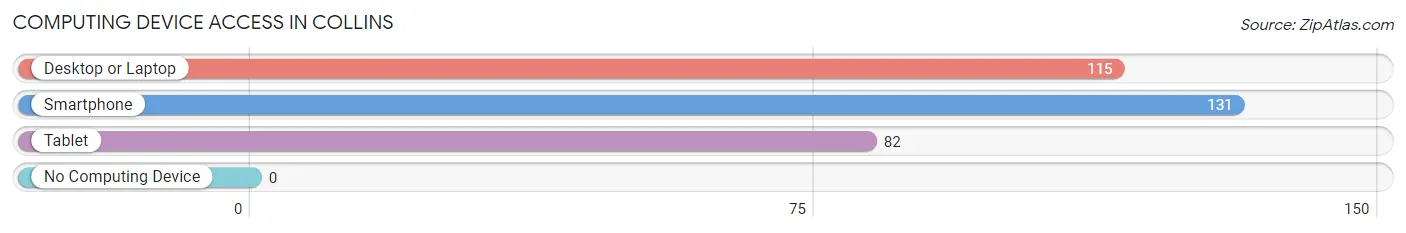
| Device Type | # Households | % Households |
| Desktop or Laptop | 115 | 81.0% |
| Smartphone | 131 | 92.2% |
| Tablet | 82 | 57.8% |
| No Computing Device | 0 | 0.0% |
| Total | 142 | 100.0% |
Internet Access in Collins
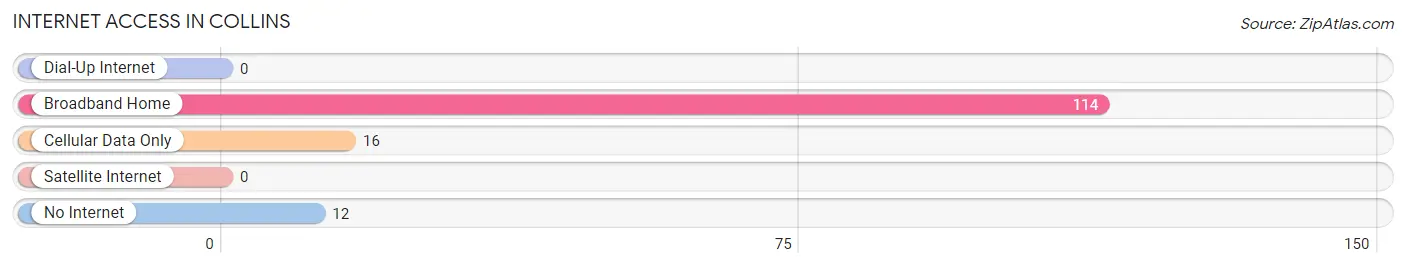
| Internet Type | # Households | % Households |
| Dial-Up Internet | 0 | 0.0% |
| Broadband Home | 114 | 80.3% |
| Cellular Data Only | 16 | 11.3% |
| Satellite Internet | 0 | 0.0% |
| No Internet | 12 | 8.5% |
| Total | 142 | 100.0% |
Collins Summary
Collins, Ohio is a small village located in the northwest corner of Huron County, Ohio. The village is situated on the banks of the Huron River and is home to approximately 1,000 people. The village was founded in 1837 and has a rich history of agriculture, industry, and commerce.
Geography
Collins is located in the northwest corner of Huron County, Ohio. The village is situated on the banks of the Huron River and is surrounded by rolling hills and farmland. The village is located approximately 25 miles from the city of Sandusky and is within a two-hour drive of Cleveland, Toledo, and Columbus. The village is also within a short drive of Lake Erie and the many recreational opportunities it offers.
Economy
Collins is a small village with a limited economy. The village is primarily supported by agriculture and small businesses. The village is home to several small businesses, including a grocery store, a hardware store, a restaurant, and a few other small shops. The village also has a few manufacturing plants, including a plastics factory and a metal fabrication plant.
Demographics
As of the 2010 census, the population of Collins was 1,000 people. The village is predominantly white, with approximately 95% of the population being Caucasian. The median household income is $41,000, and the median age is 43. The village is home to a variety of religious denominations, including Catholic, Lutheran, and Methodist.
Conclusion
Collins, Ohio is a small village located in the northwest corner of Huron County, Ohio. The village is situated on the banks of the Huron River and is home to approximately 1,000 people. The village was founded in 1837 and has a rich history of agriculture, industry, and commerce. The village is primarily supported by agriculture and small businesses, and the population is predominantly white. Collins is a small village with a limited economy, but it is a great place to live and work.
Common Questions
What is Per Capita Income in Collins?
Per Capita income in Collins is $28,073.
What is the Median Family Income in Collins?
Median Family Income in Collins is $62,604.
What is the Median Household income in Collins?
Median Household Income in Collins is $82,656.
What is Income or Wage Gap in Collins?
Income or Wage Gap in Collins is 45.6%.
Women in Collins earn 54.4 cents for every dollar earned by a man.
What is Inequality or Gini Index in Collins?
Inequality or Gini Index in Collins is 0.27.
What is the Total Population of Collins?
Total Population of Collins is 442.
What is the Total Male Population of Collins?
Total Male Population of Collins is 234.
What is the Total Female Population of Collins?
Total Female Population of Collins is 208.
What is the Ratio of Males per 100 Females in Collins?
There are 112.50 Males per 100 Females in Collins.
What is the Ratio of Females per 100 Males in Collins?
There are 88.89 Females per 100 Males in Collins.
What is the Median Population Age in Collins?
Median Population Age in Collins is 35.3 Years.
What is the Average Family Size in Collins
Average Family Size in Collins is 3.1 People.
What is the Average Household Size in Collins
Average Household Size in Collins is 3.1 People.
How Large is the Labor Force in Collins?
There are 235 People in the Labor Forcein in Collins.
What is the Percentage of People in the Labor Force in Collins?
73.4% of People are in the Labor Force in Collins.