Four Bridges, OH Map & Demographics
Four Bridges Map
Four Bridges Overview
$72,199
PER CAPITA INCOME
$189,653
AVG FAMILY INCOME
$137,143
AVG HOUSEHOLD INCOME
24.2%
WAGE / INCOME GAP [ % ]
75.8¢/ $1
WAGE / INCOME GAP [ $ ]
$10,263
FAMILY INCOME DEFICIT
0.42
INEQUALITY / GINI INDEX
3,511
TOTAL POPULATION
1,818
MALE POPULATION
1,693
FEMALE POPULATION
107.38
MALES / 100 FEMALES
93.12
FEMALES / 100 MALES
45.8
MEDIAN AGE
3.2
AVG FAMILY SIZE
2.6
AVG HOUSEHOLD SIZE
1,580
LABOR FORCE [ PEOPLE ]
56.4%
PERCENT IN LABOR FORCE
3.8%
UNEMPLOYMENT RATE
Income in Four Bridges
Income Overview in Four Bridges
Per Capita Income in Four Bridges is $72,199, while median incomes of families and households are $189,653 and $137,143 respectively.
| Characteristic | Number | Measure |
| Per Capita Income | 3,511 | $72,199 |
| Median Family Income | 913 | $189,653 |
| Mean Family Income | 913 | $203,614 |
| Median Household Income | 1,312 | $137,143 |
| Mean Household Income | 1,312 | $171,033 |
| Income Deficit | 913 | $10,263 |
| Wage / Income Gap (%) | 3,511 | 24.16% |
| Wage / Income Gap ($) | 3,511 | 75.84¢ per $1 |
| Gini / Inequality Index | 3,511 | 0.42 |
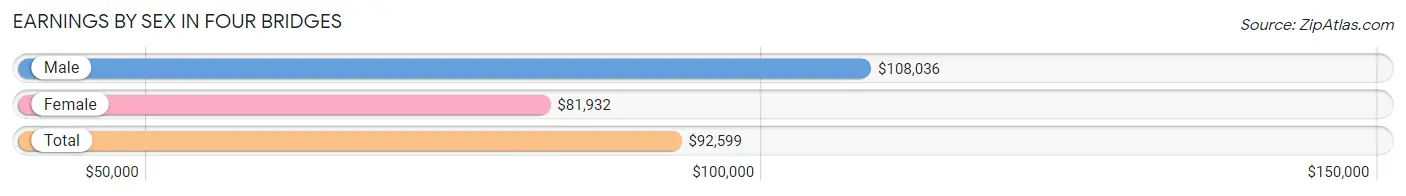
Earnings by Sex in Four Bridges
Average Earnings in Four Bridges are $92,599, $108,036 for men and $81,932 for women, a difference of 24.2%.
| Sex | Number | Average Earnings |
| Male | 915 (56.7%) | $108,036 |
| Female | 698 (43.3%) | $81,932 |
| Total | 1,613 (100.0%) | $92,599 |
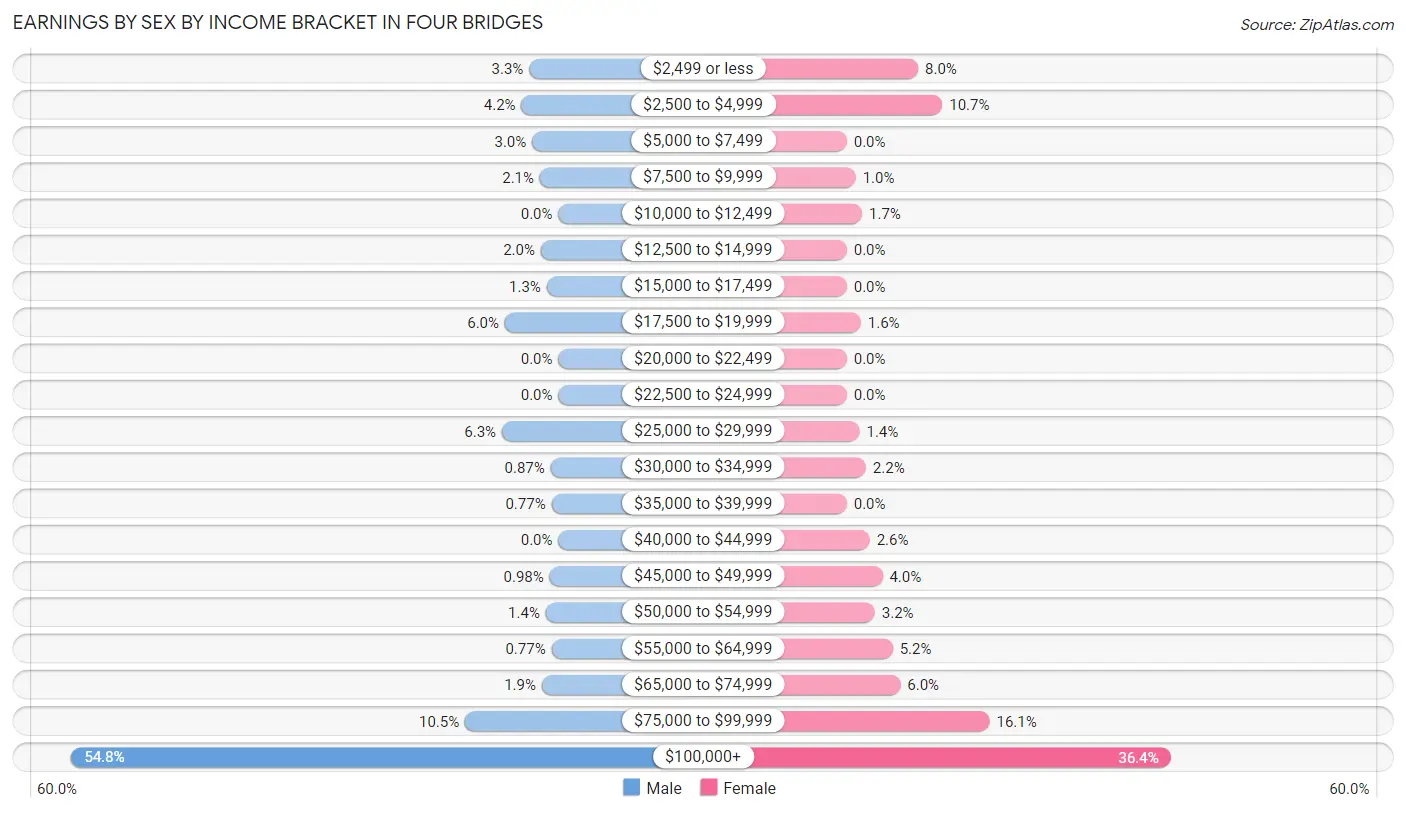
Earnings by Sex by Income Bracket in Four Bridges
The most common earnings brackets in Four Bridges are $100,000+ for men (501 | 54.7%) and $100,000+ for women (254 | 36.4%).
| Income | Male | Female |
| $2,499 or less | 30 (3.3%) | 56 (8.0%) |
| $2,500 to $4,999 | 38 (4.2%) | 75 (10.7%) |
| $5,000 to $7,499 | 27 (2.9%) | 0 (0.0%) |
| $7,500 to $9,999 | 19 (2.1%) | 7 (1.0%) |
| $10,000 to $12,499 | 0 (0.0%) | 12 (1.7%) |
| $12,500 to $14,999 | 18 (2.0%) | 0 (0.0%) |
| $15,000 to $17,499 | 12 (1.3%) | 0 (0.0%) |
| $17,500 to $19,999 | 55 (6.0%) | 11 (1.6%) |
| $20,000 to $22,499 | 0 (0.0%) | 0 (0.0%) |
| $22,500 to $24,999 | 0 (0.0%) | 0 (0.0%) |
| $25,000 to $29,999 | 58 (6.3%) | 10 (1.4%) |
| $30,000 to $34,999 | 8 (0.9%) | 15 (2.1%) |
| $35,000 to $39,999 | 7 (0.8%) | 0 (0.0%) |
| $40,000 to $44,999 | 0 (0.0%) | 18 (2.6%) |
| $45,000 to $49,999 | 9 (1.0%) | 28 (4.0%) |
| $50,000 to $54,999 | 13 (1.4%) | 22 (3.2%) |
| $55,000 to $64,999 | 7 (0.8%) | 36 (5.2%) |
| $65,000 to $74,999 | 17 (1.9%) | 42 (6.0%) |
| $75,000 to $99,999 | 96 (10.5%) | 112 (16.1%) |
| $100,000+ | 501 (54.7%) | 254 (36.4%) |
| Total | 915 (100.0%) | 698 (100.0%) |
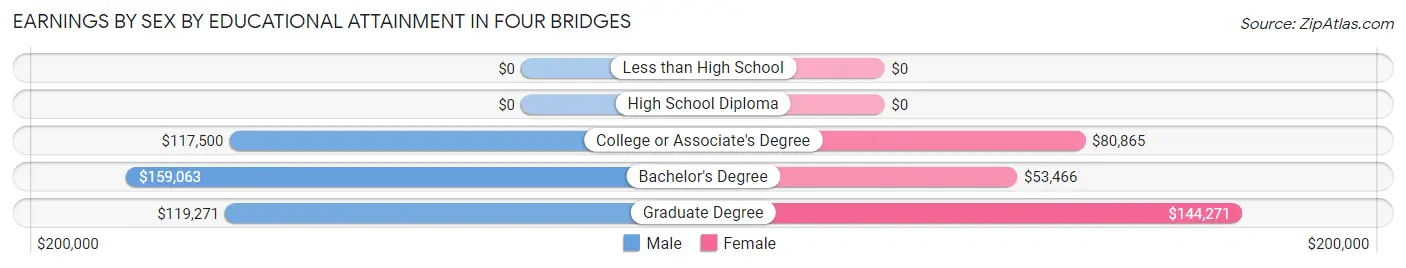
Earnings by Sex by Educational Attainment in Four Bridges
Average earnings in Four Bridges are $117,917 for men and $91,490 for women, a difference of 22.4%. Men with an educational attainment of bachelor's degree enjoy the highest average annual earnings of $159,063, while those with college or associate's degree education earn the least with $117,500. Women with an educational attainment of graduate degree earn the most with the average annual earnings of $144,271, while those with bachelor's degree education have the smallest earnings of $53,466.
| Educational Attainment | Male Income | Female Income |
| Less than High School | - | - |
| High School Diploma | - | - |
| College or Associate's Degree | $117,500 | $80,865 |
| Bachelor's Degree | $159,063 | $53,466 |
| Graduate Degree | $119,271 | $144,271 |
| Total | $117,917 | $91,490 |
Family Income in Four Bridges
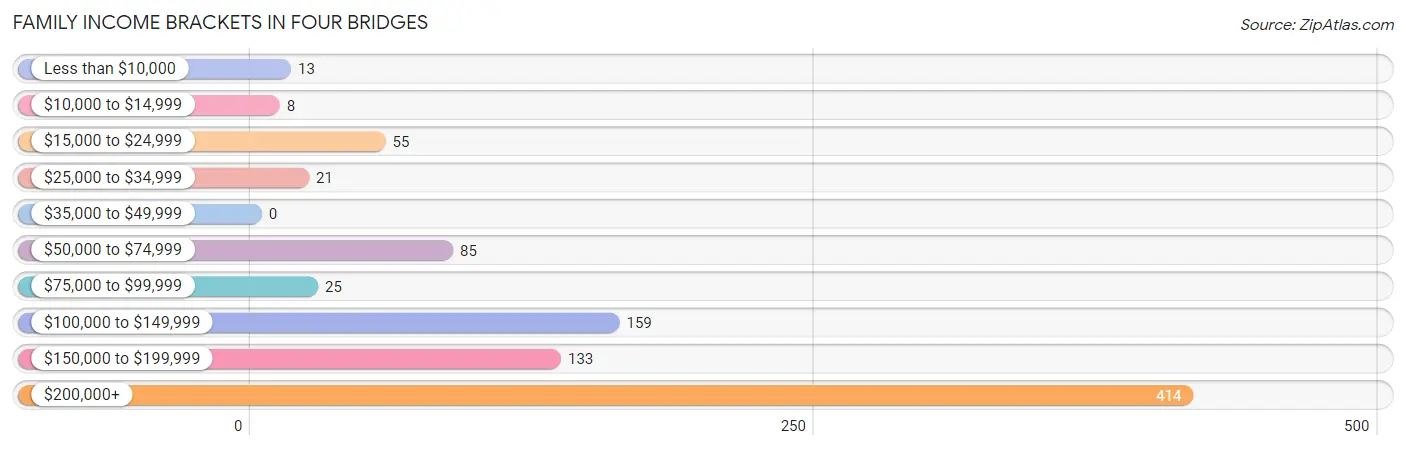
Family Income Brackets in Four Bridges
According to the Four Bridges family income data, there are 414 families falling into the $200,000+ income range, which is the most common income bracket and makes up 45.4% of all families.
| Income Bracket | # Families | % Families |
| Less than $10,000 | 13 | 1.4% |
| $10,000 to $14,999 | 8 | 0.9% |
| $15,000 to $24,999 | 55 | 6.0% |
| $25,000 to $34,999 | 21 | 2.3% |
| $35,000 to $49,999 | 0 | 0.0% |
| $50,000 to $74,999 | 85 | 9.3% |
| $75,000 to $99,999 | 25 | 2.7% |
| $100,000 to $149,999 | 159 | 17.4% |
| $150,000 to $199,999 | 133 | 14.6% |
| $200,000+ | 414 | 45.3% |
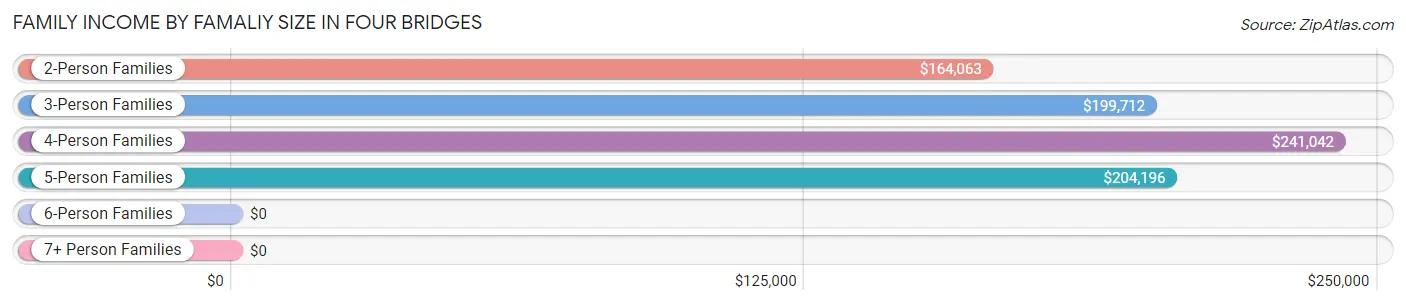
Family Income by Famaliy Size in Four Bridges
4-person families (219 | 24.0%) account for the highest median family income in Four Bridges with $241,042 per family, while 2-person families (446 | 48.8%) have the highest median income of $82,032 per family member.
| Income Bracket | # Families | Median Income |
| 2-Person Families | 446 (48.8%) | $164,063 |
| 3-Person Families | 167 (18.3%) | $199,712 |
| 4-Person Families | 219 (24.0%) | $241,042 |
| 5-Person Families | 49 (5.4%) | $204,196 |
| 6-Person Families | 14 (1.5%) | $0 |
| 7+ Person Families | 18 (2.0%) | $0 |
| Total | 913 (100.0%) | $189,653 |
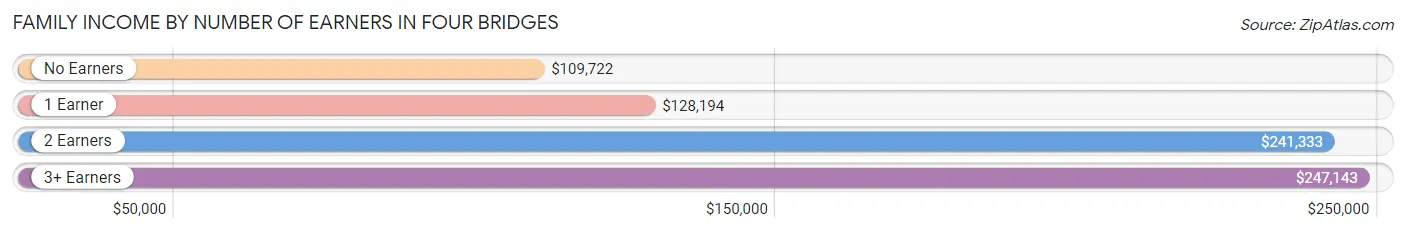
Family Income by Number of Earners in Four Bridges
The median family income in Four Bridges is $189,653, with families comprising 3+ earners (104) having the highest median family income of $247,143, while families with no earners (190) have the lowest median family income of $109,722, accounting for 11.4% and 20.8% of families, respectively.
| Number of Earners | # Families | Median Income |
| No Earners | 190 (20.8%) | $109,722 |
| 1 Earner | 291 (31.9%) | $128,194 |
| 2 Earners | 328 (35.9%) | $241,333 |
| 3+ Earners | 104 (11.4%) | $247,143 |
| Total | 913 (100.0%) | $189,653 |
Household Income in Four Bridges
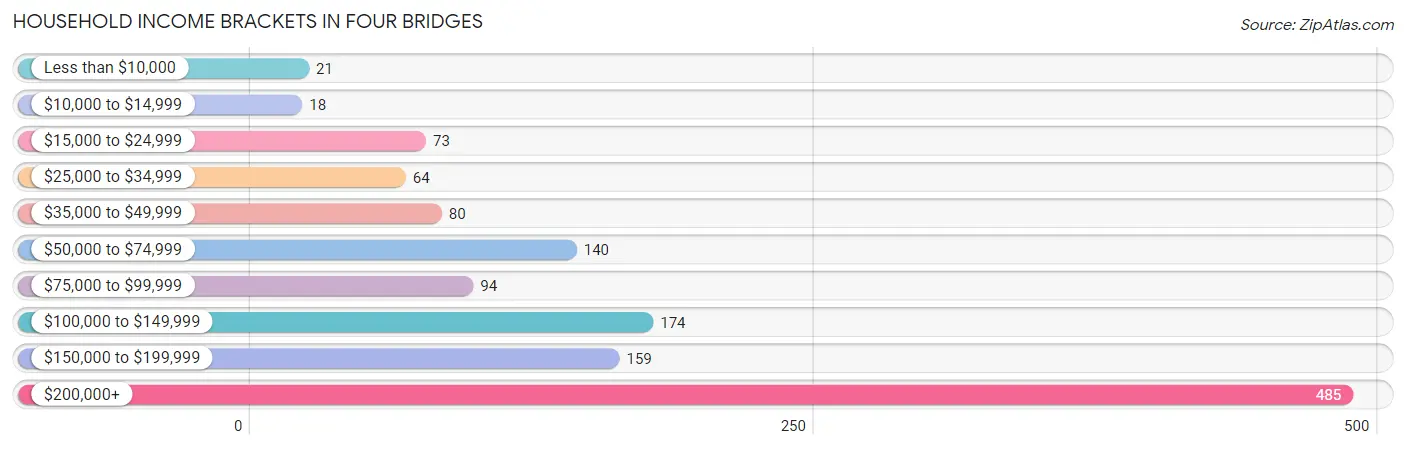
Household Income Brackets in Four Bridges
With 485 households falling in the category, the $200,000+ income range is the most frequent in Four Bridges, accounting for 37.0% of all households. In contrast, only 18 households (1.4%) fall into the $10,000 to $14,999 income bracket, making it the least populous group.
| Income Bracket | # Households | % Households |
| Less than $10,000 | 21 | 1.6% |
| $10,000 to $14,999 | 18 | 1.4% |
| $15,000 to $24,999 | 73 | 5.6% |
| $25,000 to $34,999 | 64 | 4.9% |
| $35,000 to $49,999 | 80 | 6.1% |
| $50,000 to $74,999 | 140 | 10.7% |
| $75,000 to $99,999 | 94 | 7.2% |
| $100,000 to $149,999 | 174 | 13.3% |
| $150,000 to $199,999 | 159 | 12.1% |
| $200,000+ | 485 | 37.0% |
Household Income by Householder Age in Four Bridges
The median household income in Four Bridges is $137,143, with the highest median household income of $223,008 found in the 25 to 44 years age bracket for the primary householder. A total of 333 households (25.4%) fall into this category. Meanwhile, the 15 to 24 years age bracket for the primary householder has the lowest median household income of $0, with 12 households (0.9%) in this group.
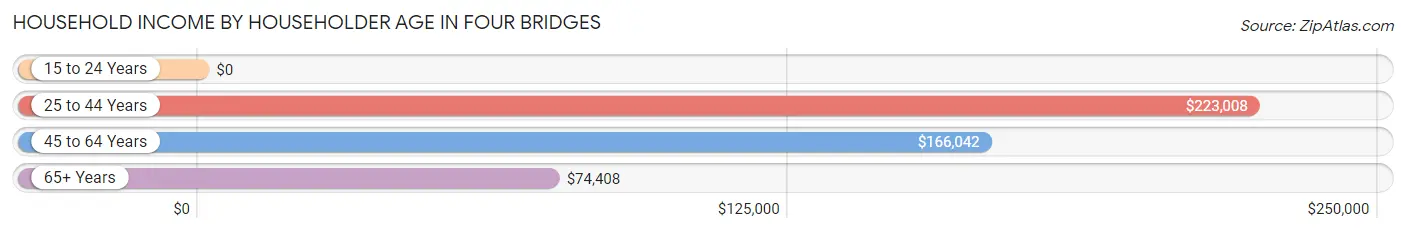
| Income Bracket | # Households | Median Income |
| 15 to 24 Years | 12 (0.9%) | $0 |
| 25 to 44 Years | 333 (25.4%) | $223,008 |
| 45 to 64 Years | 524 (39.9%) | $166,042 |
| 65+ Years | 443 (33.8%) | $74,408 |
| Total | 1,312 (100.0%) | $137,143 |
Poverty in Four Bridges
Income Below Poverty by Sex and Age in Four Bridges
With 7.9% poverty level for males and 8.5% for females among the residents of Four Bridges, 35 to 44 year old males and 6 to 11 year old females are the most vulnerable to poverty, with 55 males (26.6%) and 51 females (42.1%) in their respective age groups living below the poverty level.
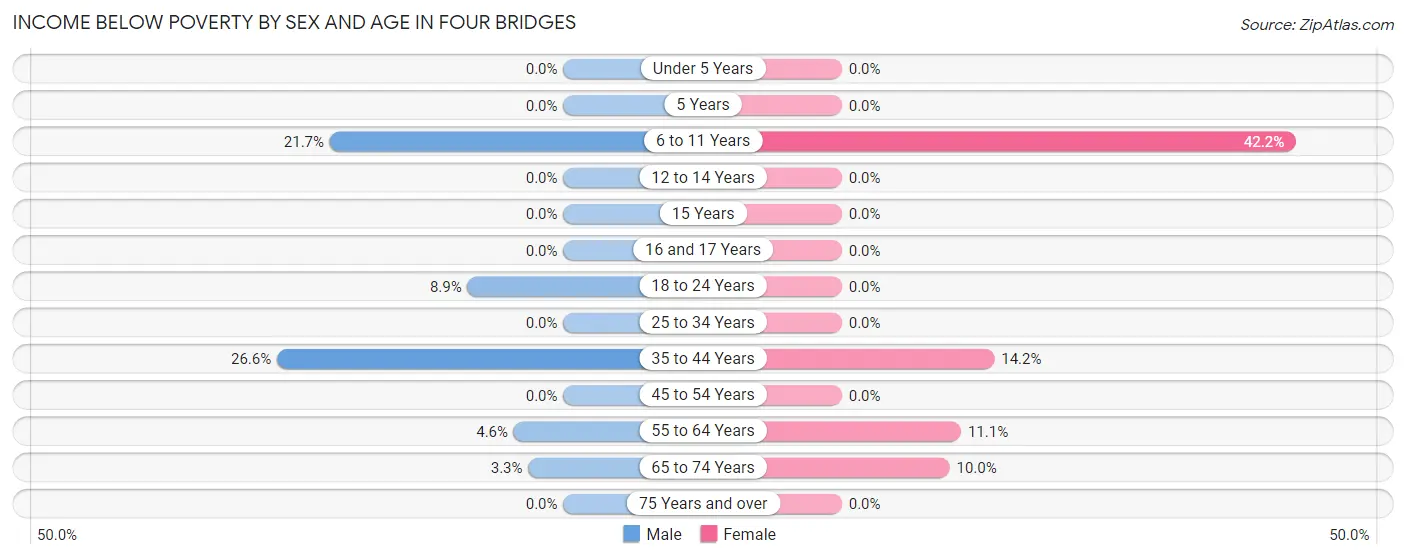
| Age Bracket | Male | Female |
| Under 5 Years | 0 (0.0%) | 0 (0.0%) |
| 5 Years | 0 (0.0%) | 0 (0.0%) |
| 6 to 11 Years | 52 (21.7%) | 51 (42.1%) |
| 12 to 14 Years | 0 (0.0%) | 0 (0.0%) |
| 15 Years | 0 (0.0%) | 0 (0.0%) |
| 16 and 17 Years | 0 (0.0%) | 0 (0.0%) |
| 18 to 24 Years | 12 (8.9%) | 0 (0.0%) |
| 25 to 34 Years | 0 (0.0%) | 0 (0.0%) |
| 35 to 44 Years | 55 (26.6%) | 44 (14.1%) |
| 45 to 54 Years | 0 (0.0%) | 0 (0.0%) |
| 55 to 64 Years | 13 (4.6%) | 22 (11.1%) |
| 65 to 74 Years | 8 (3.3%) | 19 (10.0%) |
| 75 Years and over | 0 (0.0%) | 0 (0.0%) |
| Total | 140 (7.9%) | 136 (8.5%) |
Income Above Poverty by Sex and Age in Four Bridges
According to the poverty statistics in Four Bridges, males aged under 5 years and females aged under 5 years are the age groups that are most secure financially, with 100.0% of males and 100.0% of females in these age groups living above the poverty line.
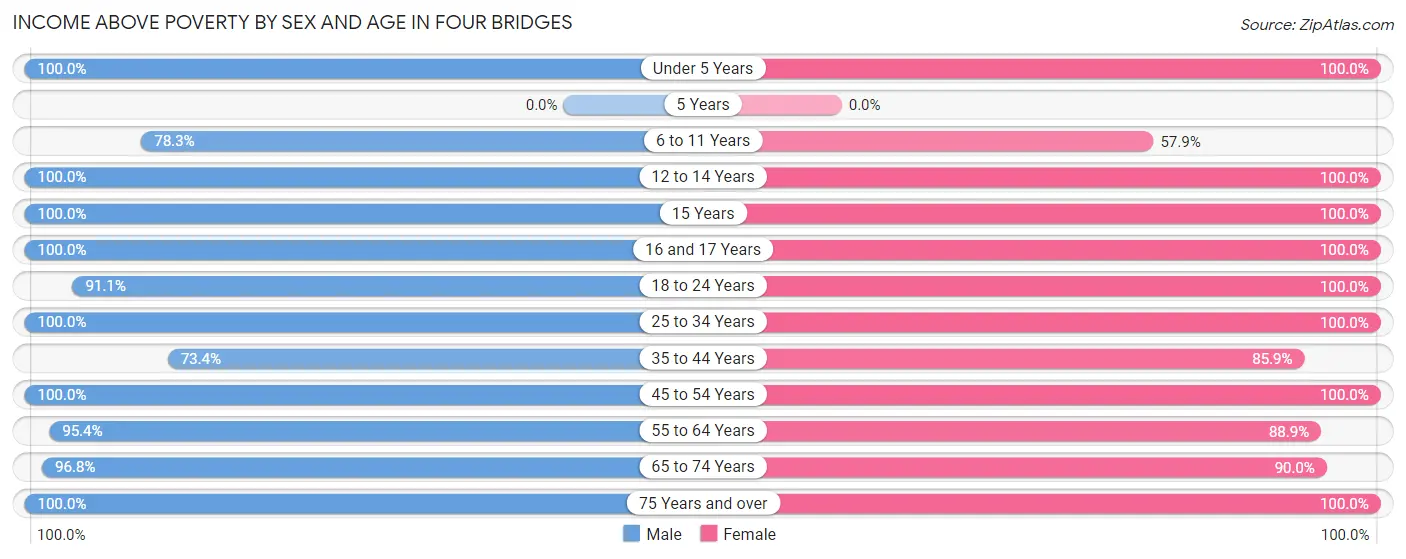
| Age Bracket | Male | Female |
| Under 5 Years | 52 (100.0%) | 46 (100.0%) |
| 5 Years | 0 (0.0%) | 0 (0.0%) |
| 6 to 11 Years | 188 (78.3%) | 70 (57.9%) |
| 12 to 14 Years | 98 (100.0%) | 96 (100.0%) |
| 15 Years | 44 (100.0%) | 12 (100.0%) |
| 16 and 17 Years | 22 (100.0%) | 36 (100.0%) |
| 18 to 24 Years | 123 (91.1%) | 72 (100.0%) |
| 25 to 34 Years | 75 (100.0%) | 105 (100.0%) |
| 35 to 44 Years | 152 (73.4%) | 267 (85.9%) |
| 45 to 54 Years | 231 (100.0%) | 229 (100.0%) |
| 55 to 64 Years | 270 (95.4%) | 177 (88.9%) |
| 65 to 74 Years | 238 (96.8%) | 171 (90.0%) |
| 75 Years and over | 142 (100.0%) | 181 (100.0%) |
| Total | 1,635 (92.1%) | 1,462 (91.5%) |
Income Below Poverty Among Married-Couple Families in Four Bridges
The poverty statistics for married-couple families in Four Bridges show that 8.6% or 76 of the total 879 families live below the poverty line. Families with 1 or 2 children have the highest poverty rate of 17.8%, comprising of 55 families. On the other hand, families with 3 or 4 children have the lowest poverty rate of 0.0%, which includes 0 families.
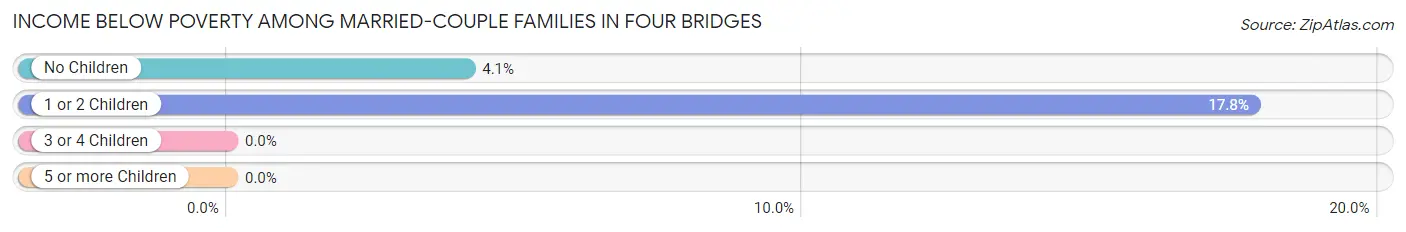
| Children | Above Poverty | Below Poverty |
| No Children | 488 (95.9%) | 21 (4.1%) |
| 1 or 2 Children | 254 (82.2%) | 55 (17.8%) |
| 3 or 4 Children | 43 (100.0%) | 0 (0.0%) |
| 5 or more Children | 18 (100.0%) | 0 (0.0%) |
| Total | 803 (91.3%) | 76 (8.6%) |
Income Below Poverty Among Single-Parent Households in Four Bridges
| Children | Single Father | Single Mother |
| No Children | 0 (0.0%) | 0 (0.0%) |
| 1 or 2 Children | 0 (0.0%) | 0 (0.0%) |
| 3 or 4 Children | 0 (0.0%) | 0 (0.0%) |
| 5 or more Children | 0 (0.0%) | 0 (0.0%) |
| Total | 0 (0.0%) | 0 (0.0%) |
Income Below Poverty Among Married-Couple vs Single-Parent Households in Four Bridges
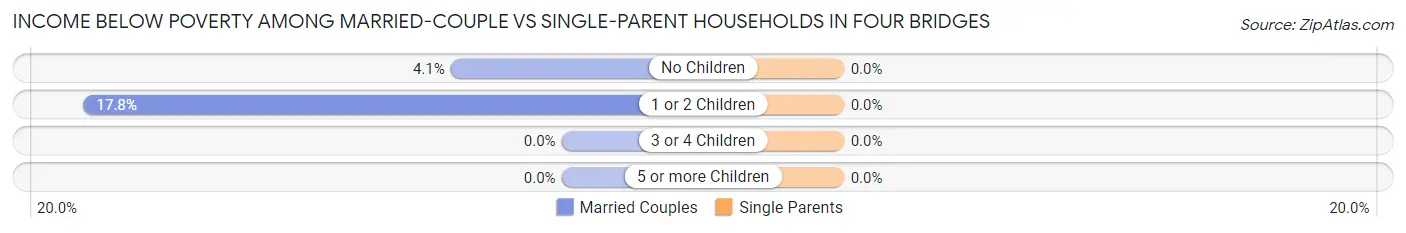
| Children | Married-Couple Families | Single-Parent Households |
| No Children | 21 (4.1%) | 0 (0.0%) |
| 1 or 2 Children | 55 (17.8%) | 0 (0.0%) |
| 3 or 4 Children | 0 (0.0%) | 0 (0.0%) |
| 5 or more Children | 0 (0.0%) | 0 (0.0%) |
| Total | 76 (8.6%) | 0 (0.0%) |
Race in Four Bridges
The most populous races in Four Bridges are White / Caucasian (3,020 | 86.0%), Asian (340 | 9.7%), and Black / African American (98 | 2.8%).
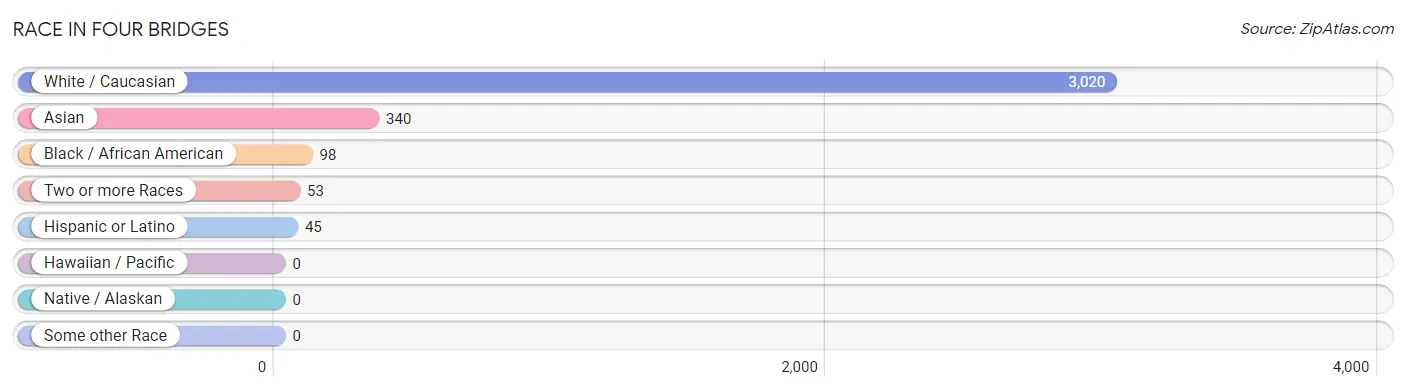
| Race | # Population | % Population |
| Asian | 340 | 9.7% |
| Black / African American | 98 | 2.8% |
| Hawaiian / Pacific | 0 | 0.0% |
| Hispanic or Latino | 45 | 1.3% |
| Native / Alaskan | 0 | 0.0% |
| White / Caucasian | 3,020 | 86.0% |
| Two or more Races | 53 | 1.5% |
| Some other Race | 0 | 0.0% |
| Total | 3,511 | 100.0% |
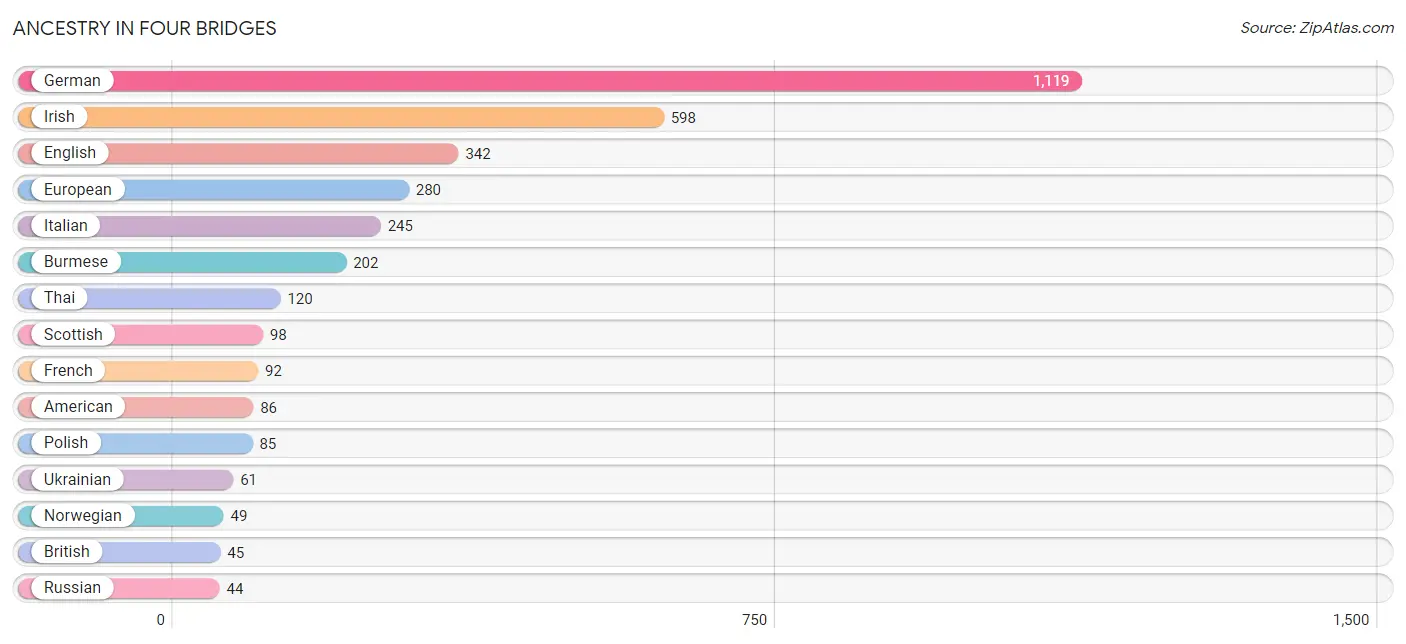
Ancestry in Four Bridges
The most populous ancestries reported in Four Bridges are German (1,119 | 31.9%), Irish (598 | 17.0%), English (342 | 9.7%), European (280 | 8.0%), and Italian (245 | 7.0%), together accounting for 73.6% of all Four Bridges residents.
| Ancestry | # Population | % Population |
| American | 86 | 2.5% |
| Arab | 8 | 0.2% |
| Austrian | 11 | 0.3% |
| Belgian | 7 | 0.2% |
| Bhutanese | 18 | 0.5% |
| British | 45 | 1.3% |
| Burmese | 202 | 5.8% |
| Czech | 9 | 0.3% |
| Danish | 15 | 0.4% |
| Dutch | 16 | 0.5% |
| Eastern European | 40 | 1.1% |
| English | 342 | 9.7% |
| European | 280 | 8.0% |
| French | 92 | 2.6% |
| French Canadian | 17 | 0.5% |
| German | 1,119 | 31.9% |
| Greek | 29 | 0.8% |
| Hungarian | 38 | 1.1% |
| Iranian | 7 | 0.2% |
| Irish | 598 | 17.0% |
| Italian | 245 | 7.0% |
| Lebanese | 8 | 0.2% |
| Mexican | 37 | 1.1% |
| Northern European | 11 | 0.3% |
| Norwegian | 49 | 1.4% |
| Osage | 7 | 0.2% |
| Polish | 85 | 2.4% |
| Russian | 44 | 1.3% |
| Scandinavian | 24 | 0.7% |
| Scotch-Irish | 7 | 0.2% |
| Scottish | 98 | 2.8% |
| Slovak | 15 | 0.4% |
| Slovene | 11 | 0.3% |
| South American | 8 | 0.2% |
| Swedish | 10 | 0.3% |
| Swiss | 23 | 0.7% |
| Thai | 120 | 3.4% |
| Ukrainian | 61 | 1.7% |
| Venezuelan | 8 | 0.2% |
| Welsh | 9 | 0.3% | View All 40 Rows |
Immigrants in Four Bridges
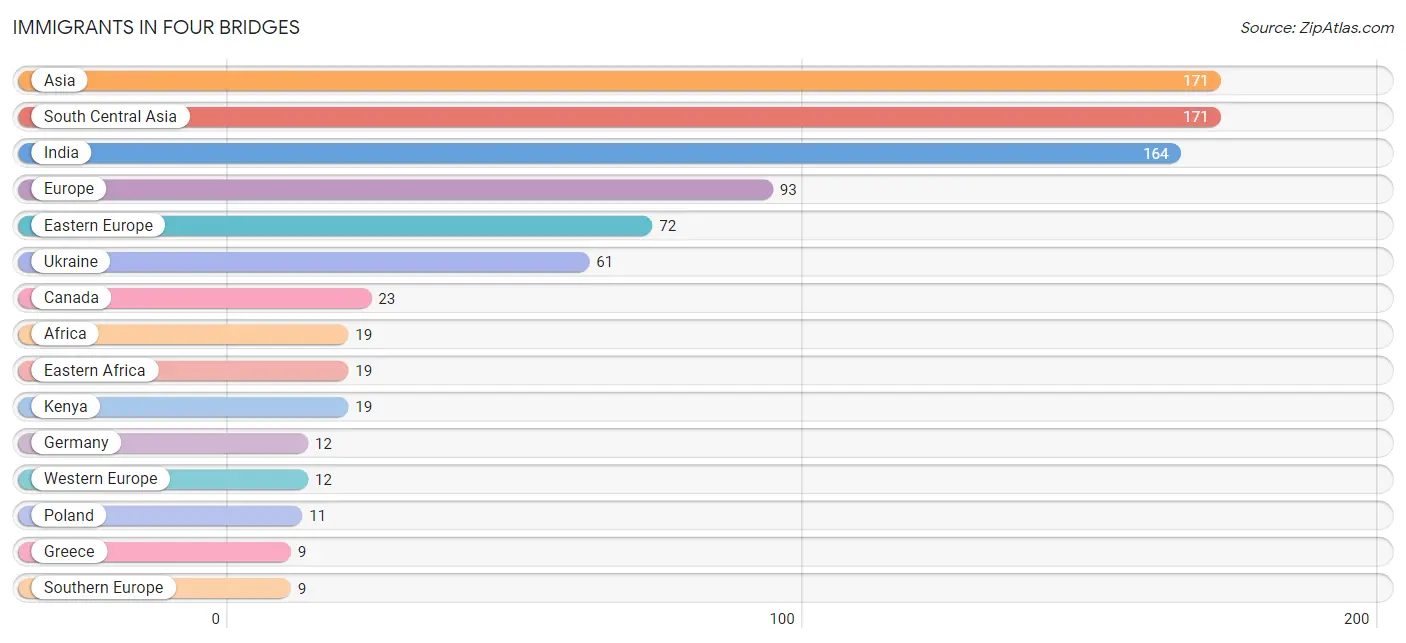
The most numerous immigrant groups reported in Four Bridges came from Asia (171 | 4.9%), South Central Asia (171 | 4.9%), India (164 | 4.7%), Europe (93 | 2.6%), and Eastern Europe (72 | 2.1%), together accounting for 19.1% of all Four Bridges residents.
| Immigration Origin | # Population | % Population |
| Africa | 19 | 0.5% |
| Asia | 171 | 4.9% |
| Canada | 23 | 0.7% |
| Eastern Africa | 19 | 0.5% |
| Eastern Europe | 72 | 2.1% |
| Europe | 93 | 2.6% |
| Germany | 12 | 0.3% |
| Greece | 9 | 0.3% |
| India | 164 | 4.7% |
| Iran | 7 | 0.2% |
| Kenya | 19 | 0.5% |
| Latin America | 8 | 0.2% |
| Poland | 11 | 0.3% |
| South America | 8 | 0.2% |
| South Central Asia | 171 | 4.9% |
| Southern Europe | 9 | 0.3% |
| Ukraine | 61 | 1.7% |
| Venezuela | 8 | 0.2% |
| Western Europe | 12 | 0.3% | View All 19 Rows |
Sex and Age in Four Bridges
Sex and Age in Four Bridges
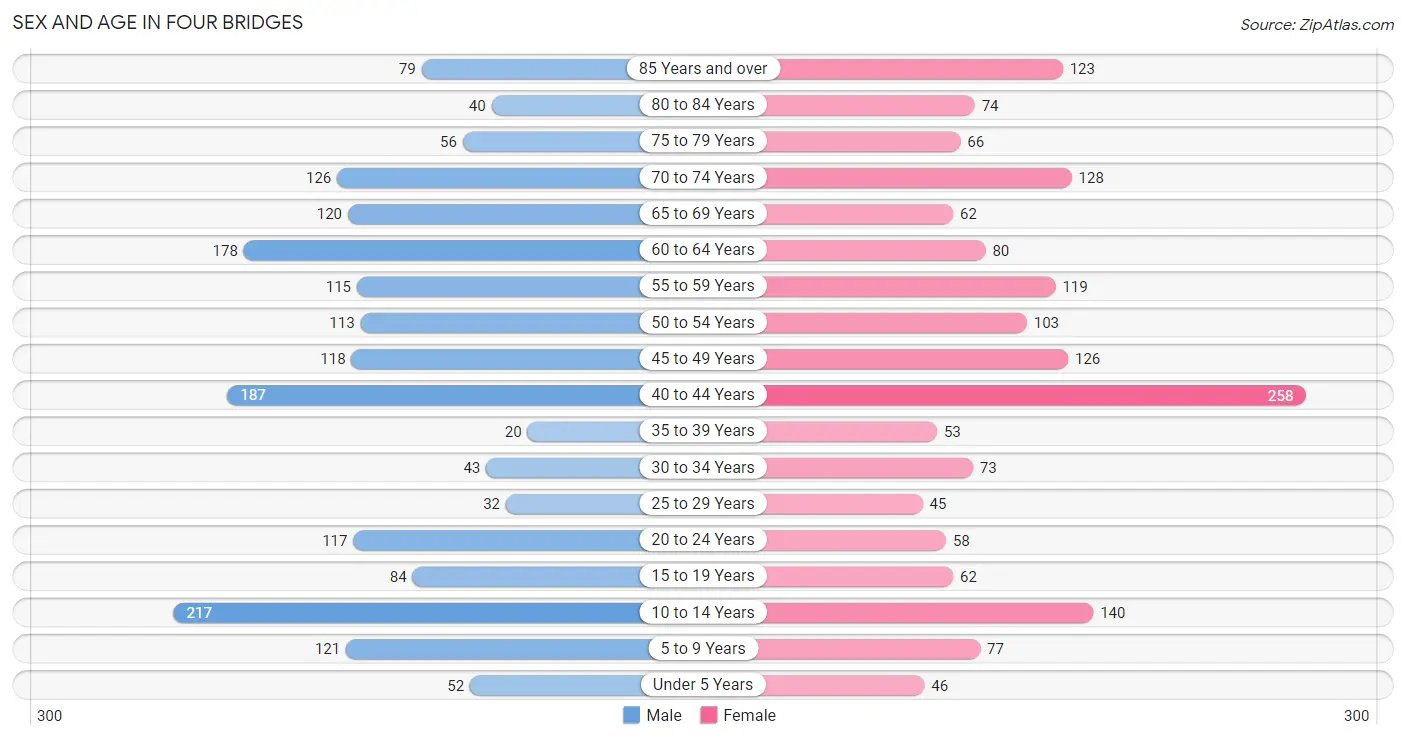
The most populous age groups in Four Bridges are 10 to 14 Years (217 | 11.9%) for men and 40 to 44 Years (258 | 15.2%) for women.
| Age Bracket | Male | Female |
| Under 5 Years | 52 (2.9%) | 46 (2.7%) |
| 5 to 9 Years | 121 (6.7%) | 77 (4.5%) |
| 10 to 14 Years | 217 (11.9%) | 140 (8.3%) |
| 15 to 19 Years | 84 (4.6%) | 62 (3.7%) |
| 20 to 24 Years | 117 (6.4%) | 58 (3.4%) |
| 25 to 29 Years | 32 (1.8%) | 45 (2.7%) |
| 30 to 34 Years | 43 (2.4%) | 73 (4.3%) |
| 35 to 39 Years | 20 (1.1%) | 53 (3.1%) |
| 40 to 44 Years | 187 (10.3%) | 258 (15.2%) |
| 45 to 49 Years | 118 (6.5%) | 126 (7.4%) |
| 50 to 54 Years | 113 (6.2%) | 103 (6.1%) |
| 55 to 59 Years | 115 (6.3%) | 119 (7.0%) |
| 60 to 64 Years | 178 (9.8%) | 80 (4.7%) |
| 65 to 69 Years | 120 (6.6%) | 62 (3.7%) |
| 70 to 74 Years | 126 (6.9%) | 128 (7.6%) |
| 75 to 79 Years | 56 (3.1%) | 66 (3.9%) |
| 80 to 84 Years | 40 (2.2%) | 74 (4.4%) |
| 85 Years and over | 79 (4.3%) | 123 (7.3%) |
| Total | 1,818 (100.0%) | 1,693 (100.0%) |
Families and Households in Four Bridges
Median Family Size in Four Bridges
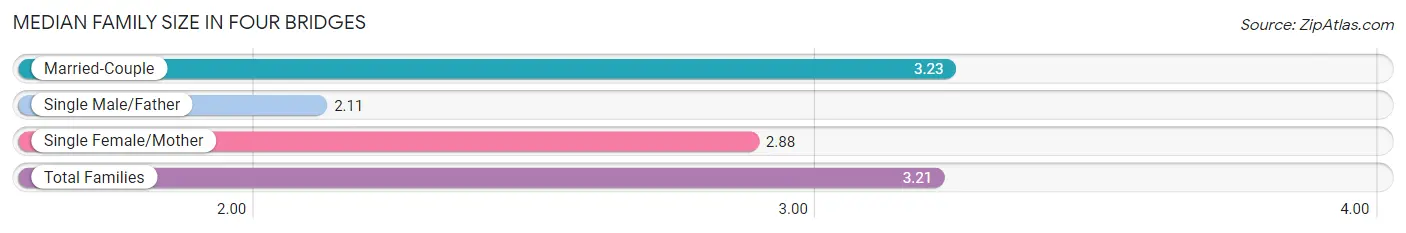
The median family size in Four Bridges is 3.21 persons per family, with married-couple families (879 | 96.3%) accounting for the largest median family size of 3.23 persons per family. On the other hand, single male/father families (9 | 1.0%) represent the smallest median family size with 2.11 persons per family.
| Family Type | # Families | Family Size |
| Married-Couple | 879 (96.3%) | 3.23 |
| Single Male/Father | 9 (1.0%) | 2.11 |
| Single Female/Mother | 25 (2.7%) | 2.88 |
| Total Families | 913 (100.0%) | 3.21 |
Median Household Size in Four Bridges
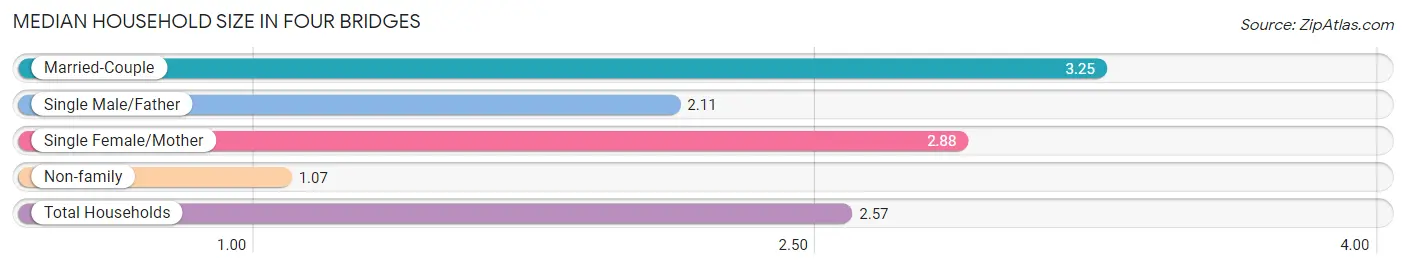
The median household size in Four Bridges is 2.57 persons per household, with married-couple households (879 | 67.0%) accounting for the largest median household size of 3.25 persons per household. non-family households (399 | 30.4%) represent the smallest median household size with 1.07 persons per household.
| Household Type | # Households | Household Size |
| Married-Couple | 879 (67.0%) | 3.25 |
| Single Male/Father | 9 (0.7%) | 2.11 |
| Single Female/Mother | 25 (1.9%) | 2.88 |
| Non-family | 399 (30.4%) | 1.07 |
| Total Households | 1,312 (100.0%) | 2.57 |
Household Size by Marriage Status in Four Bridges
Out of a total of 1,312 households in Four Bridges, 913 (69.6%) are family households, while 399 (30.4%) are nonfamily households. The most numerous type of family households are 2-person households, comprising 446, and the most common type of nonfamily households are 1-person households, comprising 374.
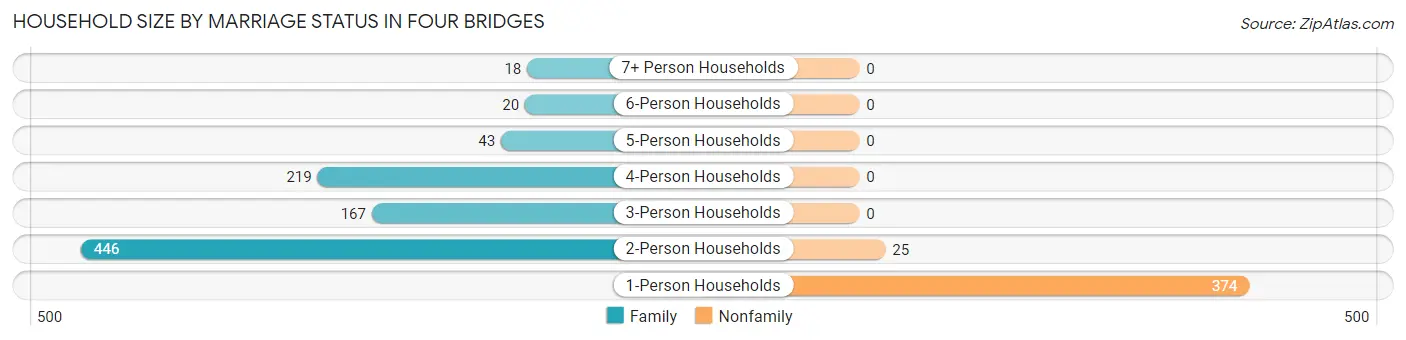
| Household Size | Family Households | Nonfamily Households |
| 1-Person Households | - | 374 (28.5%) |
| 2-Person Households | 446 (34.0%) | 25 (1.9%) |
| 3-Person Households | 167 (12.7%) | 0 (0.0%) |
| 4-Person Households | 219 (16.7%) | 0 (0.0%) |
| 5-Person Households | 43 (3.3%) | 0 (0.0%) |
| 6-Person Households | 20 (1.5%) | 0 (0.0%) |
| 7+ Person Households | 18 (1.4%) | 0 (0.0%) |
| Total | 913 (69.6%) | 399 (30.4%) |
Female Fertility in Four Bridges
Fertility by Age in Four Bridges
Average fertility rate in Four Bridges is 13.0 births per 1,000 women. Women in the age bracket of 20 to 34 years have the highest fertility rate with 51.0 births per 1,000 women. Women in the age bracket of 20 to 34 years acount for 100.0% of all women with births.
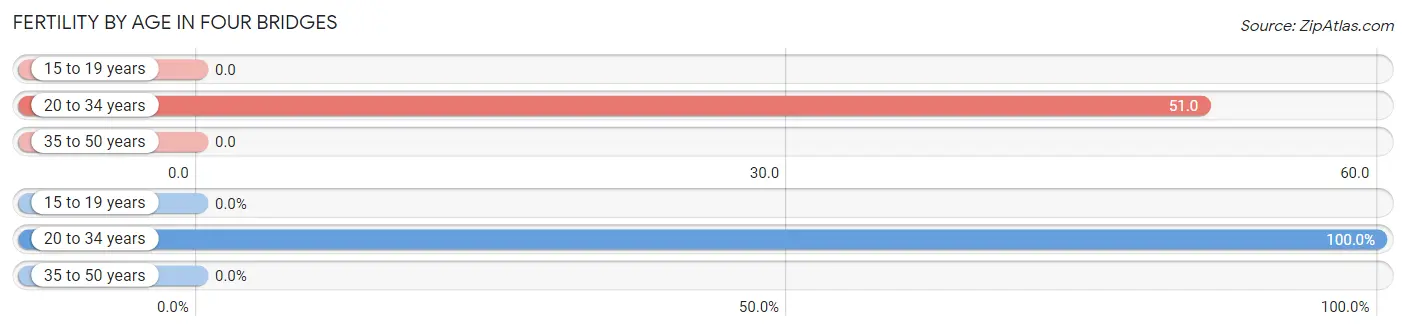
| Age Bracket | Women with Births | Births / 1,000 Women |
| 15 to 19 years | 0 (0.0%) | 0.0 |
| 20 to 34 years | 9 (100.0%) | 51.0 |
| 35 to 50 years | 0 (0.0%) | 0.0 |
| Total | 9 (100.0%) | 13.0 |
Fertility by Age by Marriage Status in Four Bridges
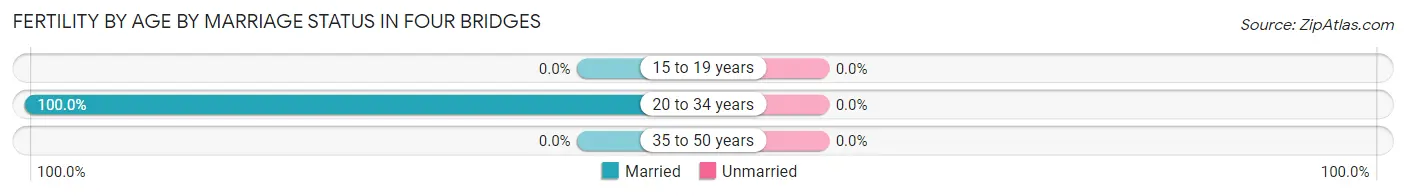
| Age Bracket | Married | Unmarried |
| 15 to 19 years | 0 (0.0%) | 0 (0.0%) |
| 20 to 34 years | 9 (100.0%) | 0 (0.0%) |
| 35 to 50 years | 0 (0.0%) | 0 (0.0%) |
| Total | 9 (100.0%) | 0 (0.0%) |
Fertility by Education in Four Bridges
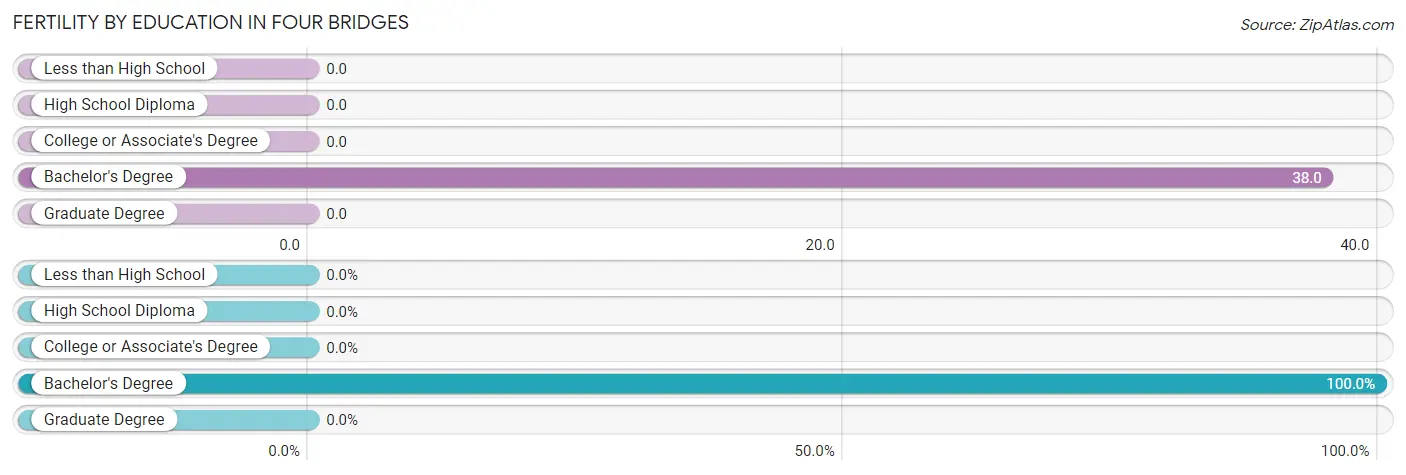
| Educational Attainment | Women with Births | Births / 1,000 Women |
| Less than High School | 0 (0.0%) | 0.0 |
| High School Diploma | 0 (0.0%) | 0.0 |
| College or Associate's Degree | 0 (0.0%) | 0.0 |
| Bachelor's Degree | 9 (100.0%) | 38.0 |
| Graduate Degree | 0 (0.0%) | 0.0 |
| Total | 9 (100.0%) | 13.0 |
Fertility by Education by Marriage Status in Four Bridges
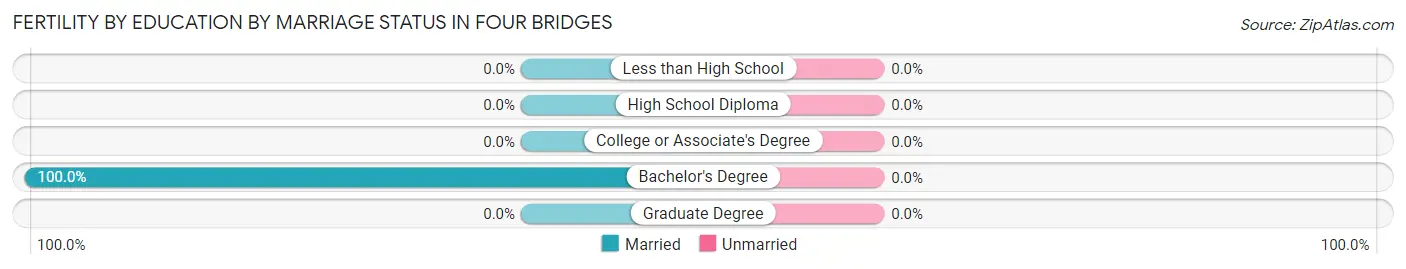
| Educational Attainment | Married | Unmarried |
| Less than High School | 0 (0.0%) | 0 (0.0%) |
| High School Diploma | 0 (0.0%) | 0 (0.0%) |
| College or Associate's Degree | 0 (0.0%) | 0 (0.0%) |
| Bachelor's Degree | 9 (100.0%) | 0 (0.0%) |
| Graduate Degree | 0 (0.0%) | 0 (0.0%) |
| Total | 9 (100.0%) | 0 (0.0%) |
Employment Characteristics in Four Bridges
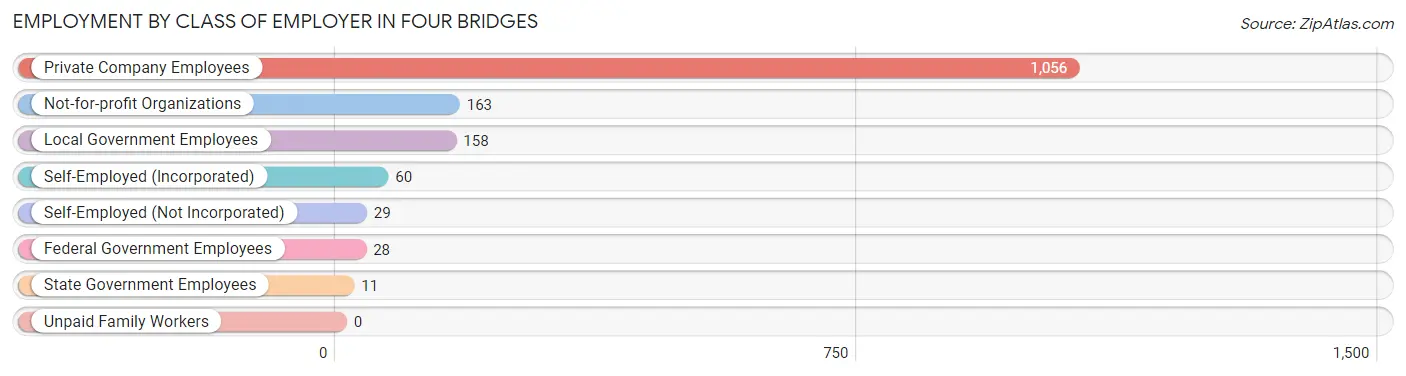
Employment by Class of Employer in Four Bridges
Among the 1,505 employed individuals in Four Bridges, private company employees (1,056 | 70.2%), not-for-profit organizations (163 | 10.8%), and local government employees (158 | 10.5%) make up the most common classes of employment.
| Employer Class | # Employees | % Employees |
| Private Company Employees | 1,056 | 70.2% |
| Self-Employed (Incorporated) | 60 | 4.0% |
| Self-Employed (Not Incorporated) | 29 | 1.9% |
| Not-for-profit Organizations | 163 | 10.8% |
| Local Government Employees | 158 | 10.5% |
| State Government Employees | 11 | 0.7% |
| Federal Government Employees | 28 | 1.9% |
| Unpaid Family Workers | 0 | 0.0% |
| Total | 1,505 | 100.0% |
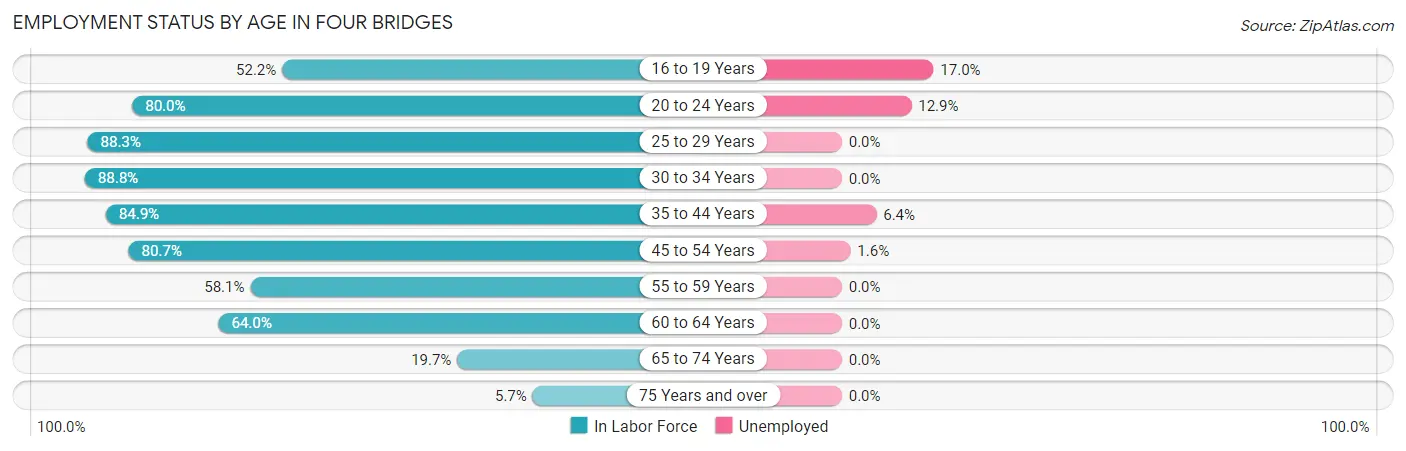
Employment Status by Age in Four Bridges
According to the labor force statistics for Four Bridges, out of the total population over 16 years of age (2,802), 56.4% or 1,580 individuals are in the labor force, with 3.8% or 60 of them unemployed. The age group with the highest labor force participation rate is 30 to 34 years, with 88.8% or 103 individuals in the labor force. Within the labor force, the 16 to 19 years age range has the highest percentage of unemployed individuals, with 17.0% or 8 of them being unemployed.
| Age Bracket | In Labor Force | Unemployed |
| 16 to 19 Years | 47 (52.2%) | 8 (17.0%) |
| 20 to 24 Years | 140 (80.0%) | 18 (12.9%) |
| 25 to 29 Years | 68 (88.3%) | 0 (0.0%) |
| 30 to 34 Years | 103 (88.8%) | 0 (0.0%) |
| 35 to 44 Years | 440 (84.9%) | 28 (6.4%) |
| 45 to 54 Years | 371 (80.7%) | 6 (1.6%) |
| 55 to 59 Years | 136 (58.1%) | 0 (0.0%) |
| 60 to 64 Years | 165 (64.0%) | 0 (0.0%) |
| 65 to 74 Years | 86 (19.7%) | 0 (0.0%) |
| 75 Years and over | 25 (5.7%) | 0 (0.0%) |
| Total | 1,580 (56.4%) | 60 (3.8%) |
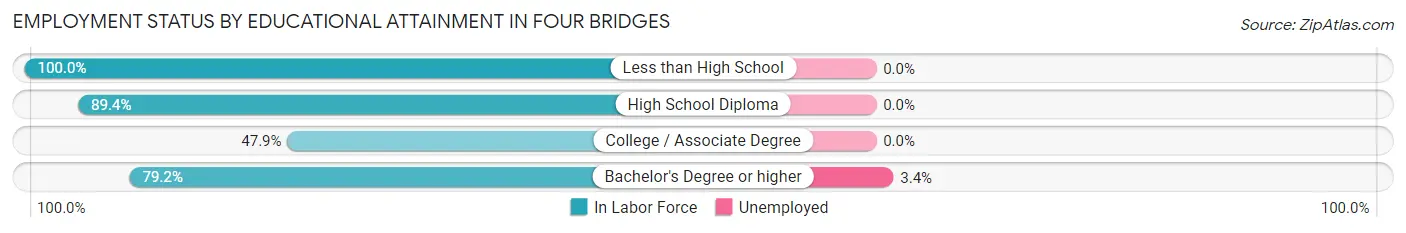
Employment Status by Educational Attainment in Four Bridges
According to labor force statistics for Four Bridges, 77.1% of individuals (1,282) out of the total population between 25 and 64 years of age (1,663) are in the labor force, with 2.7% or 35 of them being unemployed. The group with the highest labor force participation rate are those with the educational attainment of less than high school, with 100.0% or 31 individuals in the labor force. Within the labor force, individuals with bachelor's degree or higher education have the highest percentage of unemployment, with 3.4% or 34 of them being unemployed.
| Educational Attainment | In Labor Force | Unemployed |
| Less than High School | 31 (100.0%) | 0 (0.0%) |
| High School Diploma | 161 (89.4%) | 0 (0.0%) |
| College / Associate Degree | 90 (47.9%) | 0 (0.0%) |
| Bachelor's Degree or higher | 1,001 (79.2%) | 43 (3.4%) |
| Total | 1,282 (77.1%) | 45 (2.7%) |
Employment Occupations by Sex in Four Bridges
Management, Business, Science and Arts Occupations
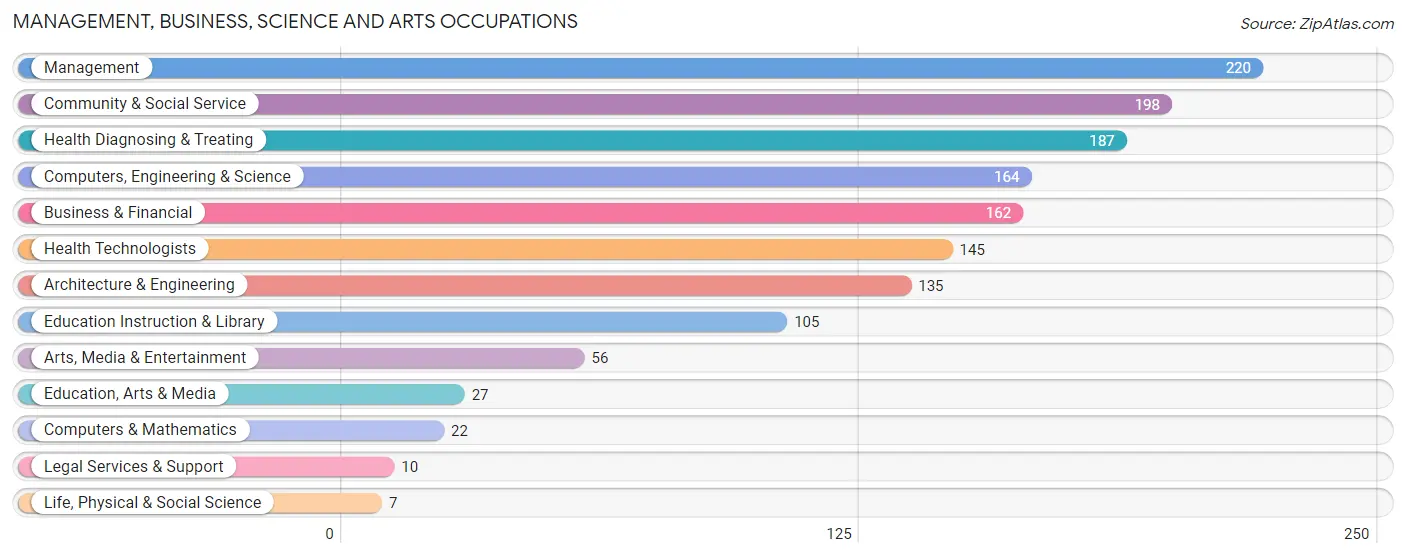
The most common Management, Business, Science and Arts occupations in Four Bridges are Management (220 | 14.5%), Community & Social Service (198 | 13.0%), Health Diagnosing & Treating (187 | 12.3%), Computers, Engineering & Science (164 | 10.8%), and Business & Financial (162 | 10.6%).
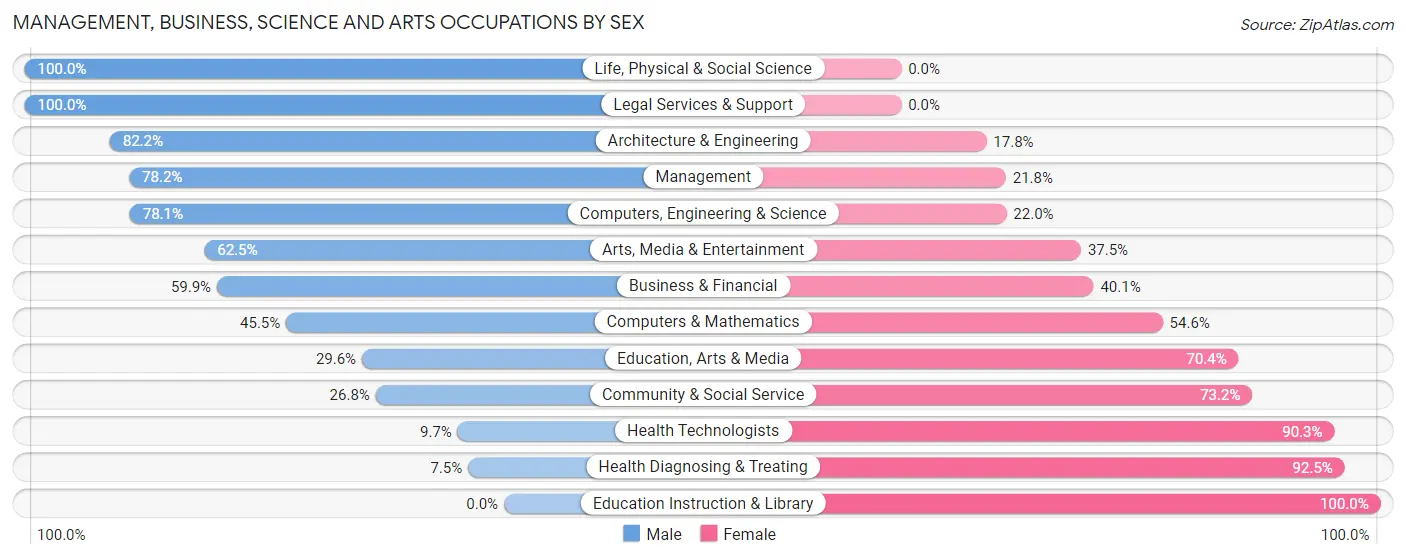
Management, Business, Science and Arts Occupations by Sex
Within the Management, Business, Science and Arts occupations in Four Bridges, the most male-oriented occupations are Life, Physical & Social Science (100.0%), Legal Services & Support (100.0%), and Architecture & Engineering (82.2%), while the most female-oriented occupations are Education Instruction & Library (100.0%), Health Diagnosing & Treating (92.5%), and Health Technologists (90.3%).
| Occupation | Male | Female |
| Management | 172 (78.2%) | 48 (21.8%) |
| Business & Financial | 97 (59.9%) | 65 (40.1%) |
| Computers, Engineering & Science | 128 (78.0%) | 36 (22.0%) |
| Computers & Mathematics | 10 (45.5%) | 12 (54.5%) |
| Architecture & Engineering | 111 (82.2%) | 24 (17.8%) |
| Life, Physical & Social Science | 7 (100.0%) | 0 (0.0%) |
| Community & Social Service | 53 (26.8%) | 145 (73.2%) |
| Education, Arts & Media | 8 (29.6%) | 19 (70.4%) |
| Legal Services & Support | 10 (100.0%) | 0 (0.0%) |
| Education Instruction & Library | 0 (0.0%) | 105 (100.0%) |
| Arts, Media & Entertainment | 35 (62.5%) | 21 (37.5%) |
| Health Diagnosing & Treating | 14 (7.5%) | 173 (92.5%) |
| Health Technologists | 14 (9.7%) | 131 (90.3%) |
| Total (Category) | 464 (49.8%) | 467 (50.2%) |
| Total (Overall) | 864 (56.8%) | 657 (43.2%) |
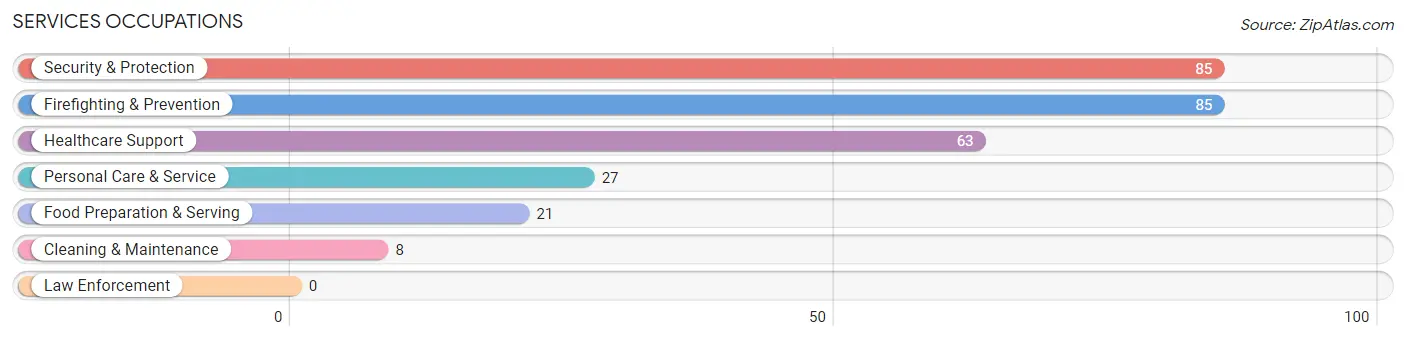
Services Occupations
The most common Services occupations in Four Bridges are Security & Protection (85 | 5.6%), Firefighting & Prevention (85 | 5.6%), Healthcare Support (63 | 4.1%), Personal Care & Service (27 | 1.8%), and Food Preparation & Serving (21 | 1.4%).
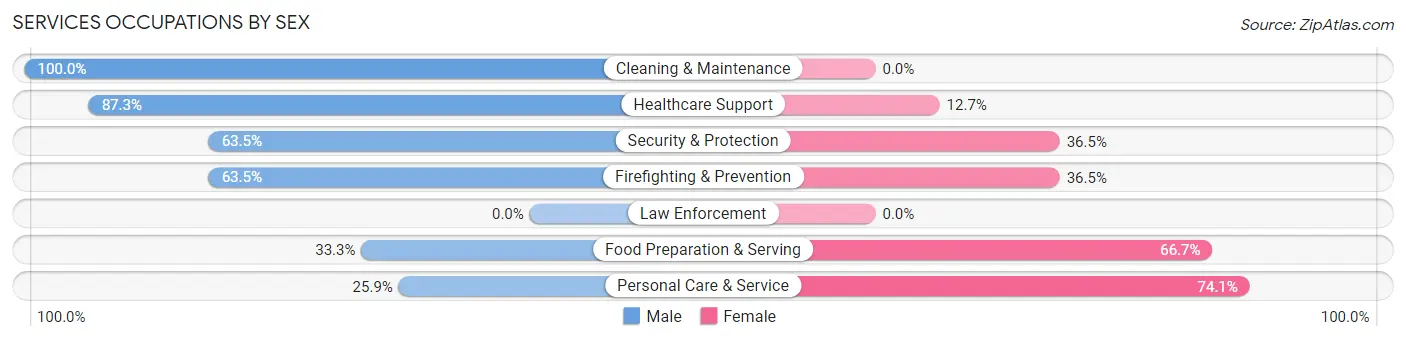
Services Occupations by Sex
Within the Services occupations in Four Bridges, the most male-oriented occupations are Cleaning & Maintenance (100.0%), Healthcare Support (87.3%), and Security & Protection (63.5%), while the most female-oriented occupations are Personal Care & Service (74.1%), Food Preparation & Serving (66.7%), and Security & Protection (36.5%).
| Occupation | Male | Female |
| Healthcare Support | 55 (87.3%) | 8 (12.7%) |
| Security & Protection | 54 (63.5%) | 31 (36.5%) |
| Firefighting & Prevention | 54 (63.5%) | 31 (36.5%) |
| Law Enforcement | 0 (0.0%) | 0 (0.0%) |
| Food Preparation & Serving | 7 (33.3%) | 14 (66.7%) |
| Cleaning & Maintenance | 8 (100.0%) | 0 (0.0%) |
| Personal Care & Service | 7 (25.9%) | 20 (74.1%) |
| Total (Category) | 131 (64.2%) | 73 (35.8%) |
| Total (Overall) | 864 (56.8%) | 657 (43.2%) |
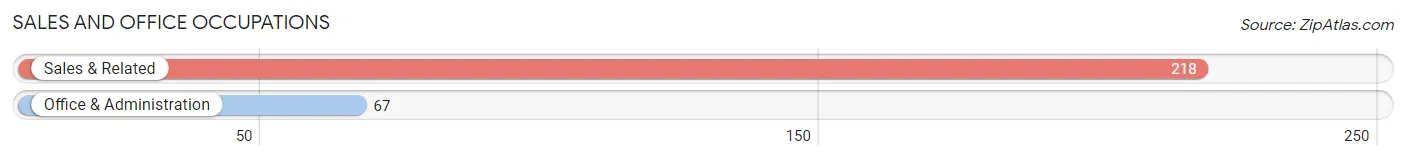
Sales and Office Occupations
The most common Sales and Office occupations in Four Bridges are Sales & Related (218 | 14.3%), and Office & Administration (67 | 4.4%).
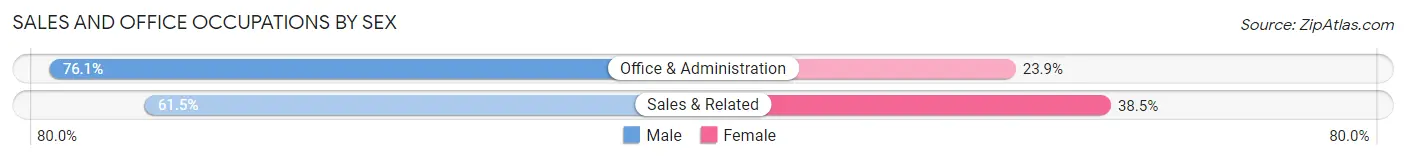
Sales and Office Occupations by Sex
| Occupation | Male | Female |
| Sales & Related | 134 (61.5%) | 84 (38.5%) |
| Office & Administration | 51 (76.1%) | 16 (23.9%) |
| Total (Category) | 185 (64.9%) | 100 (35.1%) |
| Total (Overall) | 864 (56.8%) | 657 (43.2%) |
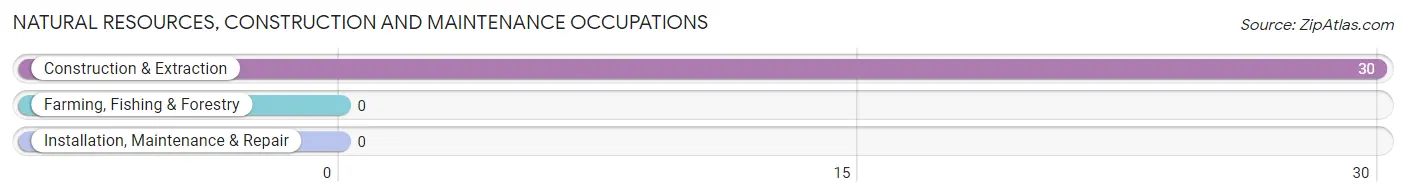
Natural Resources, Construction and Maintenance Occupations
The most common Natural Resources, Construction and Maintenance occupations in Four Bridges are , and Construction & Extraction (30 | 2.0%).
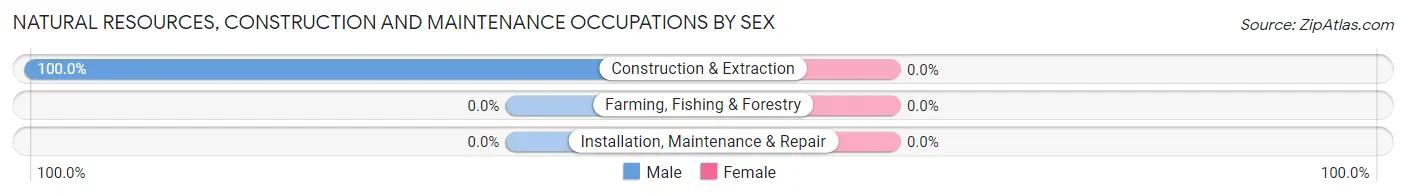
Natural Resources, Construction and Maintenance Occupations by Sex
| Occupation | Male | Female |
| Farming, Fishing & Forestry | 0 (0.0%) | 0 (0.0%) |
| Construction & Extraction | 30 (100.0%) | 0 (0.0%) |
| Installation, Maintenance & Repair | 0 (0.0%) | 0 (0.0%) |
| Total (Category) | 30 (100.0%) | 0 (0.0%) |
| Total (Overall) | 864 (56.8%) | 657 (43.2%) |
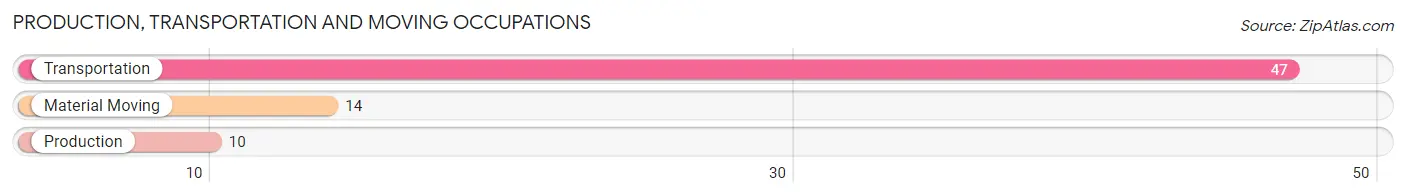
Production, Transportation and Moving Occupations
The most common Production, Transportation and Moving occupations in Four Bridges are Transportation (47 | 3.1%), Material Moving (14 | 0.9%), and Production (10 | 0.7%).
Production, Transportation and Moving Occupations by Sex
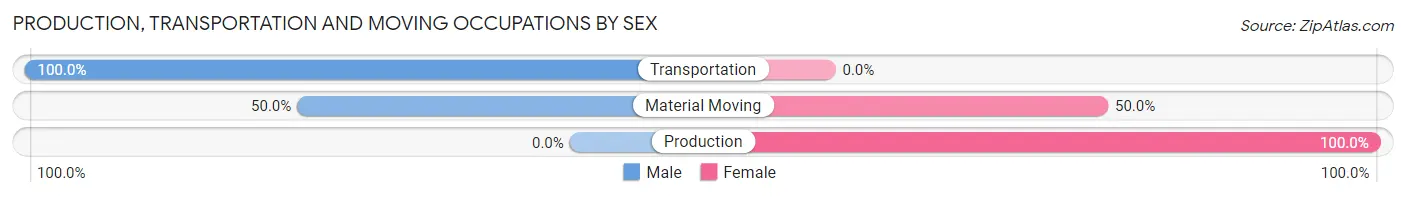
| Occupation | Male | Female |
| Production | 0 (0.0%) | 10 (100.0%) |
| Transportation | 47 (100.0%) | 0 (0.0%) |
| Material Moving | 7 (50.0%) | 7 (50.0%) |
| Total (Category) | 54 (76.1%) | 17 (23.9%) |
| Total (Overall) | 864 (56.8%) | 657 (43.2%) |
Employment Industries by Sex in Four Bridges
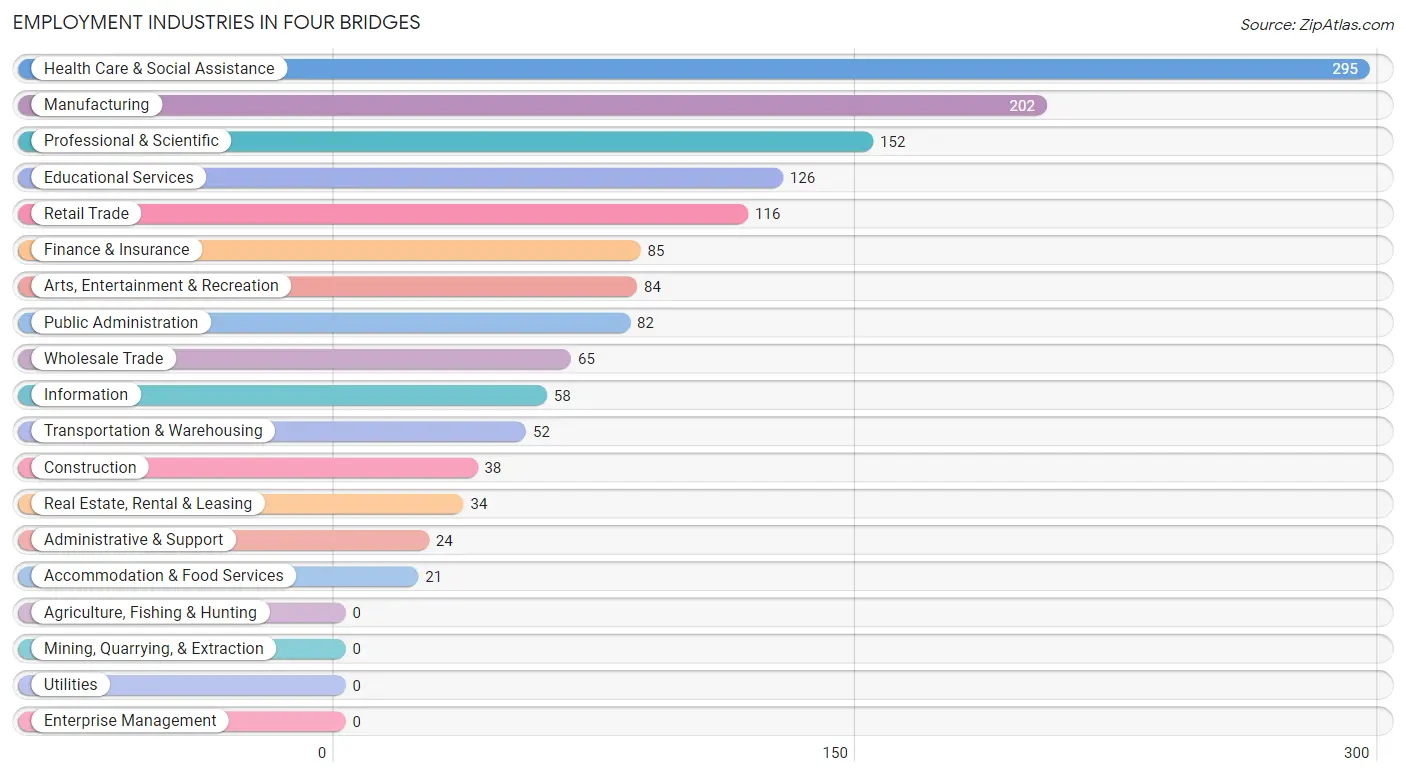
Employment Industries in Four Bridges
The major employment industries in Four Bridges include Health Care & Social Assistance (295 | 19.4%), Manufacturing (202 | 13.3%), Professional & Scientific (152 | 10.0%), Educational Services (126 | 8.3%), and Retail Trade (116 | 7.6%).
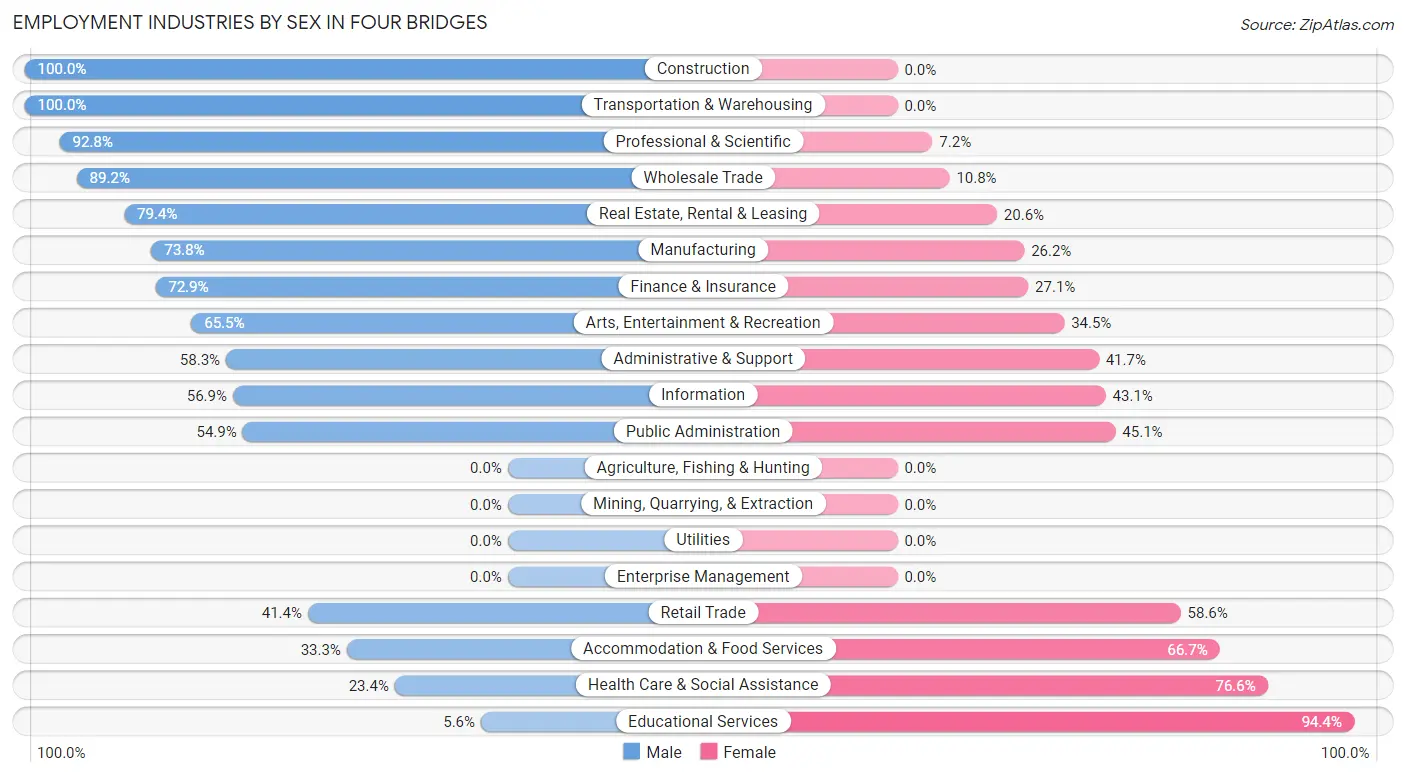
Employment Industries by Sex in Four Bridges
The Four Bridges industries that see more men than women are Construction (100.0%), Transportation & Warehousing (100.0%), and Professional & Scientific (92.8%), whereas the industries that tend to have a higher number of women are Educational Services (94.4%), Health Care & Social Assistance (76.6%), and Accommodation & Food Services (66.7%).
| Industry | Male | Female |
| Agriculture, Fishing & Hunting | 0 (0.0%) | 0 (0.0%) |
| Mining, Quarrying, & Extraction | 0 (0.0%) | 0 (0.0%) |
| Construction | 38 (100.0%) | 0 (0.0%) |
| Manufacturing | 149 (73.8%) | 53 (26.2%) |
| Wholesale Trade | 58 (89.2%) | 7 (10.8%) |
| Retail Trade | 48 (41.4%) | 68 (58.6%) |
| Transportation & Warehousing | 52 (100.0%) | 0 (0.0%) |
| Utilities | 0 (0.0%) | 0 (0.0%) |
| Information | 33 (56.9%) | 25 (43.1%) |
| Finance & Insurance | 62 (72.9%) | 23 (27.1%) |
| Real Estate, Rental & Leasing | 27 (79.4%) | 7 (20.6%) |
| Professional & Scientific | 141 (92.8%) | 11 (7.2%) |
| Enterprise Management | 0 (0.0%) | 0 (0.0%) |
| Administrative & Support | 14 (58.3%) | 10 (41.7%) |
| Educational Services | 7 (5.6%) | 119 (94.4%) |
| Health Care & Social Assistance | 69 (23.4%) | 226 (76.6%) |
| Arts, Entertainment & Recreation | 55 (65.5%) | 29 (34.5%) |
| Accommodation & Food Services | 7 (33.3%) | 14 (66.7%) |
| Public Administration | 45 (54.9%) | 37 (45.1%) |
| Total | 864 (56.8%) | 657 (43.2%) |
Education in Four Bridges
School Enrollment in Four Bridges
The most common levels of schooling among the 841 students in Four Bridges are middle school (291 | 34.6%), elementary school (232 | 27.6%), and high school (159 | 18.9%).
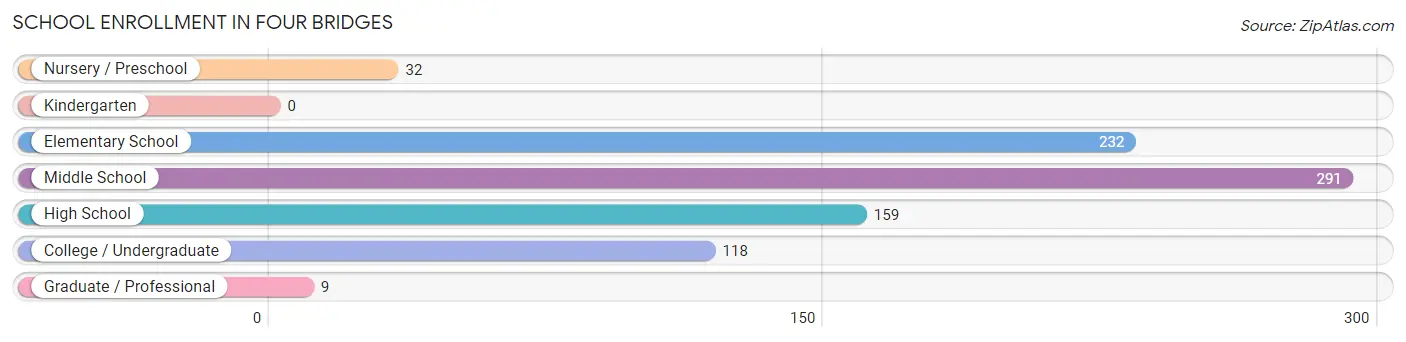
| School Level | # Students | % Students |
| Nursery / Preschool | 32 | 3.8% |
| Kindergarten | 0 | 0.0% |
| Elementary School | 232 | 27.6% |
| Middle School | 291 | 34.6% |
| High School | 159 | 18.9% |
| College / Undergraduate | 118 | 14.0% |
| Graduate / Professional | 9 | 1.1% |
| Total | 841 | 100.0% |
School Enrollment by Age by Funding Source in Four Bridges
Out of a total of 841 students who are enrolled in schools in Four Bridges, 211 (25.1%) attend a private institution, while the remaining 630 (74.9%) are enrolled in public schools. The age group of 18 to 19 year olds has the highest likelihood of being enrolled in private schools, with 18 (56.2% in the age bracket) enrolled. Conversely, the age group of 3 to 4 year olds has the lowest likelihood of being enrolled in a private school, with 32 (100.0% in the age bracket) attending a public institution.
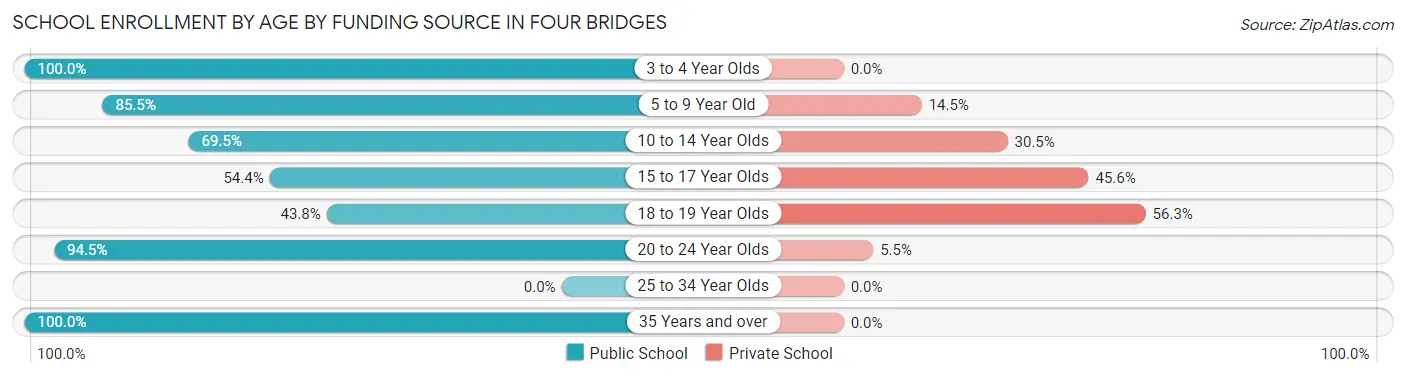
| Age Bracket | Public School | Private School |
| 3 to 4 Year Olds | 32 (100.0%) | 0 (0.0%) |
| 5 to 9 Year Old | 153 (85.5%) | 26 (14.5%) |
| 10 to 14 Year Olds | 248 (69.5%) | 109 (30.5%) |
| 15 to 17 Year Olds | 62 (54.4%) | 52 (45.6%) |
| 18 to 19 Year Olds | 14 (43.8%) | 18 (56.2%) |
| 20 to 24 Year Olds | 103 (94.5%) | 6 (5.5%) |
| 25 to 34 Year Olds | 0 (0.0%) | 0 (0.0%) |
| 35 Years and over | 18 (100.0%) | 0 (0.0%) |
| Total | 630 (74.9%) | 211 (25.1%) |
Educational Attainment by Field of Study in Four Bridges
Business (471 | 28.4%), education (328 | 19.8%), science & technology (231 | 13.9%), engineering (205 | 12.3%), and arts & humanities (89 | 5.4%) are the most common fields of study among 1,660 individuals in Four Bridges who have obtained a bachelor's degree or higher.
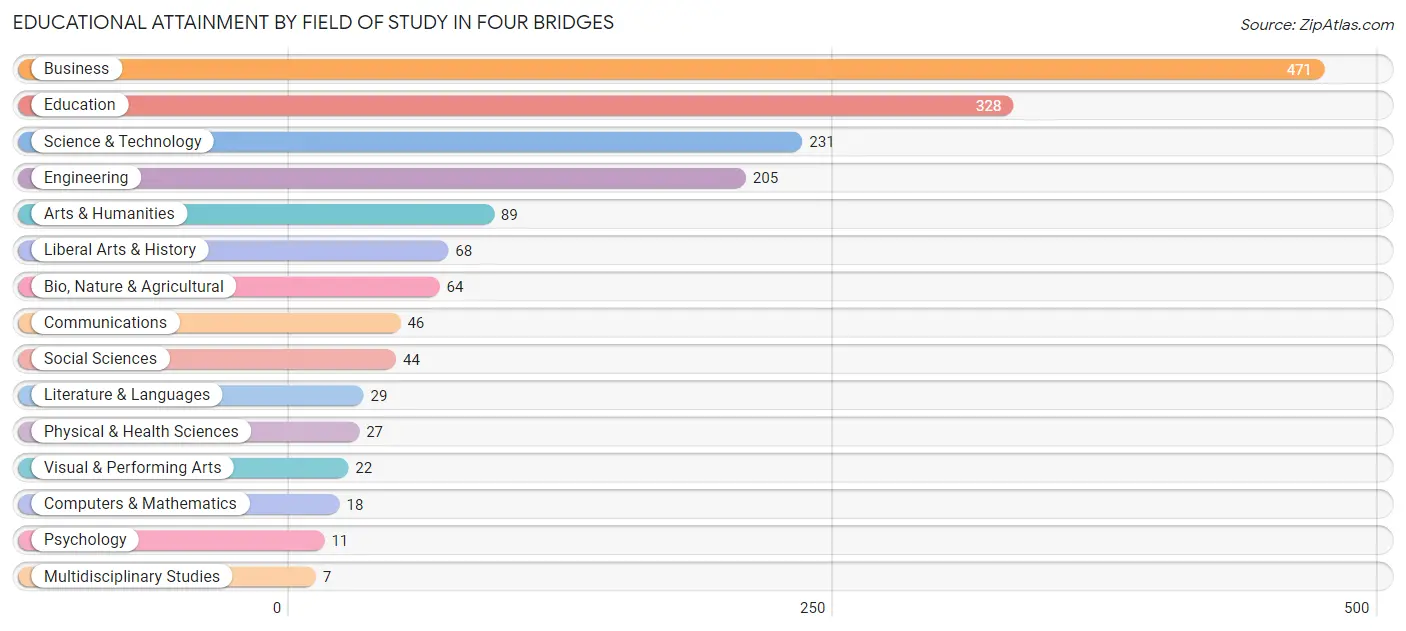
| Field of Study | # Graduates | % Graduates |
| Computers & Mathematics | 18 | 1.1% |
| Bio, Nature & Agricultural | 64 | 3.9% |
| Physical & Health Sciences | 27 | 1.6% |
| Psychology | 11 | 0.7% |
| Social Sciences | 44 | 2.6% |
| Engineering | 205 | 12.3% |
| Multidisciplinary Studies | 7 | 0.4% |
| Science & Technology | 231 | 13.9% |
| Business | 471 | 28.4% |
| Education | 328 | 19.8% |
| Literature & Languages | 29 | 1.8% |
| Liberal Arts & History | 68 | 4.1% |
| Visual & Performing Arts | 22 | 1.3% |
| Communications | 46 | 2.8% |
| Arts & Humanities | 89 | 5.4% |
| Total | 1,660 | 100.0% |
Transportation & Commute in Four Bridges
Vehicle Availability by Sex in Four Bridges
The most prevalent vehicle ownership categories in Four Bridges are males with 2 vehicles (469, accounting for 55.3%) and females with 2 vehicles (335, making up 71.4%).
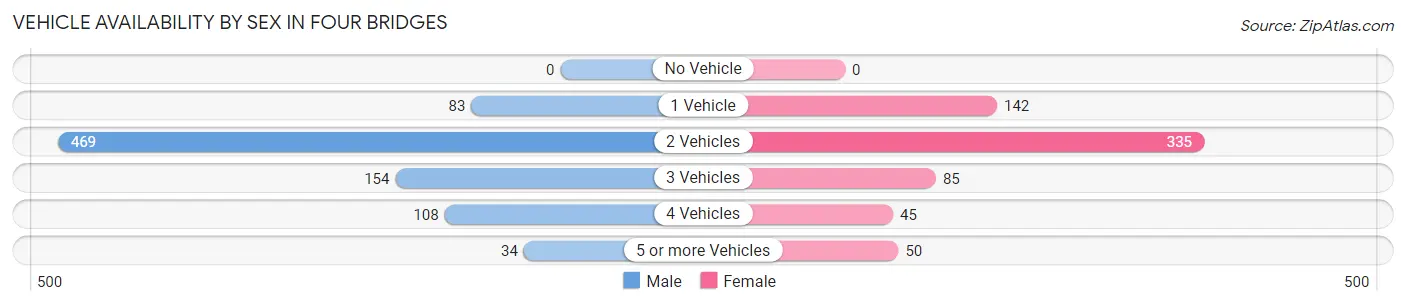
| Vehicles Available | Male | Female |
| No Vehicle | 0 (0.0%) | 0 (0.0%) |
| 1 Vehicle | 83 (9.8%) | 142 (21.6%) |
| 2 Vehicles | 469 (55.3%) | 335 (51.0%) |
| 3 Vehicles | 154 (18.2%) | 85 (12.9%) |
| 4 Vehicles | 108 (12.7%) | 45 (6.9%) |
| 5 or more Vehicles | 34 (4.0%) | 50 (7.6%) |
| Total | 848 (100.0%) | 657 (100.0%) |
Commute Time in Four Bridges
The most frequently occuring commute durations in Four Bridges are 15 to 19 minutes (213 commuters, 18.5%), 30 to 34 minutes (163 commuters, 14.2%), and 25 to 29 minutes (143 commuters, 12.4%).
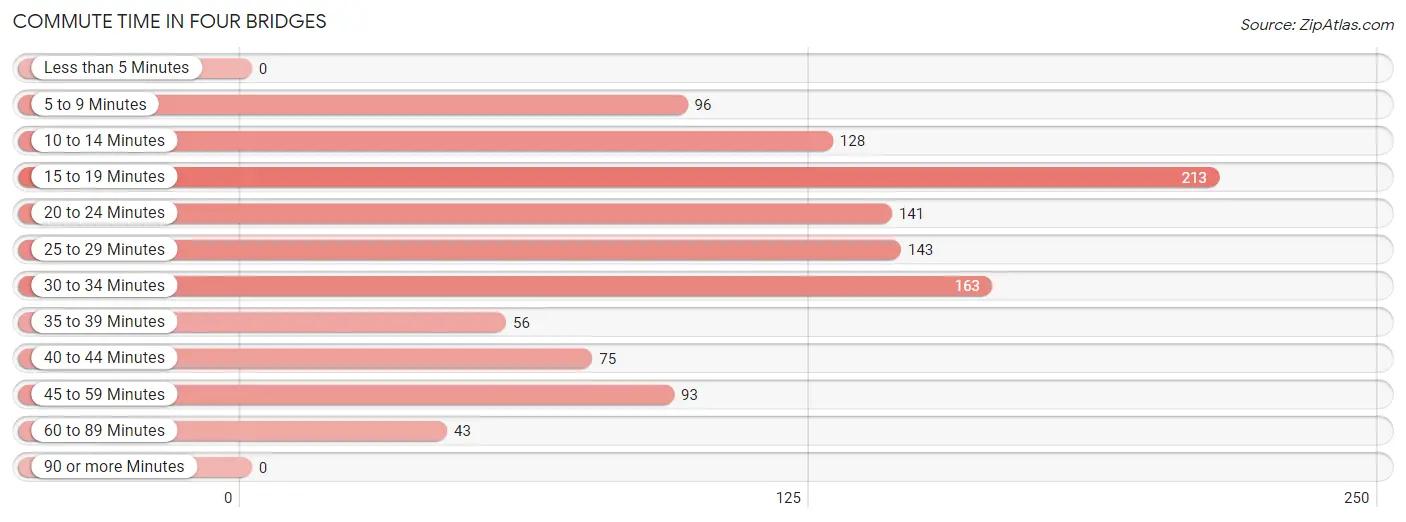
| Commute Time | # Commuters | % Commuters |
| Less than 5 Minutes | 0 | 0.0% |
| 5 to 9 Minutes | 96 | 8.3% |
| 10 to 14 Minutes | 128 | 11.1% |
| 15 to 19 Minutes | 213 | 18.5% |
| 20 to 24 Minutes | 141 | 12.2% |
| 25 to 29 Minutes | 143 | 12.4% |
| 30 to 34 Minutes | 163 | 14.2% |
| 35 to 39 Minutes | 56 | 4.9% |
| 40 to 44 Minutes | 75 | 6.5% |
| 45 to 59 Minutes | 93 | 8.1% |
| 60 to 89 Minutes | 43 | 3.7% |
| 90 or more Minutes | 0 | 0.0% |
Commute Time by Sex in Four Bridges
The most common commute times in Four Bridges are 20 to 24 minutes (101 commuters, 17.0%) for males and 15 to 19 minutes (186 commuters, 33.5%) for females.
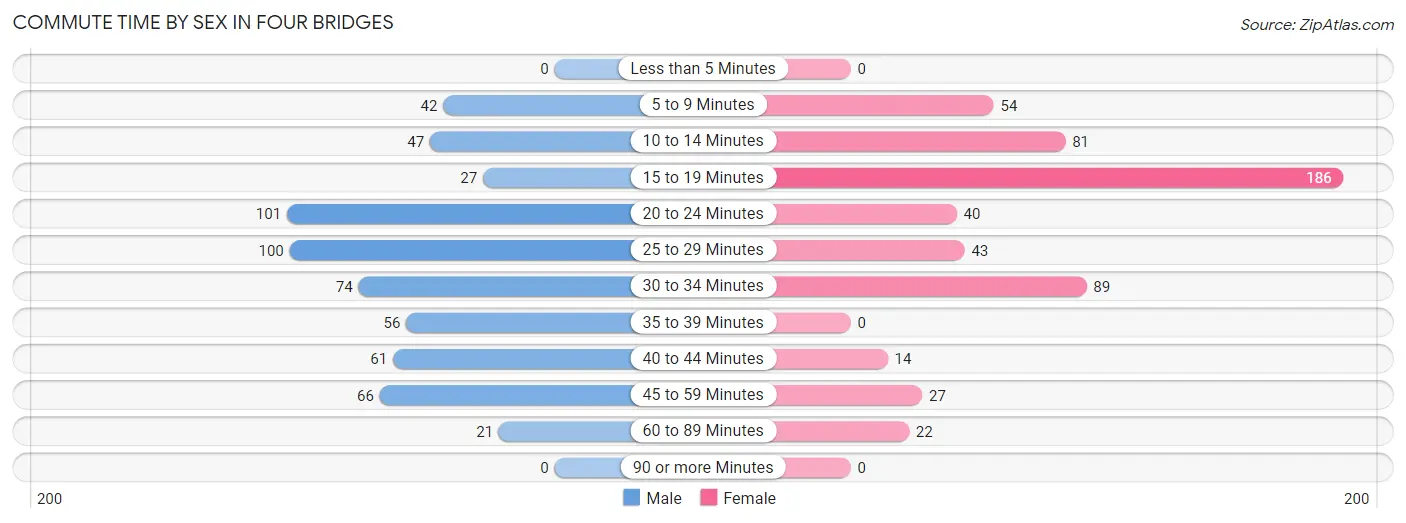
| Commute Time | Male | Female |
| Less than 5 Minutes | 0 (0.0%) | 0 (0.0%) |
| 5 to 9 Minutes | 42 (7.1%) | 54 (9.7%) |
| 10 to 14 Minutes | 47 (7.9%) | 81 (14.6%) |
| 15 to 19 Minutes | 27 (4.5%) | 186 (33.5%) |
| 20 to 24 Minutes | 101 (17.0%) | 40 (7.2%) |
| 25 to 29 Minutes | 100 (16.8%) | 43 (7.7%) |
| 30 to 34 Minutes | 74 (12.4%) | 89 (16.0%) |
| 35 to 39 Minutes | 56 (9.4%) | 0 (0.0%) |
| 40 to 44 Minutes | 61 (10.2%) | 14 (2.5%) |
| 45 to 59 Minutes | 66 (11.1%) | 27 (4.9%) |
| 60 to 89 Minutes | 21 (3.5%) | 22 (4.0%) |
| 90 or more Minutes | 0 (0.0%) | 0 (0.0%) |
Time of Departure to Work by Sex in Four Bridges
The most frequent times of departure to work in Four Bridges are 7:00 AM to 7:29 AM (187, 31.4%) for males and 11:00 AM to 11:59 AM (119, 21.4%) for females.
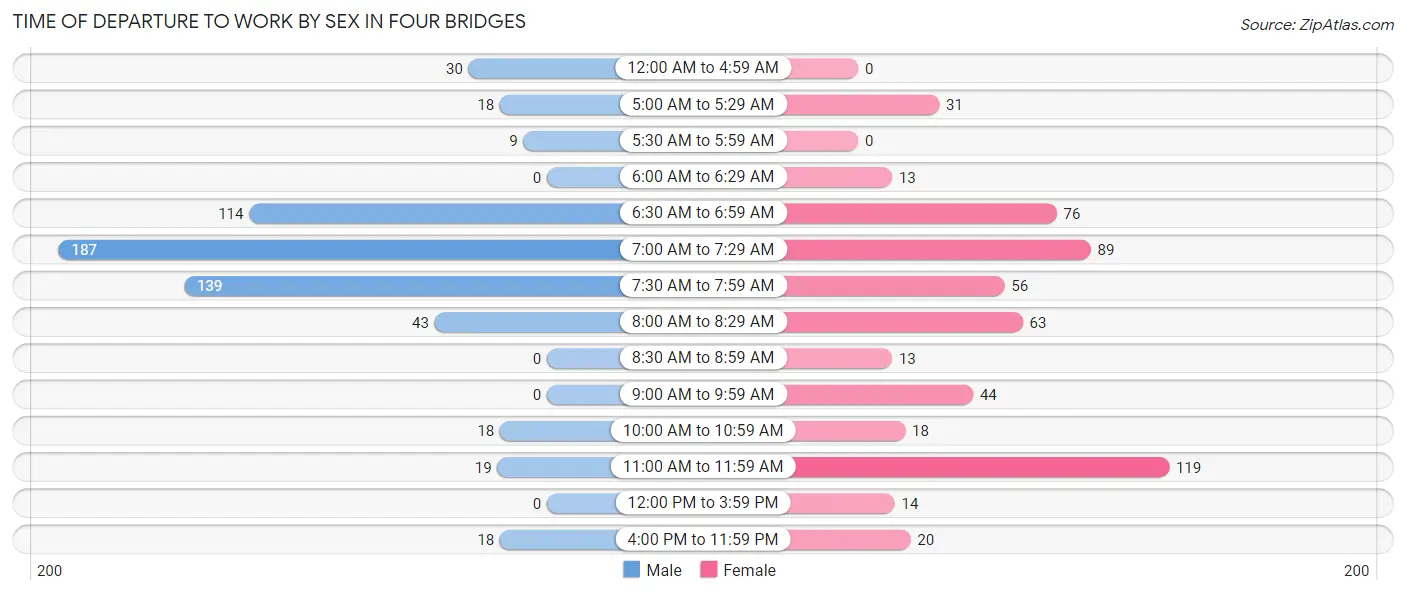
| Time of Departure | Male | Female |
| 12:00 AM to 4:59 AM | 30 (5.0%) | 0 (0.0%) |
| 5:00 AM to 5:29 AM | 18 (3.0%) | 31 (5.6%) |
| 5:30 AM to 5:59 AM | 9 (1.5%) | 0 (0.0%) |
| 6:00 AM to 6:29 AM | 0 (0.0%) | 13 (2.3%) |
| 6:30 AM to 6:59 AM | 114 (19.2%) | 76 (13.7%) |
| 7:00 AM to 7:29 AM | 187 (31.4%) | 89 (16.0%) |
| 7:30 AM to 7:59 AM | 139 (23.4%) | 56 (10.1%) |
| 8:00 AM to 8:29 AM | 43 (7.2%) | 63 (11.3%) |
| 8:30 AM to 8:59 AM | 0 (0.0%) | 13 (2.3%) |
| 9:00 AM to 9:59 AM | 0 (0.0%) | 44 (7.9%) |
| 10:00 AM to 10:59 AM | 18 (3.0%) | 18 (3.2%) |
| 11:00 AM to 11:59 AM | 19 (3.2%) | 119 (21.4%) |
| 12:00 PM to 3:59 PM | 0 (0.0%) | 14 (2.5%) |
| 4:00 PM to 11:59 PM | 18 (3.0%) | 20 (3.6%) |
| Total | 595 (100.0%) | 556 (100.0%) |
Housing Occupancy in Four Bridges
Occupancy by Ownership in Four Bridges
Of the total 1,312 dwellings in Four Bridges, owner-occupied units account for 971 (74.0%), while renter-occupied units make up 341 (26.0%).
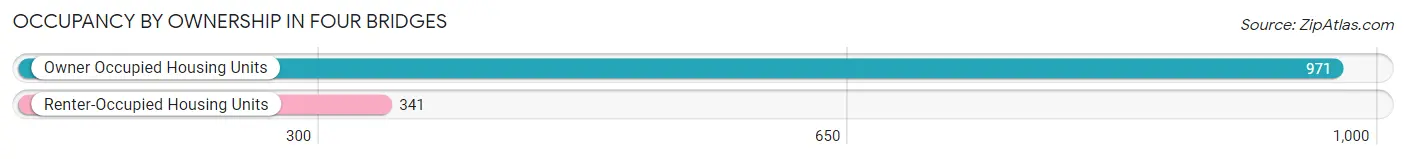
| Occupancy | # Housing Units | % Housing Units |
| Owner Occupied Housing Units | 971 | 74.0% |
| Renter-Occupied Housing Units | 341 | 26.0% |
| Total Occupied Housing Units | 1,312 | 100.0% |
Occupancy by Household Size in Four Bridges
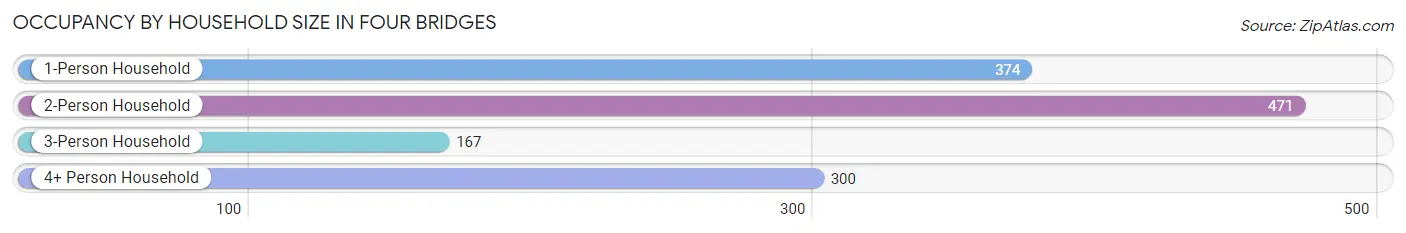
| Household Size | # Housing Units | % Housing Units |
| 1-Person Household | 374 | 28.5% |
| 2-Person Household | 471 | 35.9% |
| 3-Person Household | 167 | 12.7% |
| 4+ Person Household | 300 | 22.9% |
| Total Housing Units | 1,312 | 100.0% |
Occupancy by Ownership by Household Size in Four Bridges
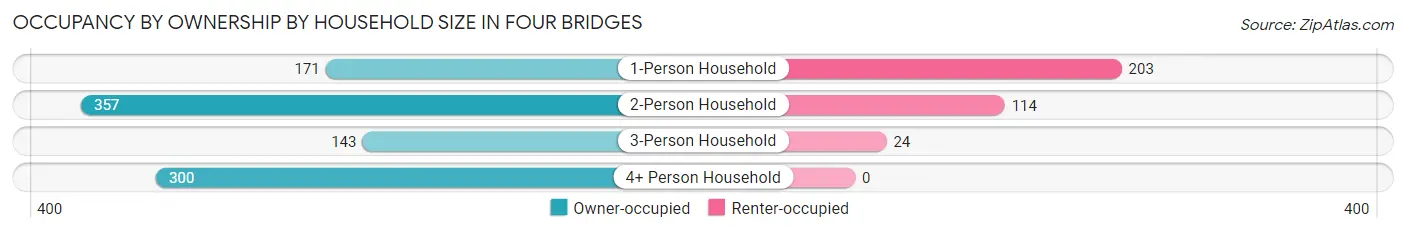
| Household Size | Owner-occupied | Renter-occupied |
| 1-Person Household | 171 (45.7%) | 203 (54.3%) |
| 2-Person Household | 357 (75.8%) | 114 (24.2%) |
| 3-Person Household | 143 (85.6%) | 24 (14.4%) |
| 4+ Person Household | 300 (100.0%) | 0 (0.0%) |
| Total Housing Units | 971 (74.0%) | 341 (26.0%) |
Occupancy by Educational Attainment in Four Bridges
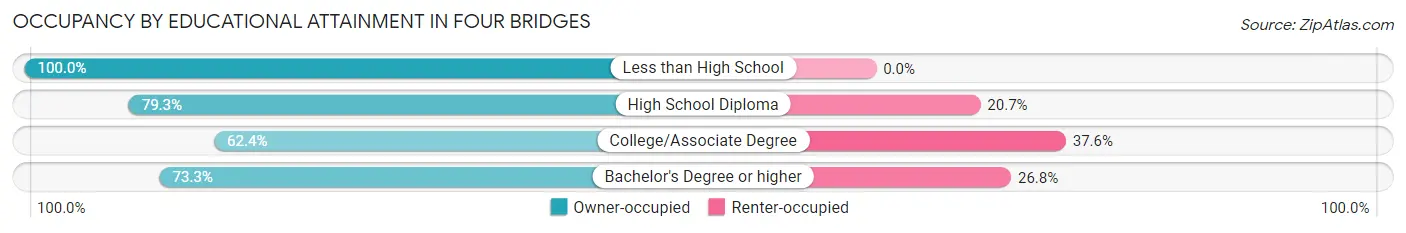
| Household Size | Owner-occupied | Renter-occupied |
| Less than High School | 44 (100.0%) | 0 (0.0%) |
| High School Diploma | 165 (79.3%) | 43 (20.7%) |
| College/Associate Degree | 83 (62.4%) | 50 (37.6%) |
| Bachelor's Degree or higher | 679 (73.3%) | 248 (26.8%) |
Occupancy by Age of Householder in Four Bridges
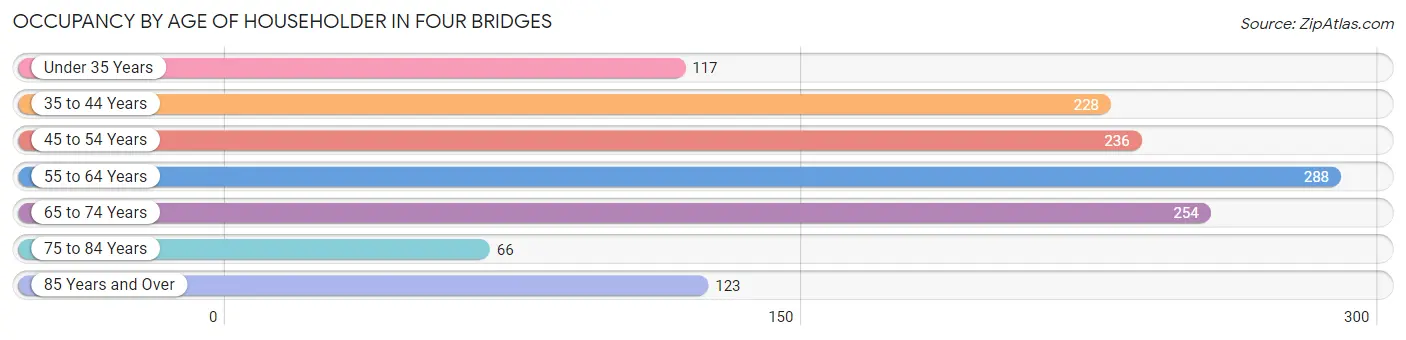
| Age Bracket | # Households | % Households |
| Under 35 Years | 117 | 8.9% |
| 35 to 44 Years | 228 | 17.4% |
| 45 to 54 Years | 236 | 18.0% |
| 55 to 64 Years | 288 | 22.0% |
| 65 to 74 Years | 254 | 19.4% |
| 75 to 84 Years | 66 | 5.0% |
| 85 Years and Over | 123 | 9.4% |
| Total | 1,312 | 100.0% |
Housing Finances in Four Bridges
Median Income by Occupancy in Four Bridges
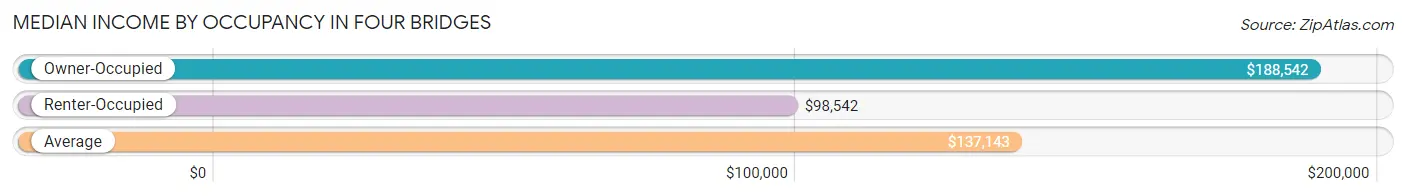
| Occupancy Type | # Households | Median Income |
| Owner-Occupied | 971 (74.0%) | $188,542 |
| Renter-Occupied | 341 (26.0%) | $98,542 |
| Average | 1,312 (100.0%) | $137,143 |
Occupancy by Householder Income Bracket in Four Bridges
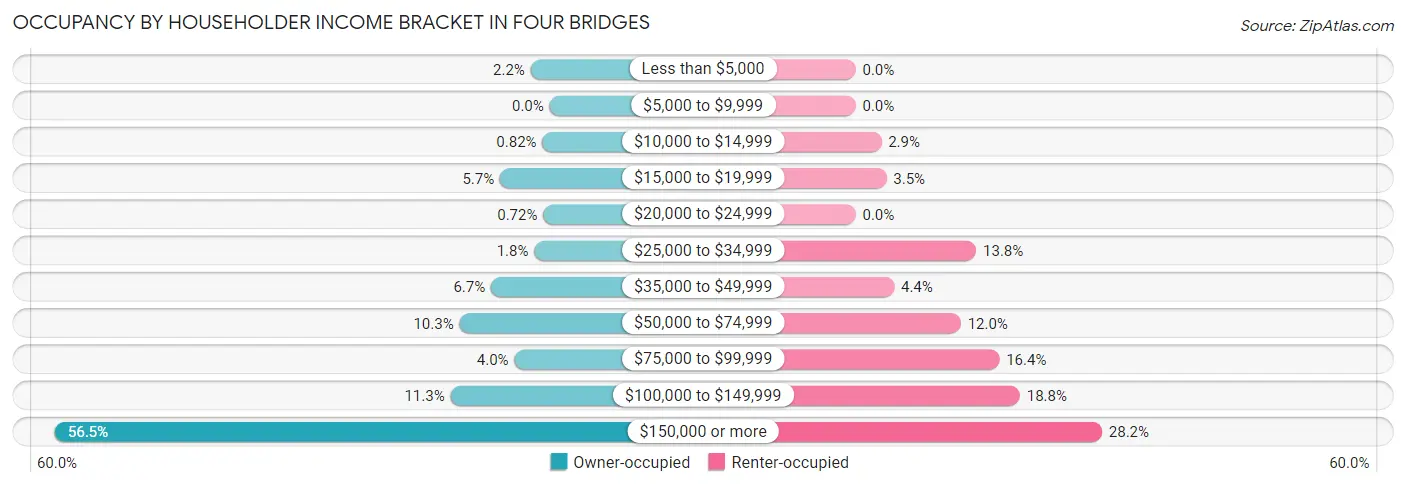
| Income Bracket | Owner-occupied | Renter-occupied |
| Less than $5,000 | 21 (2.2%) | 0 (0.0%) |
| $5,000 to $9,999 | 0 (0.0%) | 0 (0.0%) |
| $10,000 to $14,999 | 8 (0.8%) | 10 (2.9%) |
| $15,000 to $19,999 | 55 (5.7%) | 12 (3.5%) |
| $20,000 to $24,999 | 7 (0.7%) | 0 (0.0%) |
| $25,000 to $34,999 | 17 (1.8%) | 47 (13.8%) |
| $35,000 to $49,999 | 65 (6.7%) | 15 (4.4%) |
| $50,000 to $74,999 | 100 (10.3%) | 41 (12.0%) |
| $75,000 to $99,999 | 39 (4.0%) | 56 (16.4%) |
| $100,000 to $149,999 | 110 (11.3%) | 64 (18.8%) |
| $150,000 or more | 549 (56.5%) | 96 (28.1%) |
| Total | 971 (100.0%) | 341 (100.0%) |
Monthly Housing Cost Tiers in Four Bridges
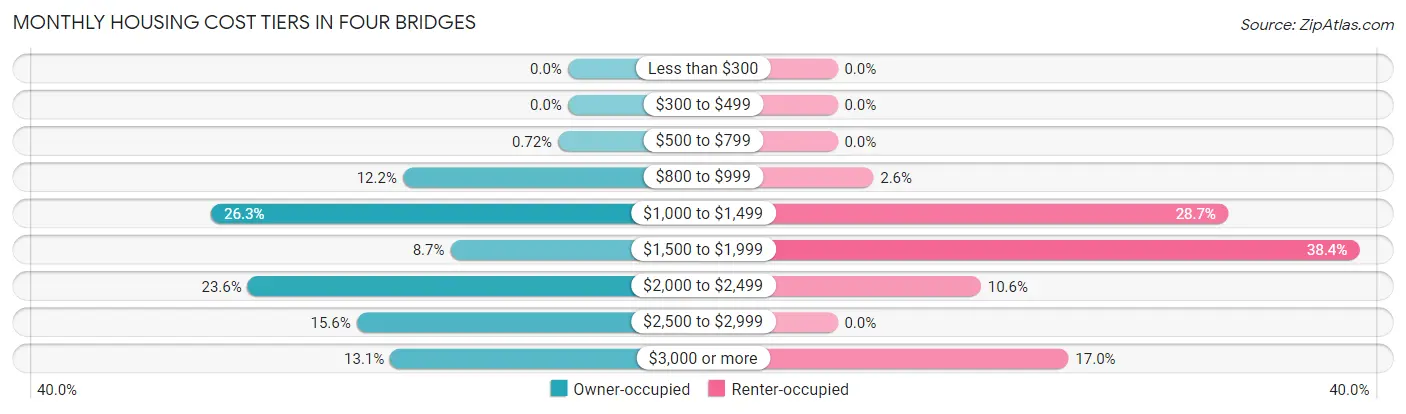
| Monthly Cost | Owner-occupied | Renter-occupied |
| Less than $300 | 0 (0.0%) | 0 (0.0%) |
| $300 to $499 | 0 (0.0%) | 0 (0.0%) |
| $500 to $799 | 7 (0.7%) | 0 (0.0%) |
| $800 to $999 | 118 (12.1%) | 9 (2.6%) |
| $1,000 to $1,499 | 255 (26.3%) | 98 (28.7%) |
| $1,500 to $1,999 | 84 (8.6%) | 131 (38.4%) |
| $2,000 to $2,499 | 229 (23.6%) | 36 (10.6%) |
| $2,500 to $2,999 | 151 (15.5%) | 0 (0.0%) |
| $3,000 or more | 127 (13.1%) | 58 (17.0%) |
| Total | 971 (100.0%) | 341 (100.0%) |
Physical Housing Characteristics in Four Bridges
Housing Structures in Four Bridges
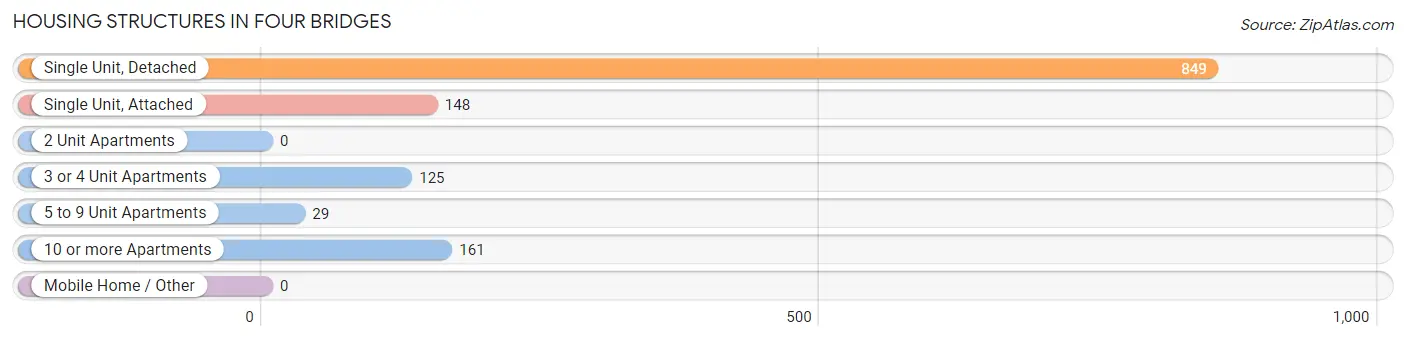
| Structure Type | # Housing Units | % Housing Units |
| Single Unit, Detached | 849 | 64.7% |
| Single Unit, Attached | 148 | 11.3% |
| 2 Unit Apartments | 0 | 0.0% |
| 3 or 4 Unit Apartments | 125 | 9.5% |
| 5 to 9 Unit Apartments | 29 | 2.2% |
| 10 or more Apartments | 161 | 12.3% |
| Mobile Home / Other | 0 | 0.0% |
| Total | 1,312 | 100.0% |
Housing Structures by Occupancy in Four Bridges
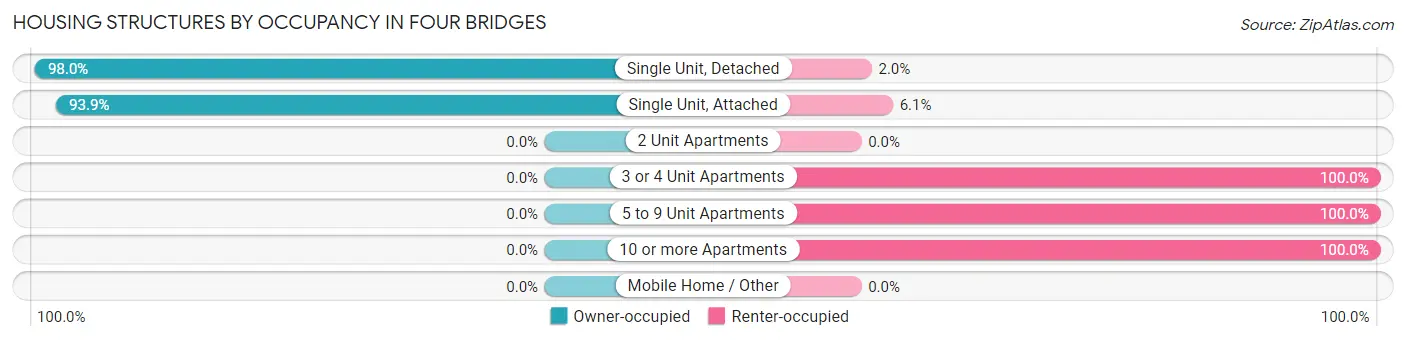
| Structure Type | Owner-occupied | Renter-occupied |
| Single Unit, Detached | 832 (98.0%) | 17 (2.0%) |
| Single Unit, Attached | 139 (93.9%) | 9 (6.1%) |
| 2 Unit Apartments | 0 (0.0%) | 0 (0.0%) |
| 3 or 4 Unit Apartments | 0 (0.0%) | 125 (100.0%) |
| 5 to 9 Unit Apartments | 0 (0.0%) | 29 (100.0%) |
| 10 or more Apartments | 0 (0.0%) | 161 (100.0%) |
| Mobile Home / Other | 0 (0.0%) | 0 (0.0%) |
| Total | 971 (74.0%) | 341 (26.0%) |
Housing Structures by Number of Rooms in Four Bridges
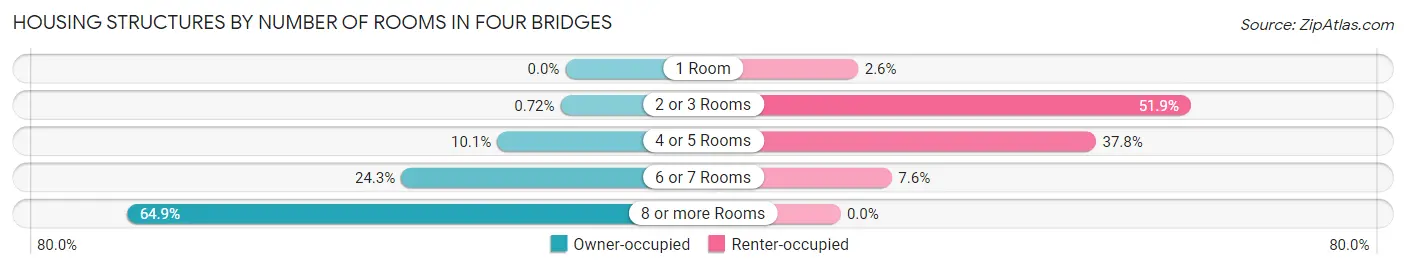
| Number of Rooms | Owner-occupied | Renter-occupied |
| 1 Room | 0 (0.0%) | 9 (2.6%) |
| 2 or 3 Rooms | 7 (0.7%) | 177 (51.9%) |
| 4 or 5 Rooms | 98 (10.1%) | 129 (37.8%) |
| 6 or 7 Rooms | 236 (24.3%) | 26 (7.6%) |
| 8 or more Rooms | 630 (64.9%) | 0 (0.0%) |
| Total | 971 (100.0%) | 341 (100.0%) |
Housing Structure by Heating Type in Four Bridges
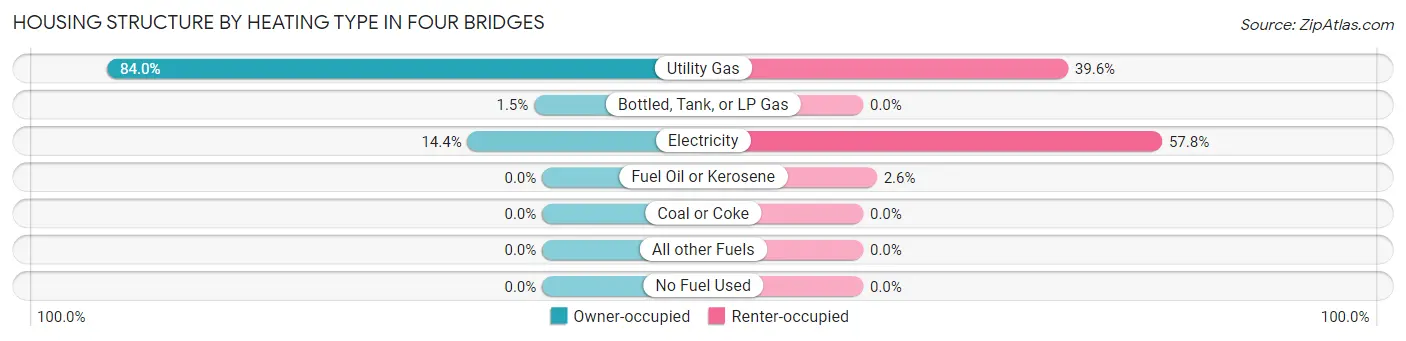
| Heating Type | Owner-occupied | Renter-occupied |
| Utility Gas | 816 (84.0%) | 135 (39.6%) |
| Bottled, Tank, or LP Gas | 15 (1.5%) | 0 (0.0%) |
| Electricity | 140 (14.4%) | 197 (57.8%) |
| Fuel Oil or Kerosene | 0 (0.0%) | 9 (2.6%) |
| Coal or Coke | 0 (0.0%) | 0 (0.0%) |
| All other Fuels | 0 (0.0%) | 0 (0.0%) |
| No Fuel Used | 0 (0.0%) | 0 (0.0%) |
| Total | 971 (100.0%) | 341 (100.0%) |
Household Vehicle Usage in Four Bridges
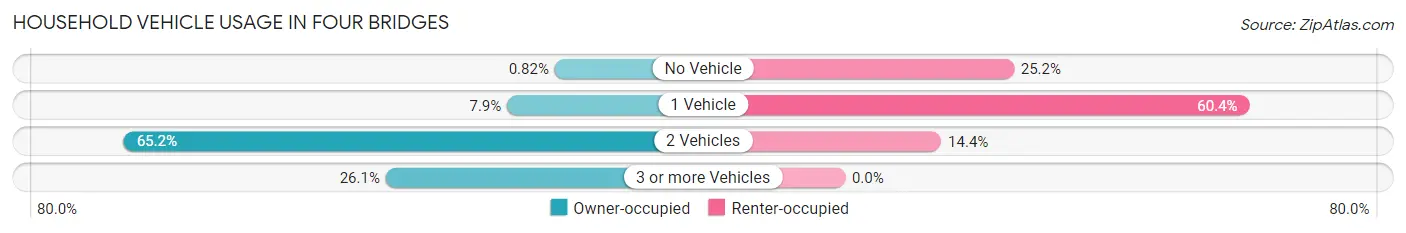
| Vehicles per Household | Owner-occupied | Renter-occupied |
| No Vehicle | 8 (0.8%) | 86 (25.2%) |
| 1 Vehicle | 77 (7.9%) | 206 (60.4%) |
| 2 Vehicles | 633 (65.2%) | 49 (14.4%) |
| 3 or more Vehicles | 253 (26.1%) | 0 (0.0%) |
| Total | 971 (100.0%) | 341 (100.0%) |
Real Estate & Mortgages in Four Bridges
Real Estate and Mortgage Overview in Four Bridges
| Characteristic | Without Mortgage | With Mortgage |
| Housing Units | 293 | 678 |
| Median Property Value | $506,700 | $515,300 |
| Median Household Income | $163,281 | $400 |
| Monthly Housing Costs | $1,158 | $127 |
| Real Estate Taxes | $7,472 | $0 |
Property Value by Mortgage Status in Four Bridges
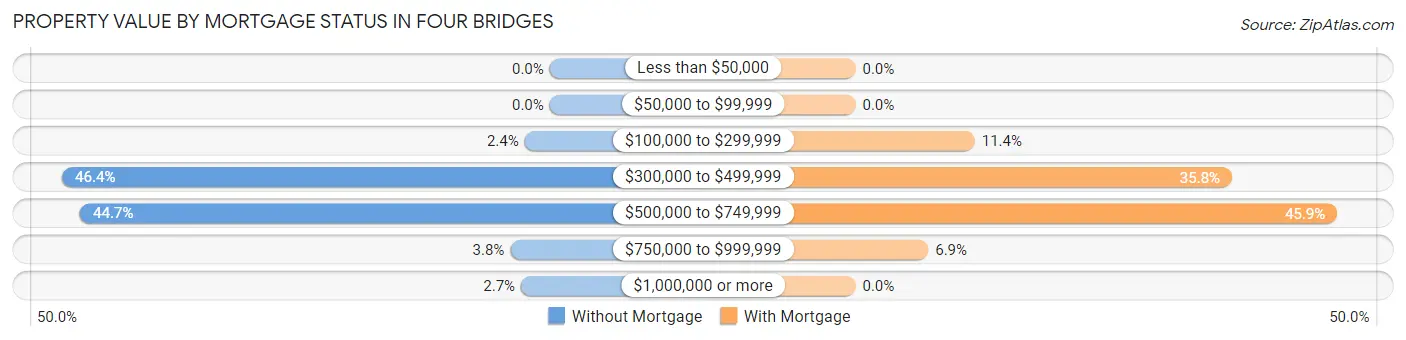
| Property Value | Without Mortgage | With Mortgage |
| Less than $50,000 | 0 (0.0%) | 0 (0.0%) |
| $50,000 to $99,999 | 0 (0.0%) | 0 (0.0%) |
| $100,000 to $299,999 | 7 (2.4%) | 77 (11.4%) |
| $300,000 to $499,999 | 136 (46.4%) | 243 (35.8%) |
| $500,000 to $749,999 | 131 (44.7%) | 311 (45.9%) |
| $750,000 to $999,999 | 11 (3.7%) | 47 (6.9%) |
| $1,000,000 or more | 8 (2.7%) | 0 (0.0%) |
| Total | 293 (100.0%) | 678 (100.0%) |
Household Income by Mortgage Status in Four Bridges
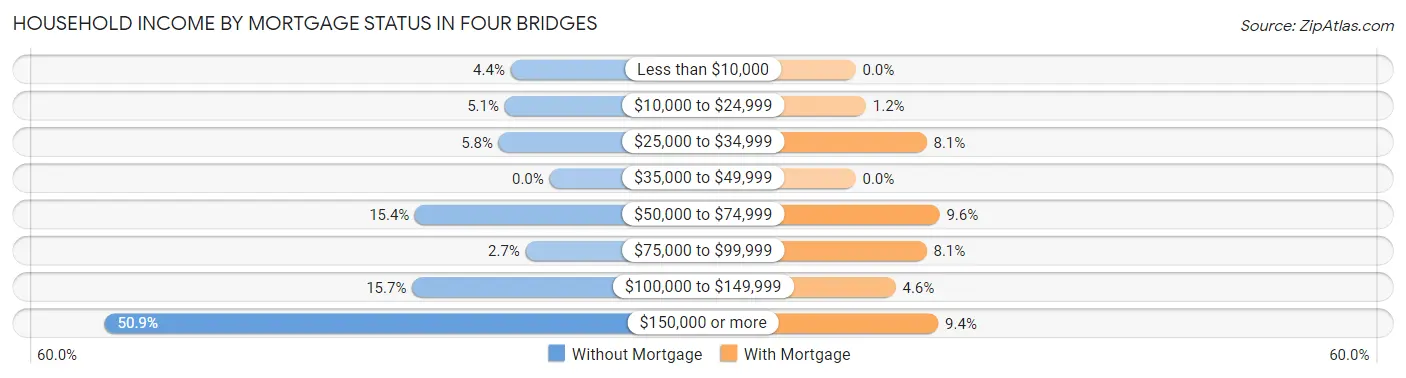
| Household Income | Without Mortgage | With Mortgage |
| Less than $10,000 | 13 (4.4%) | 0 (0.0%) |
| $10,000 to $24,999 | 15 (5.1%) | 8 (1.2%) |
| $25,000 to $34,999 | 17 (5.8%) | 55 (8.1%) |
| $35,000 to $49,999 | 0 (0.0%) | 0 (0.0%) |
| $50,000 to $74,999 | 45 (15.4%) | 65 (9.6%) |
| $75,000 to $99,999 | 8 (2.7%) | 55 (8.1%) |
| $100,000 to $149,999 | 46 (15.7%) | 31 (4.6%) |
| $150,000 or more | 149 (50.8%) | 64 (9.4%) |
| Total | 293 (100.0%) | 678 (100.0%) |
Property Value to Household Income Ratio in Four Bridges
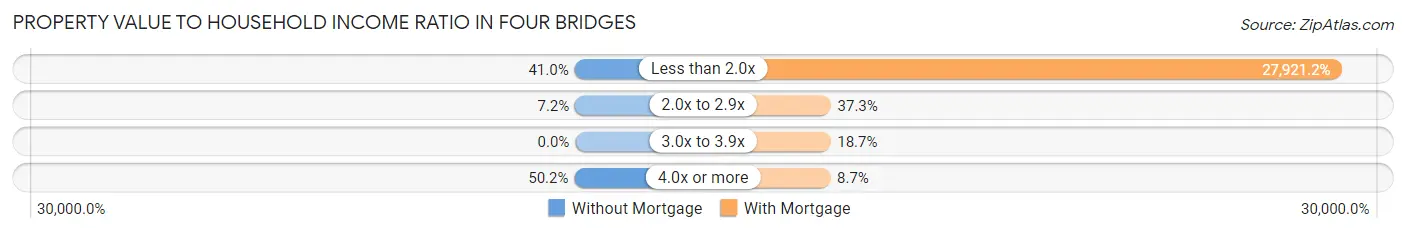
| Value-to-Income Ratio | Without Mortgage | With Mortgage |
| Less than 2.0x | 120 (41.0%) | 189,306 (27,921.2%) |
| 2.0x to 2.9x | 21 (7.2%) | 253 (37.3%) |
| 3.0x to 3.9x | 0 (0.0%) | 127 (18.7%) |
| 4.0x or more | 147 (50.2%) | 59 (8.7%) |
| Total | 293 (100.0%) | 678 (100.0%) |
Real Estate Taxes by Mortgage Status in Four Bridges
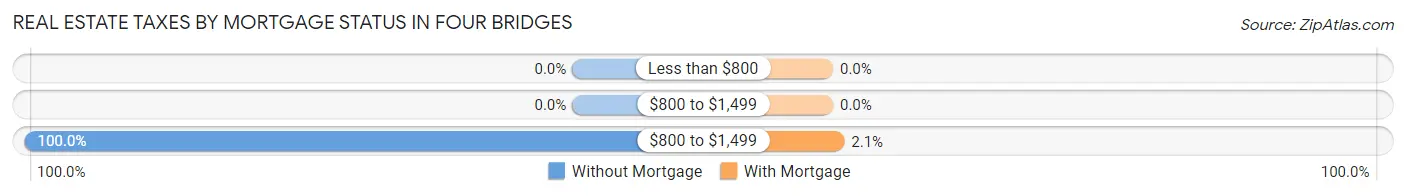
| Property Taxes | Without Mortgage | With Mortgage |
| Less than $800 | 0 (0.0%) | 0 (0.0%) |
| $800 to $1,499 | 0 (0.0%) | 0 (0.0%) |
| $800 to $1,499 | 293 (100.0%) | 14 (2.1%) |
| Total | 293 (100.0%) | 678 (100.0%) |
Health & Disability in Four Bridges
Health Insurance Coverage by Age in Four Bridges
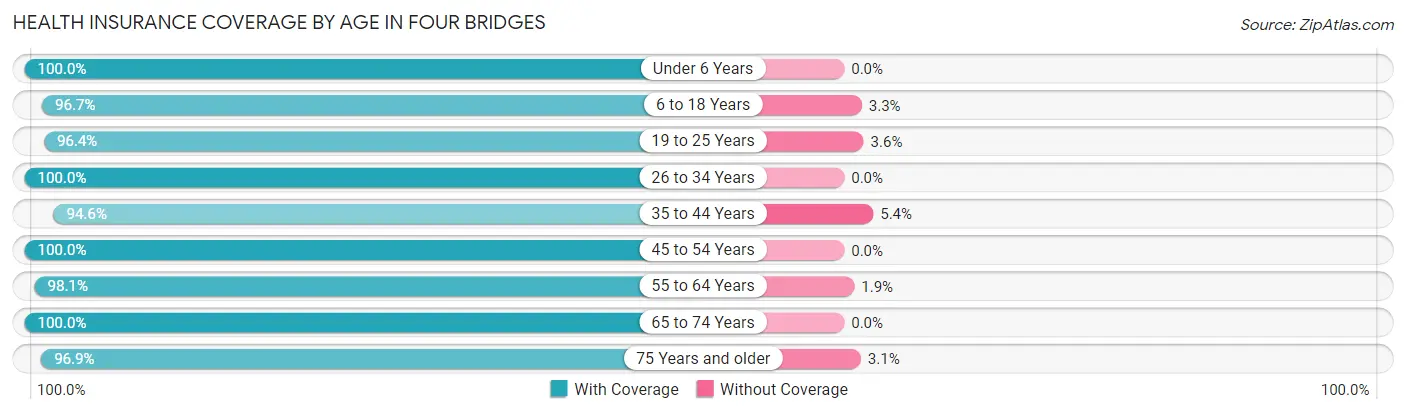
| Age Bracket | With Coverage | Without Coverage |
| Under 6 Years | 98 (100.0%) | 0 (0.0%) |
| 6 to 18 Years | 678 (96.7%) | 23 (3.3%) |
| 19 to 25 Years | 187 (96.4%) | 7 (3.6%) |
| 26 to 34 Years | 161 (100.0%) | 0 (0.0%) |
| 35 to 44 Years | 490 (94.6%) | 28 (5.4%) |
| 45 to 54 Years | 460 (100.0%) | 0 (0.0%) |
| 55 to 64 Years | 473 (98.1%) | 9 (1.9%) |
| 65 to 74 Years | 436 (100.0%) | 0 (0.0%) |
| 75 Years and older | 313 (96.9%) | 10 (3.1%) |
| Total | 3,296 (97.7%) | 77 (2.3%) |
Health Insurance Coverage by Citizenship Status in Four Bridges
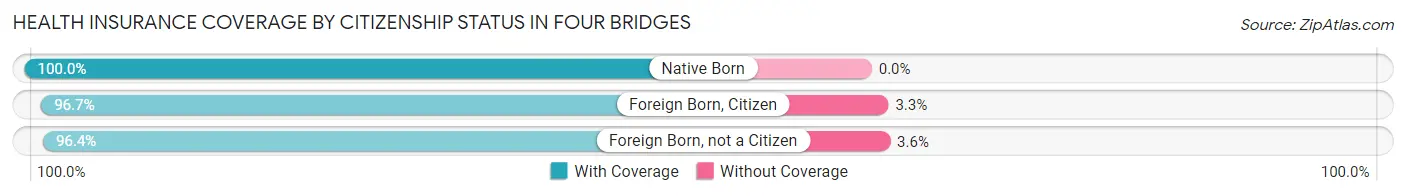
| Citizenship Status | With Coverage | Without Coverage |
| Native Born | 98 (100.0%) | 0 (0.0%) |
| Foreign Born, Citizen | 678 (96.7%) | 23 (3.3%) |
| Foreign Born, not a Citizen | 187 (96.4%) | 7 (3.6%) |
Health Insurance Coverage by Household Income in Four Bridges
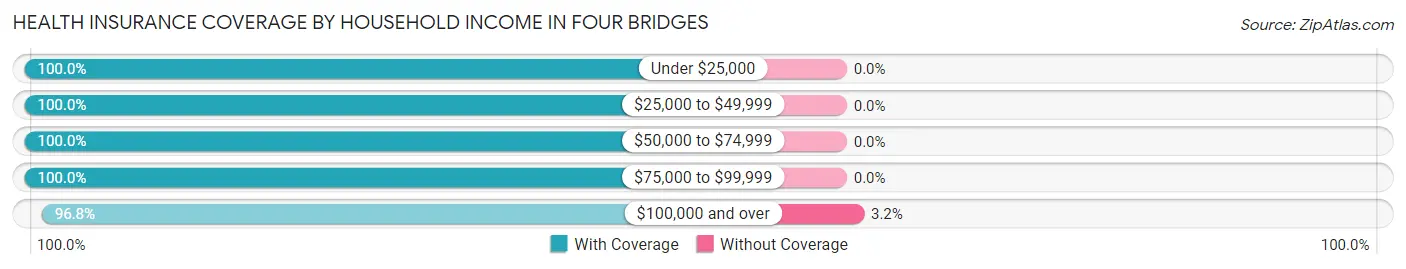
| Household Income | With Coverage | Without Coverage |
| Under $25,000 | 293 (100.0%) | 0 (0.0%) |
| $25,000 to $49,999 | 179 (100.0%) | 0 (0.0%) |
| $50,000 to $74,999 | 396 (100.0%) | 0 (0.0%) |
| $75,000 to $99,999 | 124 (100.0%) | 0 (0.0%) |
| $100,000 and over | 2,304 (96.8%) | 77 (3.2%) |
Public vs Private Health Insurance Coverage by Age in Four Bridges
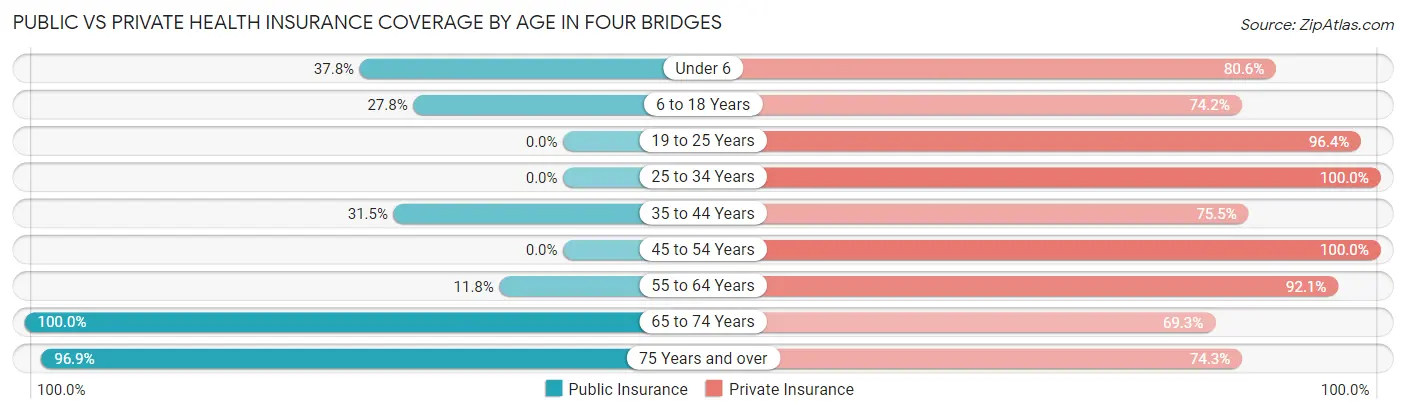
| Age Bracket | Public Insurance | Private Insurance |
| Under 6 | 37 (37.8%) | 79 (80.6%) |
| 6 to 18 Years | 195 (27.8%) | 520 (74.2%) |
| 19 to 25 Years | 0 (0.0%) | 187 (96.4%) |
| 25 to 34 Years | 0 (0.0%) | 161 (100.0%) |
| 35 to 44 Years | 163 (31.5%) | 391 (75.5%) |
| 45 to 54 Years | 0 (0.0%) | 460 (100.0%) |
| 55 to 64 Years | 57 (11.8%) | 444 (92.1%) |
| 65 to 74 Years | 436 (100.0%) | 302 (69.3%) |
| 75 Years and over | 313 (96.9%) | 240 (74.3%) |
| Total | 1,201 (35.6%) | 2,784 (82.5%) |
Disability Status by Sex by Age in Four Bridges
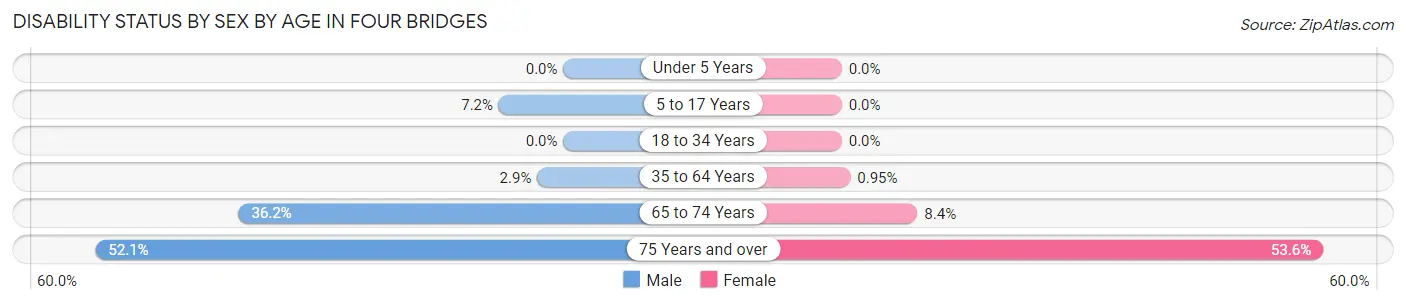
| Age Bracket | Male | Female |
| Under 5 Years | 0 (0.0%) | 0 (0.0%) |
| 5 to 17 Years | 29 (7.2%) | 0 (0.0%) |
| 18 to 34 Years | 0 (0.0%) | 0 (0.0%) |
| 35 to 64 Years | 21 (2.9%) | 7 (0.9%) |
| 65 to 74 Years | 89 (36.2%) | 16 (8.4%) |
| 75 Years and over | 74 (52.1%) | 97 (53.6%) |
Disability Class by Sex by Age in Four Bridges
Disability Class: Hearing Difficulty
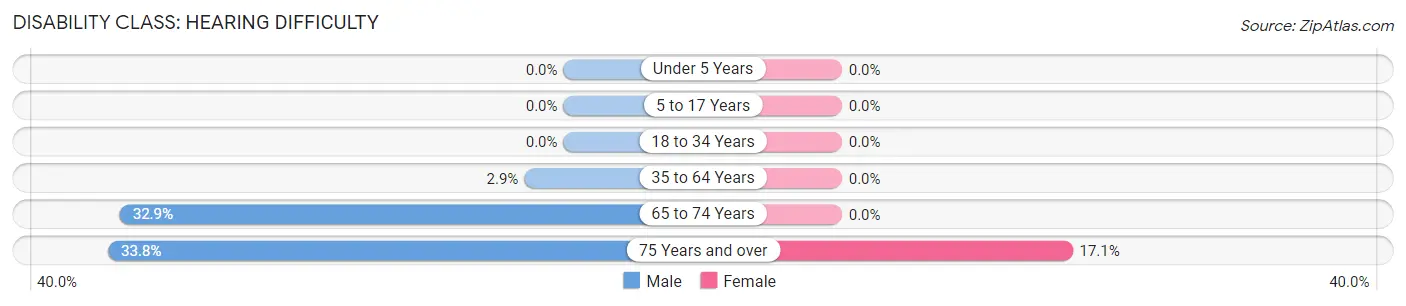
| Age Bracket | Male | Female |
| Under 5 Years | 0 (0.0%) | 0 (0.0%) |
| 5 to 17 Years | 0 (0.0%) | 0 (0.0%) |
| 18 to 34 Years | 0 (0.0%) | 0 (0.0%) |
| 35 to 64 Years | 21 (2.9%) | 0 (0.0%) |
| 65 to 74 Years | 81 (32.9%) | 0 (0.0%) |
| 75 Years and over | 48 (33.8%) | 31 (17.1%) |
Disability Class: Vision Difficulty
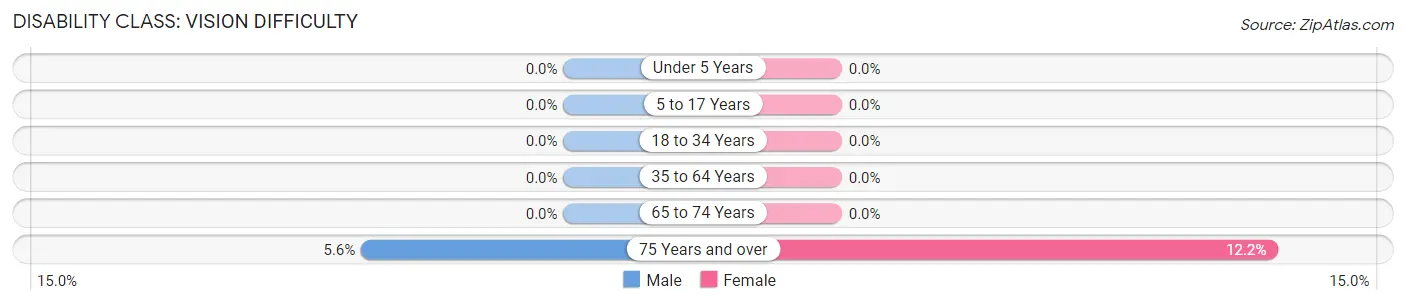
| Age Bracket | Male | Female |
| Under 5 Years | 0 (0.0%) | 0 (0.0%) |
| 5 to 17 Years | 0 (0.0%) | 0 (0.0%) |
| 18 to 34 Years | 0 (0.0%) | 0 (0.0%) |
| 35 to 64 Years | 0 (0.0%) | 0 (0.0%) |
| 65 to 74 Years | 0 (0.0%) | 0 (0.0%) |
| 75 Years and over | 8 (5.6%) | 22 (12.1%) |
Disability Class: Cognitive Difficulty
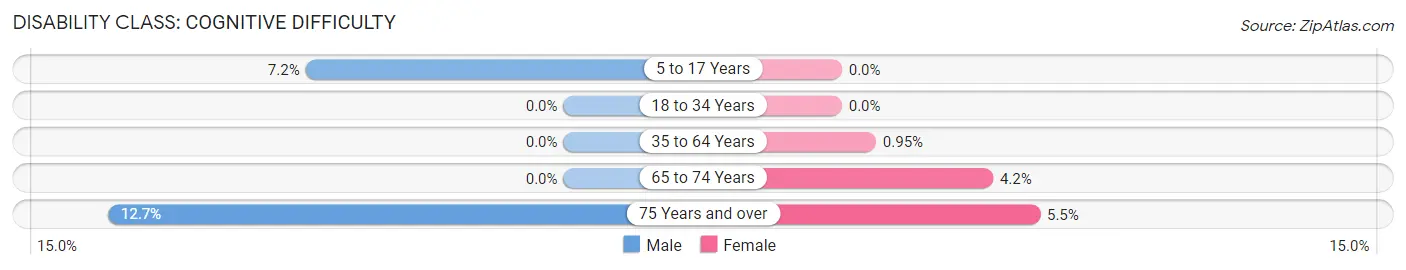
| Age Bracket | Male | Female |
| 5 to 17 Years | 29 (7.2%) | 0 (0.0%) |
| 18 to 34 Years | 0 (0.0%) | 0 (0.0%) |
| 35 to 64 Years | 0 (0.0%) | 7 (0.9%) |
| 65 to 74 Years | 0 (0.0%) | 8 (4.2%) |
| 75 Years and over | 18 (12.7%) | 10 (5.5%) |
Disability Class: Ambulatory Difficulty
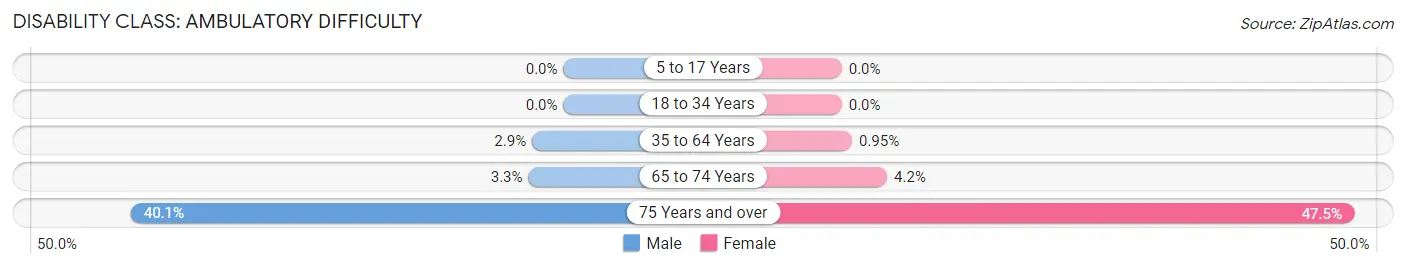
| Age Bracket | Male | Female |
| 5 to 17 Years | 0 (0.0%) | 0 (0.0%) |
| 18 to 34 Years | 0 (0.0%) | 0 (0.0%) |
| 35 to 64 Years | 21 (2.9%) | 7 (0.9%) |
| 65 to 74 Years | 8 (3.3%) | 8 (4.2%) |
| 75 Years and over | 57 (40.1%) | 86 (47.5%) |
Disability Class: Self-Care Difficulty
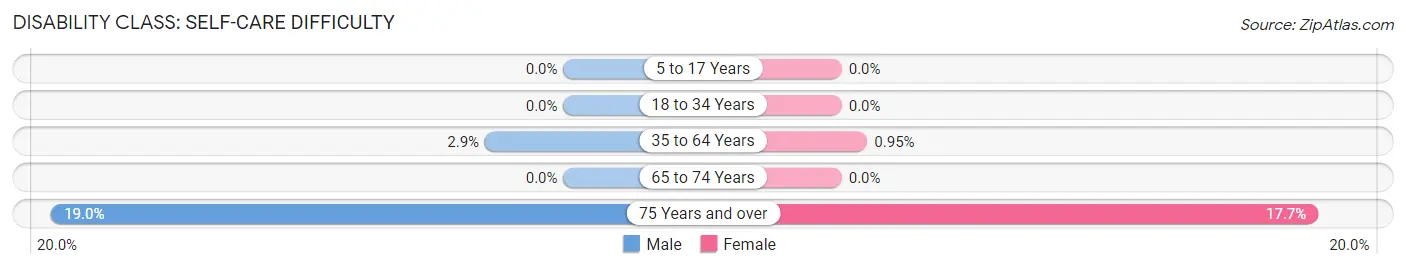
| Age Bracket | Male | Female |
| 5 to 17 Years | 0 (0.0%) | 0 (0.0%) |
| 18 to 34 Years | 0 (0.0%) | 0 (0.0%) |
| 35 to 64 Years | 21 (2.9%) | 7 (0.9%) |
| 65 to 74 Years | 0 (0.0%) | 0 (0.0%) |
| 75 Years and over | 27 (19.0%) | 32 (17.7%) |
Technology Access in Four Bridges
Computing Device Access in Four Bridges
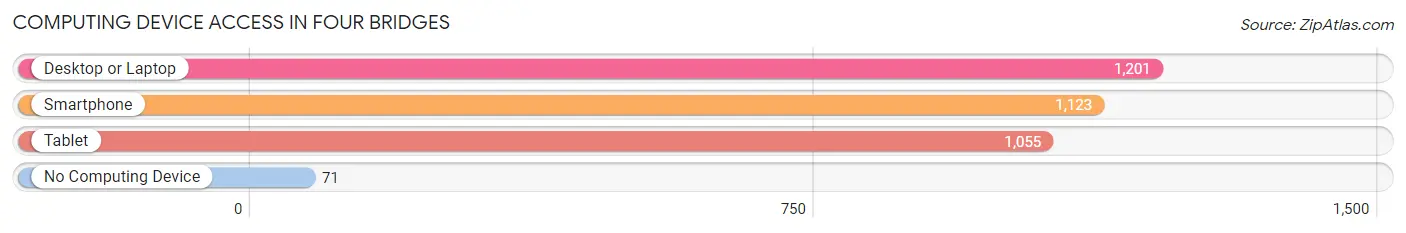
| Device Type | # Households | % Households |
| Desktop or Laptop | 1,201 | 91.5% |
| Smartphone | 1,123 | 85.6% |
| Tablet | 1,055 | 80.4% |
| No Computing Device | 71 | 5.4% |
| Total | 1,312 | 100.0% |
Internet Access in Four Bridges
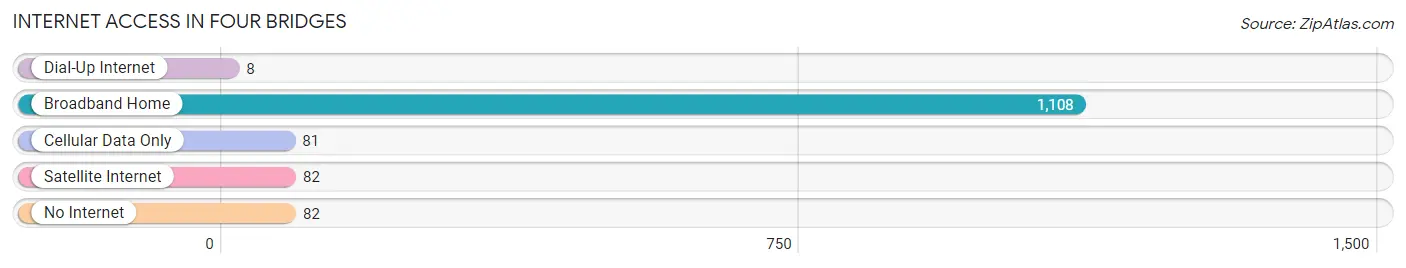
| Internet Type | # Households | % Households |
| Dial-Up Internet | 8 | 0.6% |
| Broadband Home | 1,108 | 84.5% |
| Cellular Data Only | 81 | 6.2% |
| Satellite Internet | 82 | 6.2% |
| No Internet | 82 | 6.2% |
| Total | 1,312 | 100.0% |
Four Bridges Summary
Bridges, Ohio is a small village located in the southeastern corner of the state, in the county of Scioto. It is situated on the banks of the Scioto River, and is home to a population of just over 500 people. The village is known for its quaint atmosphere and its close proximity to the larger cities of Portsmouth and Chillicothe.
History
The area that is now Bridges, Ohio was first settled in the early 1800s by a group of settlers from Pennsylvania. The settlers were attracted to the area due to its fertile soil and abundant natural resources. The village was originally known as “Four Bridges” due to the four bridges that crossed the Scioto River at the time. The village was officially incorporated in 1837 and was named after the four bridges.
Geography
Bridges, Ohio is located in the southeastern corner of the state, in the county of Scioto. It is situated on the banks of the Scioto River, and is bordered by the towns of Portsmouth and Chillicothe. The village is located in a rural area, and is surrounded by rolling hills and farmland. The climate in the area is generally mild, with temperatures ranging from the mid-30s in the winter to the mid-80s in the summer.
Economy
The economy of Bridges, Ohio is largely based on agriculture. The village is home to several farms, which produce a variety of crops, including corn, soybeans, wheat, and hay. The village also has a few small businesses, including a grocery store, a hardware store, and a few restaurants.
Demographics
As of the 2010 census, the population of Bridges, Ohio was 514. The racial makeup of the village was 97.3% White, 0.6% African American, 0.2% Native American, 0.4% Asian, and 1.5% from other races. The median household income in the village was $37,500, and the median age was 41.
Conclusion
Bridges, Ohio is a small village located in the southeastern corner of the state, in the county of Scioto. It is situated on the banks of the Scioto River, and is home to a population of just over 500 people. The village is known for its quaint atmosphere and its close proximity to the larger cities of Portsmouth and Chillicothe. The economy of Bridges, Ohio is largely based on agriculture, and the village is home to several farms, which produce a variety of crops. The racial makeup of the village is predominantly White, with a small percentage of African American, Native American, and Asian residents. The median household income in the village is $37,500, and the median age is 41.
Common Questions
What is Per Capita Income in Four Bridges?
Per Capita income in Four Bridges is $72,199.
What is the Median Family Income in Four Bridges?
Median Family Income in Four Bridges is $189,653.
What is the Median Household income in Four Bridges?
Median Household Income in Four Bridges is $137,143.
What is Income or Wage Gap in Four Bridges?
Income or Wage Gap in Four Bridges is 24.2%.
Women in Four Bridges earn 75.8 cents for every dollar earned by a man.
What is Family Income Deficit in Four Bridges?
Family Income Deficit in Four Bridges is $10,263.
Families that are below poverty line in Four Bridges earn $10,263 less on average than the poverty threshold level.
What is Inequality or Gini Index in Four Bridges?
Inequality or Gini Index in Four Bridges is 0.42.
What is the Total Population of Four Bridges?
Total Population of Four Bridges is 3,511.
What is the Total Male Population of Four Bridges?
Total Male Population of Four Bridges is 1,818.
What is the Total Female Population of Four Bridges?
Total Female Population of Four Bridges is 1,693.
What is the Ratio of Males per 100 Females in Four Bridges?
There are 107.38 Males per 100 Females in Four Bridges.
What is the Ratio of Females per 100 Males in Four Bridges?
There are 93.12 Females per 100 Males in Four Bridges.
What is the Median Population Age in Four Bridges?
Median Population Age in Four Bridges is 45.8 Years.
What is the Average Family Size in Four Bridges
Average Family Size in Four Bridges is 3.2 People.
What is the Average Household Size in Four Bridges
Average Household Size in Four Bridges is 2.6 People.
How Large is the Labor Force in Four Bridges?
There are 1,580 People in the Labor Forcein in Four Bridges.
What is the Percentage of People in the Labor Force in Four Bridges?
56.4% of People are in the Labor Force in Four Bridges.
What is the Unemployment Rate in Four Bridges?
Unemployment Rate in Four Bridges is 3.8%.