Cities with the Highest Percentage of Ecuadorian Population in Ohio
RELATED REPORTS & OPTIONS
Ecuadorian
Ohio
Compare Cities
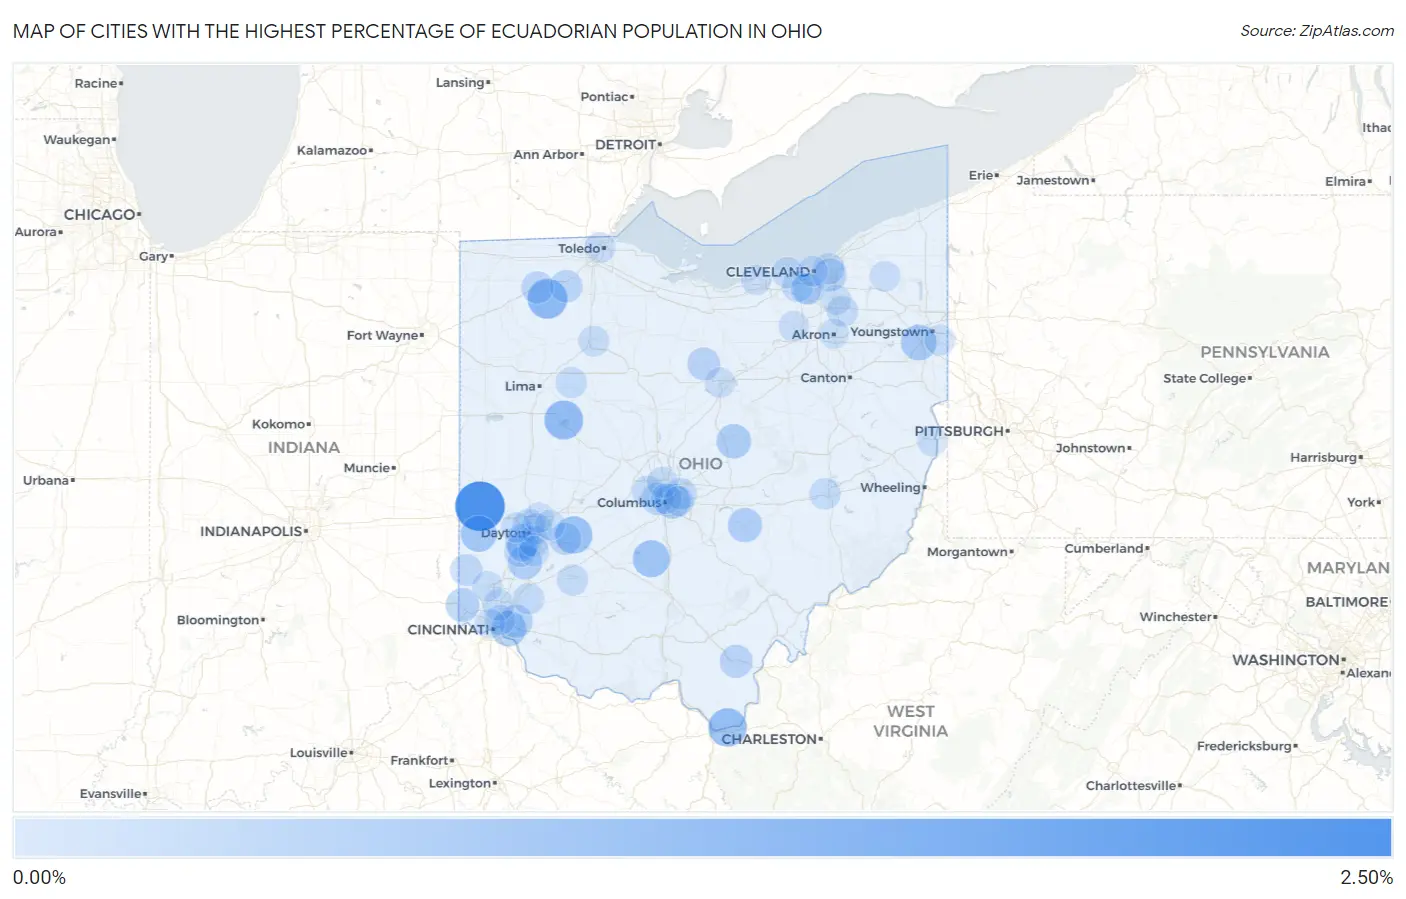
Map of Cities with the Highest Percentage of Ecuadorian Population in Ohio
0.00%
2.50%
Cities with the Highest Percentage of Ecuadorian Population in Ohio
| City | Ecuadorian | vs State | vs National | |
| 1. | Castine | 2.48% | 0.028%(+2.45)#1 | 0.24%(+2.24)#198 |
| 2. | Malinta | 1.20% | 0.028%(+1.17)#2 | 0.24%(+0.958)#469 |
| 3. | Chippewa Park | 1.08% | 0.028%(+1.05)#3 | 0.24%(+0.834)#517 |
| 4. | Chesapeake | 1.03% | 0.028%(+1.00)#4 | 0.24%(+0.789)#533 |
| 5. | Cedarville | 0.89% | 0.028%(+0.866)#5 | 0.24%(+0.651)#599 |
| 6. | Williamsport | 0.84% | 0.028%(+0.807)#6 | 0.24%(+0.592)#634 |
| 7. | Eaton | 0.74% | 0.028%(+0.713)#7 | 0.24%(+0.499)#716 |
| 8. | Canfield | 0.68% | 0.028%(+0.650)#8 | 0.24%(+0.436)#783 |
| 9. | Turpin Hills | 0.62% | 0.028%(+0.589)#9 | 0.24%(+0.375)#852 |
| 10. | Bexley | 0.60% | 0.028%(+0.570)#10 | 0.24%(+0.356)#870 |
| 11. | Gambier | 0.55% | 0.028%(+0.522)#11 | 0.24%(+0.307)#934 |
| 12. | Somerset | 0.52% | 0.028%(+0.490)#12 | 0.24%(+0.275)#977 |
| 13. | Moraine | 0.51% | 0.028%(+0.481)#13 | 0.24%(+0.266)#989 |
| 14. | Springboro | 0.48% | 0.028%(+0.450)#14 | 0.24%(+0.236)#1,029 |
| 15. | Harrison | 0.44% | 0.028%(+0.407)#15 | 0.24%(+0.193)#1,079 |
| 16. | Terrace Park | 0.37% | 0.028%(+0.344)#16 | 0.24%(+0.129)#1,198 |
| 17. | Rio Grande | 0.35% | 0.028%(+0.322)#17 | 0.24%(+0.108)#1,249 |
| 18. | Shaker Heights | 0.34% | 0.028%(+0.315)#18 | 0.24%(+0.100)#1,268 |
| 19. | Shelby | 0.32% | 0.028%(+0.295)#19 | 0.24%(+0.080)#1,308 |
| 20. | Marble Cliff | 0.30% | 0.028%(+0.269)#20 | 0.24%(+0.055)#1,370 |
| 21. | Grand Rapids | 0.29% | 0.028%(+0.262)#21 | 0.24%(+0.048)#1,388 |
| 22. | Wilberforce | 0.27% | 0.028%(+0.246)#22 | 0.24%(+0.031)#1,432 |
| 23. | Napoleon | 0.27% | 0.028%(+0.242)#23 | 0.24%(+0.027)#1,444 |
| 24. | Dayton | 0.22% | 0.028%(+0.189)#24 | 0.24%(-0.025)#1,622 |
| 25. | Miamisburg | 0.21% | 0.028%(+0.183)#25 | 0.24%(-0.031)#1,641 |
| 26. | Oxford | 0.21% | 0.028%(+0.180)#26 | 0.24%(-0.034)#1,657 |
| 27. | Glendale | 0.19% | 0.028%(+0.157)#27 | 0.24%(-0.057)#1,755 |
| 28. | Gahanna | 0.17% | 0.028%(+0.146)#28 | 0.24%(-0.068)#1,798 |
| 29. | Cleveland Heights | 0.17% | 0.028%(+0.138)#29 | 0.24%(-0.076)#1,829 |
| 30. | Parma | 0.16% | 0.028%(+0.135)#30 | 0.24%(-0.079)#1,847 |
| 31. | Maineville | 0.15% | 0.028%(+0.117)#31 | 0.24%(-0.097)#1,941 |
| 32. | Hilliard | 0.14% | 0.028%(+0.116)#32 | 0.24%(-0.099)#1,949 |
| 33. | Bay Village | 0.14% | 0.028%(+0.115)#33 | 0.24%(-0.099)#1,952 |
| 34. | Wilmington | 0.14% | 0.028%(+0.114)#34 | 0.24%(-0.101)#1,962 |
| 35. | Cambridge | 0.14% | 0.028%(+0.110)#35 | 0.24%(-0.104)#1,985 |
| 36. | Ada | 0.14% | 0.028%(+0.109)#36 | 0.24%(-0.105)#1,991 |
| 37. | Riverside | 0.13% | 0.028%(+0.102)#37 | 0.24%(-0.112)#2,025 |
| 38. | Brook Park | 0.13% | 0.028%(+0.101)#38 | 0.24%(-0.113)#2,028 |
| 39. | Hudson | 0.13% | 0.028%(+0.098)#39 | 0.24%(-0.117)#2,052 |
| 40. | Worthington | 0.12% | 0.028%(+0.092)#40 | 0.24%(-0.123)#2,087 |
| 41. | Parma Heights | 0.12% | 0.028%(+0.087)#41 | 0.24%(-0.127)#2,130 |
| 42. | Findlay | 0.087% | 0.028%(+0.058)#42 | 0.24%(-0.156)#2,328 |
| 43. | West Carrollton | 0.084% | 0.028%(+0.056)#43 | 0.24%(-0.159)#2,346 |
| 44. | Kettering | 0.083% | 0.028%(+0.055)#44 | 0.24%(-0.160)#2,360 |
| 45. | Struthers | 0.080% | 0.028%(+0.051)#45 | 0.24%(-0.163)#2,387 |
| 46. | Toledo | 0.065% | 0.028%(+0.036)#46 | 0.24%(-0.178)#2,519 |
| 47. | Cleveland | 0.059% | 0.028%(+0.031)#47 | 0.24%(-0.183)#2,547 |
| 48. | Medina | 0.054% | 0.028%(+0.025)#48 | 0.24%(-0.189)#2,608 |
| 49. | Columbus | 0.053% | 0.028%(+0.025)#49 | 0.24%(-0.190)#2,618 |
| 50. | Mansfield | 0.052% | 0.028%(+0.024)#50 | 0.24%(-0.190)#2,623 |
| 51. | Lorain | 0.040% | 0.028%(+0.011)#51 | 0.24%(-0.203)#2,728 |
| 52. | Centerville | 0.037% | 0.028%(+0.008)#52 | 0.24%(-0.206)#2,753 |
| 53. | Middlefield | 0.036% | 0.028%(+0.008)#53 | 0.24%(-0.206)#2,759 |
| 54. | Hamilton | 0.032% | 0.028%(+0.003)#54 | 0.24%(-0.211)#2,800 |
| 55. | Norwood | 0.032% | 0.028%(+0.003)#55 | 0.24%(-0.211)#2,801 |
| 56. | Steubenville | 0.028% | 0.028%(-0.001)#56 | 0.24%(-0.215)#2,837 |
| 57. | Trotwood | 0.026% | 0.028%(-0.002)#57 | 0.24%(-0.217)#2,859 |
| 58. | Whitehall | 0.025% | 0.028%(-0.003)#58 | 0.24%(-0.218)#2,865 |
| 59. | Huber Heights | 0.014% | 0.028%(-0.015)#59 | 0.24%(-0.229)#2,979 |
| 60. | Cincinnati | 0.013% | 0.028%(-0.015)#60 | 0.24%(-0.230)#2,986 |
| 61. | Macedonia | 0.0082% | 0.028%(-0.020)#61 | 0.24%(-0.235)#3,022 |
| 62. | Fairborn | 0.0058% | 0.028%(-0.023)#62 | 0.24%(-0.237)#3,035 |
| 63. | Akron | 0.0037% | 0.028%(-0.025)#63 | 0.24%(-0.239)#3,047 |
Common Questions
What are the Top 10 Cities with the Highest Percentage of Ecuadorian Population in Ohio?
Top 10 Cities with the Highest Percentage of Ecuadorian Population in Ohio are:
#1
2.48%
#2
1.20%
#3
1.08%
#4
1.03%
#5
0.89%
#6
0.84%
#7
0.74%
#8
0.68%
#9
0.62%
#10
0.60%
What city has the Highest Percentage of Ecuadorian Population in Ohio?
Castine has the Highest Percentage of Ecuadorian Population in Ohio with 2.48%.
What is the Percentage of Ecuadorian Population in the State of Ohio?
Percentage of Ecuadorian Population in Ohio is 0.028%.
What is the Percentage of Ecuadorian Population in the United States?
Percentage of Ecuadorian Population in the United States is 0.24%.