Cities with the Most Immigrants from China in Ohio
RELATED REPORTS & OPTIONS
China
Ohio
Compare Cities
Map of Cities with the Most Immigrants from China in Ohio
0
8,000
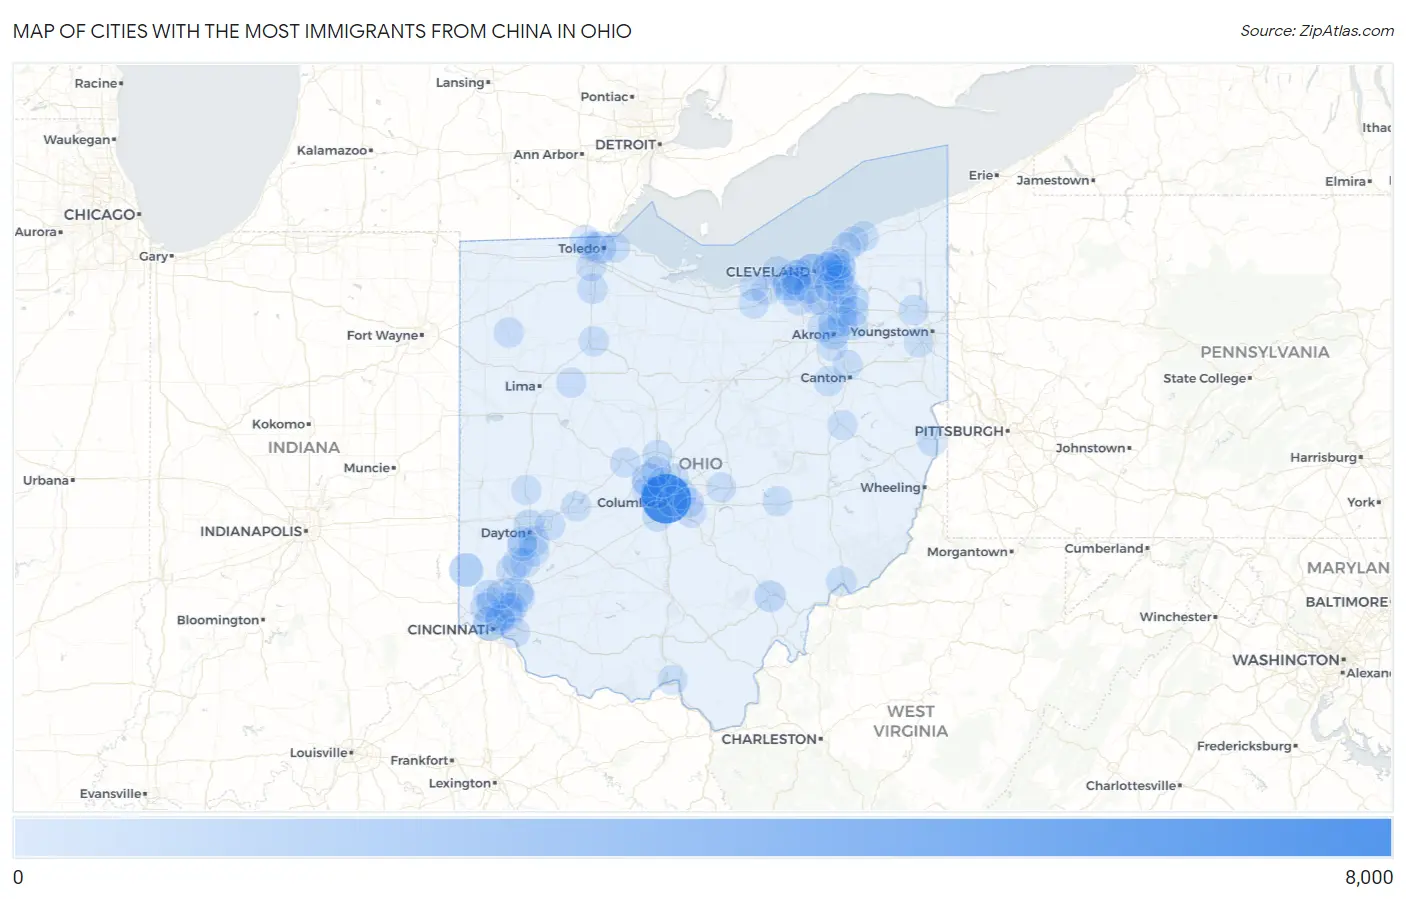
Cities with the Most Immigrants from China in Ohio
| City | China | vs State | vs National | |
| 1. | Columbus | 7,306 | 41,519(17.60%)#1 | 2,829,008(0.26%)#46 |
| 2. | Cleveland | 1,986 | 41,519(4.78%)#2 | 2,829,008(0.07%)#167 |
| 3. | Cincinnati | 1,563 | 41,519(3.76%)#3 | 2,829,008(0.06%)#221 |
| 4. | Dublin | 1,420 | 41,519(3.42%)#4 | 2,829,008(0.05%)#247 |
| 5. | Oxford | 1,353 | 41,519(3.26%)#5 | 2,829,008(0.05%)#262 |
| 6. | Solon | 857 | 41,519(2.06%)#6 | 2,829,008(0.03%)#399 |
| 7. | Mason | 824 | 41,519(1.98%)#7 | 2,829,008(0.03%)#411 |
| 8. | Upper Arlington | 796 | 41,519(1.92%)#8 | 2,829,008(0.03%)#425 |
| 9. | Toledo | 792 | 41,519(1.91%)#9 | 2,829,008(0.03%)#429 |
| 10. | Cleveland Heights | 710 | 41,519(1.71%)#10 | 2,829,008(0.03%)#474 |
| 11. | Akron | 622 | 41,519(1.50%)#11 | 2,829,008(0.02%)#534 |
| 12. | Athens | 589 | 41,519(1.42%)#12 | 2,829,008(0.02%)#552 |
| 13. | Cuyahoga Falls | 422 | 41,519(1.02%)#13 | 2,829,008(0.01%)#712 |
| 14. | Dayton | 357 | 41,519(0.86%)#14 | 2,829,008(0.01%)#811 |
| 15. | Gahanna | 353 | 41,519(0.85%)#15 | 2,829,008(0.01%)#820 |
| 16. | Kettering | 337 | 41,519(0.81%)#16 | 2,829,008(0.01%)#846 |
| 17. | Aurora | 324 | 41,519(0.78%)#17 | 2,829,008(0.01%)#870 |
| 18. | Shaker Heights | 297 | 41,519(0.72%)#18 | 2,829,008(0.01%)#926 |
| 19. | Beachwood | 290 | 41,519(0.70%)#19 | 2,829,008(0.01%)#944 |
| 20. | Westlake | 284 | 41,519(0.68%)#20 | 2,829,008(0.01%)#958 |
| 21. | Hilliard | 262 | 41,519(0.63%)#21 | 2,829,008(0.01%)#1,035 |
| 22. | Fairfield | 238 | 41,519(0.57%)#22 | 2,829,008(0.01%)#1,110 |
| 23. | Westerville | 230 | 41,519(0.55%)#23 | 2,829,008(0.01%)#1,147 |
| 24. | Grove City | 225 | 41,519(0.54%)#24 | 2,829,008(0.01%)#1,171 |
| 25. | Hudson | 225 | 41,519(0.54%)#25 | 2,829,008(0.01%)#1,173 |
| 26. | Middletown | 218 | 41,519(0.53%)#26 | 2,829,008(0.01%)#1,197 |
| 27. | Kenwood | 202 | 41,519(0.49%)#27 | 2,829,008(0.01%)#1,273 |
| 28. | Franklin | 200 | 41,519(0.48%)#28 | 2,829,008(0.01%)#1,280 |
| 29. | Kent | 191 | 41,519(0.46%)#29 | 2,829,008(0.01%)#1,320 |
| 30. | Bowling Green | 190 | 41,519(0.46%)#30 | 2,829,008(0.01%)#1,325 |
| 31. | Avon Lake | 188 | 41,519(0.45%)#31 | 2,829,008(0.01%)#1,338 |
| 32. | Lakewood | 176 | 41,519(0.42%)#32 | 2,829,008(0.01%)#1,398 |
| 33. | Delaware | 175 | 41,519(0.42%)#33 | 2,829,008(0.01%)#1,403 |
| 34. | Findlay | 173 | 41,519(0.42%)#34 | 2,829,008(0.01%)#1,412 |
| 35. | Twinsburg | 172 | 41,519(0.41%)#35 | 2,829,008(0.01%)#1,424 |
| 36. | Strongsville | 167 | 41,519(0.40%)#36 | 2,829,008(0.01%)#1,450 |
| 37. | Mayfield Heights | 166 | 41,519(0.40%)#37 | 2,829,008(0.01%)#1,455 |
| 38. | Elyria | 162 | 41,519(0.39%)#38 | 2,829,008(0.01%)#1,481 |
| 39. | Pickerington | 160 | 41,519(0.39%)#39 | 2,829,008(0.01%)#1,498 |
| 40. | Blue Ash | 158 | 41,519(0.38%)#40 | 2,829,008(0.01%)#1,510 |
| 41. | Oakwood | 149 | 41,519(0.36%)#41 | 2,829,008(0.01%)#1,574 |
| 42. | Ottawa Hills | 149 | 41,519(0.36%)#42 | 2,829,008(0.01%)#1,576 |
| 43. | Fairborn | 147 | 41,519(0.35%)#43 | 2,829,008(0.01%)#1,590 |
| 44. | Golf Manor | 142 | 41,519(0.34%)#44 | 2,829,008(0.01%)#1,622 |
| 45. | Springfield | 137 | 41,519(0.33%)#45 | 2,829,008(0.00%)#1,656 |
| 46. | Centerville | 137 | 41,519(0.33%)#46 | 2,829,008(0.00%)#1,660 |
| 47. | Granville | 136 | 41,519(0.33%)#47 | 2,829,008(0.00%)#1,677 |
| 48. | Perrysburg | 132 | 41,519(0.32%)#48 | 2,829,008(0.00%)#1,701 |
| 49. | Stow | 121 | 41,519(0.29%)#49 | 2,829,008(0.00%)#1,791 |
| 50. | Massillon | 113 | 41,519(0.27%)#50 | 2,829,008(0.00%)#1,860 |
| 51. | Lyndhurst | 113 | 41,519(0.27%)#51 | 2,829,008(0.00%)#1,864 |
| 52. | Sylvania | 112 | 41,519(0.27%)#52 | 2,829,008(0.00%)#1,879 |
| 53. | Bexley | 107 | 41,519(0.26%)#53 | 2,829,008(0.00%)#1,936 |
| 54. | Painesville | 103 | 41,519(0.25%)#54 | 2,829,008(0.00%)#1,981 |
| 55. | Ada | 101 | 41,519(0.24%)#55 | 2,829,008(0.00%)#2,006 |
| 56. | Warren | 100 | 41,519(0.24%)#56 | 2,829,008(0.00%)#2,012 |
| 57. | Springboro | 98 | 41,519(0.24%)#57 | 2,829,008(0.00%)#2,046 |
| 58. | Steubenville | 98 | 41,519(0.24%)#58 | 2,829,008(0.00%)#2,047 |
| 59. | Oregon | 97 | 41,519(0.23%)#59 | 2,829,008(0.00%)#2,059 |
| 60. | Rocky River | 96 | 41,519(0.23%)#60 | 2,829,008(0.00%)#2,074 |
| 61. | Reynoldsburg | 95 | 41,519(0.23%)#61 | 2,829,008(0.00%)#2,085 |
| 62. | Brook Park | 95 | 41,519(0.23%)#62 | 2,829,008(0.00%)#2,090 |
| 63. | Brecksville | 94 | 41,519(0.23%)#63 | 2,829,008(0.00%)#2,100 |
| 64. | Fairlawn | 94 | 41,519(0.23%)#64 | 2,829,008(0.00%)#2,103 |
| 65. | Pepper Pike | 93 | 41,519(0.22%)#65 | 2,829,008(0.00%)#2,113 |
| 66. | Portsmouth | 91 | 41,519(0.22%)#66 | 2,829,008(0.00%)#2,131 |
| 67. | Mentor | 90 | 41,519(0.22%)#67 | 2,829,008(0.00%)#2,142 |
| 68. | North Canton | 88 | 41,519(0.21%)#68 | 2,829,008(0.00%)#2,176 |
| 69. | North Olmsted | 87 | 41,519(0.21%)#69 | 2,829,008(0.00%)#2,190 |
| 70. | Forest Park | 86 | 41,519(0.21%)#70 | 2,829,008(0.00%)#2,211 |
| 71. | Landen | 85 | 41,519(0.20%)#71 | 2,829,008(0.00%)#2,229 |
| 72. | West Carrollton | 84 | 41,519(0.20%)#72 | 2,829,008(0.00%)#2,237 |
| 73. | Broadview Heights | 83 | 41,519(0.20%)#73 | 2,829,008(0.00%)#2,246 |
| 74. | Parma | 82 | 41,519(0.20%)#74 | 2,829,008(0.00%)#2,259 |
| 75. | Powell | 81 | 41,519(0.20%)#75 | 2,829,008(0.00%)#2,280 |
| 76. | Montgomery | 81 | 41,519(0.20%)#76 | 2,829,008(0.00%)#2,284 |
| 77. | Fairview Park | 80 | 41,519(0.19%)#77 | 2,829,008(0.00%)#2,300 |
| 78. | Maple Heights | 79 | 41,519(0.19%)#78 | 2,829,008(0.00%)#2,313 |
| 79. | Marietta | 79 | 41,519(0.19%)#79 | 2,829,008(0.00%)#2,319 |
| 80. | Willoughby | 78 | 41,519(0.19%)#80 | 2,829,008(0.00%)#2,335 |
| 81. | Zanesville | 76 | 41,519(0.18%)#81 | 2,829,008(0.00%)#2,360 |
| 82. | Norwood | 75 | 41,519(0.18%)#82 | 2,829,008(0.00%)#2,383 |
| 83. | Northbrook | 74 | 41,519(0.18%)#83 | 2,829,008(0.00%)#2,402 |
| 84. | Oberlin | 72 | 41,519(0.17%)#84 | 2,829,008(0.00%)#2,448 |
| 85. | Cherry Grove | 72 | 41,519(0.17%)#85 | 2,829,008(0.00%)#2,451 |
| 86. | Marysville | 70 | 41,519(0.17%)#86 | 2,829,008(0.00%)#2,472 |
| 87. | Beckett Ridge | 70 | 41,519(0.17%)#87 | 2,829,008(0.00%)#2,479 |
| 88. | Moraine | 69 | 41,519(0.17%)#88 | 2,829,008(0.00%)#2,499 |
| 89. | Olmsted Falls | 67 | 41,519(0.16%)#89 | 2,829,008(0.00%)#2,536 |
| 90. | Orange | 62 | 41,519(0.15%)#90 | 2,829,008(0.00%)#2,649 |
| 91. | Troy | 61 | 41,519(0.15%)#91 | 2,829,008(0.00%)#2,658 |
| 92. | Richmond Heights | 59 | 41,519(0.14%)#92 | 2,829,008(0.00%)#2,712 |
| 93. | Highland Heights | 58 | 41,519(0.14%)#93 | 2,829,008(0.00%)#2,744 |
| 94. | New Philadelphia | 57 | 41,519(0.14%)#94 | 2,829,008(0.00%)#2,752 |
| 95. | Amherst | 57 | 41,519(0.14%)#95 | 2,829,008(0.00%)#2,754 |
| 96. | East Cleveland | 56 | 41,519(0.13%)#96 | 2,829,008(0.00%)#2,780 |
| 97. | Streetsboro | 55 | 41,519(0.13%)#97 | 2,829,008(0.00%)#2,798 |
| 98. | Worthington | 55 | 41,519(0.13%)#98 | 2,829,008(0.00%)#2,802 |
| 99. | Portage Lakes | 55 | 41,519(0.13%)#99 | 2,829,008(0.00%)#2,807 |
| 100. | Canfield | 54 | 41,519(0.13%)#100 | 2,829,008(0.00%)#2,826 |
Common Questions
What are the Top 10 Cities with the Most Immigrants from China in Ohio?
Top 10 Cities with the Most Immigrants from China in Ohio are:
#1
7,306
#2
1,986
#3
1,563
#4
1,420
#5
1,353
#6
857
#7
824
#8
796
#9
792
#10
710
What city has the Most Immigrants from China in Ohio?
Columbus has the Most Immigrants from China in Ohio with 7,306.
What is the Total Immigrants from China in the State of Ohio?
Total Immigrants from China in Ohio is 41,519.
What is the Total Immigrants from China in the United States?
Total Immigrants from China in the United States is 2,829,008.