Cities with the Highest Female Poverty Level in Ohio
RELATED REPORTS & OPTIONS
Highest Poverty | Female
Ohio
Compare Cities
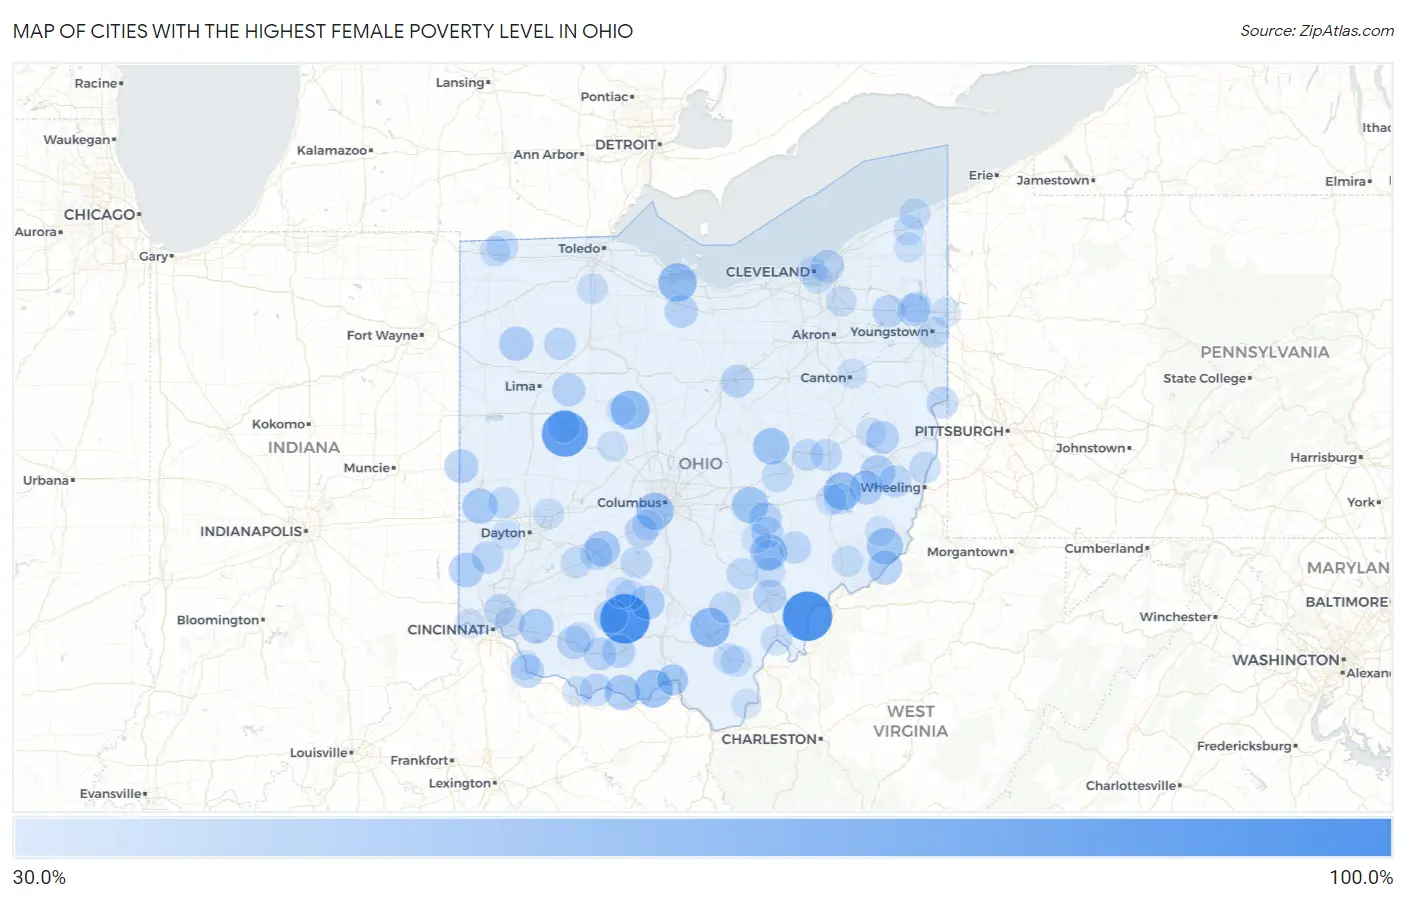
Map of Cities with the Highest Female Poverty Level in Ohio
0.0%
100.0%
Cities with the Highest Female Poverty Level in Ohio
| City | Female Poverty | vs State | vs National | |
| 1. | Hockingport | 100.0% | 14.6%(+85.4)#1 | 13.7%(+86.3)#68 |
| 2. | Cynthiana | 100.0% | 14.6%(+85.4)#2 | 13.7%(+86.3)#110 |
| 3. | Lewistown | 88.0% | 14.6%(+73.4)#3 | 13.7%(+74.3)#195 |
| 4. | Madison Place | 64.6% | 14.6%(+50.0)#4 | 13.7%(+50.9)#530 |
| 5. | Coalton | 64.1% | 14.6%(+49.5)#5 | 13.7%(+50.4)#547 |
| 6. | South Mount Vernon | 61.9% | 14.6%(+47.4)#6 | 13.7%(+48.2)#611 |
| 7. | New Bloomington | 61.5% | 14.6%(+47.0)#7 | 13.7%(+47.8)#622 |
| 8. | Whites Landing | 60.1% | 14.6%(+45.5)#8 | 13.7%(+46.4)#658 |
| 9. | Friendship | 58.2% | 14.6%(+43.6)#9 | 13.7%(+44.5)#733 |
| 10. | Old Washington | 58.1% | 14.6%(+43.6)#10 | 13.7%(+44.4)#737 |
| 11. | Urbancrest | 56.1% | 14.6%(+41.5)#11 | 13.7%(+42.4)#815 |
| 12. | Rendville | 55.6% | 14.6%(+41.0)#12 | 13.7%(+41.9)#832 |
| 13. | Brownsville | 53.2% | 14.6%(+38.6)#13 | 13.7%(+39.5)#967 |
| 14. | Nellie | 53.1% | 14.6%(+38.5)#14 | 13.7%(+39.4)#970 |
| 15. | Antioch | 52.6% | 14.6%(+38.1)#15 | 13.7%(+38.9)#999 |
| 16. | Rome Stout | 50.0% | 14.6%(+35.4)#16 | 13.7%(+36.3)#1,172 |
| 17. | Jeffersonville | 49.8% | 14.6%(+35.3)#17 | 13.7%(+36.1)#1,201 |
| 18. | Castine | 49.3% | 14.6%(+34.7)#18 | 13.7%(+35.6)#1,231 |
| 19. | Owensville | 47.2% | 14.6%(+32.6)#19 | 13.7%(+33.5)#1,376 |
| 20. | Holloway | 47.1% | 14.6%(+32.6)#20 | 13.7%(+33.4)#1,378 |
| 21. | Oxford | 47.1% | 14.6%(+32.6)#21 | 13.7%(+33.4)#1,379 |
| 22. | Bourneville | 46.4% | 14.6%(+31.9)#22 | 13.7%(+32.7)#1,414 |
| 23. | Cloverdale | 46.2% | 14.6%(+31.6)#23 | 13.7%(+32.5)#1,435 |
| 24. | Matamoras | 46.0% | 14.6%(+31.4)#24 | 13.7%(+32.3)#1,454 |
| 25. | Fairview | 45.0% | 14.6%(+30.4)#25 | 13.7%(+31.3)#1,539 |
| 26. | Highland Holiday | 44.5% | 14.6%(+30.0)#26 | 13.7%(+30.8)#1,586 |
| 27. | Union City | 44.3% | 14.6%(+29.7)#27 | 13.7%(+30.6)#1,609 |
| 28. | Neville | 42.9% | 14.6%(+28.3)#28 | 13.7%(+29.2)#1,761 |
| 29. | Athens | 42.8% | 14.6%(+28.3)#29 | 13.7%(+29.1)#1,772 |
| 30. | Sardinia | 42.5% | 14.6%(+28.0)#30 | 13.7%(+28.8)#1,789 |
| 31. | Mifflin | 42.4% | 14.6%(+27.8)#31 | 13.7%(+28.7)#1,809 |
| 32. | Scio | 42.2% | 14.6%(+27.6)#32 | 13.7%(+28.5)#1,837 |
| 33. | East Fultonham | 42.2% | 14.6%(+27.6)#33 | 13.7%(+28.5)#1,839 |
| 34. | Flat Rock | 42.1% | 14.6%(+27.5)#34 | 13.7%(+28.4)#1,859 |
| 35. | Russells Point | 42.0% | 14.6%(+27.4)#35 | 13.7%(+28.3)#1,865 |
| 36. | Alger | 41.7% | 14.6%(+27.1)#36 | 13.7%(+28.0)#1,901 |
| 37. | Peebles | 41.6% | 14.6%(+27.0)#37 | 13.7%(+27.9)#1,911 |
| 38. | Petersburg | 41.5% | 14.6%(+27.0)#38 | 13.7%(+27.8)#1,920 |
| 39. | East Cleveland | 41.4% | 14.6%(+26.9)#39 | 13.7%(+27.7)#1,928 |
| 40. | Seaman | 41.3% | 14.6%(+26.7)#40 | 13.7%(+27.6)#1,942 |
| 41. | Derby | 41.0% | 14.6%(+26.5)#41 | 13.7%(+27.4)#1,968 |
| 42. | Windham | 40.7% | 14.6%(+26.1)#42 | 13.7%(+27.0)#2,013 |
| 43. | Manchester | 40.5% | 14.6%(+26.0)#43 | 13.7%(+26.8)#2,038 |
| 44. | Bannock | 39.5% | 14.6%(+25.0)#44 | 13.7%(+25.8)#2,164 |
| 45. | Warren | 39.4% | 14.6%(+24.8)#45 | 13.7%(+25.7)#2,174 |
| 46. | West Elkton | 39.3% | 14.6%(+24.8)#46 | 13.7%(+25.6)#2,181 |
| 47. | Malta | 39.3% | 14.6%(+24.8)#47 | 13.7%(+25.6)#2,184 |
| 48. | Octa | 39.1% | 14.6%(+24.6)#48 | 13.7%(+25.4)#2,203 |
| 49. | Gilboa | 39.0% | 14.6%(+24.5)#49 | 13.7%(+25.3)#2,214 |
| 50. | Crooksville | 38.5% | 14.6%(+24.0)#50 | 13.7%(+24.8)#2,290 |
| 51. | East Liverpool | 38.2% | 14.6%(+23.6)#51 | 13.7%(+24.5)#2,334 |
| 52. | Lockland | 38.1% | 14.6%(+23.6)#52 | 13.7%(+24.4)#2,350 |
| 53. | West Lafayette | 37.9% | 14.6%(+23.3)#53 | 13.7%(+24.2)#2,384 |
| 54. | Morgandale | 37.8% | 14.6%(+23.2)#54 | 13.7%(+24.1)#2,400 |
| 55. | Haydenville | 37.7% | 14.6%(+23.1)#55 | 13.7%(+24.0)#2,408 |
| 56. | Mcarthur | 37.5% | 14.6%(+22.9)#56 | 13.7%(+23.8)#2,447 |
| 57. | Newcomerstown | 37.4% | 14.6%(+22.8)#57 | 13.7%(+23.7)#2,462 |
| 58. | New Holland | 37.2% | 14.6%(+22.7)#58 | 13.7%(+23.5)#2,488 |
| 59. | Connorville | 37.0% | 14.6%(+22.5)#59 | 13.7%(+23.3)#2,518 |
| 60. | Portsmouth | 36.8% | 14.6%(+22.3)#60 | 13.7%(+23.1)#2,550 |
| 61. | Lore City | 36.8% | 14.6%(+22.2)#61 | 13.7%(+23.1)#2,563 |
| 62. | Trinway | 36.7% | 14.6%(+22.2)#62 | 13.7%(+23.0)#2,581 |
| 63. | Port William | 36.6% | 14.6%(+22.0)#63 | 13.7%(+22.9)#2,616 |
| 64. | Alvordton | 36.2% | 14.6%(+21.6)#64 | 13.7%(+22.5)#2,679 |
| 65. | Youngstown | 36.1% | 14.6%(+21.6)#65 | 13.7%(+22.4)#2,696 |
| 66. | Potsdam | 36.1% | 14.6%(+21.5)#66 | 13.7%(+22.4)#2,704 |
| 67. | Orient | 35.6% | 14.6%(+21.0)#67 | 13.7%(+21.9)#2,828 |
| 68. | Pomeroy | 35.5% | 14.6%(+20.9)#68 | 13.7%(+21.8)#2,847 |
| 69. | Lower Salem | 35.4% | 14.6%(+20.9)#69 | 13.7%(+21.7)#2,861 |
| 70. | Rio Grande | 35.2% | 14.6%(+20.7)#70 | 13.7%(+21.5)#2,892 |
| 71. | Ashtabula | 34.7% | 14.6%(+20.2)#71 | 13.7%(+21.0)#3,003 |
| 72. | Mowrystown | 34.7% | 14.6%(+20.1)#72 | 13.7%(+21.0)#3,011 |
| 73. | South Salem | 34.7% | 14.6%(+20.1)#73 | 13.7%(+21.0)#3,015 |
| 74. | Crystal Lakes | 34.6% | 14.6%(+20.1)#74 | 13.7%(+20.9)#3,022 |
| 75. | Greenfield | 34.6% | 14.6%(+20.0)#75 | 13.7%(+20.9)#3,031 |
| 76. | Plainville | 34.3% | 14.6%(+19.7)#76 | 13.7%(+20.6)#3,097 |
| 77. | Byesville | 34.3% | 14.6%(+19.7)#77 | 13.7%(+20.6)#3,099 |
| 78. | Bowling Green | 34.3% | 14.6%(+19.7)#78 | 13.7%(+20.6)#3,101 |
| 79. | Centerville Thurman | 34.2% | 14.6%(+19.6)#79 | 13.7%(+20.5)#3,116 |
| 80. | Kunkle | 34.1% | 14.6%(+19.5)#80 | 13.7%(+20.4)#3,131 |
| 81. | New Boston | 34.1% | 14.6%(+19.5)#81 | 13.7%(+20.4)#3,134 |
| 82. | Twinsburg Heights | 33.6% | 14.6%(+19.0)#82 | 13.7%(+19.9)#3,233 |
| 83. | Austinburg | 33.6% | 14.6%(+19.0)#83 | 13.7%(+19.9)#3,237 |
| 84. | Raymond | 33.3% | 14.6%(+18.8)#84 | 13.7%(+19.6)#3,305 |
| 85. | Aberdeen | 33.3% | 14.6%(+18.7)#85 | 13.7%(+19.6)#3,333 |
| 86. | Trimble | 32.9% | 14.6%(+18.4)#86 | 13.7%(+19.2)#3,385 |
| 87. | Cleveland | 32.6% | 14.6%(+18.0)#87 | 13.7%(+18.9)#3,463 |
| 88. | Moscow | 32.5% | 14.6%(+17.9)#88 | 13.7%(+18.8)#3,492 |
| 89. | Corning | 32.5% | 14.6%(+17.9)#89 | 13.7%(+18.8)#3,493 |
| 90. | Newburgh Heights | 32.4% | 14.6%(+17.9)#90 | 13.7%(+18.7)#3,502 |
| 91. | Addyston | 32.4% | 14.6%(+17.8)#91 | 13.7%(+18.7)#3,514 |
| 92. | West Hill | 32.3% | 14.6%(+17.7)#92 | 13.7%(+18.6)#3,544 |
| 93. | Woodsfield | 32.2% | 14.6%(+17.6)#93 | 13.7%(+18.5)#3,564 |
| 94. | La Rue | 32.2% | 14.6%(+17.6)#94 | 13.7%(+18.5)#3,569 |
| 95. | Rock Creek | 32.1% | 14.6%(+17.6)#95 | 13.7%(+18.4)#3,573 |
| 96. | Crown City | 32.1% | 14.6%(+17.5)#96 | 13.7%(+18.4)#3,590 |
| 97. | New Lebanon | 32.0% | 14.6%(+17.4)#97 | 13.7%(+18.3)#3,605 |
| 98. | New Lexington | 32.0% | 14.6%(+17.4)#98 | 13.7%(+18.3)#3,618 |
| 99. | Bowerston | 31.9% | 14.6%(+17.3)#99 | 13.7%(+18.2)#3,630 |
| 100. | Canton | 31.9% | 14.6%(+17.3)#100 | 13.7%(+18.2)#3,638 |
Common Questions
What are the Top 10 Cities with the Highest Female Poverty Level in Ohio?
Top 10 Cities with the Highest Female Poverty Level in Ohio are:
#1
100.0%
#2
100.0%
#3
88.0%
#4
64.1%
#5
61.5%
#6
60.1%
#7
58.2%
#8
58.1%
#9
56.1%
#10
55.6%
What city has the Highest Female Poverty Level in Ohio?
Hockingport has the Highest Female Poverty Level in Ohio with 100.0%.
What is the Poverty Level Among Females in the State of Ohio?
Poverty Level Among Females in Ohio is 14.6%.
What is the Poverty Level Among Females in the United States?
Poverty Level Among Females in the United States is 13.7%.