Gallipolis, OH Map & Demographics
Gallipolis Map
Gallipolis Overview
$28,352
PER CAPITA INCOME
$59,028
AVG FAMILY INCOME
$48,380
AVG HOUSEHOLD INCOME
38.6%
WAGE / INCOME GAP [ % ]
61.4¢/ $1
WAGE / INCOME GAP [ $ ]
0.49
INEQUALITY / GINI INDEX
3,337
TOTAL POPULATION
1,664
MALE POPULATION
1,673
FEMALE POPULATION
99.46
MALES / 100 FEMALES
100.54
FEMALES / 100 MALES
37.0
MEDIAN AGE
3.3
AVG FAMILY SIZE
2.2
AVG HOUSEHOLD SIZE
1,028
LABOR FORCE [ PEOPLE ]
40.3%
PERCENT IN LABOR FORCE
6.0%
UNEMPLOYMENT RATE
Gallipolis Zip Codes
Gallipolis Area Codes
Income in Gallipolis
Income Overview in Gallipolis
Per Capita Income in Gallipolis is $28,352, while median incomes of families and households are $59,028 and $48,380 respectively.
| Characteristic | Number | Measure |
| Per Capita Income | 3,337 | $28,352 |
| Median Family Income | 705 | $59,028 |
| Mean Family Income | 705 | $78,827 |
| Median Household Income | 1,486 | $48,380 |
| Mean Household Income | 1,486 | $61,233 |
| Income Deficit | 705 | $0 |
| Wage / Income Gap (%) | 3,337 | 38.59% |
| Wage / Income Gap ($) | 3,337 | 61.41¢ per $1 |
| Gini / Inequality Index | 3,337 | 0.49 |
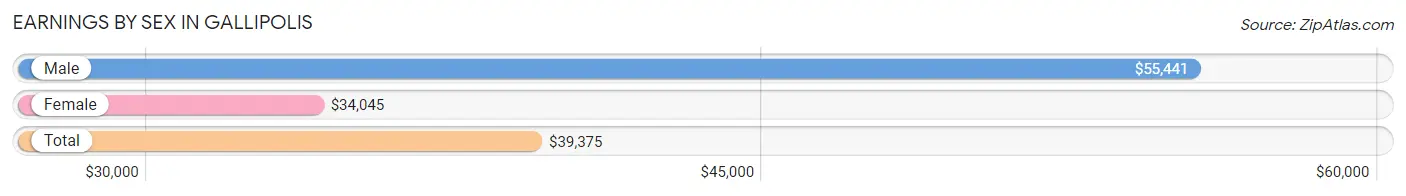
Earnings by Sex in Gallipolis
Average Earnings in Gallipolis are $39,375, $55,441 for men and $34,045 for women, a difference of 38.6%.
| Sex | Number | Average Earnings |
| Male | 630 (57.7%) | $55,441 |
| Female | 462 (42.3%) | $34,045 |
| Total | 1,092 (100.0%) | $39,375 |
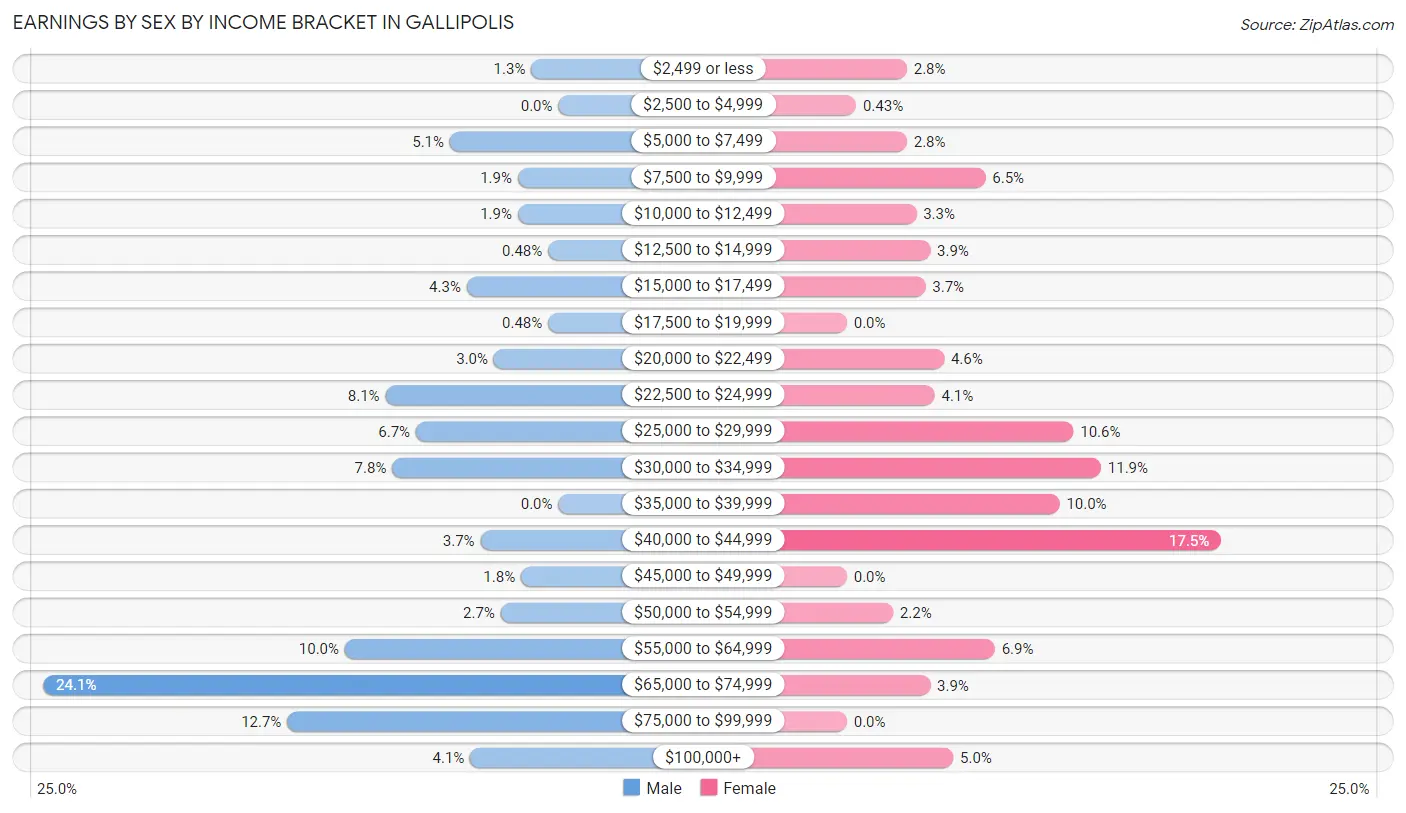
Earnings by Sex by Income Bracket in Gallipolis
The most common earnings brackets in Gallipolis are $65,000 to $74,999 for men (152 | 24.1%) and $40,000 to $44,999 for women (81 | 17.5%).
| Income | Male | Female |
| $2,499 or less | 8 (1.3%) | 13 (2.8%) |
| $2,500 to $4,999 | 0 (0.0%) | 2 (0.4%) |
| $5,000 to $7,499 | 32 (5.1%) | 13 (2.8%) |
| $7,500 to $9,999 | 12 (1.9%) | 30 (6.5%) |
| $10,000 to $12,499 | 12 (1.9%) | 15 (3.3%) |
| $12,500 to $14,999 | 3 (0.5%) | 18 (3.9%) |
| $15,000 to $17,499 | 27 (4.3%) | 17 (3.7%) |
| $17,500 to $19,999 | 3 (0.5%) | 0 (0.0%) |
| $20,000 to $22,499 | 19 (3.0%) | 21 (4.5%) |
| $22,500 to $24,999 | 51 (8.1%) | 19 (4.1%) |
| $25,000 to $29,999 | 42 (6.7%) | 49 (10.6%) |
| $30,000 to $34,999 | 49 (7.8%) | 55 (11.9%) |
| $35,000 to $39,999 | 0 (0.0%) | 46 (10.0%) |
| $40,000 to $44,999 | 23 (3.6%) | 81 (17.5%) |
| $45,000 to $49,999 | 11 (1.8%) | 0 (0.0%) |
| $50,000 to $54,999 | 17 (2.7%) | 10 (2.2%) |
| $55,000 to $64,999 | 63 (10.0%) | 32 (6.9%) |
| $65,000 to $74,999 | 152 (24.1%) | 18 (3.9%) |
| $75,000 to $99,999 | 80 (12.7%) | 0 (0.0%) |
| $100,000+ | 26 (4.1%) | 23 (5.0%) |
| Total | 630 (100.0%) | 462 (100.0%) |
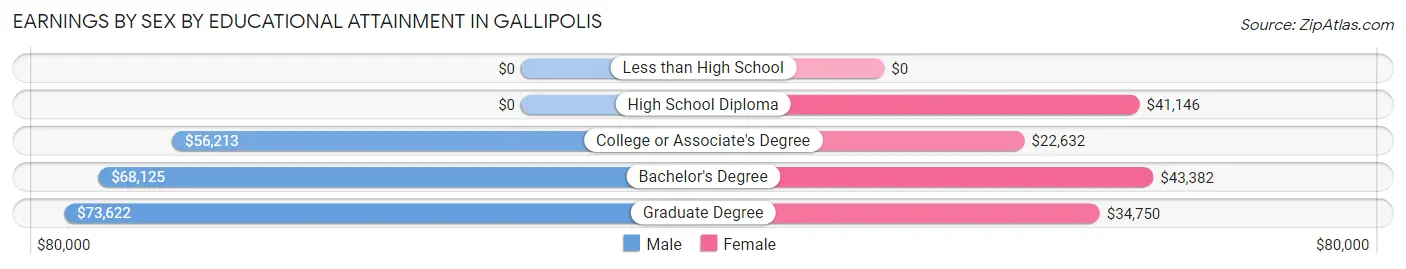
Earnings by Sex by Educational Attainment in Gallipolis
Average earnings in Gallipolis are $58,125 for men and $34,864 for women, a difference of 40.0%. Men with an educational attainment of graduate degree enjoy the highest average annual earnings of $73,622, while those with college or associate's degree education earn the least with $56,213. Women with an educational attainment of bachelor's degree earn the most with the average annual earnings of $43,382, while those with college or associate's degree education have the smallest earnings of $22,632.
| Educational Attainment | Male Income | Female Income |
| Less than High School | - | - |
| High School Diploma | - | - |
| College or Associate's Degree | $56,213 | $22,632 |
| Bachelor's Degree | $68,125 | $43,382 |
| Graduate Degree | $73,622 | $34,750 |
| Total | $58,125 | $34,864 |
Family Income in Gallipolis
Family Income Brackets in Gallipolis
According to the Gallipolis family income data, there are 205 families falling into the $100,000 to $149,999 income range, which is the most common income bracket and makes up 29.1% of all families.
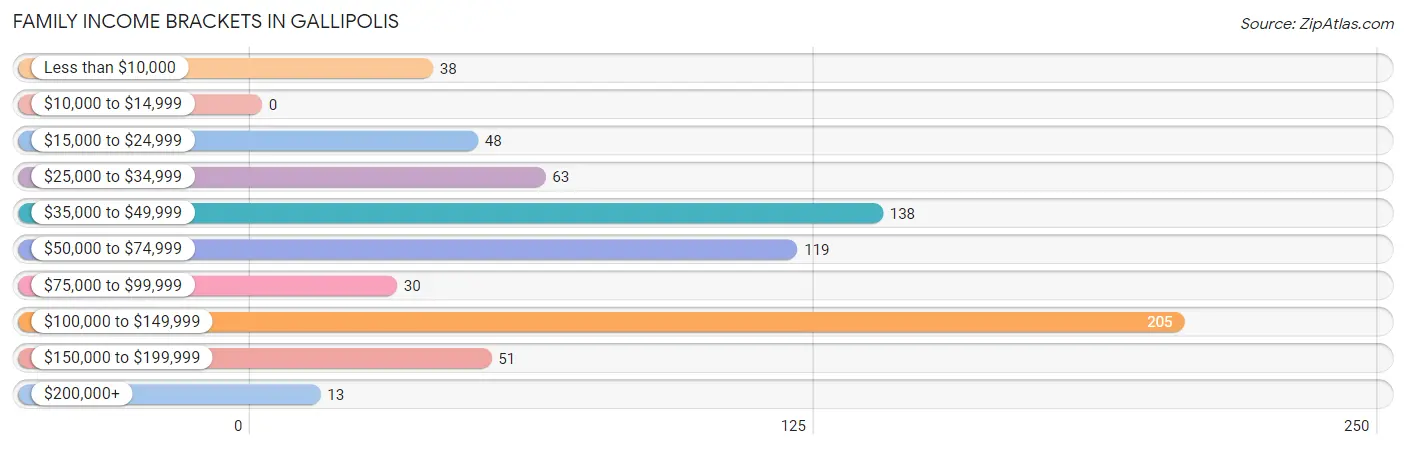
| Income Bracket | # Families | % Families |
| Less than $10,000 | 38 | 5.4% |
| $10,000 to $14,999 | 0 | 0.0% |
| $15,000 to $24,999 | 48 | 6.8% |
| $25,000 to $34,999 | 63 | 8.9% |
| $35,000 to $49,999 | 138 | 19.6% |
| $50,000 to $74,999 | 119 | 16.9% |
| $75,000 to $99,999 | 30 | 4.3% |
| $100,000 to $149,999 | 205 | 29.1% |
| $150,000 to $199,999 | 51 | 7.2% |
| $200,000+ | 13 | 1.8% |
Family Income by Famaliy Size in Gallipolis
4-person families (177 | 25.1%) account for the highest median family income in Gallipolis with $101,886 per family, while 2-person families (324 | 46.0%) have the highest median income of $27,954 per family member.
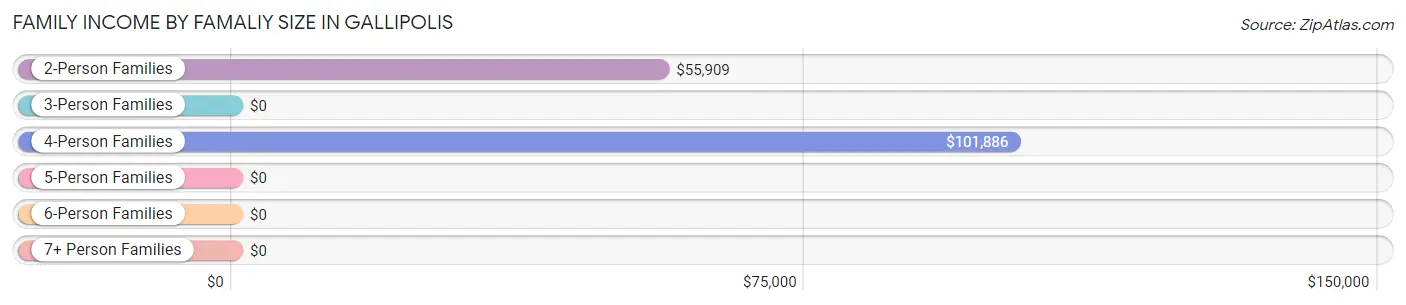
| Income Bracket | # Families | Median Income |
| 2-Person Families | 324 (46.0%) | $55,909 |
| 3-Person Families | 105 (14.9%) | $0 |
| 4-Person Families | 177 (25.1%) | $101,886 |
| 5-Person Families | 70 (9.9%) | $0 |
| 6-Person Families | 7 (1.0%) | $0 |
| 7+ Person Families | 22 (3.1%) | $0 |
| Total | 705 (100.0%) | $59,028 |
Family Income by Number of Earners in Gallipolis
The median family income in Gallipolis is $59,028, with families comprising 3+ earners (30) having the highest median family income of $168,667, while families with no earners (150) have the lowest median family income of $35,000, accounting for 4.3% and 21.3% of families, respectively.
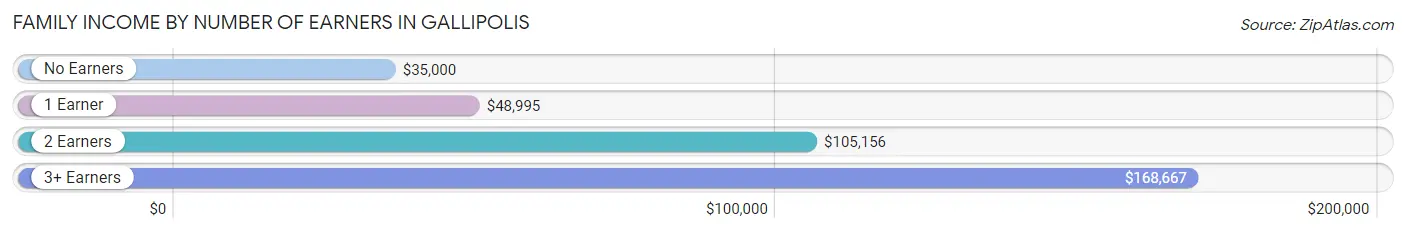
| Number of Earners | # Families | Median Income |
| No Earners | 150 (21.3%) | $35,000 |
| 1 Earner | 283 (40.1%) | $48,995 |
| 2 Earners | 242 (34.3%) | $105,156 |
| 3+ Earners | 30 (4.3%) | $168,667 |
| Total | 705 (100.0%) | $59,028 |
Household Income in Gallipolis
Household Income Brackets in Gallipolis
With 293 households falling in the category, the $50,000 to $74,999 income range is the most frequent in Gallipolis, accounting for 19.7% of all households. In contrast, only 31 households (2.1%) fall into the $200,000+ income bracket, making it the least populous group.
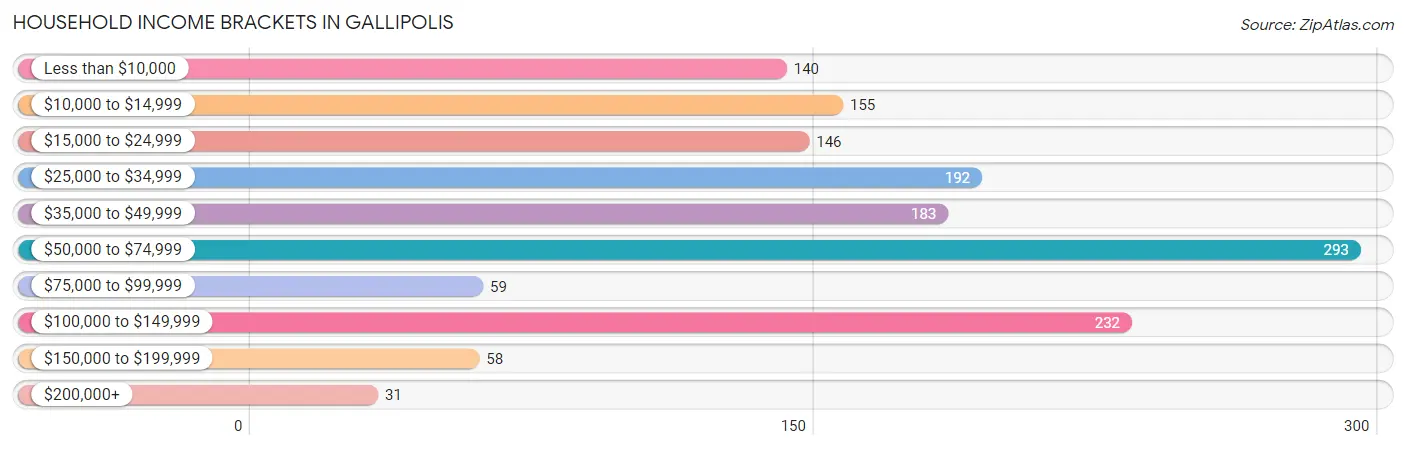
| Income Bracket | # Households | % Households |
| Less than $10,000 | 140 | 9.4% |
| $10,000 to $14,999 | 155 | 10.4% |
| $15,000 to $24,999 | 146 | 9.8% |
| $25,000 to $34,999 | 192 | 12.9% |
| $35,000 to $49,999 | 183 | 12.3% |
| $50,000 to $74,999 | 293 | 19.7% |
| $75,000 to $99,999 | 59 | 4.0% |
| $100,000 to $149,999 | 232 | 15.6% |
| $150,000 to $199,999 | 58 | 3.9% |
| $200,000+ | 31 | 2.1% |
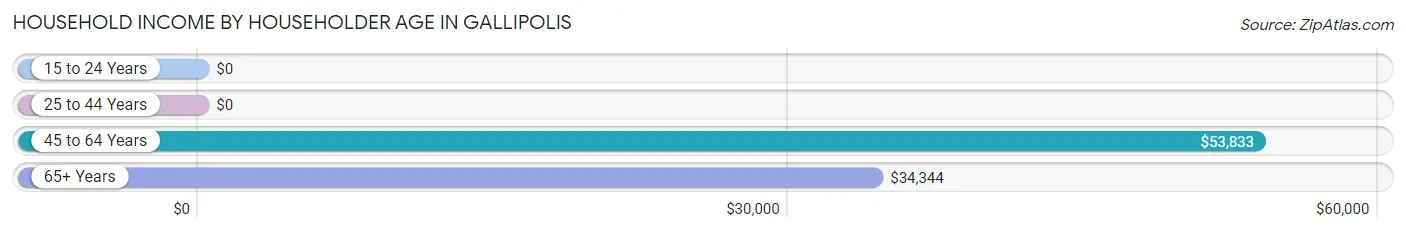
Household Income by Householder Age in Gallipolis
The median household income in Gallipolis is $48,380, with the highest median household income of $53,833 found in the 45 to 64 years age bracket for the primary householder. A total of 394 households (26.5%) fall into this category. Meanwhile, the 15 to 24 years age bracket for the primary householder has the lowest median household income of $0, with 39 households (2.6%) in this group.
| Income Bracket | # Households | Median Income |
| 15 to 24 Years | 39 (2.6%) | $0 |
| 25 to 44 Years | 377 (25.4%) | $0 |
| 45 to 64 Years | 394 (26.5%) | $53,833 |
| 65+ Years | 676 (45.5%) | $34,344 |
| Total | 1,486 (100.0%) | $48,380 |
Poverty in Gallipolis
Income Below Poverty by Sex and Age in Gallipolis
With 29.7% poverty level for males and 18.9% for females among the residents of Gallipolis, 12 to 14 year old males and 15 year old females are the most vulnerable to poverty, with 55 males (100.0%) and 17 females (100.0%) in their respective age groups living below the poverty level.
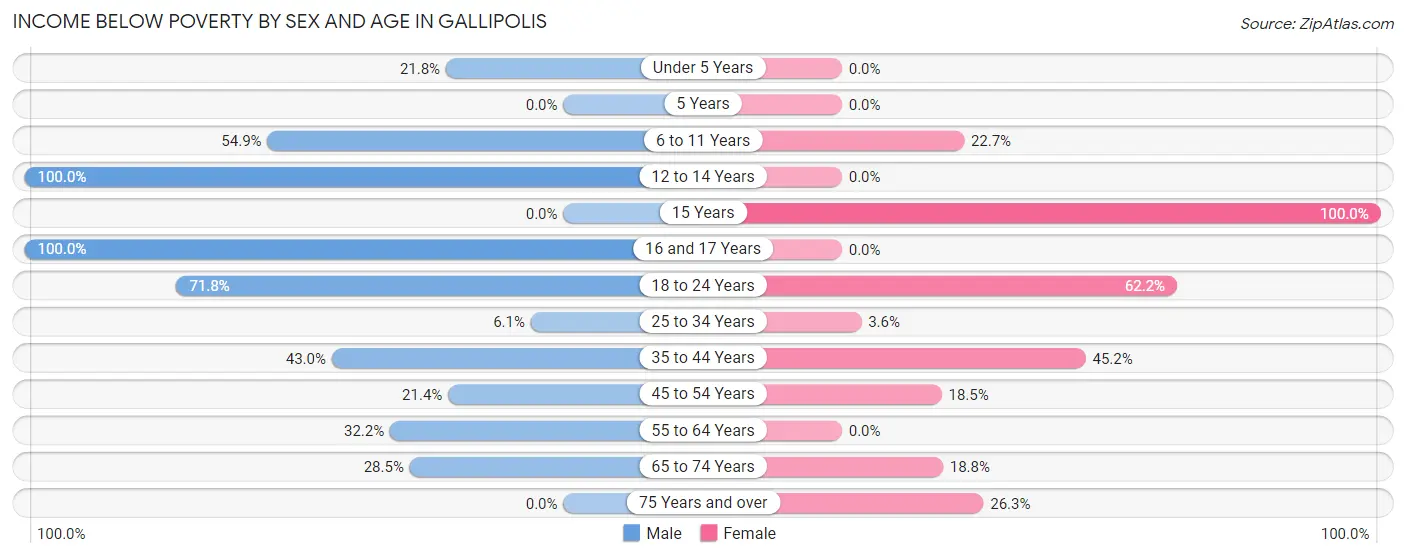
| Age Bracket | Male | Female |
| Under 5 Years | 39 (21.8%) | 0 (0.0%) |
| 5 Years | 0 (0.0%) | 0 (0.0%) |
| 6 to 11 Years | 39 (54.9%) | 51 (22.7%) |
| 12 to 14 Years | 55 (100.0%) | 0 (0.0%) |
| 15 Years | 0 (0.0%) | 17 (100.0%) |
| 16 and 17 Years | 33 (100.0%) | 0 (0.0%) |
| 18 to 24 Years | 79 (71.8%) | 79 (62.2%) |
| 25 to 34 Years | 17 (6.0%) | 9 (3.6%) |
| 35 to 44 Years | 52 (43.0%) | 38 (45.2%) |
| 45 to 54 Years | 31 (21.4%) | 25 (18.5%) |
| 55 to 64 Years | 64 (32.2%) | 0 (0.0%) |
| 65 to 74 Years | 67 (28.5%) | 39 (18.8%) |
| 75 Years and over | 0 (0.0%) | 57 (26.3%) |
| Total | 476 (29.7%) | 315 (18.9%) |
Income Above Poverty by Sex and Age in Gallipolis
According to the poverty statistics in Gallipolis, males aged 5 years and females aged under 5 years are the age groups that are most secure financially, with 100.0% of males and 100.0% of females in these age groups living above the poverty line.
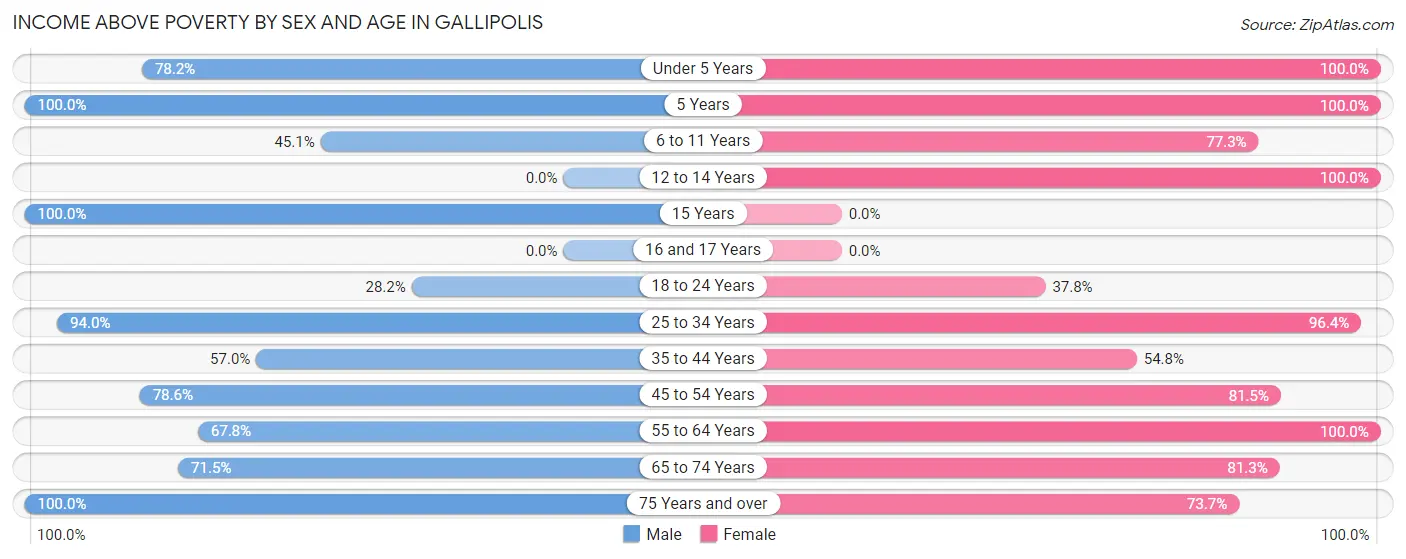
| Age Bracket | Male | Female |
| Under 5 Years | 140 (78.2%) | 181 (100.0%) |
| 5 Years | 21 (100.0%) | 10 (100.0%) |
| 6 to 11 Years | 32 (45.1%) | 174 (77.3%) |
| 12 to 14 Years | 0 (0.0%) | 18 (100.0%) |
| 15 Years | 8 (100.0%) | 0 (0.0%) |
| 16 and 17 Years | 0 (0.0%) | 0 (0.0%) |
| 18 to 24 Years | 31 (28.2%) | 48 (37.8%) |
| 25 to 34 Years | 264 (94.0%) | 240 (96.4%) |
| 35 to 44 Years | 69 (57.0%) | 46 (54.8%) |
| 45 to 54 Years | 114 (78.6%) | 110 (81.5%) |
| 55 to 64 Years | 135 (67.8%) | 198 (100.0%) |
| 65 to 74 Years | 168 (71.5%) | 169 (81.2%) |
| 75 Years and over | 145 (100.0%) | 160 (73.7%) |
| Total | 1,127 (70.3%) | 1,354 (81.1%) |
Income Below Poverty Among Married-Couple Families in Gallipolis
The poverty statistics for married-couple families in Gallipolis show that 4.0% or 17 of the total 424 families live below the poverty line. Families with no children have the highest poverty rate of 7.6%, comprising of 17 families. On the other hand, families with 1 or 2 children have the lowest poverty rate of 0.0%, which includes 0 families.
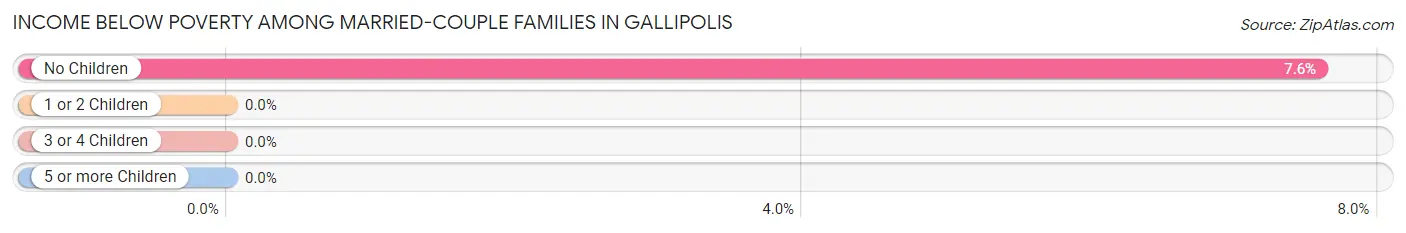
| Children | Above Poverty | Below Poverty |
| No Children | 207 (92.4%) | 17 (7.6%) |
| 1 or 2 Children | 152 (100.0%) | 0 (0.0%) |
| 3 or 4 Children | 26 (100.0%) | 0 (0.0%) |
| 5 or more Children | 22 (100.0%) | 0 (0.0%) |
| Total | 407 (96.0%) | 17 (4.0%) |
Income Below Poverty Among Single-Parent Households in Gallipolis
According to the poverty data in Gallipolis, 39.5% or 45 single-father households and 23.4% or 39 single-mother households are living below the poverty line. Among single-father households, those with 1 or 2 children have the highest poverty rate, with 45 households (80.4%) experiencing poverty. Likewise, among single-mother households, those with 3 or 4 children have the highest poverty rate, with 17 households (47.2%) falling below the poverty line.
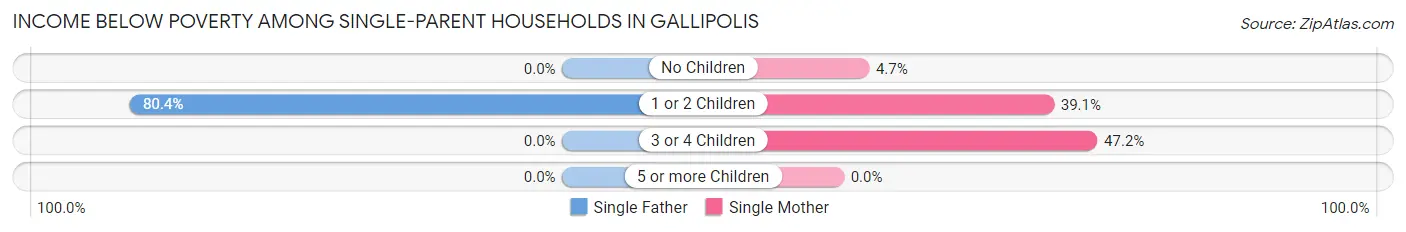
| Children | Single Father | Single Mother |
| No Children | 0 (0.0%) | 4 (4.7%) |
| 1 or 2 Children | 45 (80.4%) | 18 (39.1%) |
| 3 or 4 Children | 0 (0.0%) | 17 (47.2%) |
| 5 or more Children | 0 (0.0%) | 0 (0.0%) |
| Total | 45 (39.5%) | 39 (23.4%) |
Income Below Poverty Among Married-Couple vs Single-Parent Households in Gallipolis
The poverty data for Gallipolis shows that 17 of the married-couple family households (4.0%) and 84 of the single-parent households (29.9%) are living below the poverty level. Within the married-couple family households, those with no children have the highest poverty rate, with 17 households (7.6%) falling below the poverty line. Among the single-parent households, those with 1 or 2 children have the highest poverty rate, with 63 household (61.8%) living below poverty.
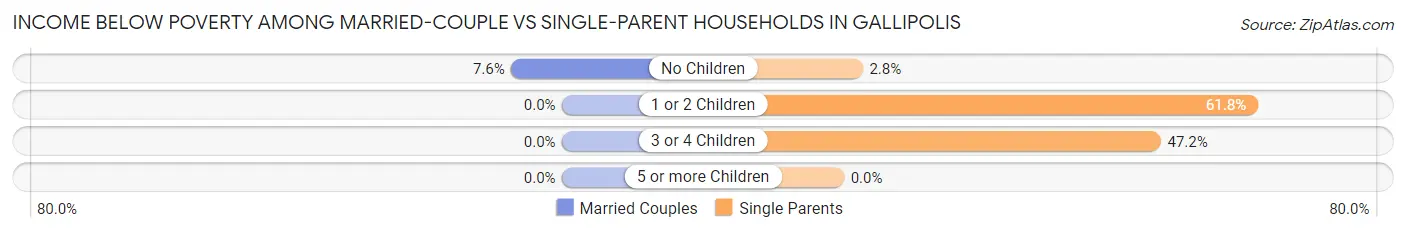
| Children | Married-Couple Families | Single-Parent Households |
| No Children | 17 (7.6%) | 4 (2.8%) |
| 1 or 2 Children | 0 (0.0%) | 63 (61.8%) |
| 3 or 4 Children | 0 (0.0%) | 17 (47.2%) |
| 5 or more Children | 0 (0.0%) | 0 (0.0%) |
| Total | 17 (4.0%) | 84 (29.9%) |
Race in Gallipolis
The most populous races in Gallipolis are White / Caucasian (2,603 | 78.0%), Two or more Races (386 | 11.6%), and Black / African American (212 | 6.4%).
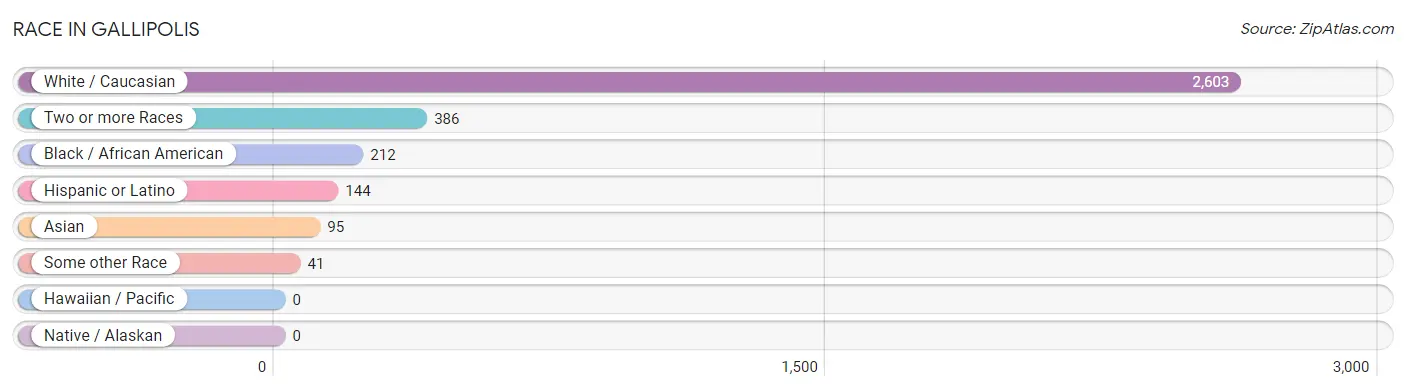
| Race | # Population | % Population |
| Asian | 95 | 2.9% |
| Black / African American | 212 | 6.4% |
| Hawaiian / Pacific | 0 | 0.0% |
| Hispanic or Latino | 144 | 4.3% |
| Native / Alaskan | 0 | 0.0% |
| White / Caucasian | 2,603 | 78.0% |
| Two or more Races | 386 | 11.6% |
| Some other Race | 41 | 1.2% |
| Total | 3,337 | 100.0% |
Ancestry in Gallipolis
The most populous ancestries reported in Gallipolis are Irish (473 | 14.2%), German (362 | 10.8%), American (218 | 6.5%), English (194 | 5.8%), and Mexican (144 | 4.3%), together accounting for 41.7% of all Gallipolis residents.
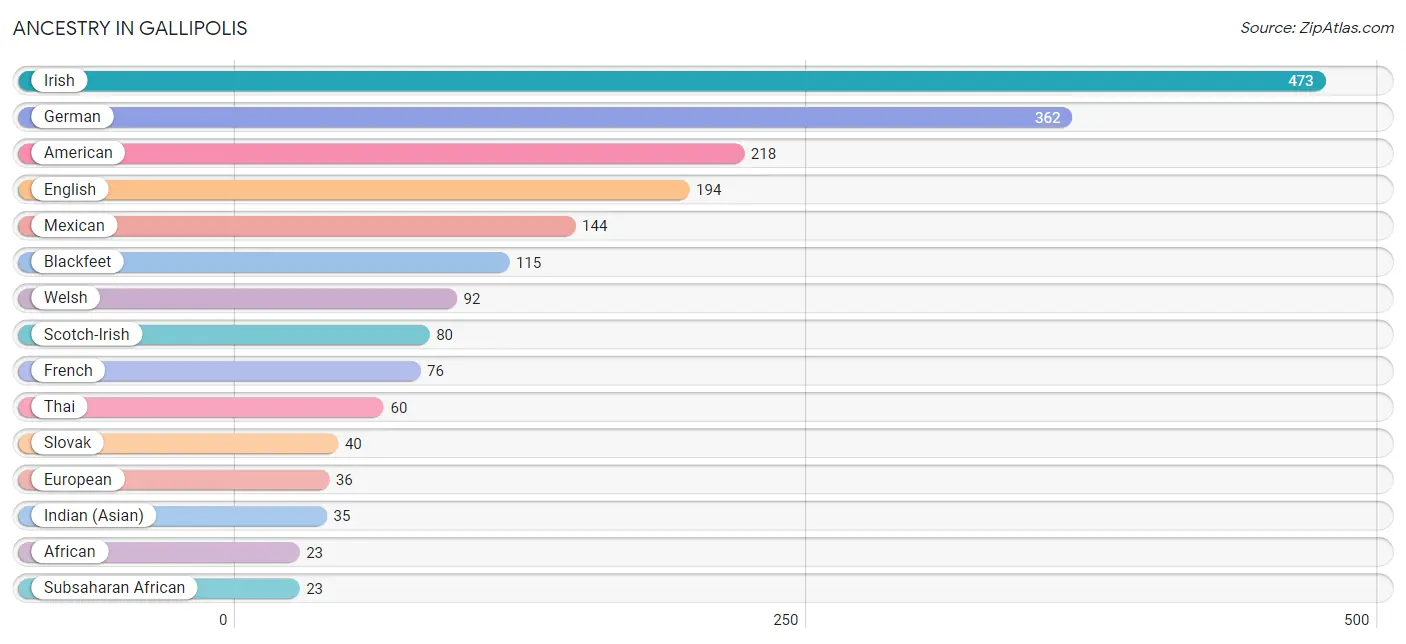
| Ancestry | # Population | % Population |
| African | 23 | 0.7% |
| American | 218 | 6.5% |
| Blackfeet | 115 | 3.5% |
| British | 10 | 0.3% |
| Bulgarian | 11 | 0.3% |
| Burmese | 7 | 0.2% |
| Dutch | 21 | 0.6% |
| English | 194 | 5.8% |
| European | 36 | 1.1% |
| French | 76 | 2.3% |
| German | 362 | 10.8% |
| Indian (Asian) | 35 | 1.1% |
| Irish | 473 | 14.2% |
| Italian | 21 | 0.6% |
| Mexican | 144 | 4.3% |
| Northern European | 9 | 0.3% |
| Polish | 12 | 0.4% |
| Russian | 18 | 0.5% |
| Scotch-Irish | 80 | 2.4% |
| Scottish | 19 | 0.6% |
| Slovak | 40 | 1.2% |
| Subsaharan African | 23 | 0.7% |
| Swiss | 11 | 0.3% |
| Thai | 60 | 1.8% |
| Welsh | 92 | 2.8% | View All 25 Rows |
Immigrants in Gallipolis
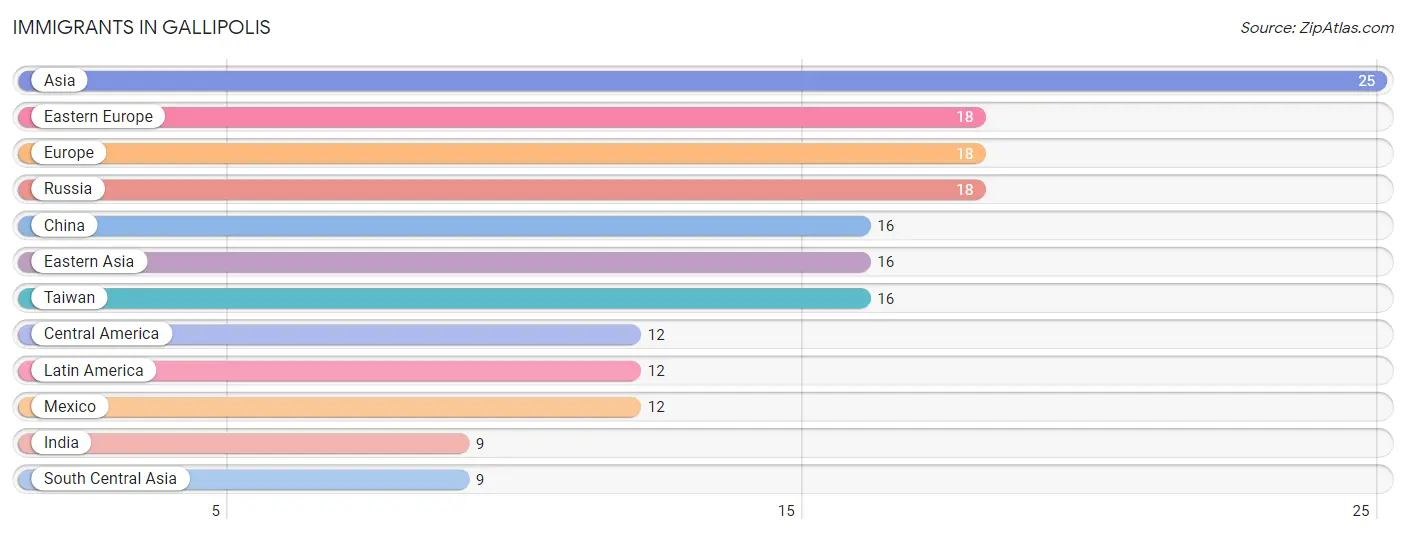
The most numerous immigrant groups reported in Gallipolis came from Asia (25 | 0.7%), Eastern Europe (18 | 0.5%), Europe (18 | 0.5%), Russia (18 | 0.5%), and China (16 | 0.5%), together accounting for 2.8% of all Gallipolis residents.
| Immigration Origin | # Population | % Population |
| Asia | 25 | 0.7% |
| Central America | 12 | 0.4% |
| China | 16 | 0.5% |
| Eastern Asia | 16 | 0.5% |
| Eastern Europe | 18 | 0.5% |
| Europe | 18 | 0.5% |
| India | 9 | 0.3% |
| Latin America | 12 | 0.4% |
| Mexico | 12 | 0.4% |
| Russia | 18 | 0.5% |
| South Central Asia | 9 | 0.3% |
| Taiwan | 16 | 0.5% | View All 12 Rows |
Sex and Age in Gallipolis
Sex and Age in Gallipolis
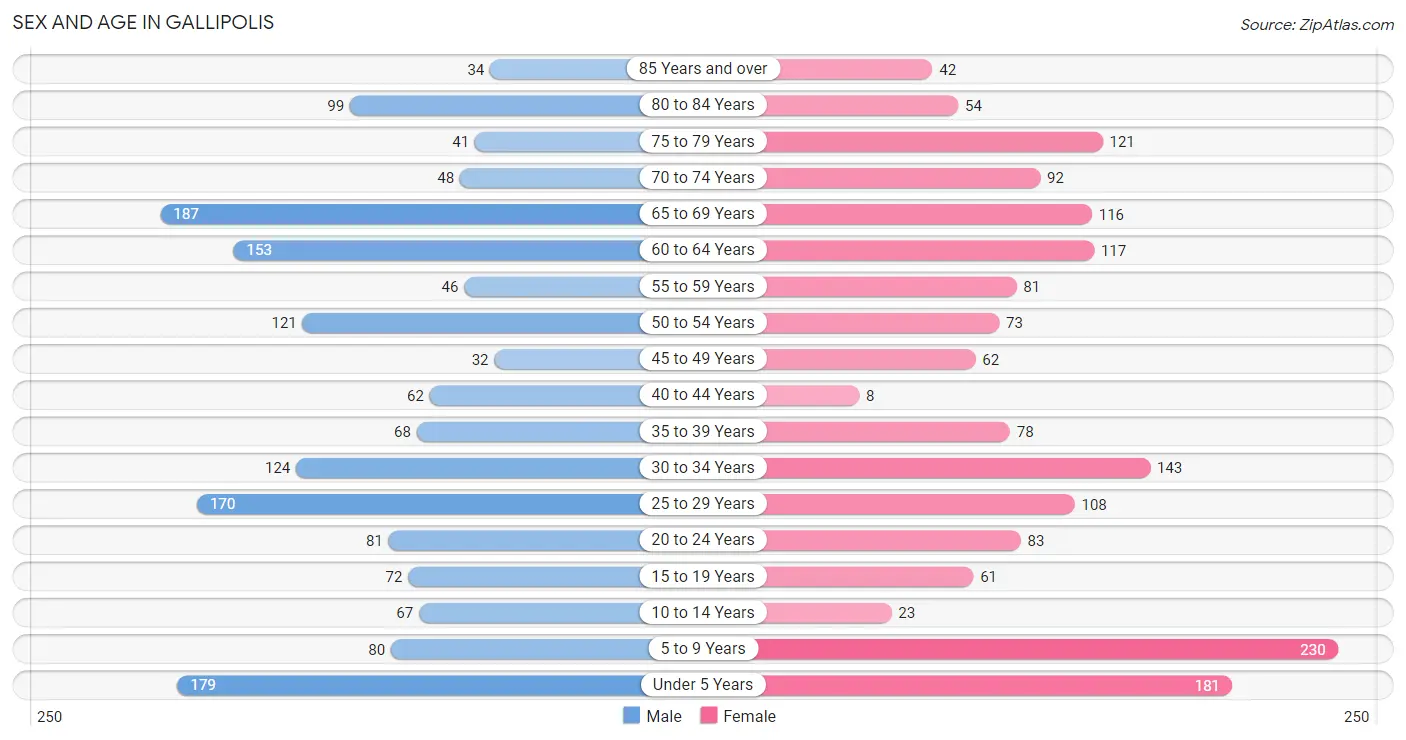
The most populous age groups in Gallipolis are 65 to 69 Years (187 | 11.2%) for men and 5 to 9 Years (230 | 13.8%) for women.
| Age Bracket | Male | Female |
| Under 5 Years | 179 (10.8%) | 181 (10.8%) |
| 5 to 9 Years | 80 (4.8%) | 230 (13.8%) |
| 10 to 14 Years | 67 (4.0%) | 23 (1.4%) |
| 15 to 19 Years | 72 (4.3%) | 61 (3.6%) |
| 20 to 24 Years | 81 (4.9%) | 83 (5.0%) |
| 25 to 29 Years | 170 (10.2%) | 108 (6.5%) |
| 30 to 34 Years | 124 (7.4%) | 143 (8.6%) |
| 35 to 39 Years | 68 (4.1%) | 78 (4.7%) |
| 40 to 44 Years | 62 (3.7%) | 8 (0.5%) |
| 45 to 49 Years | 32 (1.9%) | 62 (3.7%) |
| 50 to 54 Years | 121 (7.3%) | 73 (4.4%) |
| 55 to 59 Years | 46 (2.8%) | 81 (4.8%) |
| 60 to 64 Years | 153 (9.2%) | 117 (7.0%) |
| 65 to 69 Years | 187 (11.2%) | 116 (6.9%) |
| 70 to 74 Years | 48 (2.9%) | 92 (5.5%) |
| 75 to 79 Years | 41 (2.5%) | 121 (7.2%) |
| 80 to 84 Years | 99 (5.9%) | 54 (3.2%) |
| 85 Years and over | 34 (2.0%) | 42 (2.5%) |
| Total | 1,664 (100.0%) | 1,673 (100.0%) |
Families and Households in Gallipolis
Median Family Size in Gallipolis
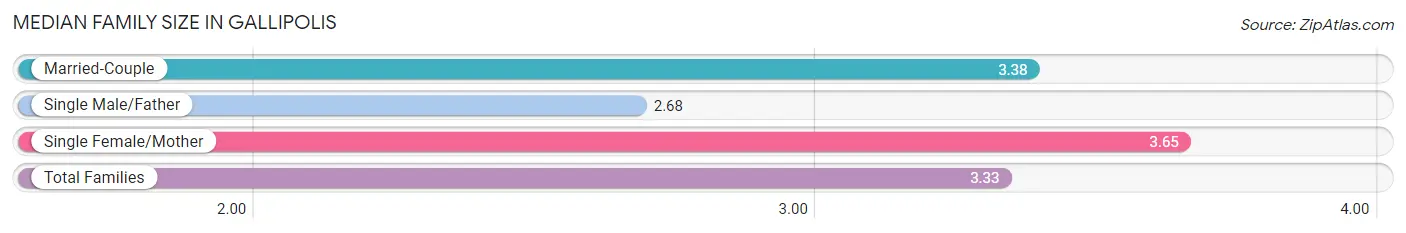
The median family size in Gallipolis is 3.33 persons per family, with single female/mother families (167 | 23.7%) accounting for the largest median family size of 3.65 persons per family. On the other hand, single male/father families (114 | 16.2%) represent the smallest median family size with 2.68 persons per family.
| Family Type | # Families | Family Size |
| Married-Couple | 424 (60.1%) | 3.38 |
| Single Male/Father | 114 (16.2%) | 2.68 |
| Single Female/Mother | 167 (23.7%) | 3.65 |
| Total Families | 705 (100.0%) | 3.33 |
Median Household Size in Gallipolis
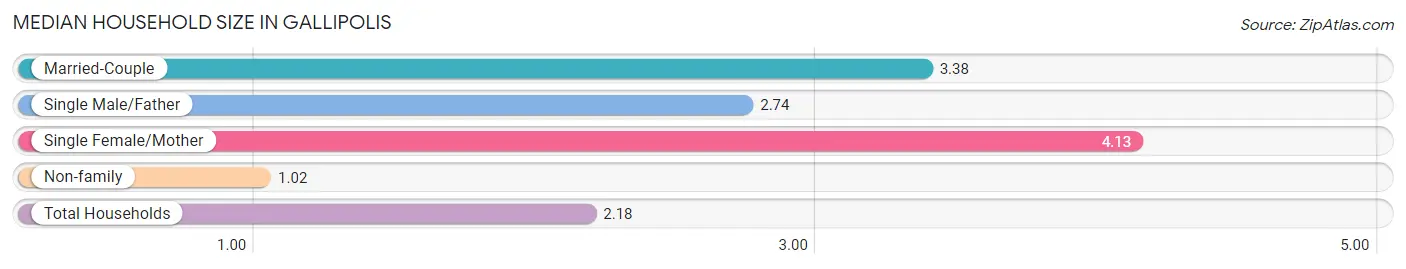
The median household size in Gallipolis is 2.18 persons per household, with single female/mother households (167 | 11.2%) accounting for the largest median household size of 4.13 persons per household. non-family households (781 | 52.6%) represent the smallest median household size with 1.02 persons per household.
| Household Type | # Households | Household Size |
| Married-Couple | 424 (28.5%) | 3.38 |
| Single Male/Father | 114 (7.7%) | 2.74 |
| Single Female/Mother | 167 (11.2%) | 4.13 |
| Non-family | 781 (52.6%) | 1.02 |
| Total Households | 1,486 (100.0%) | 2.18 |
Household Size by Marriage Status in Gallipolis
Out of a total of 1,486 households in Gallipolis, 705 (47.4%) are family households, while 781 (52.6%) are nonfamily households. The most numerous type of family households are 2-person households, comprising 282, and the most common type of nonfamily households are 1-person households, comprising 760.
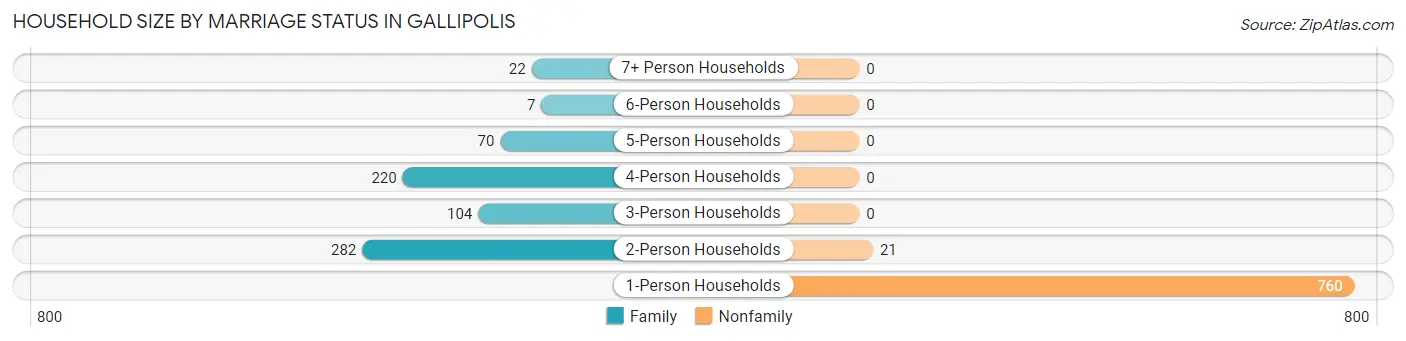
| Household Size | Family Households | Nonfamily Households |
| 1-Person Households | - | 760 (51.1%) |
| 2-Person Households | 282 (19.0%) | 21 (1.4%) |
| 3-Person Households | 104 (7.0%) | 0 (0.0%) |
| 4-Person Households | 220 (14.8%) | 0 (0.0%) |
| 5-Person Households | 70 (4.7%) | 0 (0.0%) |
| 6-Person Households | 7 (0.5%) | 0 (0.0%) |
| 7+ Person Households | 22 (1.5%) | 0 (0.0%) |
| Total | 705 (47.4%) | 781 (52.6%) |
Female Fertility in Gallipolis
Fertility by Age in Gallipolis
Average fertility rate in Gallipolis is 184.0 births per 1,000 women. Women in the age bracket of 20 to 34 years have the highest fertility rate with 246.0 births per 1,000 women. Women in the age bracket of 20 to 34 years acount for 82.0% of all women with births.
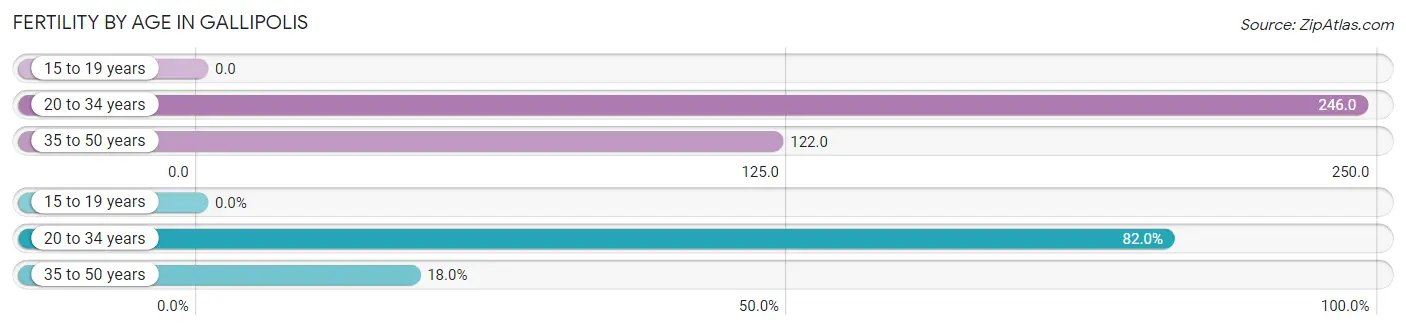
| Age Bracket | Women with Births | Births / 1,000 Women |
| 15 to 19 years | 0 (0.0%) | 0.0 |
| 20 to 34 years | 82 (82.0%) | 246.0 |
| 35 to 50 years | 18 (18.0%) | 122.0 |
| Total | 100 (100.0%) | 184.0 |
Fertility by Age by Marriage Status in Gallipolis
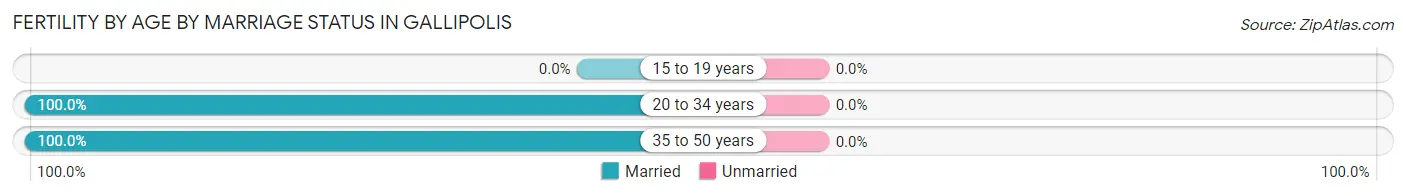
| Age Bracket | Married | Unmarried |
| 15 to 19 years | 0 (0.0%) | 0 (0.0%) |
| 20 to 34 years | 82 (100.0%) | 0 (0.0%) |
| 35 to 50 years | 18 (100.0%) | 0 (0.0%) |
| Total | 100 (100.0%) | 0 (0.0%) |
Fertility by Education in Gallipolis
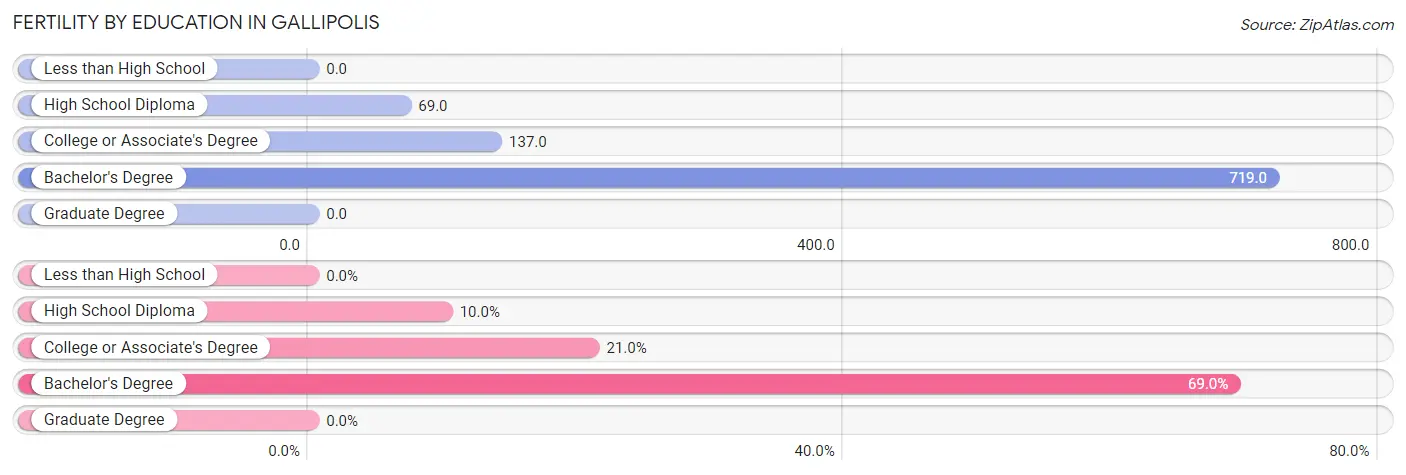
| Educational Attainment | Women with Births | Births / 1,000 Women |
| Less than High School | 0 (0.0%) | 0.0 |
| High School Diploma | 10 (10.0%) | 69.0 |
| College or Associate's Degree | 21 (21.0%) | 137.0 |
| Bachelor's Degree | 69 (69.0%) | 719.0 |
| Graduate Degree | 0 (0.0%) | 0.0 |
| Total | 100 (100.0%) | 184.0 |
Fertility by Education by Marriage Status in Gallipolis
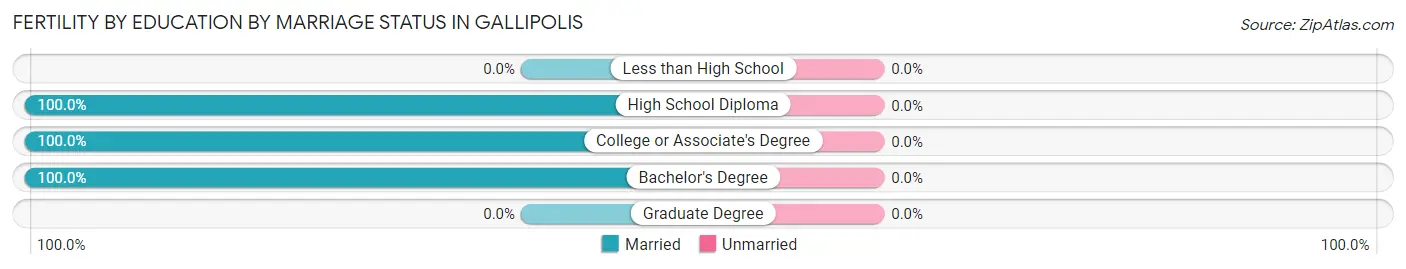
| Educational Attainment | Married | Unmarried |
| Less than High School | 0 (0.0%) | 0 (0.0%) |
| High School Diploma | 10 (100.0%) | 0 (0.0%) |
| College or Associate's Degree | 21 (100.0%) | 0 (0.0%) |
| Bachelor's Degree | 69 (100.0%) | 0 (0.0%) |
| Graduate Degree | 0 (0.0%) | 0 (0.0%) |
| Total | 100 (100.0%) | 0 (0.0%) |
Employment Characteristics in Gallipolis
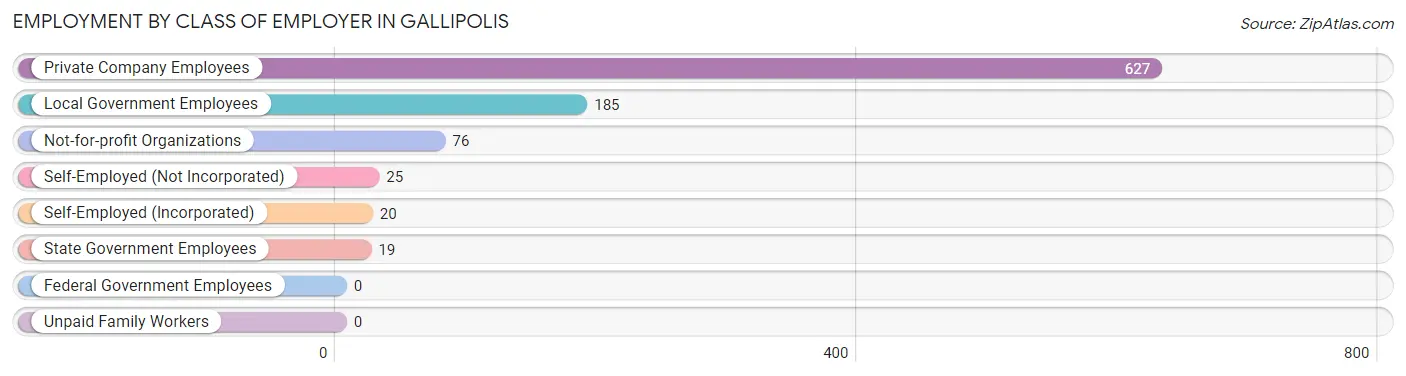
Employment by Class of Employer in Gallipolis
Among the 952 employed individuals in Gallipolis, private company employees (627 | 65.9%), local government employees (185 | 19.4%), and not-for-profit organizations (76 | 8.0%) make up the most common classes of employment.
| Employer Class | # Employees | % Employees |
| Private Company Employees | 627 | 65.9% |
| Self-Employed (Incorporated) | 20 | 2.1% |
| Self-Employed (Not Incorporated) | 25 | 2.6% |
| Not-for-profit Organizations | 76 | 8.0% |
| Local Government Employees | 185 | 19.4% |
| State Government Employees | 19 | 2.0% |
| Federal Government Employees | 0 | 0.0% |
| Unpaid Family Workers | 0 | 0.0% |
| Total | 952 | 100.0% |
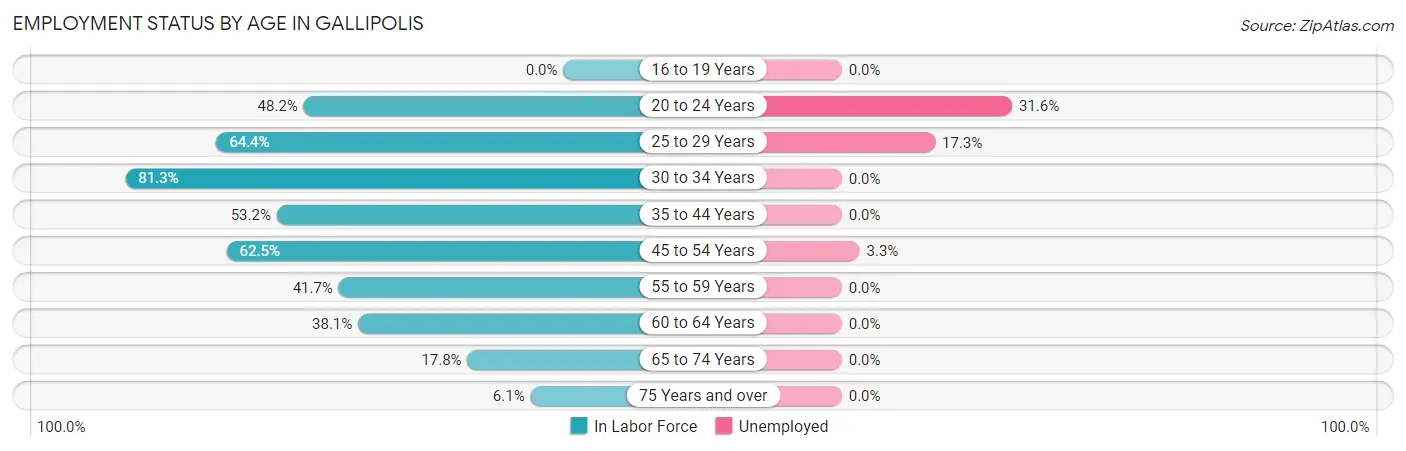
Employment Status by Age in Gallipolis
According to the labor force statistics for Gallipolis, out of the total population over 16 years of age (2,552), 40.3% or 1,028 individuals are in the labor force, with 6.0% or 62 of them unemployed. The age group with the highest labor force participation rate is 30 to 34 years, with 81.3% or 217 individuals in the labor force. Within the labor force, the 20 to 24 years age range has the highest percentage of unemployed individuals, with 31.6% or 25 of them being unemployed.
| Age Bracket | In Labor Force | Unemployed |
| 16 to 19 Years | 0 (0.0%) | 0 (0.0%) |
| 20 to 24 Years | 79 (48.2%) | 25 (31.6%) |
| 25 to 29 Years | 179 (64.4%) | 31 (17.3%) |
| 30 to 34 Years | 217 (81.3%) | 0 (0.0%) |
| 35 to 44 Years | 115 (53.2%) | 0 (0.0%) |
| 45 to 54 Years | 180 (62.5%) | 6 (3.3%) |
| 55 to 59 Years | 53 (41.7%) | 0 (0.0%) |
| 60 to 64 Years | 103 (38.1%) | 0 (0.0%) |
| 65 to 74 Years | 79 (17.8%) | 0 (0.0%) |
| 75 Years and over | 24 (6.1%) | 0 (0.0%) |
| Total | 1,028 (40.3%) | 62 (6.0%) |
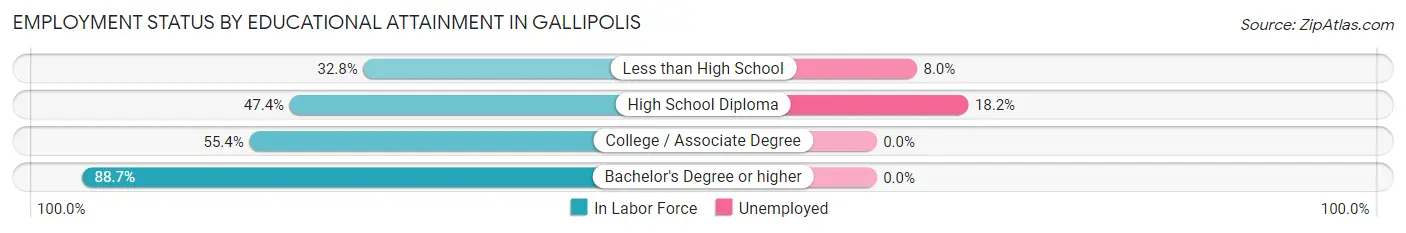
Employment Status by Educational Attainment in Gallipolis
According to labor force statistics for Gallipolis, 58.6% of individuals (847) out of the total population between 25 and 64 years of age (1,446) are in the labor force, with 4.4% or 37 of them being unemployed. The group with the highest labor force participation rate are those with the educational attainment of bachelor's degree or higher, with 88.7% or 337 individuals in the labor force. Within the labor force, individuals with high school diploma education have the highest percentage of unemployment, with 18.2% or 31 of them being unemployed.
| Educational Attainment | In Labor Force | Unemployed |
| Less than High School | 75 (32.8%) | 18 (8.0%) |
| High School Diploma | 170 (47.4%) | 65 (18.2%) |
| College / Associate Degree | 265 (55.4%) | 0 (0.0%) |
| Bachelor's Degree or higher | 337 (88.7%) | 0 (0.0%) |
| Total | 847 (58.6%) | 64 (4.4%) |
Employment Occupations by Sex in Gallipolis
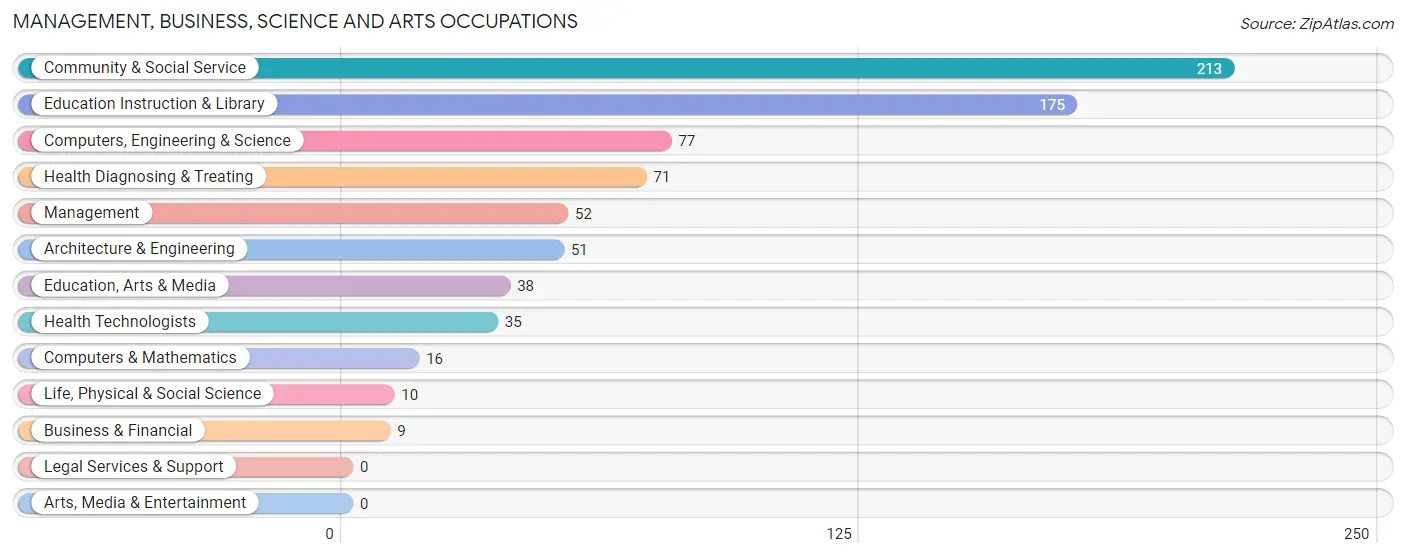
Management, Business, Science and Arts Occupations
The most common Management, Business, Science and Arts occupations in Gallipolis are Community & Social Service (213 | 22.0%), Education Instruction & Library (175 | 18.1%), Computers, Engineering & Science (77 | 8.0%), Health Diagnosing & Treating (71 | 7.3%), and Management (52 | 5.4%).
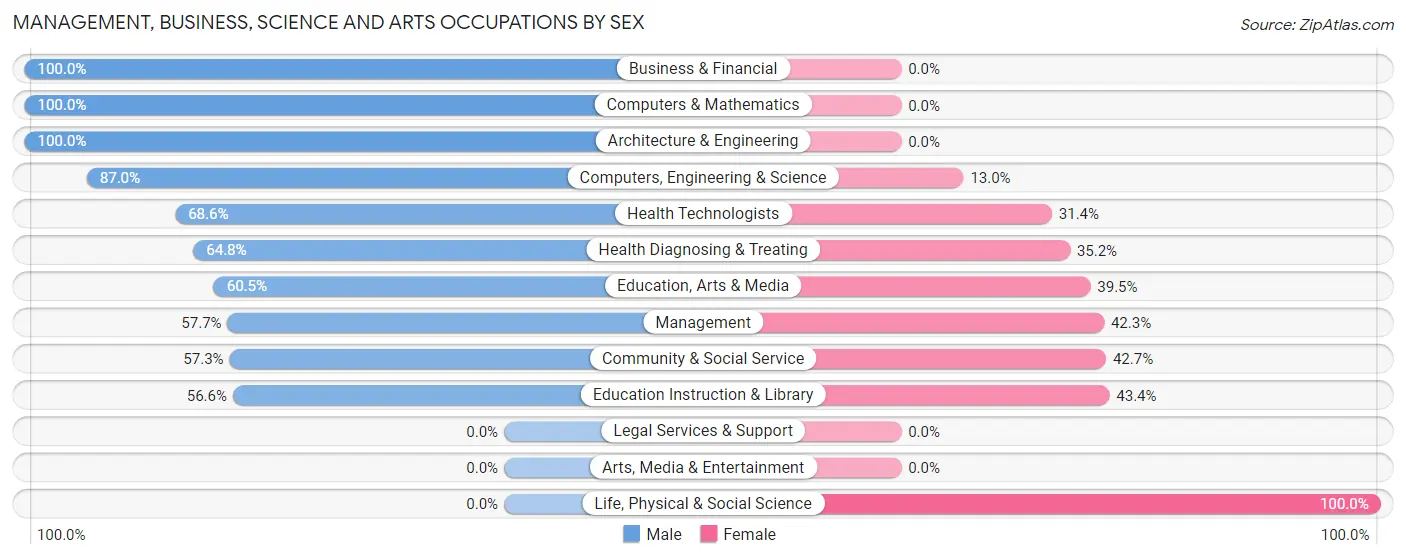
Management, Business, Science and Arts Occupations by Sex
Within the Management, Business, Science and Arts occupations in Gallipolis, the most male-oriented occupations are Business & Financial (100.0%), Computers & Mathematics (100.0%), and Architecture & Engineering (100.0%), while the most female-oriented occupations are Life, Physical & Social Science (100.0%), Education Instruction & Library (43.4%), and Community & Social Service (42.7%).
| Occupation | Male | Female |
| Management | 30 (57.7%) | 22 (42.3%) |
| Business & Financial | 9 (100.0%) | 0 (0.0%) |
| Computers, Engineering & Science | 67 (87.0%) | 10 (13.0%) |
| Computers & Mathematics | 16 (100.0%) | 0 (0.0%) |
| Architecture & Engineering | 51 (100.0%) | 0 (0.0%) |
| Life, Physical & Social Science | 0 (0.0%) | 10 (100.0%) |
| Community & Social Service | 122 (57.3%) | 91 (42.7%) |
| Education, Arts & Media | 23 (60.5%) | 15 (39.5%) |
| Legal Services & Support | 0 (0.0%) | 0 (0.0%) |
| Education Instruction & Library | 99 (56.6%) | 76 (43.4%) |
| Arts, Media & Entertainment | 0 (0.0%) | 0 (0.0%) |
| Health Diagnosing & Treating | 46 (64.8%) | 25 (35.2%) |
| Health Technologists | 24 (68.6%) | 11 (31.4%) |
| Total (Category) | 274 (64.9%) | 148 (35.1%) |
| Total (Overall) | 559 (57.8%) | 408 (42.2%) |
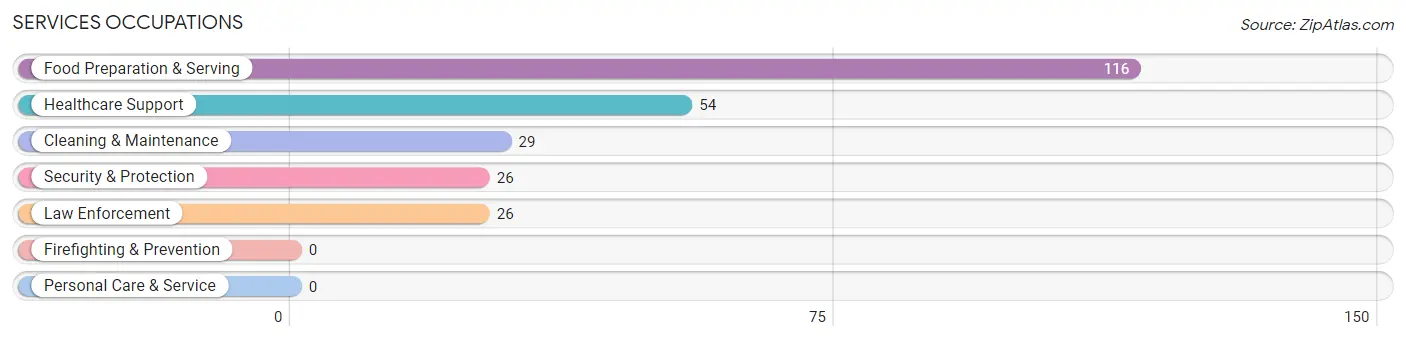
Services Occupations
The most common Services occupations in Gallipolis are Food Preparation & Serving (116 | 12.0%), Healthcare Support (54 | 5.6%), Cleaning & Maintenance (29 | 3.0%), Security & Protection (26 | 2.7%), and Law Enforcement (26 | 2.7%).
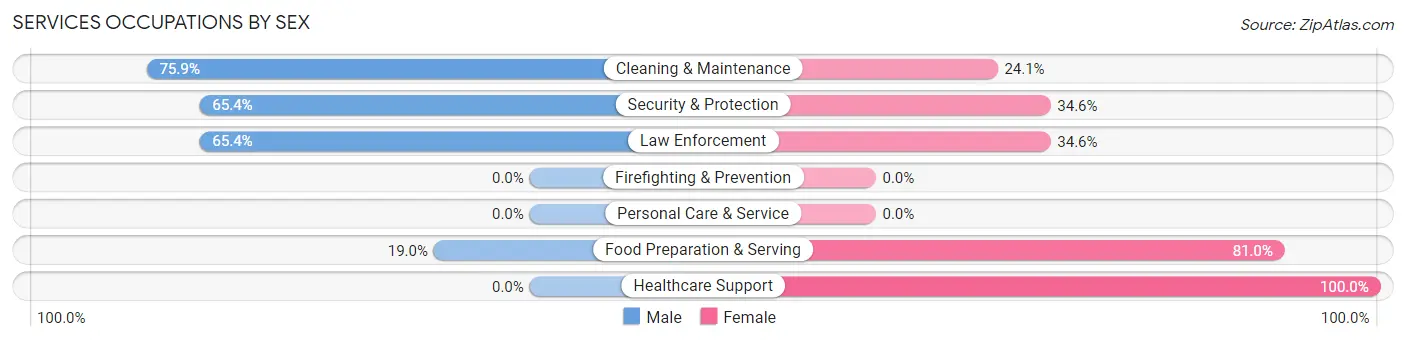
Services Occupations by Sex
Within the Services occupations in Gallipolis, the most male-oriented occupations are Cleaning & Maintenance (75.9%), Security & Protection (65.4%), and Law Enforcement (65.4%), while the most female-oriented occupations are Healthcare Support (100.0%), Food Preparation & Serving (81.0%), and Security & Protection (34.6%).
| Occupation | Male | Female |
| Healthcare Support | 0 (0.0%) | 54 (100.0%) |
| Security & Protection | 17 (65.4%) | 9 (34.6%) |
| Firefighting & Prevention | 0 (0.0%) | 0 (0.0%) |
| Law Enforcement | 17 (65.4%) | 9 (34.6%) |
| Food Preparation & Serving | 22 (19.0%) | 94 (81.0%) |
| Cleaning & Maintenance | 22 (75.9%) | 7 (24.1%) |
| Personal Care & Service | 0 (0.0%) | 0 (0.0%) |
| Total (Category) | 61 (27.1%) | 164 (72.9%) |
| Total (Overall) | 559 (57.8%) | 408 (42.2%) |
Sales and Office Occupations
The most common Sales and Office occupations in Gallipolis are Office & Administration (82 | 8.5%), and Sales & Related (58 | 6.0%).
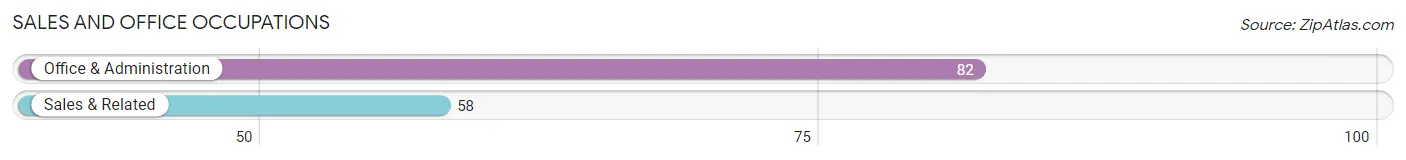
Sales and Office Occupations by Sex
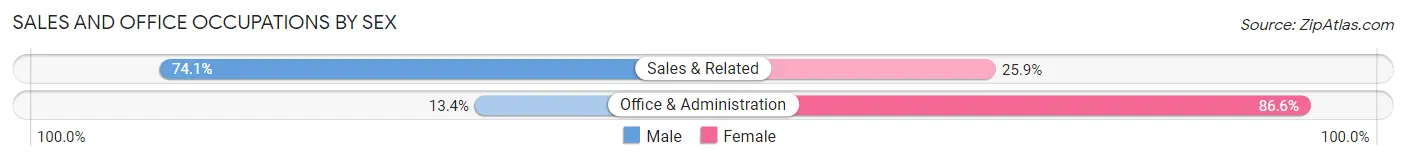
| Occupation | Male | Female |
| Sales & Related | 43 (74.1%) | 15 (25.9%) |
| Office & Administration | 11 (13.4%) | 71 (86.6%) |
| Total (Category) | 54 (38.6%) | 86 (61.4%) |
| Total (Overall) | 559 (57.8%) | 408 (42.2%) |
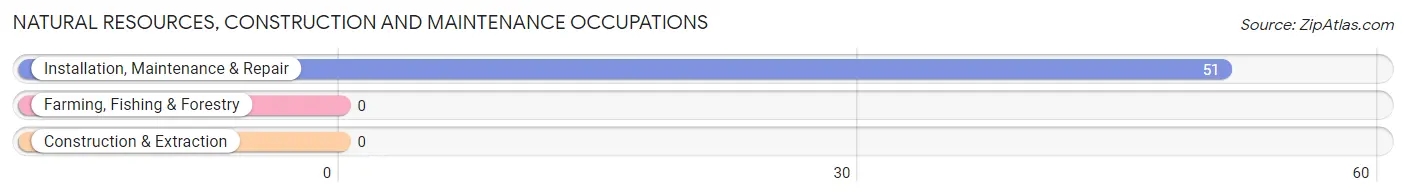
Natural Resources, Construction and Maintenance Occupations
The most common Natural Resources, Construction and Maintenance occupations in Gallipolis are , and Installation, Maintenance & Repair (51 | 5.3%).
Natural Resources, Construction and Maintenance Occupations by Sex
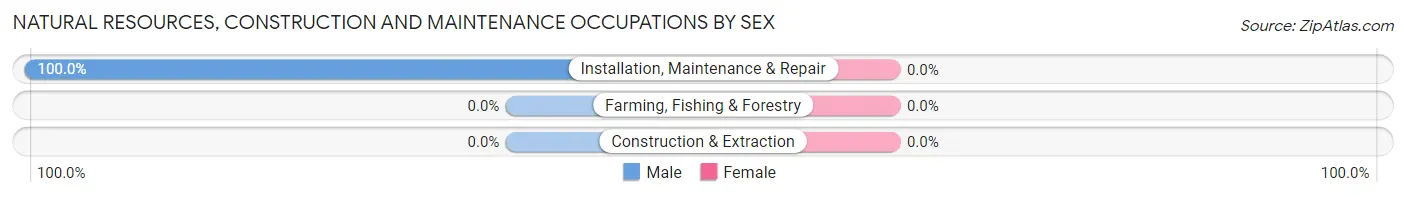
| Occupation | Male | Female |
| Farming, Fishing & Forestry | 0 (0.0%) | 0 (0.0%) |
| Construction & Extraction | 0 (0.0%) | 0 (0.0%) |
| Installation, Maintenance & Repair | 51 (100.0%) | 0 (0.0%) |
| Total (Category) | 51 (100.0%) | 0 (0.0%) |
| Total (Overall) | 559 (57.8%) | 408 (42.2%) |
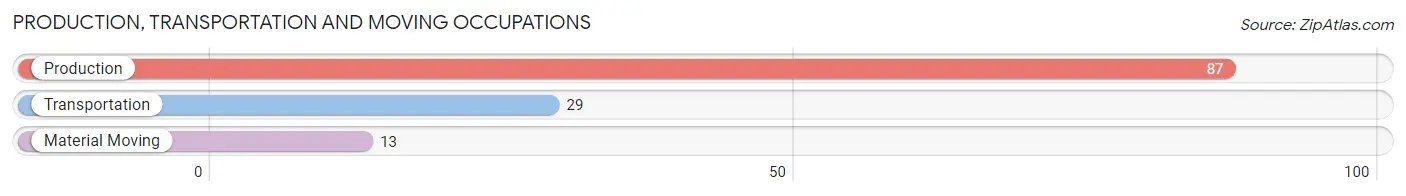
Production, Transportation and Moving Occupations
The most common Production, Transportation and Moving occupations in Gallipolis are Production (87 | 9.0%), Transportation (29 | 3.0%), and Material Moving (13 | 1.3%).
Production, Transportation and Moving Occupations by Sex
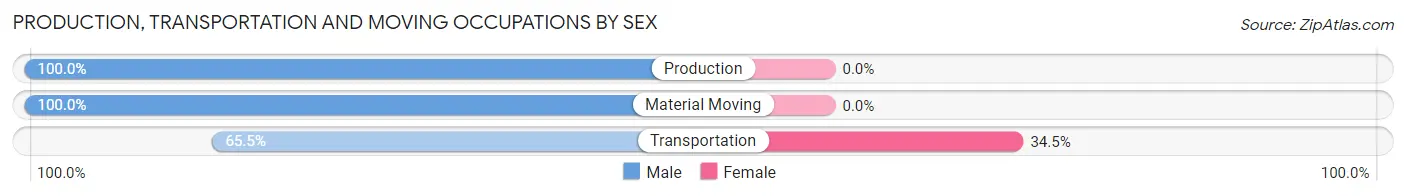
| Occupation | Male | Female |
| Production | 87 (100.0%) | 0 (0.0%) |
| Transportation | 19 (65.5%) | 10 (34.5%) |
| Material Moving | 13 (100.0%) | 0 (0.0%) |
| Total (Category) | 119 (92.2%) | 10 (7.7%) |
| Total (Overall) | 559 (57.8%) | 408 (42.2%) |
Employment Industries by Sex in Gallipolis
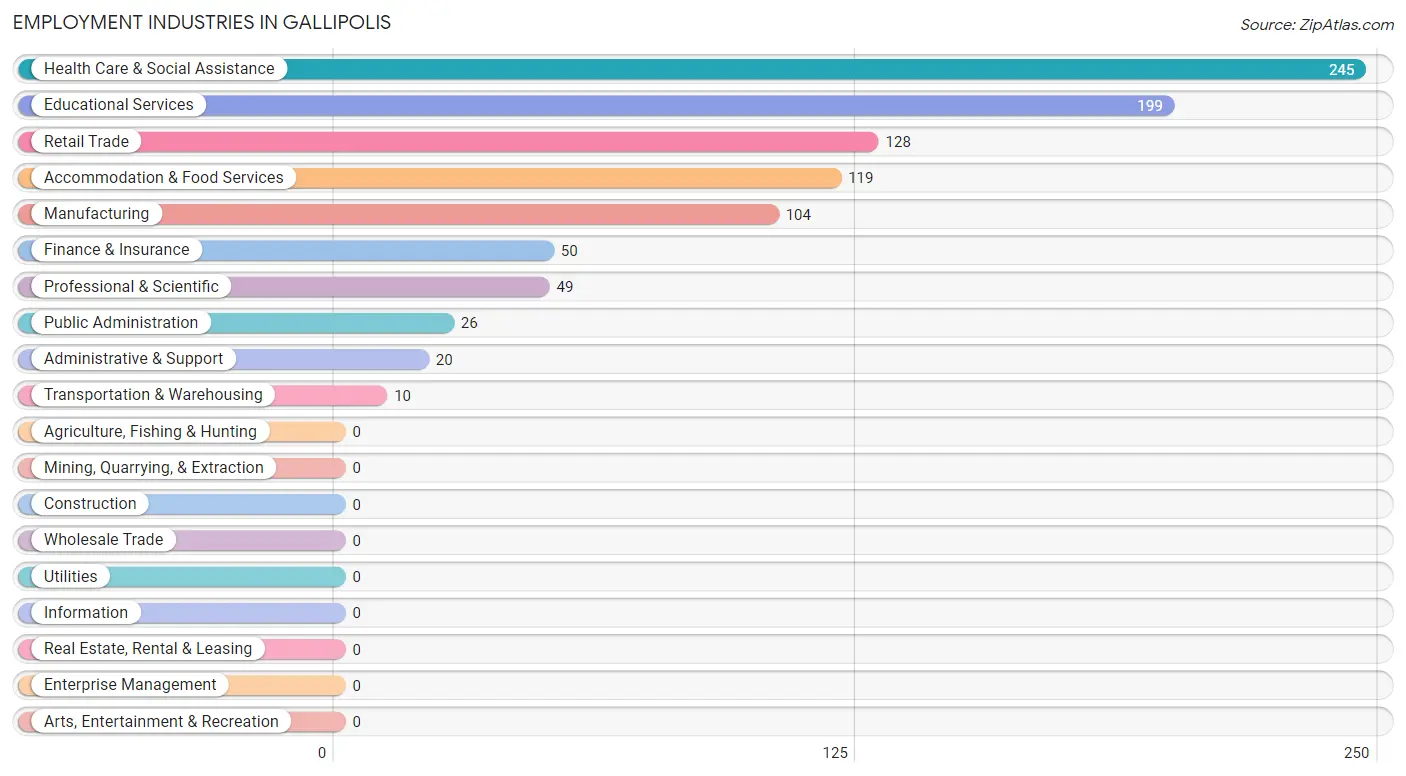
Employment Industries in Gallipolis
The major employment industries in Gallipolis include Health Care & Social Assistance (245 | 25.3%), Educational Services (199 | 20.6%), Retail Trade (128 | 13.2%), Accommodation & Food Services (119 | 12.3%), and Manufacturing (104 | 10.7%).
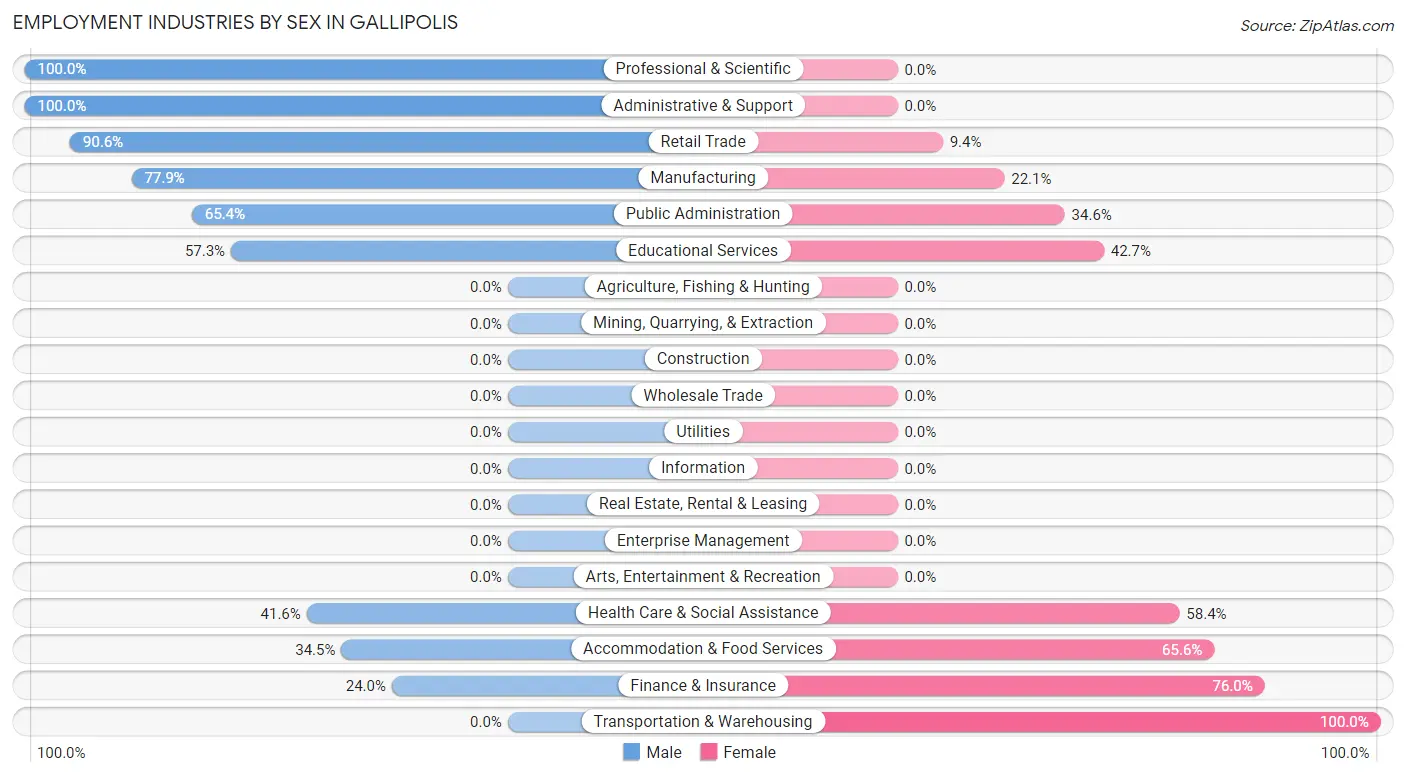
Employment Industries by Sex in Gallipolis
The Gallipolis industries that see more men than women are Professional & Scientific (100.0%), Administrative & Support (100.0%), and Retail Trade (90.6%), whereas the industries that tend to have a higher number of women are Transportation & Warehousing (100.0%), Finance & Insurance (76.0%), and Accommodation & Food Services (65.5%).
| Industry | Male | Female |
| Agriculture, Fishing & Hunting | 0 (0.0%) | 0 (0.0%) |
| Mining, Quarrying, & Extraction | 0 (0.0%) | 0 (0.0%) |
| Construction | 0 (0.0%) | 0 (0.0%) |
| Manufacturing | 81 (77.9%) | 23 (22.1%) |
| Wholesale Trade | 0 (0.0%) | 0 (0.0%) |
| Retail Trade | 116 (90.6%) | 12 (9.4%) |
| Transportation & Warehousing | 0 (0.0%) | 10 (100.0%) |
| Utilities | 0 (0.0%) | 0 (0.0%) |
| Information | 0 (0.0%) | 0 (0.0%) |
| Finance & Insurance | 12 (24.0%) | 38 (76.0%) |
| Real Estate, Rental & Leasing | 0 (0.0%) | 0 (0.0%) |
| Professional & Scientific | 49 (100.0%) | 0 (0.0%) |
| Enterprise Management | 0 (0.0%) | 0 (0.0%) |
| Administrative & Support | 20 (100.0%) | 0 (0.0%) |
| Educational Services | 114 (57.3%) | 85 (42.7%) |
| Health Care & Social Assistance | 102 (41.6%) | 143 (58.4%) |
| Arts, Entertainment & Recreation | 0 (0.0%) | 0 (0.0%) |
| Accommodation & Food Services | 41 (34.4%) | 78 (65.5%) |
| Public Administration | 17 (65.4%) | 9 (34.6%) |
| Total | 559 (57.8%) | 408 (42.2%) |
Education in Gallipolis
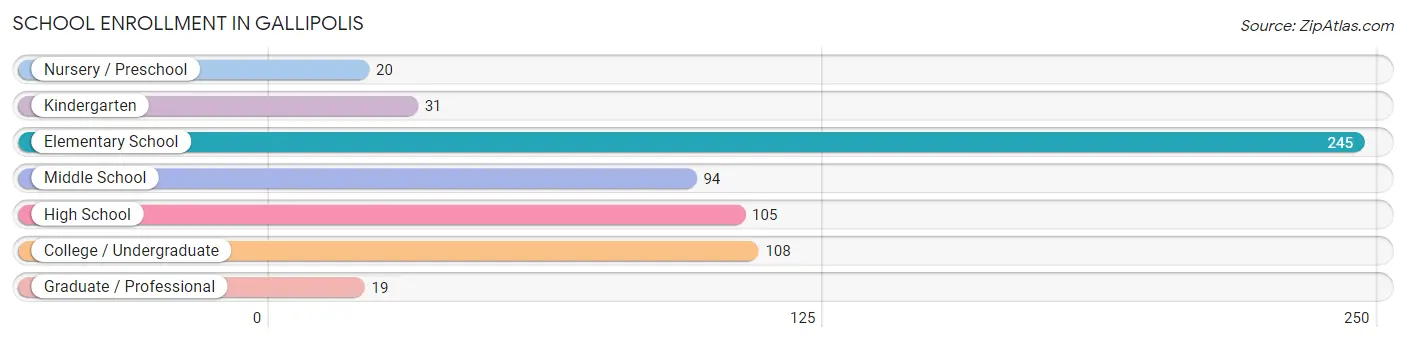
School Enrollment in Gallipolis
The most common levels of schooling among the 622 students in Gallipolis are elementary school (245 | 39.4%), college / undergraduate (108 | 17.4%), and high school (105 | 16.9%).
| School Level | # Students | % Students |
| Nursery / Preschool | 20 | 3.2% |
| Kindergarten | 31 | 5.0% |
| Elementary School | 245 | 39.4% |
| Middle School | 94 | 15.1% |
| High School | 105 | 16.9% |
| College / Undergraduate | 108 | 17.4% |
| Graduate / Professional | 19 | 3.0% |
| Total | 622 | 100.0% |
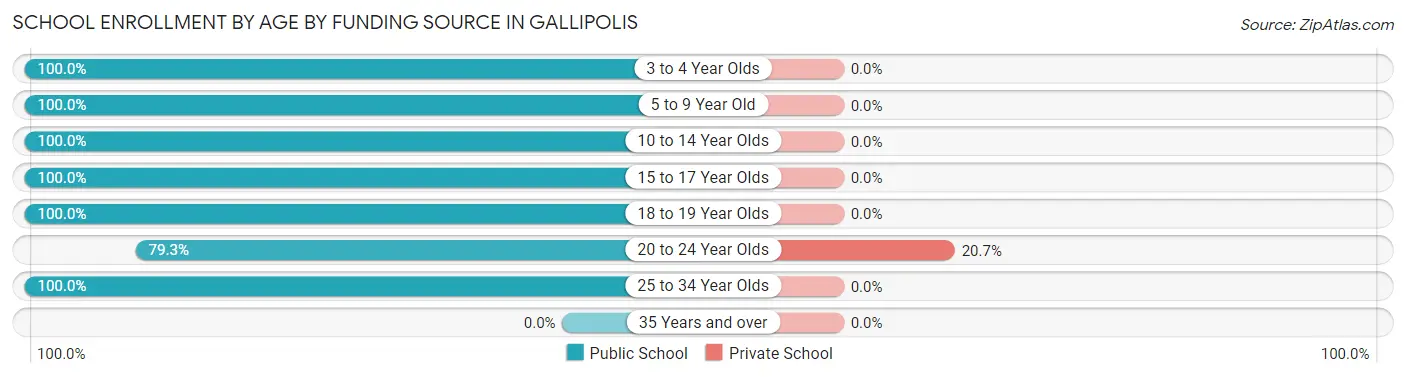
School Enrollment by Age by Funding Source in Gallipolis
Out of a total of 622 students who are enrolled in schools in Gallipolis, 18 (2.9%) attend a private institution, while the remaining 604 (97.1%) are enrolled in public schools. The age group of 20 to 24 year olds has the highest likelihood of being enrolled in private schools, with 18 (20.7% in the age bracket) enrolled. Conversely, the age group of 3 to 4 year olds has the lowest likelihood of being enrolled in a private school, with 20 (100.0% in the age bracket) attending a public institution.
| Age Bracket | Public School | Private School |
| 3 to 4 Year Olds | 20 (100.0%) | 0 (0.0%) |
| 5 to 9 Year Old | 271 (100.0%) | 0 (0.0%) |
| 10 to 14 Year Olds | 90 (100.0%) | 0 (0.0%) |
| 15 to 17 Year Olds | 58 (100.0%) | 0 (0.0%) |
| 18 to 19 Year Olds | 56 (100.0%) | 0 (0.0%) |
| 20 to 24 Year Olds | 69 (79.3%) | 18 (20.7%) |
| 25 to 34 Year Olds | 40 (100.0%) | 0 (0.0%) |
| 35 Years and over | 0 (0.0%) | 0 (0.0%) |
| Total | 604 (97.1%) | 18 (2.9%) |
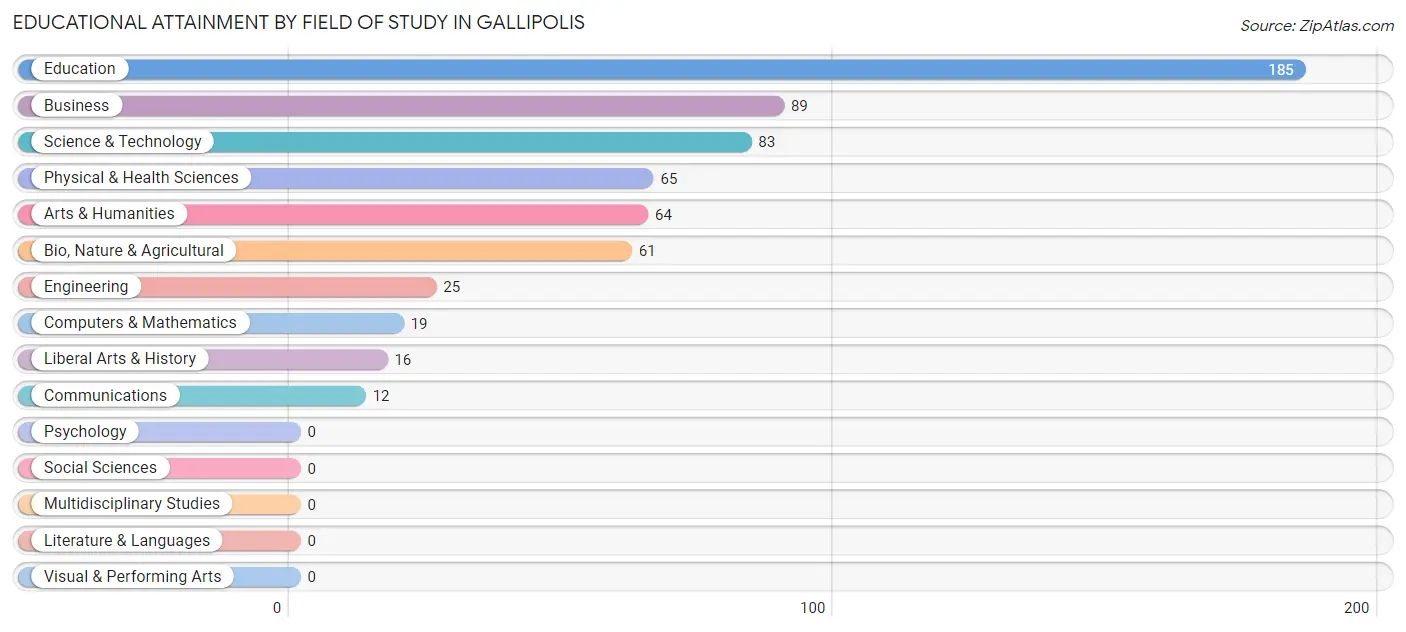
Educational Attainment by Field of Study in Gallipolis
Education (185 | 29.9%), business (89 | 14.4%), science & technology (83 | 13.4%), physical & health sciences (65 | 10.5%), and arts & humanities (64 | 10.3%) are the most common fields of study among 619 individuals in Gallipolis who have obtained a bachelor's degree or higher.
| Field of Study | # Graduates | % Graduates |
| Computers & Mathematics | 19 | 3.1% |
| Bio, Nature & Agricultural | 61 | 9.9% |
| Physical & Health Sciences | 65 | 10.5% |
| Psychology | 0 | 0.0% |
| Social Sciences | 0 | 0.0% |
| Engineering | 25 | 4.0% |
| Multidisciplinary Studies | 0 | 0.0% |
| Science & Technology | 83 | 13.4% |
| Business | 89 | 14.4% |
| Education | 185 | 29.9% |
| Literature & Languages | 0 | 0.0% |
| Liberal Arts & History | 16 | 2.6% |
| Visual & Performing Arts | 0 | 0.0% |
| Communications | 12 | 1.9% |
| Arts & Humanities | 64 | 10.3% |
| Total | 619 | 100.0% |
Transportation & Commute in Gallipolis
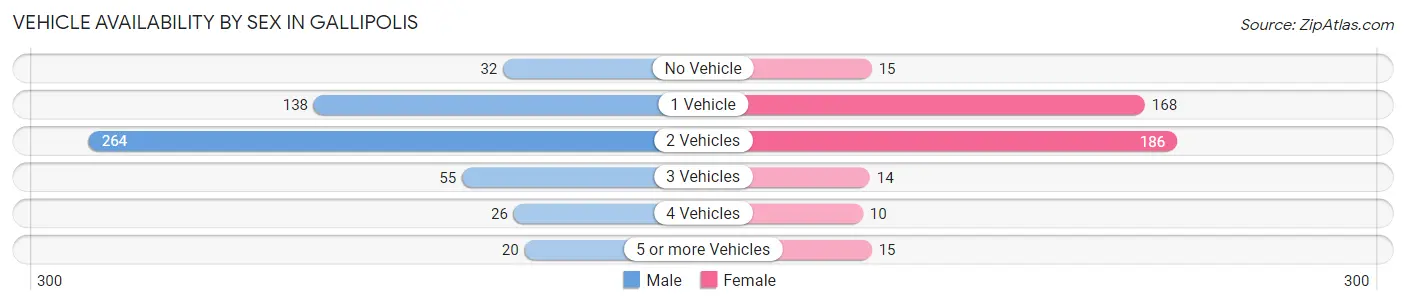
Vehicle Availability by Sex in Gallipolis
The most prevalent vehicle ownership categories in Gallipolis are males with 2 vehicles (264, accounting for 49.3%) and females with 2 vehicles (186, making up 64.7%).
| Vehicles Available | Male | Female |
| No Vehicle | 32 (6.0%) | 15 (3.7%) |
| 1 Vehicle | 138 (25.8%) | 168 (41.2%) |
| 2 Vehicles | 264 (49.3%) | 186 (45.6%) |
| 3 Vehicles | 55 (10.3%) | 14 (3.4%) |
| 4 Vehicles | 26 (4.9%) | 10 (2.5%) |
| 5 or more Vehicles | 20 (3.7%) | 15 (3.7%) |
| Total | 535 (100.0%) | 408 (100.0%) |
Commute Time in Gallipolis
The most frequently occuring commute durations in Gallipolis are 10 to 14 minutes (273 commuters, 31.6%), 15 to 19 minutes (140 commuters, 16.2%), and 60 to 89 minutes (122 commuters, 14.1%).
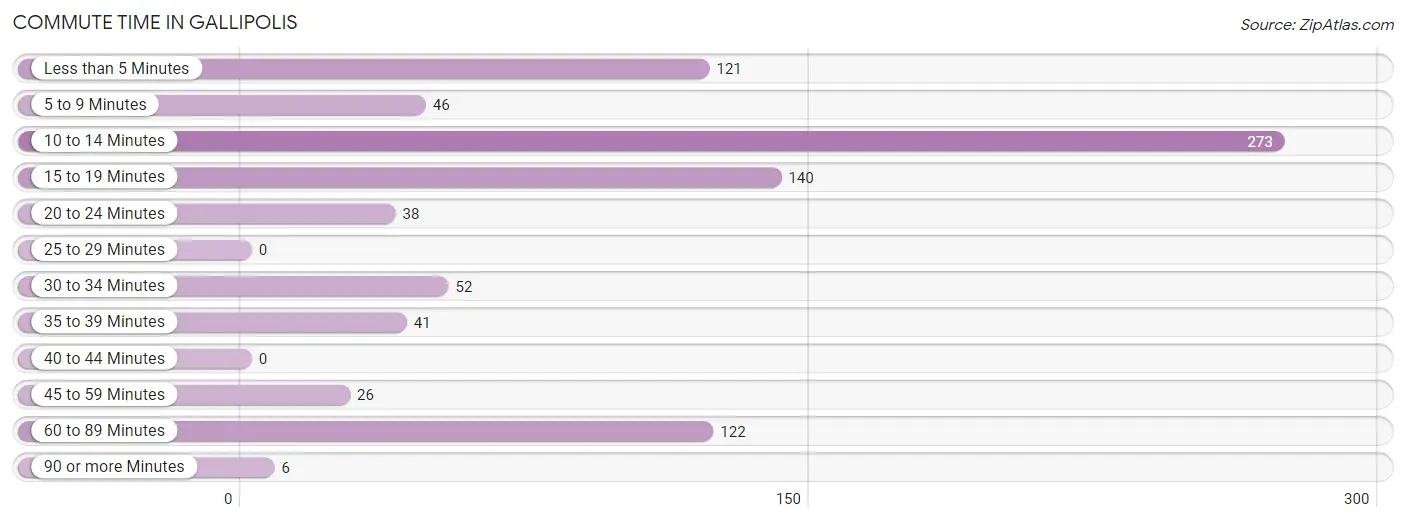
| Commute Time | # Commuters | % Commuters |
| Less than 5 Minutes | 121 | 14.0% |
| 5 to 9 Minutes | 46 | 5.3% |
| 10 to 14 Minutes | 273 | 31.6% |
| 15 to 19 Minutes | 140 | 16.2% |
| 20 to 24 Minutes | 38 | 4.4% |
| 25 to 29 Minutes | 0 | 0.0% |
| 30 to 34 Minutes | 52 | 6.0% |
| 35 to 39 Minutes | 41 | 4.7% |
| 40 to 44 Minutes | 0 | 0.0% |
| 45 to 59 Minutes | 26 | 3.0% |
| 60 to 89 Minutes | 122 | 14.1% |
| 90 or more Minutes | 6 | 0.7% |
Commute Time by Sex in Gallipolis
The most common commute times in Gallipolis are 10 to 14 minutes (191 commuters, 37.6%) for males and 15 to 19 minutes (105 commuters, 29.4%) for females.
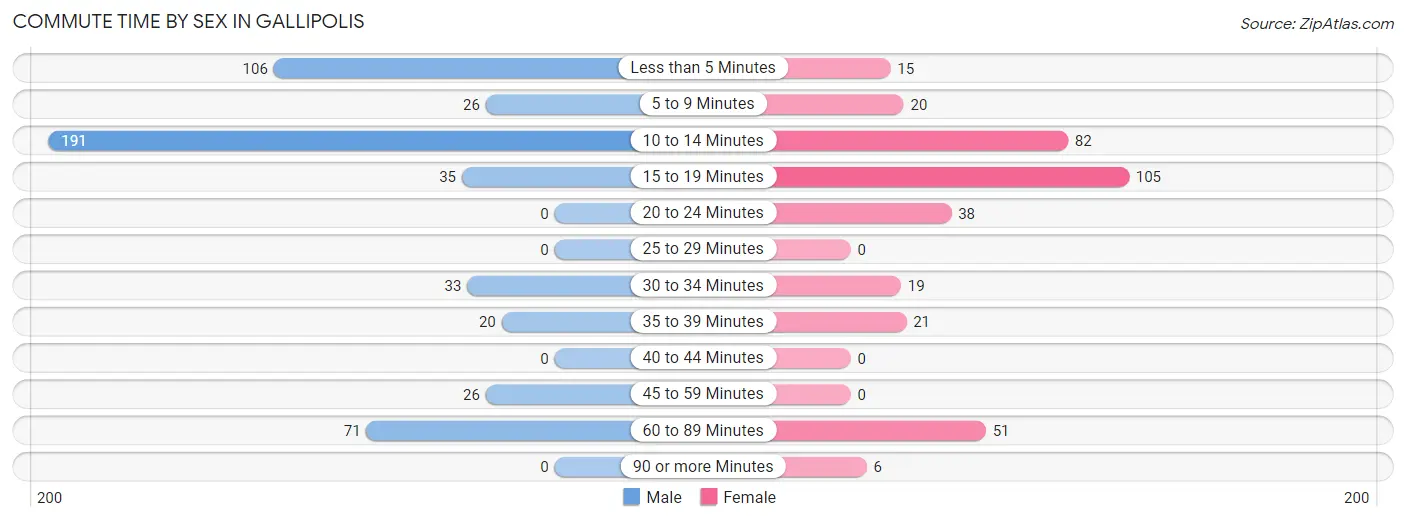
| Commute Time | Male | Female |
| Less than 5 Minutes | 106 (20.9%) | 15 (4.2%) |
| 5 to 9 Minutes | 26 (5.1%) | 20 (5.6%) |
| 10 to 14 Minutes | 191 (37.6%) | 82 (23.0%) |
| 15 to 19 Minutes | 35 (6.9%) | 105 (29.4%) |
| 20 to 24 Minutes | 0 (0.0%) | 38 (10.6%) |
| 25 to 29 Minutes | 0 (0.0%) | 0 (0.0%) |
| 30 to 34 Minutes | 33 (6.5%) | 19 (5.3%) |
| 35 to 39 Minutes | 20 (3.9%) | 21 (5.9%) |
| 40 to 44 Minutes | 0 (0.0%) | 0 (0.0%) |
| 45 to 59 Minutes | 26 (5.1%) | 0 (0.0%) |
| 60 to 89 Minutes | 71 (14.0%) | 51 (14.3%) |
| 90 or more Minutes | 0 (0.0%) | 6 (1.7%) |
Time of Departure to Work by Sex in Gallipolis
The most frequent times of departure to work in Gallipolis are 8:00 AM to 8:29 AM (129, 25.4%) for males and 9:00 AM to 9:59 AM (77, 21.6%) for females.
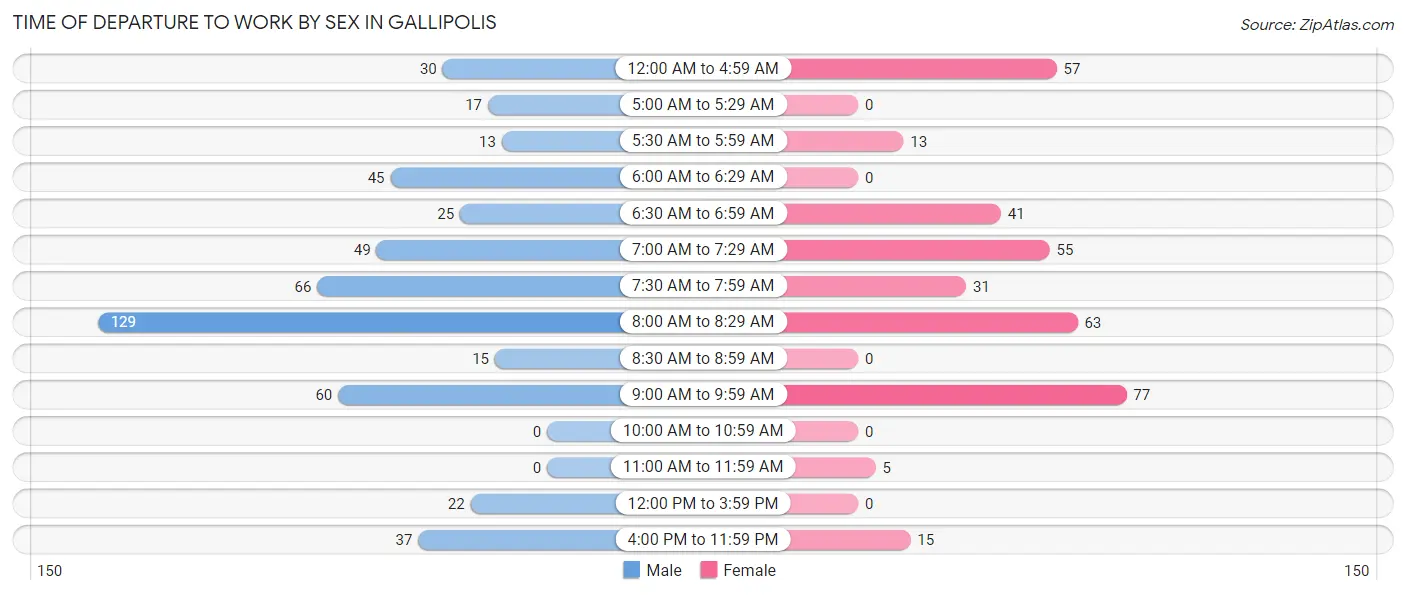
| Time of Departure | Male | Female |
| 12:00 AM to 4:59 AM | 30 (5.9%) | 57 (16.0%) |
| 5:00 AM to 5:29 AM | 17 (3.4%) | 0 (0.0%) |
| 5:30 AM to 5:59 AM | 13 (2.6%) | 13 (3.6%) |
| 6:00 AM to 6:29 AM | 45 (8.9%) | 0 (0.0%) |
| 6:30 AM to 6:59 AM | 25 (4.9%) | 41 (11.5%) |
| 7:00 AM to 7:29 AM | 49 (9.7%) | 55 (15.4%) |
| 7:30 AM to 7:59 AM | 66 (13.0%) | 31 (8.7%) |
| 8:00 AM to 8:29 AM | 129 (25.4%) | 63 (17.6%) |
| 8:30 AM to 8:59 AM | 15 (2.9%) | 0 (0.0%) |
| 9:00 AM to 9:59 AM | 60 (11.8%) | 77 (21.6%) |
| 10:00 AM to 10:59 AM | 0 (0.0%) | 0 (0.0%) |
| 11:00 AM to 11:59 AM | 0 (0.0%) | 5 (1.4%) |
| 12:00 PM to 3:59 PM | 22 (4.3%) | 0 (0.0%) |
| 4:00 PM to 11:59 PM | 37 (7.3%) | 15 (4.2%) |
| Total | 508 (100.0%) | 357 (100.0%) |
Housing Occupancy in Gallipolis
Occupancy by Ownership in Gallipolis
Of the total 1,486 dwellings in Gallipolis, owner-occupied units account for 762 (51.3%), while renter-occupied units make up 724 (48.7%).
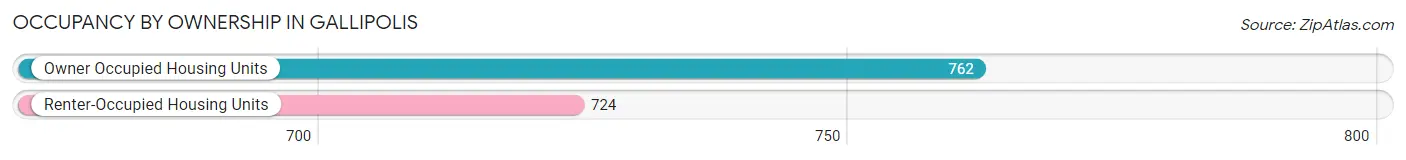
| Occupancy | # Housing Units | % Housing Units |
| Owner Occupied Housing Units | 762 | 51.3% |
| Renter-Occupied Housing Units | 724 | 48.7% |
| Total Occupied Housing Units | 1,486 | 100.0% |
Occupancy by Household Size in Gallipolis
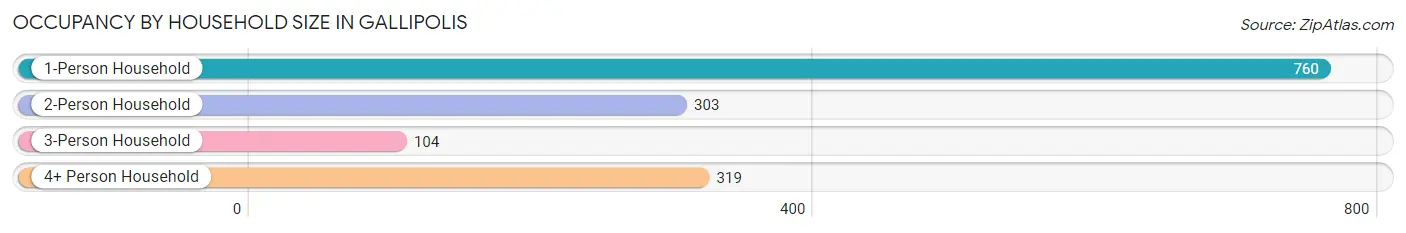
| Household Size | # Housing Units | % Housing Units |
| 1-Person Household | 760 | 51.1% |
| 2-Person Household | 303 | 20.4% |
| 3-Person Household | 104 | 7.0% |
| 4+ Person Household | 319 | 21.5% |
| Total Housing Units | 1,486 | 100.0% |
Occupancy by Ownership by Household Size in Gallipolis
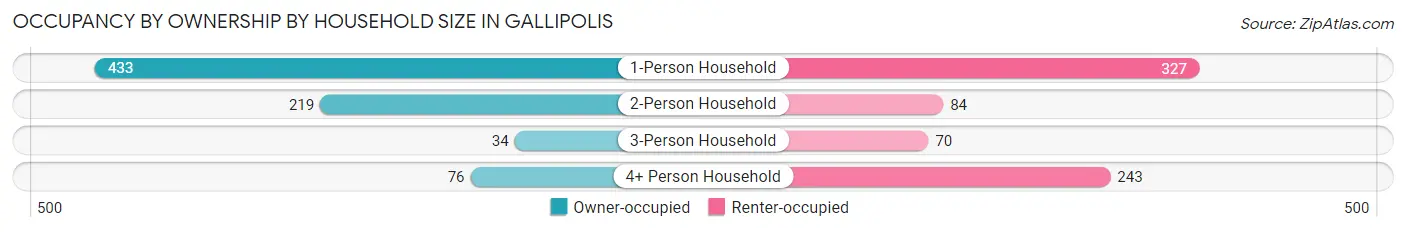
| Household Size | Owner-occupied | Renter-occupied |
| 1-Person Household | 433 (57.0%) | 327 (43.0%) |
| 2-Person Household | 219 (72.3%) | 84 (27.7%) |
| 3-Person Household | 34 (32.7%) | 70 (67.3%) |
| 4+ Person Household | 76 (23.8%) | 243 (76.2%) |
| Total Housing Units | 762 (51.3%) | 724 (48.7%) |
Occupancy by Educational Attainment in Gallipolis
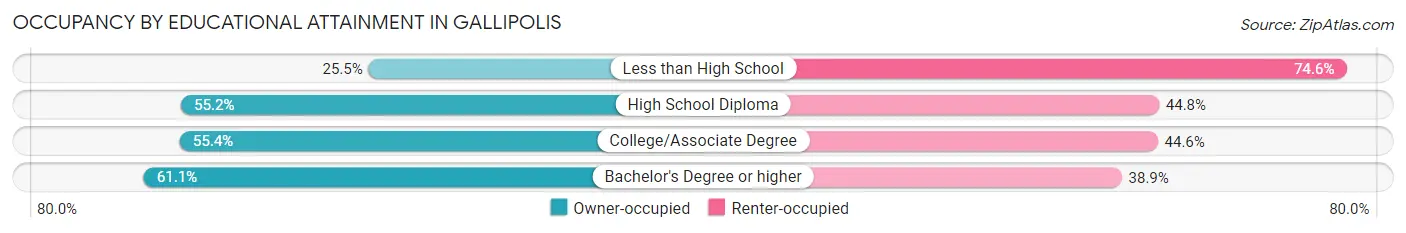
| Household Size | Owner-occupied | Renter-occupied |
| Less than High School | 70 (25.5%) | 205 (74.6%) |
| High School Diploma | 230 (55.2%) | 187 (44.8%) |
| College/Associate Degree | 222 (55.4%) | 179 (44.6%) |
| Bachelor's Degree or higher | 240 (61.1%) | 153 (38.9%) |
Occupancy by Age of Householder in Gallipolis
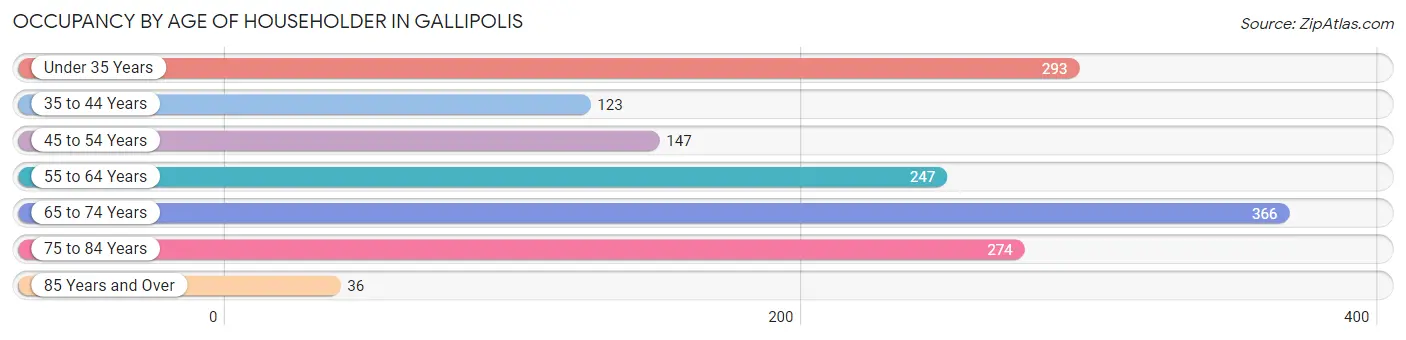
| Age Bracket | # Households | % Households |
| Under 35 Years | 293 | 19.7% |
| 35 to 44 Years | 123 | 8.3% |
| 45 to 54 Years | 147 | 9.9% |
| 55 to 64 Years | 247 | 16.6% |
| 65 to 74 Years | 366 | 24.6% |
| 75 to 84 Years | 274 | 18.4% |
| 85 Years and Over | 36 | 2.4% |
| Total | 1,486 | 100.0% |
Housing Finances in Gallipolis
Median Income by Occupancy in Gallipolis
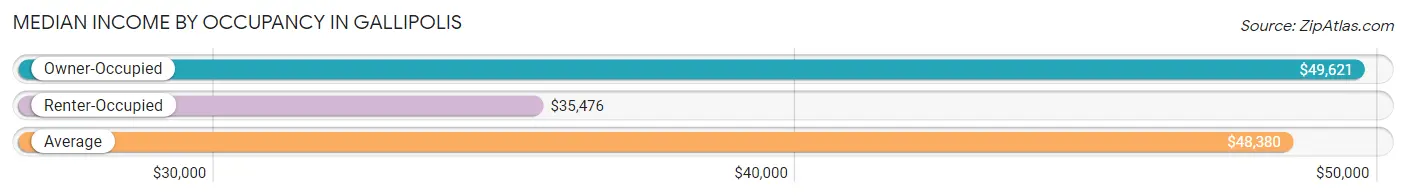
| Occupancy Type | # Households | Median Income |
| Owner-Occupied | 762 (51.3%) | $49,621 |
| Renter-Occupied | 724 (48.7%) | $35,476 |
| Average | 1,486 (100.0%) | $48,380 |
Occupancy by Householder Income Bracket in Gallipolis

| Income Bracket | Owner-occupied | Renter-occupied |
| Less than $5,000 | 12 (1.6%) | 110 (15.2%) |
| $5,000 to $9,999 | 0 (0.0%) | 17 (2.4%) |
| $10,000 to $14,999 | 57 (7.5%) | 97 (13.4%) |
| $15,000 to $19,999 | 81 (10.6%) | 11 (1.5%) |
| $20,000 to $24,999 | 27 (3.5%) | 27 (3.7%) |
| $25,000 to $34,999 | 95 (12.5%) | 96 (13.3%) |
| $35,000 to $49,999 | 124 (16.3%) | 59 (8.2%) |
| $50,000 to $74,999 | 118 (15.5%) | 175 (24.2%) |
| $75,000 to $99,999 | 41 (5.4%) | 18 (2.5%) |
| $100,000 to $149,999 | 127 (16.7%) | 105 (14.5%) |
| $150,000 or more | 80 (10.5%) | 9 (1.2%) |
| Total | 762 (100.0%) | 724 (100.0%) |
Monthly Housing Cost Tiers in Gallipolis
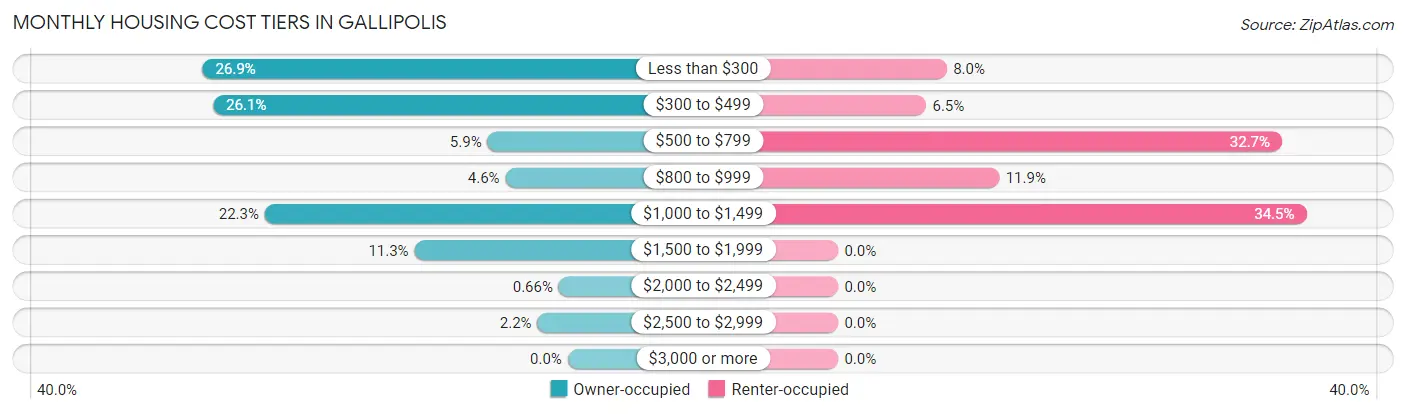
| Monthly Cost | Owner-occupied | Renter-occupied |
| Less than $300 | 205 (26.9%) | 58 (8.0%) |
| $300 to $499 | 199 (26.1%) | 47 (6.5%) |
| $500 to $799 | 45 (5.9%) | 237 (32.7%) |
| $800 to $999 | 35 (4.6%) | 86 (11.9%) |
| $1,000 to $1,499 | 170 (22.3%) | 250 (34.5%) |
| $1,500 to $1,999 | 86 (11.3%) | 0 (0.0%) |
| $2,000 to $2,499 | 5 (0.7%) | 0 (0.0%) |
| $2,500 to $2,999 | 17 (2.2%) | 0 (0.0%) |
| $3,000 or more | 0 (0.0%) | 0 (0.0%) |
| Total | 762 (100.0%) | 724 (100.0%) |
Physical Housing Characteristics in Gallipolis
Housing Structures in Gallipolis
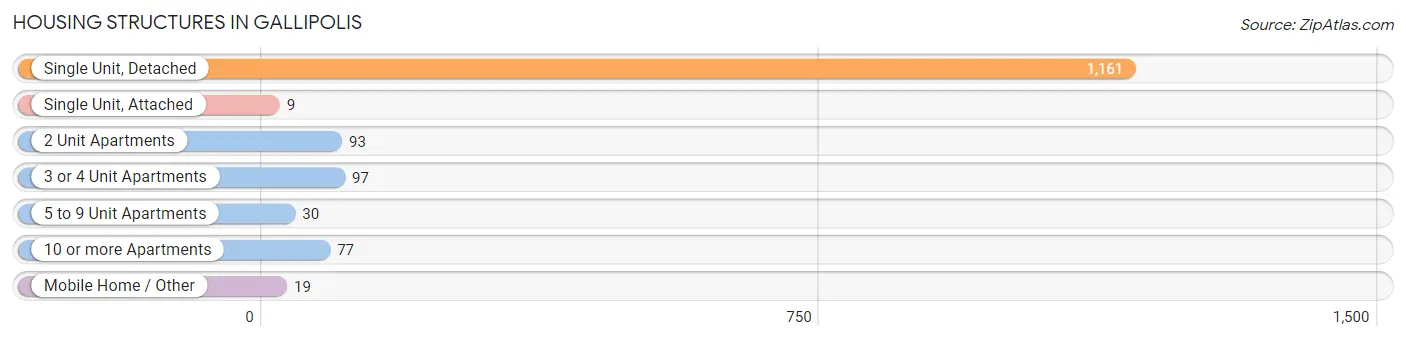
| Structure Type | # Housing Units | % Housing Units |
| Single Unit, Detached | 1,161 | 78.1% |
| Single Unit, Attached | 9 | 0.6% |
| 2 Unit Apartments | 93 | 6.3% |
| 3 or 4 Unit Apartments | 97 | 6.5% |
| 5 to 9 Unit Apartments | 30 | 2.0% |
| 10 or more Apartments | 77 | 5.2% |
| Mobile Home / Other | 19 | 1.3% |
| Total | 1,486 | 100.0% |
Housing Structures by Occupancy in Gallipolis
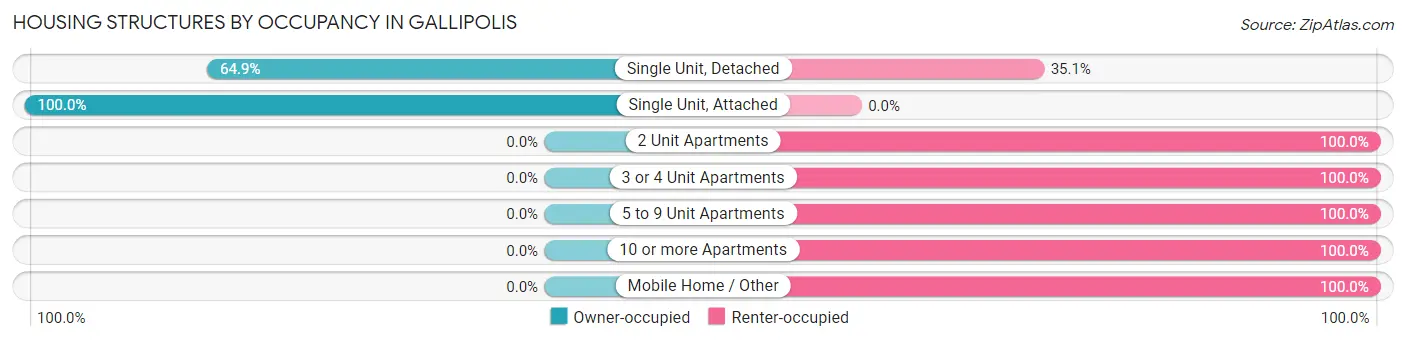
| Structure Type | Owner-occupied | Renter-occupied |
| Single Unit, Detached | 753 (64.9%) | 408 (35.1%) |
| Single Unit, Attached | 9 (100.0%) | 0 (0.0%) |
| 2 Unit Apartments | 0 (0.0%) | 93 (100.0%) |
| 3 or 4 Unit Apartments | 0 (0.0%) | 97 (100.0%) |
| 5 to 9 Unit Apartments | 0 (0.0%) | 30 (100.0%) |
| 10 or more Apartments | 0 (0.0%) | 77 (100.0%) |
| Mobile Home / Other | 0 (0.0%) | 19 (100.0%) |
| Total | 762 (51.3%) | 724 (48.7%) |
Housing Structures by Number of Rooms in Gallipolis
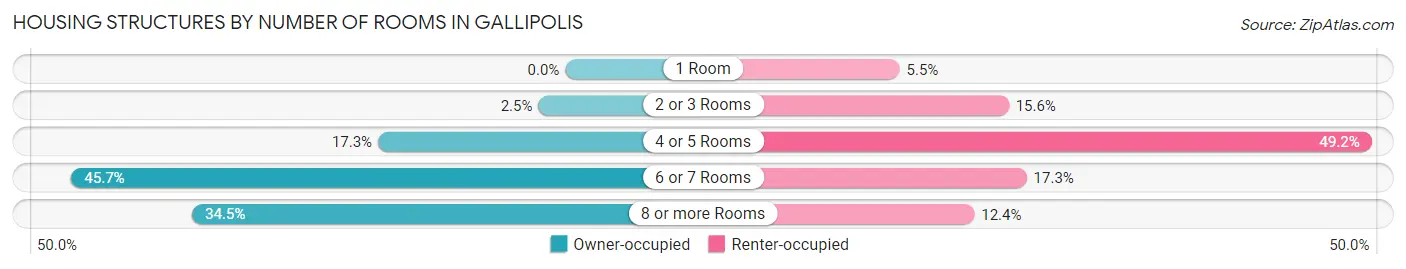
| Number of Rooms | Owner-occupied | Renter-occupied |
| 1 Room | 0 (0.0%) | 40 (5.5%) |
| 2 or 3 Rooms | 19 (2.5%) | 113 (15.6%) |
| 4 or 5 Rooms | 132 (17.3%) | 356 (49.2%) |
| 6 or 7 Rooms | 348 (45.7%) | 125 (17.3%) |
| 8 or more Rooms | 263 (34.5%) | 90 (12.4%) |
| Total | 762 (100.0%) | 724 (100.0%) |
Housing Structure by Heating Type in Gallipolis
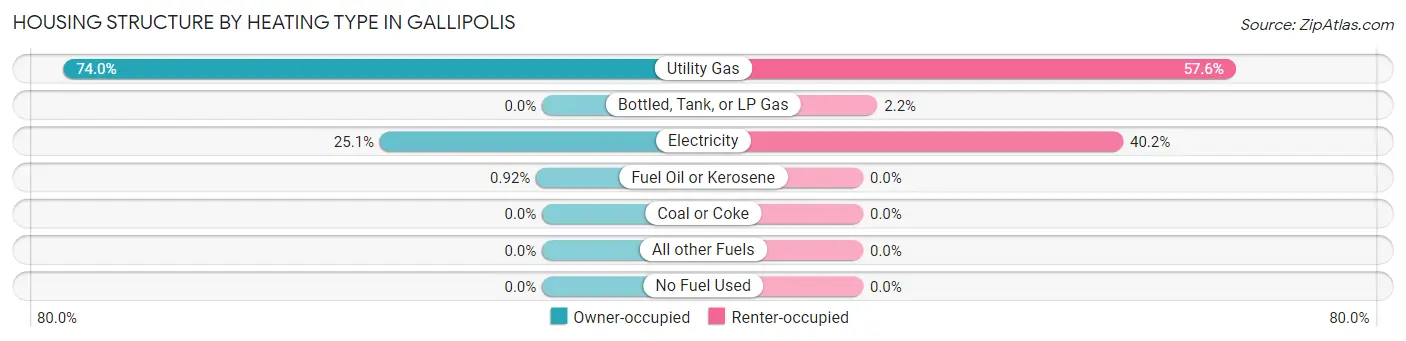
| Heating Type | Owner-occupied | Renter-occupied |
| Utility Gas | 564 (74.0%) | 417 (57.6%) |
| Bottled, Tank, or LP Gas | 0 (0.0%) | 16 (2.2%) |
| Electricity | 191 (25.1%) | 291 (40.2%) |
| Fuel Oil or Kerosene | 7 (0.9%) | 0 (0.0%) |
| Coal or Coke | 0 (0.0%) | 0 (0.0%) |
| All other Fuels | 0 (0.0%) | 0 (0.0%) |
| No Fuel Used | 0 (0.0%) | 0 (0.0%) |
| Total | 762 (100.0%) | 724 (100.0%) |
Household Vehicle Usage in Gallipolis
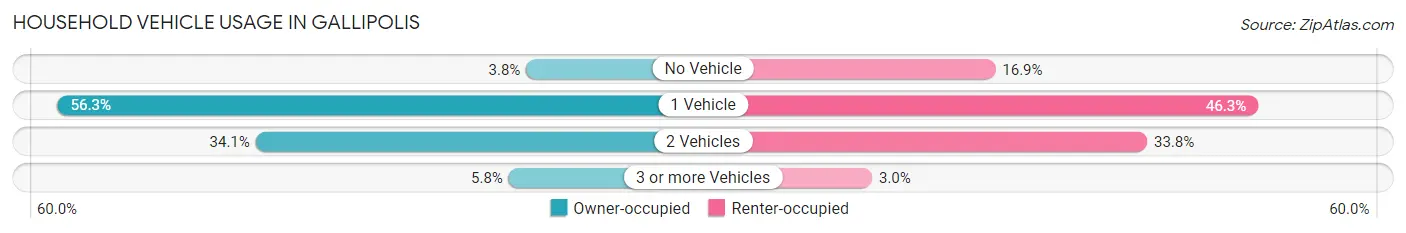
| Vehicles per Household | Owner-occupied | Renter-occupied |
| No Vehicle | 29 (3.8%) | 122 (16.9%) |
| 1 Vehicle | 429 (56.3%) | 335 (46.3%) |
| 2 Vehicles | 260 (34.1%) | 245 (33.8%) |
| 3 or more Vehicles | 44 (5.8%) | 22 (3.0%) |
| Total | 762 (100.0%) | 724 (100.0%) |
Real Estate & Mortgages in Gallipolis
Real Estate and Mortgage Overview in Gallipolis
| Characteristic | Without Mortgage | With Mortgage |
| Housing Units | 465 | 297 |
| Median Property Value | $86,400 | $145,700 |
| Median Household Income | $32,470 | $46 |
| Monthly Housing Costs | $361 | $0 |
| Real Estate Taxes | $878 | $0 |
Property Value by Mortgage Status in Gallipolis
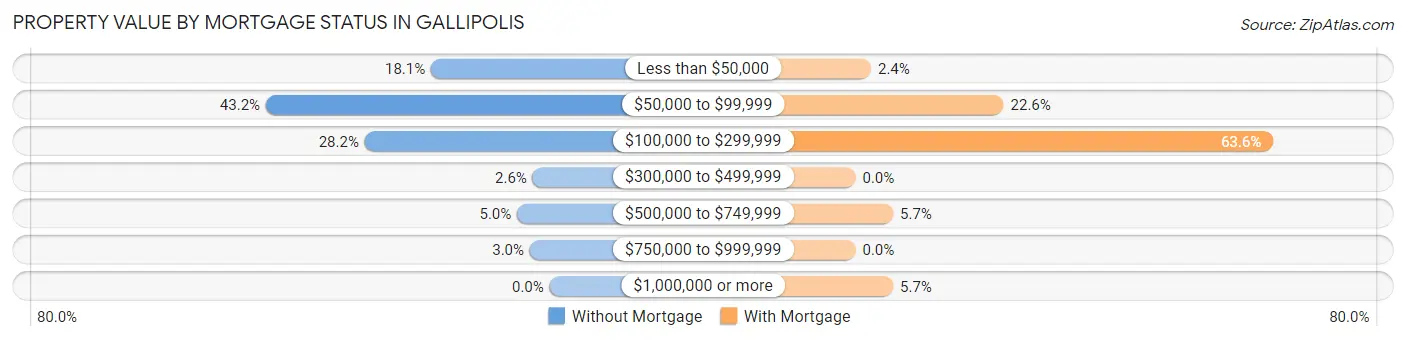
| Property Value | Without Mortgage | With Mortgage |
| Less than $50,000 | 84 (18.1%) | 7 (2.4%) |
| $50,000 to $99,999 | 201 (43.2%) | 67 (22.6%) |
| $100,000 to $299,999 | 131 (28.2%) | 189 (63.6%) |
| $300,000 to $499,999 | 12 (2.6%) | 0 (0.0%) |
| $500,000 to $749,999 | 23 (5.0%) | 17 (5.7%) |
| $750,000 to $999,999 | 14 (3.0%) | 0 (0.0%) |
| $1,000,000 or more | 0 (0.0%) | 17 (5.7%) |
| Total | 465 (100.0%) | 297 (100.0%) |
Household Income by Mortgage Status in Gallipolis
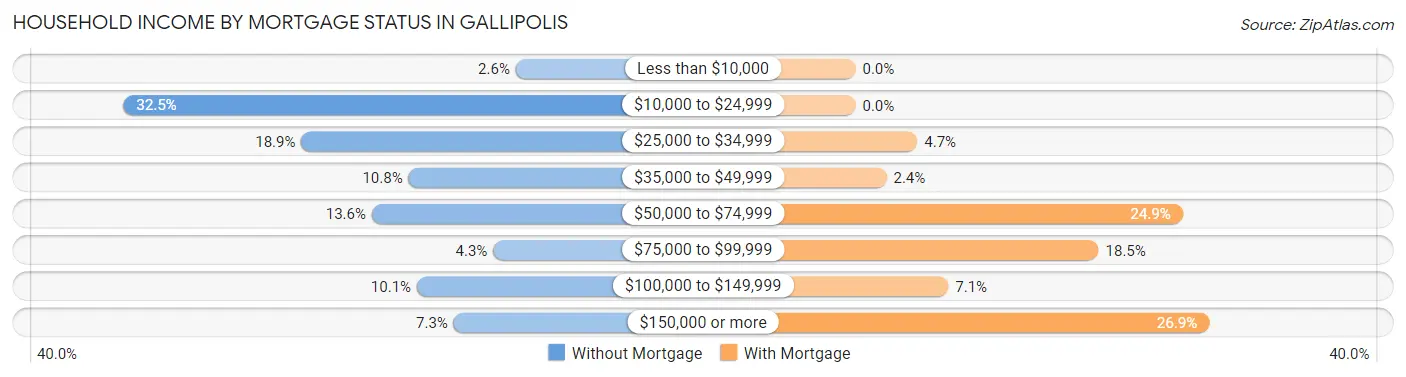
| Household Income | Without Mortgage | With Mortgage |
| Less than $10,000 | 12 (2.6%) | 0 (0.0%) |
| $10,000 to $24,999 | 151 (32.5%) | 0 (0.0%) |
| $25,000 to $34,999 | 88 (18.9%) | 14 (4.7%) |
| $35,000 to $49,999 | 50 (10.7%) | 7 (2.4%) |
| $50,000 to $74,999 | 63 (13.6%) | 74 (24.9%) |
| $75,000 to $99,999 | 20 (4.3%) | 55 (18.5%) |
| $100,000 to $149,999 | 47 (10.1%) | 21 (7.1%) |
| $150,000 or more | 34 (7.3%) | 80 (26.9%) |
| Total | 465 (100.0%) | 297 (100.0%) |
Property Value to Household Income Ratio in Gallipolis
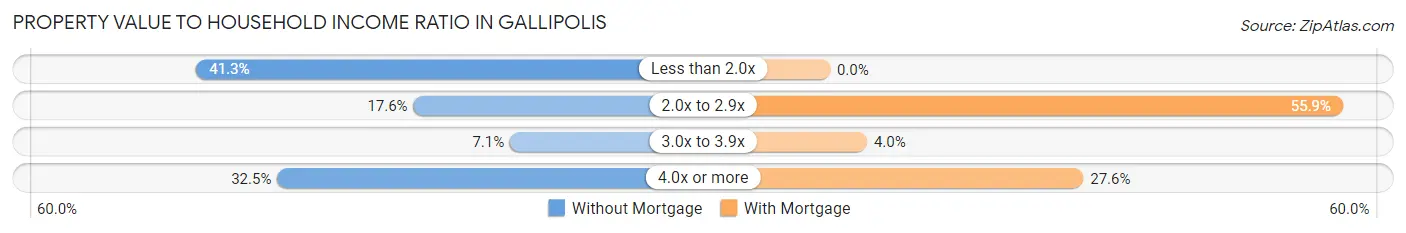
| Value-to-Income Ratio | Without Mortgage | With Mortgage |
| Less than 2.0x | 192 (41.3%) | 0 (0.0%) |
| 2.0x to 2.9x | 82 (17.6%) | 166 (55.9%) |
| 3.0x to 3.9x | 33 (7.1%) | 12 (4.0%) |
| 4.0x or more | 151 (32.5%) | 82 (27.6%) |
| Total | 465 (100.0%) | 297 (100.0%) |
Real Estate Taxes by Mortgage Status in Gallipolis
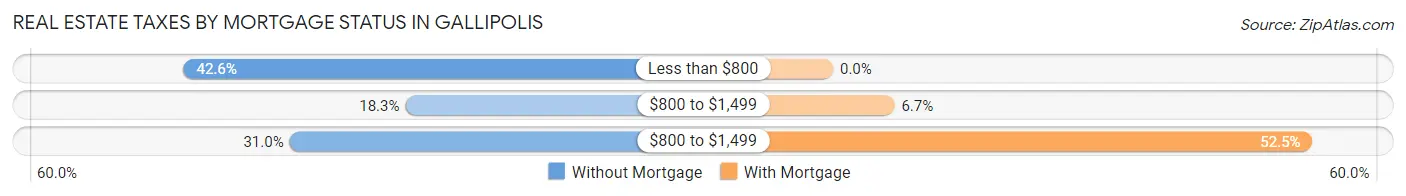
| Property Taxes | Without Mortgage | With Mortgage |
| Less than $800 | 198 (42.6%) | 0 (0.0%) |
| $800 to $1,499 | 85 (18.3%) | 20 (6.7%) |
| $800 to $1,499 | 144 (31.0%) | 156 (52.5%) |
| Total | 465 (100.0%) | 297 (100.0%) |
Health & Disability in Gallipolis
Health Insurance Coverage by Age in Gallipolis
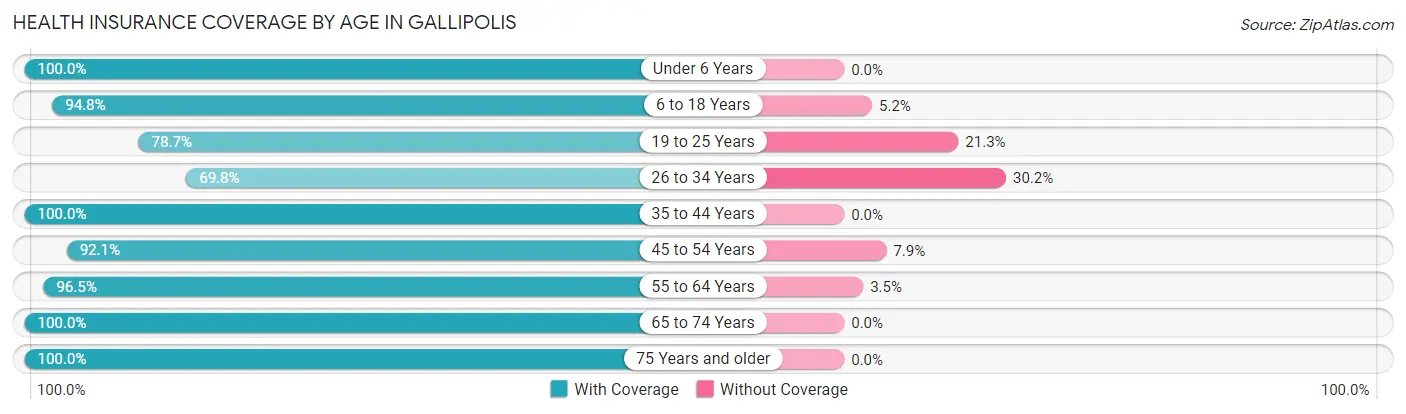
| Age Bracket | With Coverage | Without Coverage |
| Under 6 Years | 391 (100.0%) | 0 (0.0%) |
| 6 to 18 Years | 476 (94.8%) | 26 (5.2%) |
| 19 to 25 Years | 148 (78.7%) | 40 (21.3%) |
| 26 to 34 Years | 352 (69.8%) | 152 (30.2%) |
| 35 to 44 Years | 205 (100.0%) | 0 (0.0%) |
| 45 to 54 Years | 258 (92.1%) | 22 (7.9%) |
| 55 to 64 Years | 383 (96.5%) | 14 (3.5%) |
| 65 to 74 Years | 443 (100.0%) | 0 (0.0%) |
| 75 Years and older | 362 (100.0%) | 0 (0.0%) |
| Total | 3,018 (92.2%) | 254 (7.8%) |
Health Insurance Coverage by Citizenship Status in Gallipolis
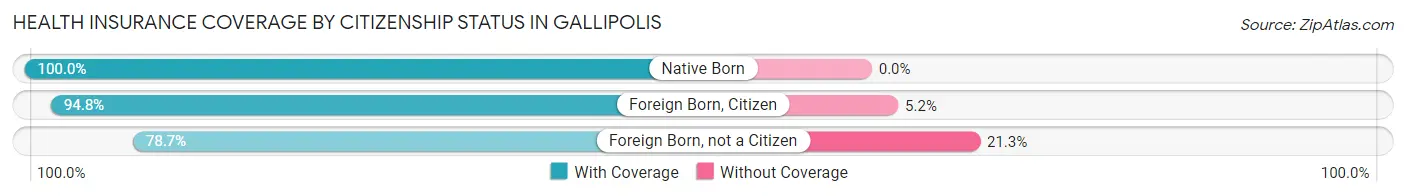
| Citizenship Status | With Coverage | Without Coverage |
| Native Born | 391 (100.0%) | 0 (0.0%) |
| Foreign Born, Citizen | 476 (94.8%) | 26 (5.2%) |
| Foreign Born, not a Citizen | 148 (78.7%) | 40 (21.3%) |
Health Insurance Coverage by Household Income in Gallipolis
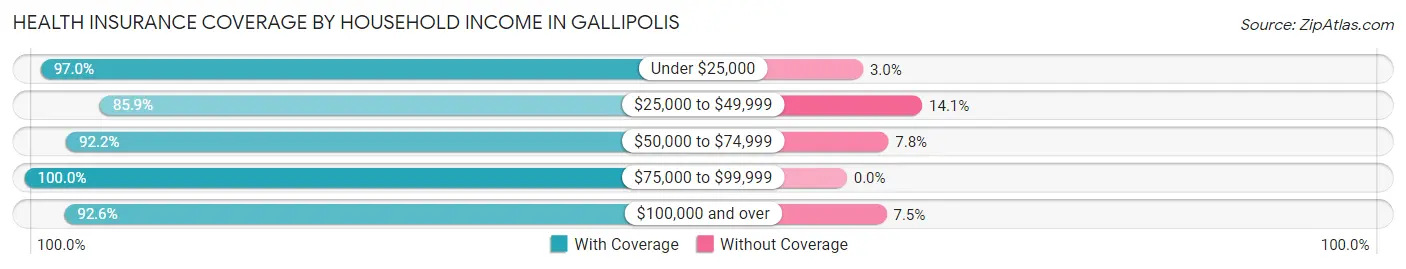
| Household Income | With Coverage | Without Coverage |
| Under $25,000 | 705 (97.0%) | 22 (3.0%) |
| $25,000 to $49,999 | 639 (85.9%) | 105 (14.1%) |
| $50,000 to $74,999 | 652 (92.2%) | 55 (7.8%) |
| $75,000 to $99,999 | 92 (100.0%) | 0 (0.0%) |
| $100,000 and over | 894 (92.5%) | 72 (7.4%) |
Public vs Private Health Insurance Coverage by Age in Gallipolis
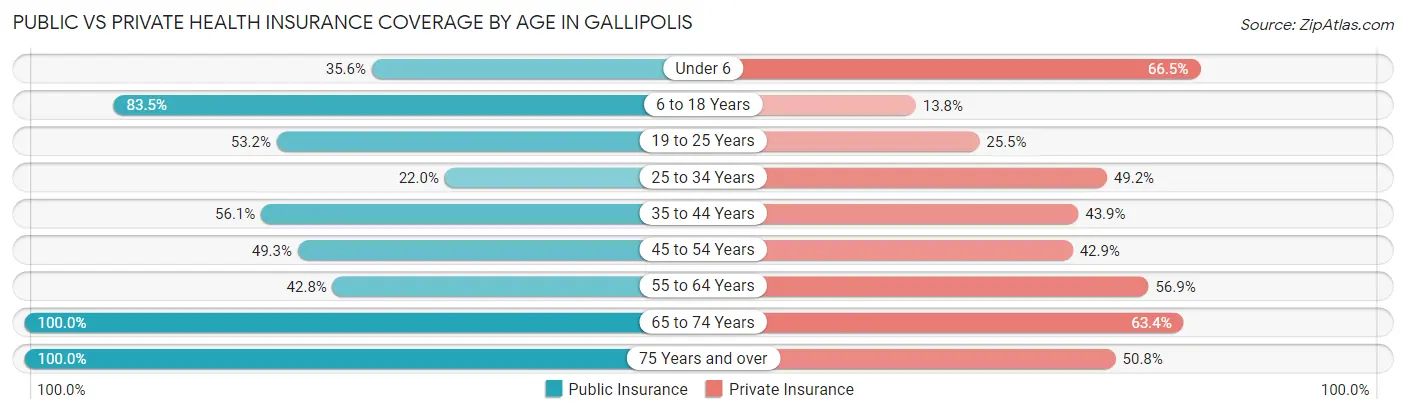
| Age Bracket | Public Insurance | Private Insurance |
| Under 6 | 139 (35.5%) | 260 (66.5%) |
| 6 to 18 Years | 419 (83.5%) | 69 (13.8%) |
| 19 to 25 Years | 100 (53.2%) | 48 (25.5%) |
| 25 to 34 Years | 111 (22.0%) | 248 (49.2%) |
| 35 to 44 Years | 115 (56.1%) | 90 (43.9%) |
| 45 to 54 Years | 138 (49.3%) | 120 (42.9%) |
| 55 to 64 Years | 170 (42.8%) | 226 (56.9%) |
| 65 to 74 Years | 443 (100.0%) | 281 (63.4%) |
| 75 Years and over | 362 (100.0%) | 184 (50.8%) |
| Total | 1,997 (61.0%) | 1,526 (46.6%) |
Disability Status by Sex by Age in Gallipolis
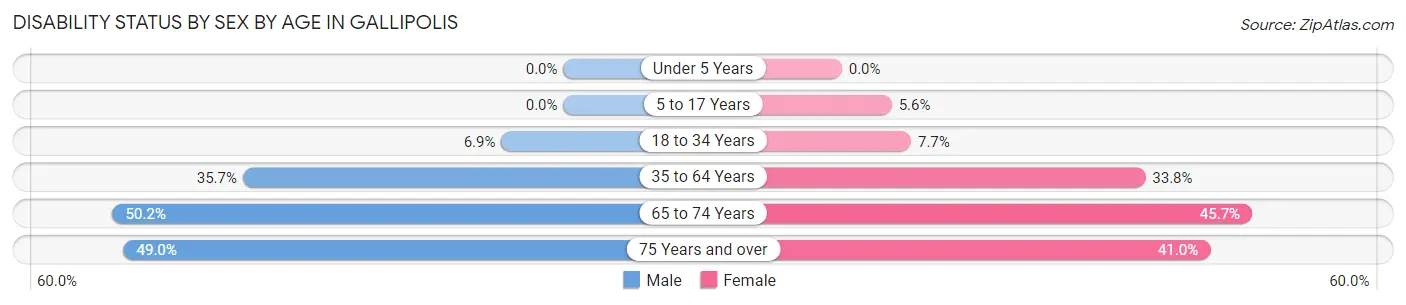
| Age Bracket | Male | Female |
| Under 5 Years | 0 (0.0%) | 0 (0.0%) |
| 5 to 17 Years | 0 (0.0%) | 15 (5.6%) |
| 18 to 34 Years | 27 (6.9%) | 29 (7.7%) |
| 35 to 64 Years | 166 (35.7%) | 141 (33.8%) |
| 65 to 74 Years | 118 (50.2%) | 95 (45.7%) |
| 75 Years and over | 71 (49.0%) | 89 (41.0%) |
Disability Class by Sex by Age in Gallipolis
Disability Class: Hearing Difficulty
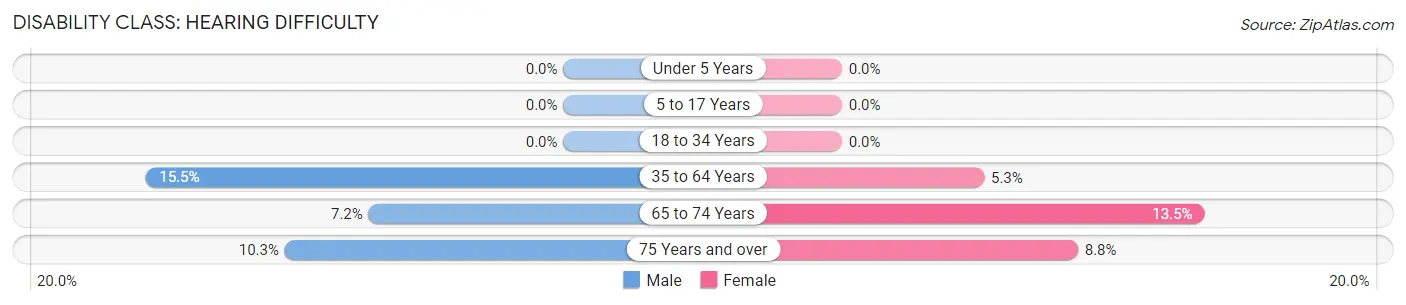
| Age Bracket | Male | Female |
| Under 5 Years | 0 (0.0%) | 0 (0.0%) |
| 5 to 17 Years | 0 (0.0%) | 0 (0.0%) |
| 18 to 34 Years | 0 (0.0%) | 0 (0.0%) |
| 35 to 64 Years | 72 (15.5%) | 22 (5.3%) |
| 65 to 74 Years | 17 (7.2%) | 28 (13.5%) |
| 75 Years and over | 15 (10.3%) | 19 (8.8%) |
Disability Class: Vision Difficulty
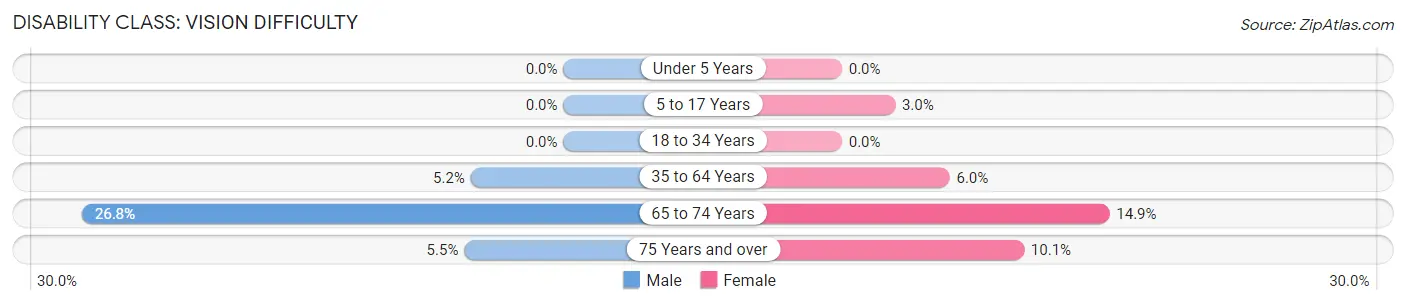
| Age Bracket | Male | Female |
| Under 5 Years | 0 (0.0%) | 0 (0.0%) |
| 5 to 17 Years | 0 (0.0%) | 8 (3.0%) |
| 18 to 34 Years | 0 (0.0%) | 0 (0.0%) |
| 35 to 64 Years | 24 (5.2%) | 25 (6.0%) |
| 65 to 74 Years | 63 (26.8%) | 31 (14.9%) |
| 75 Years and over | 8 (5.5%) | 22 (10.1%) |
Disability Class: Cognitive Difficulty
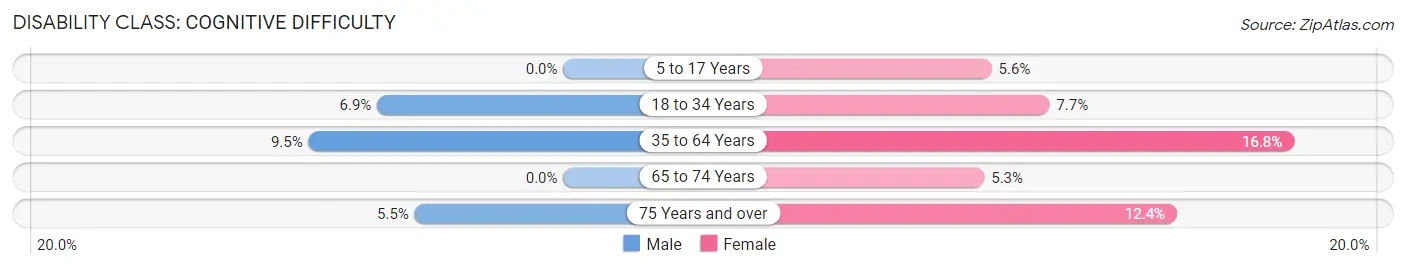
| Age Bracket | Male | Female |
| 5 to 17 Years | 0 (0.0%) | 15 (5.6%) |
| 18 to 34 Years | 27 (6.9%) | 29 (7.7%) |
| 35 to 64 Years | 44 (9.5%) | 70 (16.8%) |
| 65 to 74 Years | 0 (0.0%) | 11 (5.3%) |
| 75 Years and over | 8 (5.5%) | 27 (12.4%) |
Disability Class: Ambulatory Difficulty
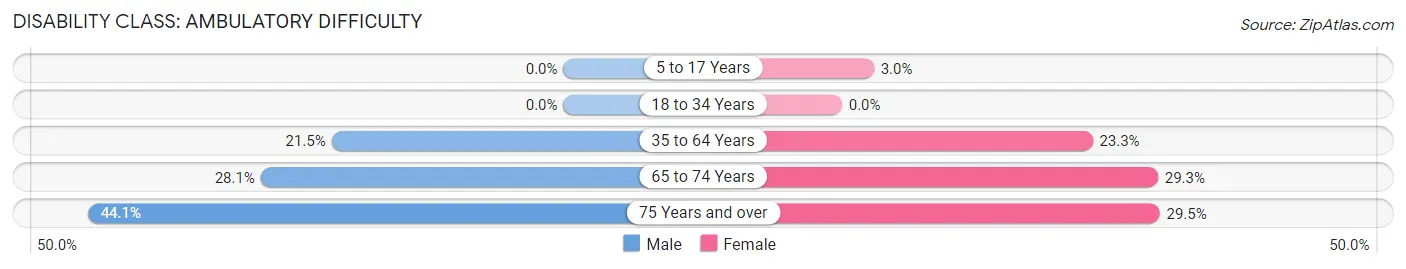
| Age Bracket | Male | Female |
| 5 to 17 Years | 0 (0.0%) | 8 (3.0%) |
| 18 to 34 Years | 0 (0.0%) | 0 (0.0%) |
| 35 to 64 Years | 100 (21.5%) | 97 (23.3%) |
| 65 to 74 Years | 66 (28.1%) | 61 (29.3%) |
| 75 Years and over | 64 (44.1%) | 64 (29.5%) |
Disability Class: Self-Care Difficulty
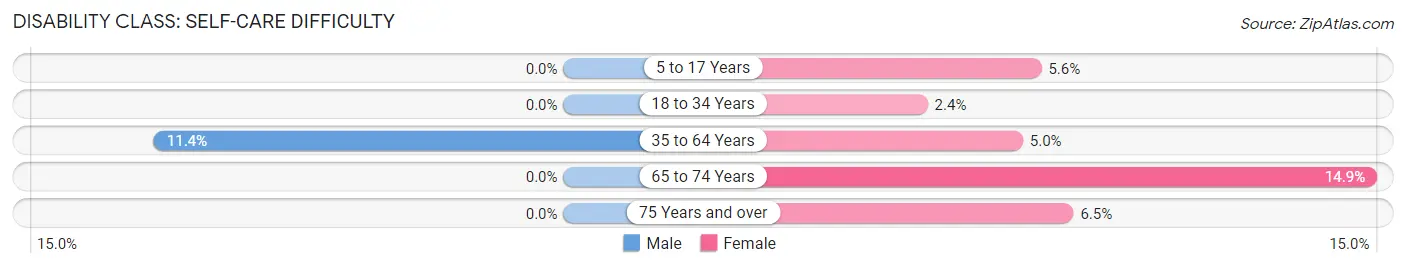
| Age Bracket | Male | Female |
| 5 to 17 Years | 0 (0.0%) | 15 (5.6%) |
| 18 to 34 Years | 0 (0.0%) | 9 (2.4%) |
| 35 to 64 Years | 53 (11.4%) | 21 (5.0%) |
| 65 to 74 Years | 0 (0.0%) | 31 (14.9%) |
| 75 Years and over | 0 (0.0%) | 14 (6.5%) |
Technology Access in Gallipolis
Computing Device Access in Gallipolis
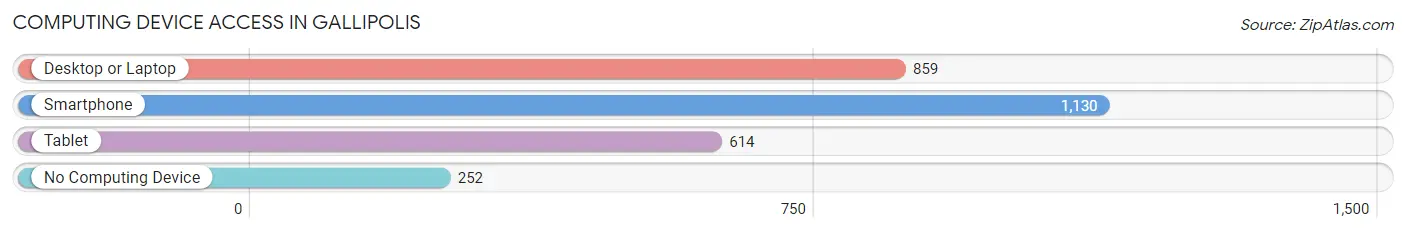
| Device Type | # Households | % Households |
| Desktop or Laptop | 859 | 57.8% |
| Smartphone | 1,130 | 76.0% |
| Tablet | 614 | 41.3% |
| No Computing Device | 252 | 17.0% |
| Total | 1,486 | 100.0% |
Internet Access in Gallipolis
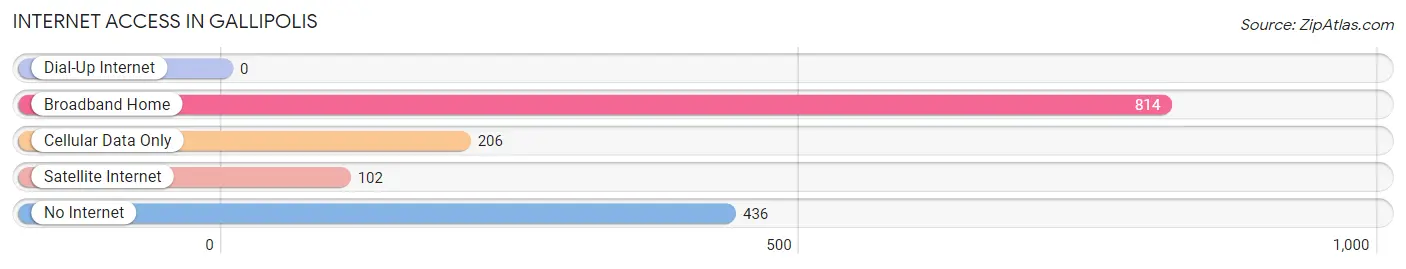
| Internet Type | # Households | % Households |
| Dial-Up Internet | 0 | 0.0% |
| Broadband Home | 814 | 54.8% |
| Cellular Data Only | 206 | 13.9% |
| Satellite Internet | 102 | 6.9% |
| No Internet | 436 | 29.3% |
| Total | 1,486 | 100.0% |
Gallipolis Summary
Gallipolis, Ohio is a small city located in the southeastern part of the state, along the Ohio River. It is the county seat of Gallia County and is part of the Point Pleasant, WV-OH Metropolitan Statistical Area. The city has a population of 3,641 as of the 2010 census, and is the second-largest city in the county.
History
Gallipolis was founded in 1790 by a group of French settlers, who were led by Count Jean-Francois de LaSalle. The settlers were part of a larger group of French immigrants who had been invited to the area by the Ohio Company of Associates, a land company that had been formed to purchase and settle the area. The settlers named the city after the Greek word for “city of the Gauls”, and the city was incorporated in 1803.
The city was an important port on the Ohio River, and was a major center of commerce and industry in the 19th century. The city was home to several factories, including a glassworks, a paper mill, and a woolen mill. The city was also home to a number of shipyards, and was a major center for the production of steamboats.
Geography
Gallipolis is located at the confluence of the Ohio and Kanawha Rivers, in the southeastern part of the state. The city is situated on a bluff overlooking the rivers, and is surrounded by rolling hills and forests. The city is located approximately 60 miles south of Columbus, and is about a two-hour drive from Cincinnati.
The city has a total area of 4.2 square miles, of which 4.1 square miles is land and 0.1 square miles is water. The city is located in a humid continental climate zone, with hot, humid summers and cold, snowy winters.
Economy
Gallipolis has a diverse economy, with a mix of manufacturing, retail, and service industries. The city is home to several manufacturing companies, including a glassworks, a paper mill, and a woolen mill. The city is also home to a number of retail stores, restaurants, and other businesses.
The city is also home to a number of government and educational institutions, including the Gallia County Courthouse, the Gallia County Public Library, and the Ohio University-Gallipolis campus. The city is also home to a number of healthcare facilities, including the Holzer Medical Center and the Gallia County Health Department.
Demographics
As of the 2010 census, the city had a population of 3,641. The racial makeup of the city was 95.2% White, 1.7% African American, 0.3% Native American, 0.3% Asian, 0.1% Pacific Islander, 0.7% from other races, and 1.9% from two or more races. Hispanic or Latino of any race were 1.7% of the population.
The median income for a household in the city was $30,938, and the median income for a family was $37,917. The per capita income for the city was $17,845. About 17.2% of families and 20.2% of the population were below the poverty line, including 28.3% of those under age 18 and 11.2% of those age 65 or over.
Common Questions
What is Per Capita Income in Gallipolis?
Per Capita income in Gallipolis is $28,352.
What is the Median Family Income in Gallipolis?
Median Family Income in Gallipolis is $59,028.
What is the Median Household income in Gallipolis?
Median Household Income in Gallipolis is $48,380.
What is Income or Wage Gap in Gallipolis?
Income or Wage Gap in Gallipolis is 38.6%.
Women in Gallipolis earn 61.4 cents for every dollar earned by a man.
What is Inequality or Gini Index in Gallipolis?
Inequality or Gini Index in Gallipolis is 0.49.
What is the Total Population of Gallipolis?
Total Population of Gallipolis is 3,337.
What is the Total Male Population of Gallipolis?
Total Male Population of Gallipolis is 1,664.
What is the Total Female Population of Gallipolis?
Total Female Population of Gallipolis is 1,673.
What is the Ratio of Males per 100 Females in Gallipolis?
There are 99.46 Males per 100 Females in Gallipolis.
What is the Ratio of Females per 100 Males in Gallipolis?
There are 100.54 Females per 100 Males in Gallipolis.
What is the Median Population Age in Gallipolis?
Median Population Age in Gallipolis is 37.0 Years.
What is the Average Family Size in Gallipolis
Average Family Size in Gallipolis is 3.3 People.
What is the Average Household Size in Gallipolis
Average Household Size in Gallipolis is 2.2 People.
How Large is the Labor Force in Gallipolis?
There are 1,028 People in the Labor Forcein in Gallipolis.
What is the Percentage of People in the Labor Force in Gallipolis?
40.3% of People are in the Labor Force in Gallipolis.
What is the Unemployment Rate in Gallipolis?
Unemployment Rate in Gallipolis is 6.0%.