Pleasant Run Farm, OH Map & Demographics
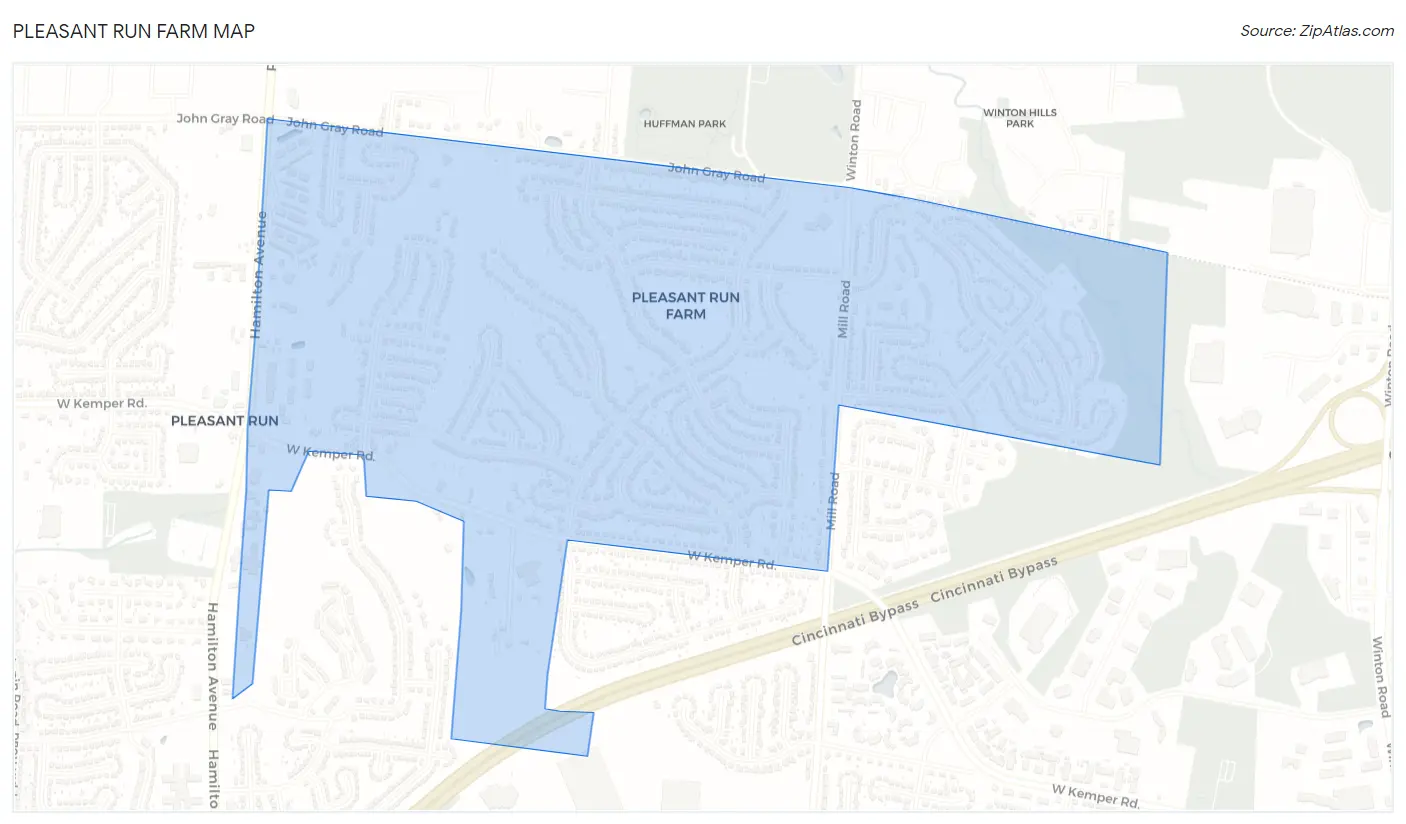
Pleasant Run Farm Map
Pleasant Run Farm Overview
$33,719
PER CAPITA INCOME
$95,577
AVG FAMILY INCOME
$82,303
AVG HOUSEHOLD INCOME
8.3%
WAGE / INCOME GAP [ % ]
91.7¢/ $1
WAGE / INCOME GAP [ $ ]
0.38
INEQUALITY / GINI INDEX
4,016
TOTAL POPULATION
2,028
MALE POPULATION
1,988
FEMALE POPULATION
102.01
MALES / 100 FEMALES
98.03
FEMALES / 100 MALES
43.0
MEDIAN AGE
3.2
AVG FAMILY SIZE
2.6
AVG HOUSEHOLD SIZE
1,932
LABOR FORCE [ PEOPLE ]
60.3%
PERCENT IN LABOR FORCE
0.7%
UNEMPLOYMENT RATE
Income in Pleasant Run Farm
Income Overview in Pleasant Run Farm
Per Capita Income in Pleasant Run Farm is $33,719, while median incomes of families and households are $95,577 and $82,303 respectively.
| Characteristic | Number | Measure |
| Per Capita Income | 4,016 | $33,719 |
| Median Family Income | 1,056 | $95,577 |
| Mean Family Income | 1,056 | $98,164 |
| Median Household Income | 1,505 | $82,303 |
| Mean Household Income | 1,505 | $86,501 |
| Income Deficit | 1,056 | $0 |
| Wage / Income Gap (%) | 4,016 | 8.30% |
| Wage / Income Gap ($) | 4,016 | 91.70¢ per $1 |
| Gini / Inequality Index | 4,016 | 0.38 |
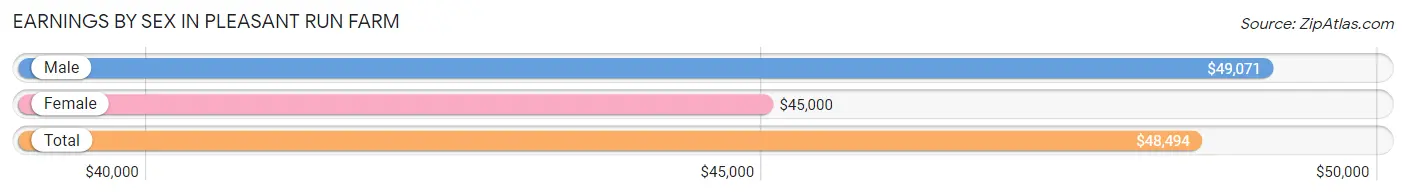
Earnings by Sex in Pleasant Run Farm
Average Earnings in Pleasant Run Farm are $48,494, $49,071 for men and $45,000 for women, a difference of 8.3%.
| Sex | Number | Average Earnings |
| Male | 996 (49.8%) | $49,071 |
| Female | 1,002 (50.1%) | $45,000 |
| Total | 1,998 (100.0%) | $48,494 |
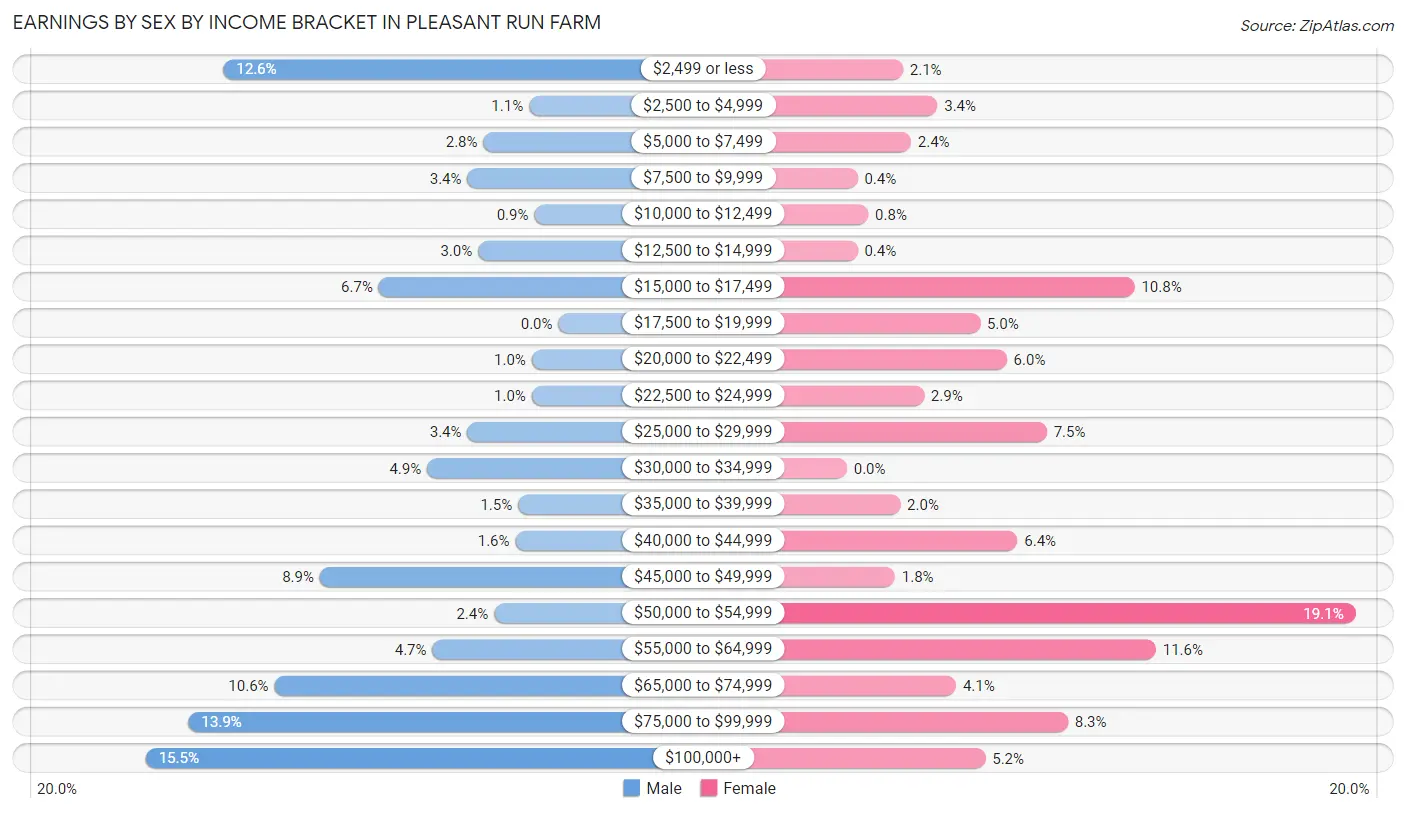
Earnings by Sex by Income Bracket in Pleasant Run Farm
The most common earnings brackets in Pleasant Run Farm are $100,000+ for men (154 | 15.5%) and $50,000 to $54,999 for women (191 | 19.1%).
| Income | Male | Female |
| $2,499 or less | 125 (12.6%) | 21 (2.1%) |
| $2,500 to $4,999 | 11 (1.1%) | 34 (3.4%) |
| $5,000 to $7,499 | 28 (2.8%) | 24 (2.4%) |
| $7,500 to $9,999 | 34 (3.4%) | 4 (0.4%) |
| $10,000 to $12,499 | 9 (0.9%) | 8 (0.8%) |
| $12,500 to $14,999 | 30 (3.0%) | 4 (0.4%) |
| $15,000 to $17,499 | 67 (6.7%) | 108 (10.8%) |
| $17,500 to $19,999 | 0 (0.0%) | 50 (5.0%) |
| $20,000 to $22,499 | 10 (1.0%) | 60 (6.0%) |
| $22,500 to $24,999 | 10 (1.0%) | 29 (2.9%) |
| $25,000 to $29,999 | 34 (3.4%) | 75 (7.5%) |
| $30,000 to $34,999 | 49 (4.9%) | 0 (0.0%) |
| $35,000 to $39,999 | 15 (1.5%) | 20 (2.0%) |
| $40,000 to $44,999 | 16 (1.6%) | 64 (6.4%) |
| $45,000 to $49,999 | 89 (8.9%) | 18 (1.8%) |
| $50,000 to $54,999 | 24 (2.4%) | 191 (19.1%) |
| $55,000 to $64,999 | 47 (4.7%) | 116 (11.6%) |
| $65,000 to $74,999 | 106 (10.6%) | 41 (4.1%) |
| $75,000 to $99,999 | 138 (13.9%) | 83 (8.3%) |
| $100,000+ | 154 (15.5%) | 52 (5.2%) |
| Total | 996 (100.0%) | 1,002 (100.0%) |
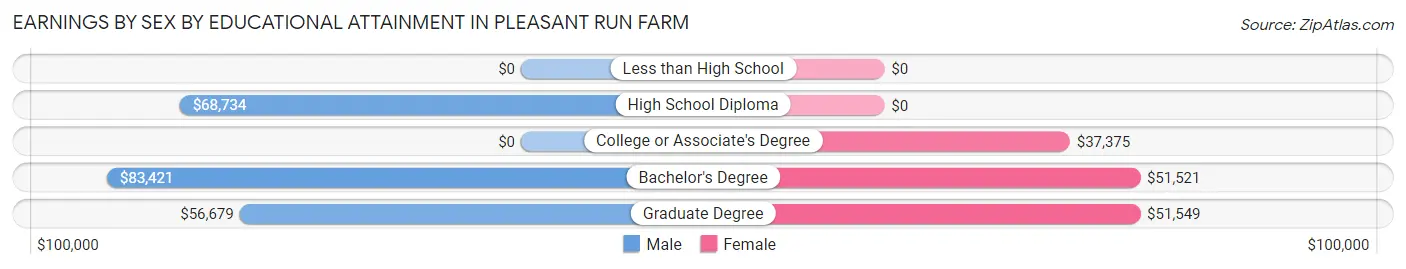
Earnings by Sex by Educational Attainment in Pleasant Run Farm
Average earnings in Pleasant Run Farm are $56,071 for men and $50,462 for women, a difference of 10.0%. Men with an educational attainment of bachelor's degree enjoy the highest average annual earnings of $83,421, while those with graduate degree education earn the least with $56,679. Women with an educational attainment of graduate degree earn the most with the average annual earnings of $51,549, while those with college or associate's degree education have the smallest earnings of $37,375.
| Educational Attainment | Male Income | Female Income |
| Less than High School | - | - |
| High School Diploma | $68,734 | $0 |
| College or Associate's Degree | - | - |
| Bachelor's Degree | $83,421 | $51,521 |
| Graduate Degree | $56,679 | $51,549 |
| Total | $56,071 | $50,462 |
Family Income in Pleasant Run Farm
Family Income Brackets in Pleasant Run Farm
According to the Pleasant Run Farm family income data, there are 272 families falling into the $100,000 to $149,999 income range, which is the most common income bracket and makes up 25.8% of all families.
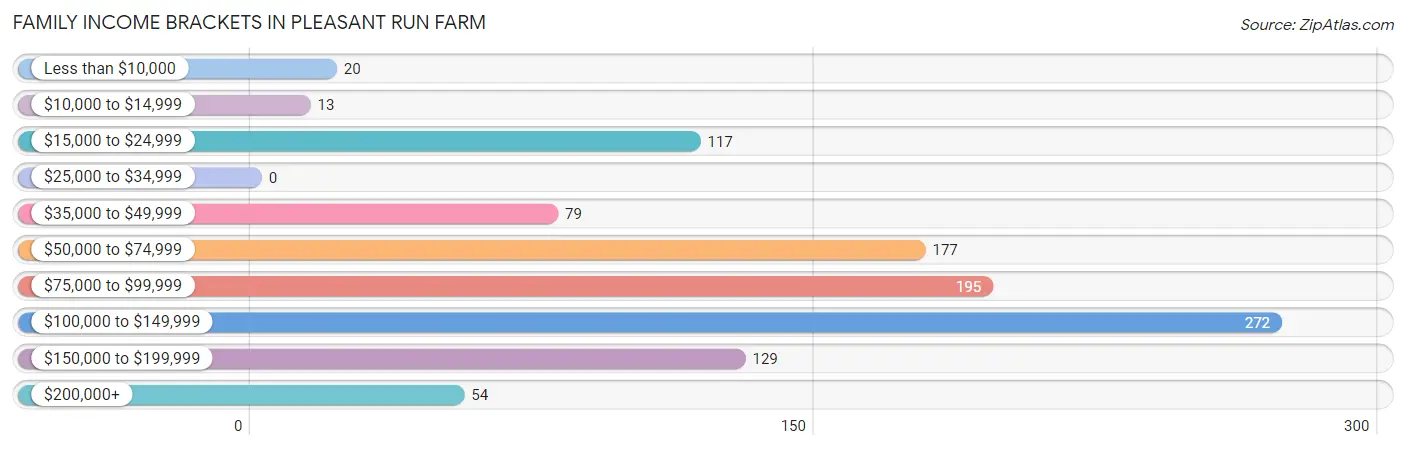
| Income Bracket | # Families | % Families |
| Less than $10,000 | 20 | 1.9% |
| $10,000 to $14,999 | 13 | 1.2% |
| $15,000 to $24,999 | 117 | 11.1% |
| $25,000 to $34,999 | 0 | 0.0% |
| $35,000 to $49,999 | 79 | 7.5% |
| $50,000 to $74,999 | 177 | 16.8% |
| $75,000 to $99,999 | 195 | 18.5% |
| $100,000 to $149,999 | 272 | 25.8% |
| $150,000 to $199,999 | 129 | 12.2% |
| $200,000+ | 54 | 5.1% |
Family Income by Famaliy Size in Pleasant Run Farm
5-person families (60 | 5.7%) account for the highest median family income in Pleasant Run Farm with $127,250 per family, while 2-person families (359 | 34.0%) have the highest median income of $34,862 per family member.
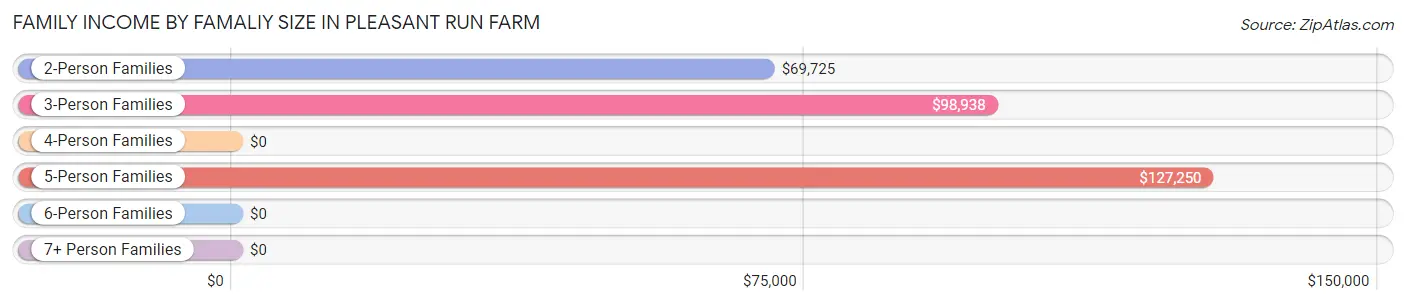
| Income Bracket | # Families | Median Income |
| 2-Person Families | 359 (34.0%) | $69,725 |
| 3-Person Families | 399 (37.8%) | $98,938 |
| 4-Person Families | 210 (19.9%) | $0 |
| 5-Person Families | 60 (5.7%) | $127,250 |
| 6-Person Families | 28 (2.6%) | $0 |
| 7+ Person Families | 0 (0.0%) | $0 |
| Total | 1,056 (100.0%) | $95,577 |
Family Income by Number of Earners in Pleasant Run Farm
The median family income in Pleasant Run Farm is $95,577, with families comprising 3+ earners (121) having the highest median family income of $126,815, while families with no earners (148) have the lowest median family income of $67,908, accounting for 11.5% and 14.0% of families, respectively.
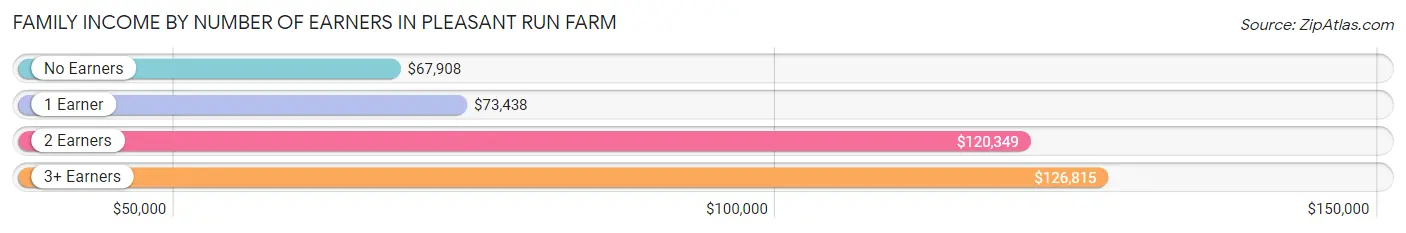
| Number of Earners | # Families | Median Income |
| No Earners | 148 (14.0%) | $67,908 |
| 1 Earner | 329 (31.2%) | $73,438 |
| 2 Earners | 458 (43.4%) | $120,349 |
| 3+ Earners | 121 (11.5%) | $126,815 |
| Total | 1,056 (100.0%) | $95,577 |
Household Income in Pleasant Run Farm
Household Income Brackets in Pleasant Run Farm
With 393 households falling in the category, the $100,000 to $149,999 income range is the most frequent in Pleasant Run Farm, accounting for 26.1% of all households. In contrast, only 14 households (0.9%) fall into the $10,000 to $14,999 income bracket, making it the least populous group.
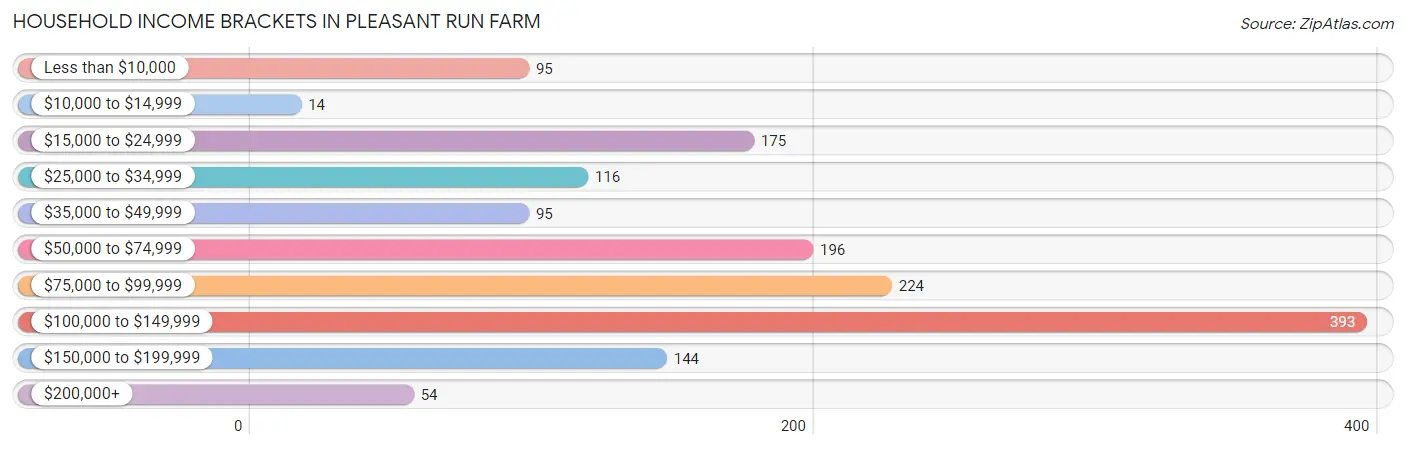
| Income Bracket | # Households | % Households |
| Less than $10,000 | 95 | 6.3% |
| $10,000 to $14,999 | 14 | 0.9% |
| $15,000 to $24,999 | 175 | 11.6% |
| $25,000 to $34,999 | 116 | 7.7% |
| $35,000 to $49,999 | 95 | 6.3% |
| $50,000 to $74,999 | 196 | 13.0% |
| $75,000 to $99,999 | 224 | 14.9% |
| $100,000 to $149,999 | 393 | 26.1% |
| $150,000 to $199,999 | 144 | 9.6% |
| $200,000+ | 54 | 3.6% |
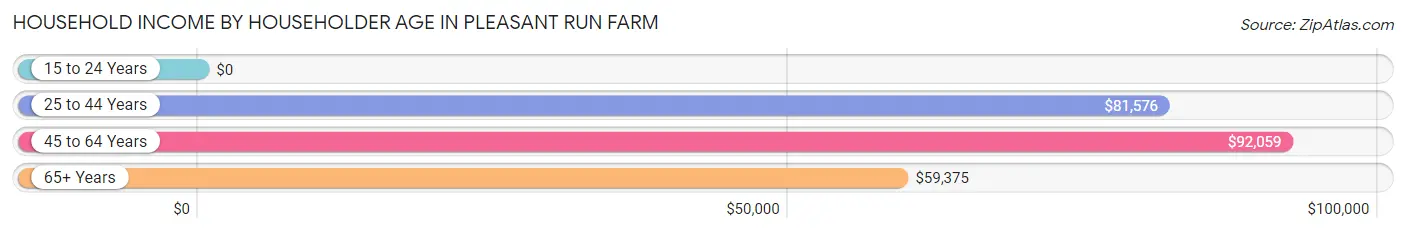
Household Income by Householder Age in Pleasant Run Farm
The median household income in Pleasant Run Farm is $82,303, with the highest median household income of $92,059 found in the 45 to 64 years age bracket for the primary householder. A total of 580 households (38.5%) fall into this category. Meanwhile, the 15 to 24 years age bracket for the primary householder has the lowest median household income of $0, with 18 households (1.2%) in this group.
| Income Bracket | # Households | Median Income |
| 15 to 24 Years | 18 (1.2%) | $0 |
| 25 to 44 Years | 417 (27.7%) | $81,576 |
| 45 to 64 Years | 580 (38.5%) | $92,059 |
| 65+ Years | 490 (32.6%) | $59,375 |
| Total | 1,505 (100.0%) | $82,303 |
Poverty in Pleasant Run Farm
Income Below Poverty by Sex and Age in Pleasant Run Farm
With 15.9% poverty level for males and 12.7% for females among the residents of Pleasant Run Farm, 35 to 44 year old males and 25 to 34 year old females are the most vulnerable to poverty, with 107 males (47.6%) and 107 females (55.4%) in their respective age groups living below the poverty level.
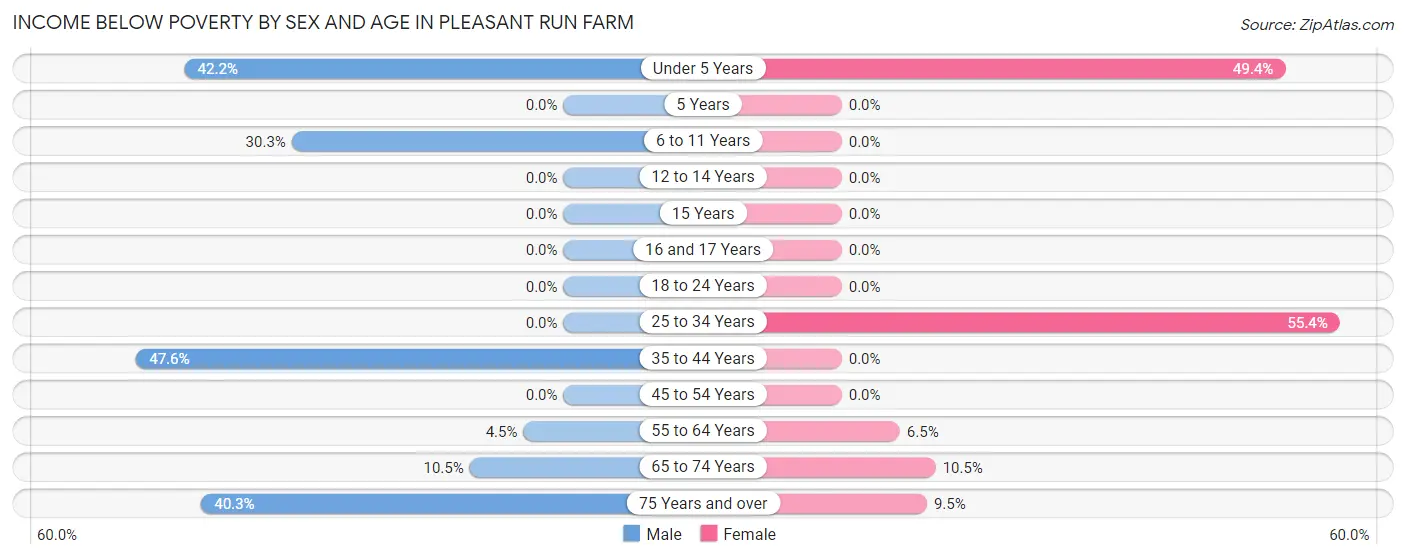
| Age Bracket | Male | Female |
| Under 5 Years | 105 (42.2%) | 78 (49.4%) |
| 5 Years | 0 (0.0%) | 0 (0.0%) |
| 6 to 11 Years | 23 (30.3%) | 0 (0.0%) |
| 12 to 14 Years | 0 (0.0%) | 0 (0.0%) |
| 15 Years | 0 (0.0%) | 0 (0.0%) |
| 16 and 17 Years | 0 (0.0%) | 0 (0.0%) |
| 18 to 24 Years | 0 (0.0%) | 0 (0.0%) |
| 25 to 34 Years | 0 (0.0%) | 107 (55.4%) |
| 35 to 44 Years | 107 (47.6%) | 0 (0.0%) |
| 45 to 54 Years | 0 (0.0%) | 0 (0.0%) |
| 55 to 64 Years | 10 (4.5%) | 13 (6.5%) |
| 65 to 74 Years | 21 (10.4%) | 34 (10.5%) |
| 75 Years and over | 50 (40.3%) | 13 (9.5%) |
| Total | 316 (15.9%) | 245 (12.7%) |
Income Above Poverty by Sex and Age in Pleasant Run Farm
According to the poverty statistics in Pleasant Run Farm, males aged 12 to 14 years and females aged 6 to 11 years are the age groups that are most secure financially, with 100.0% of males and 100.0% of females in these age groups living above the poverty line.
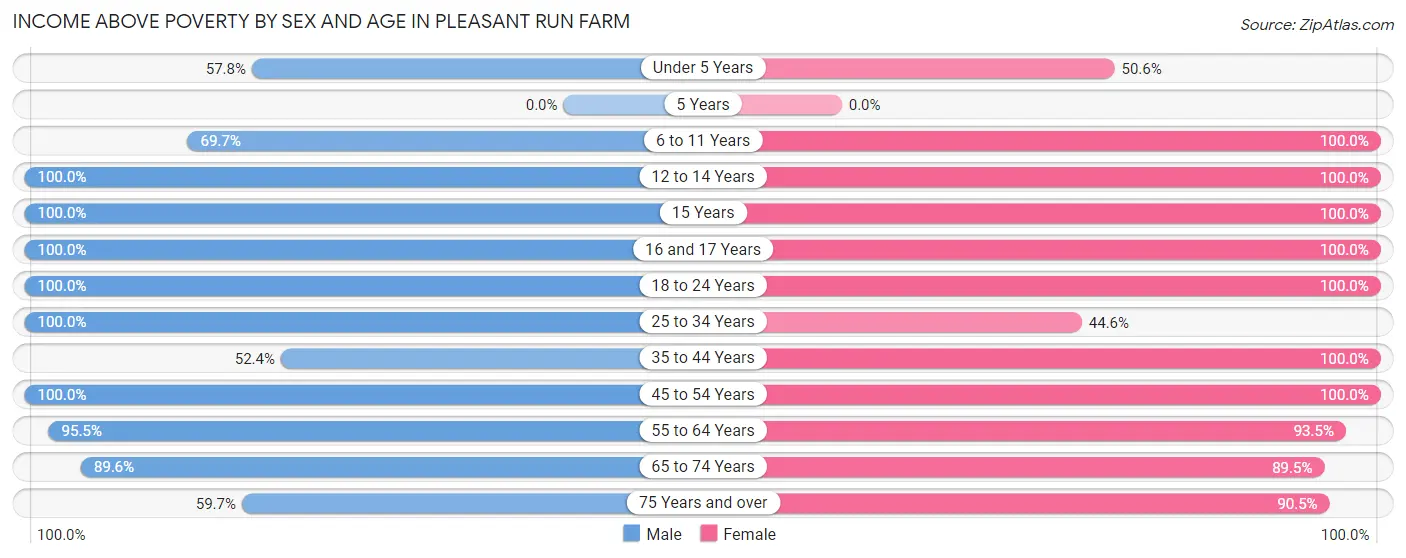
| Age Bracket | Male | Female |
| Under 5 Years | 144 (57.8%) | 80 (50.6%) |
| 5 Years | 0 (0.0%) | 0 (0.0%) |
| 6 to 11 Years | 53 (69.7%) | 12 (100.0%) |
| 12 to 14 Years | 111 (100.0%) | 80 (100.0%) |
| 15 Years | 73 (100.0%) | 53 (100.0%) |
| 16 and 17 Years | 43 (100.0%) | 76 (100.0%) |
| 18 to 24 Years | 220 (100.0%) | 117 (100.0%) |
| 25 to 34 Years | 177 (100.0%) | 86 (44.6%) |
| 35 to 44 Years | 118 (52.4%) | 230 (100.0%) |
| 45 to 54 Years | 264 (100.0%) | 342 (100.0%) |
| 55 to 64 Years | 214 (95.5%) | 188 (93.5%) |
| 65 to 74 Years | 180 (89.5%) | 291 (89.5%) |
| 75 Years and over | 74 (59.7%) | 124 (90.5%) |
| Total | 1,671 (84.1%) | 1,679 (87.3%) |
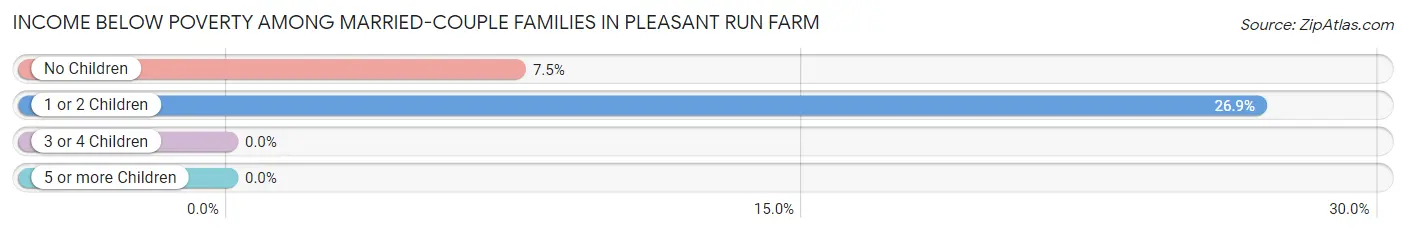
Income Below Poverty Among Married-Couple Families in Pleasant Run Farm
The poverty statistics for married-couple families in Pleasant Run Farm show that 14.4% or 116 of the total 803 families live below the poverty line. Families with 1 or 2 children have the highest poverty rate of 26.9%, comprising of 83 families. On the other hand, families with 3 or 4 children have the lowest poverty rate of 0.0%, which includes 0 families.
| Children | Above Poverty | Below Poverty |
| No Children | 406 (92.5%) | 33 (7.5%) |
| 1 or 2 Children | 226 (73.1%) | 83 (26.9%) |
| 3 or 4 Children | 55 (100.0%) | 0 (0.0%) |
| 5 or more Children | 0 (0.0%) | 0 (0.0%) |
| Total | 687 (85.6%) | 116 (14.4%) |
Income Below Poverty Among Single-Parent Households in Pleasant Run Farm
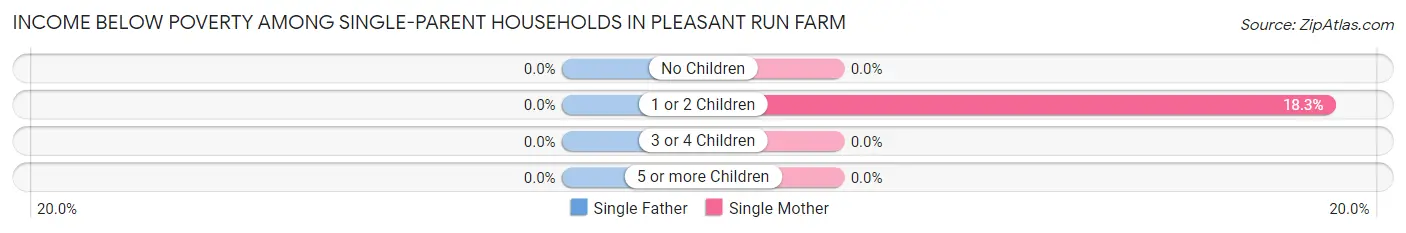
| Children | Single Father | Single Mother |
| No Children | 0 (0.0%) | 0 (0.0%) |
| 1 or 2 Children | 0 (0.0%) | 26 (18.3%) |
| 3 or 4 Children | 0 (0.0%) | 0 (0.0%) |
| 5 or more Children | 0 (0.0%) | 0 (0.0%) |
| Total | 0 (0.0%) | 26 (11.5%) |
Income Below Poverty Among Married-Couple vs Single-Parent Households in Pleasant Run Farm
The poverty data for Pleasant Run Farm shows that 116 of the married-couple family households (14.4%) and 26 of the single-parent households (10.3%) are living below the poverty level. Within the married-couple family households, those with 1 or 2 children have the highest poverty rate, with 83 households (26.9%) falling below the poverty line. Among the single-parent households, those with 1 or 2 children have the highest poverty rate, with 26 household (18.3%) living below poverty.
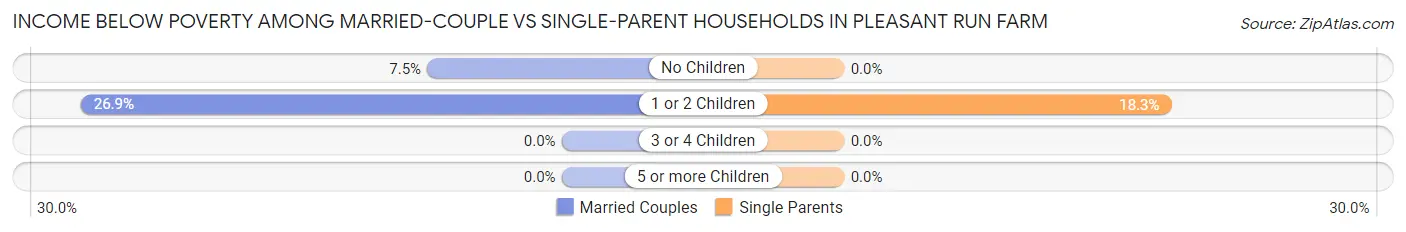
| Children | Married-Couple Families | Single-Parent Households |
| No Children | 33 (7.5%) | 0 (0.0%) |
| 1 or 2 Children | 83 (26.9%) | 26 (18.3%) |
| 3 or 4 Children | 0 (0.0%) | 0 (0.0%) |
| 5 or more Children | 0 (0.0%) | 0 (0.0%) |
| Total | 116 (14.4%) | 26 (10.3%) |
Race in Pleasant Run Farm
The most populous races in Pleasant Run Farm are Black / African American (2,065 | 51.4%), White / Caucasian (1,744 | 43.4%), and Two or more Races (197 | 4.9%).
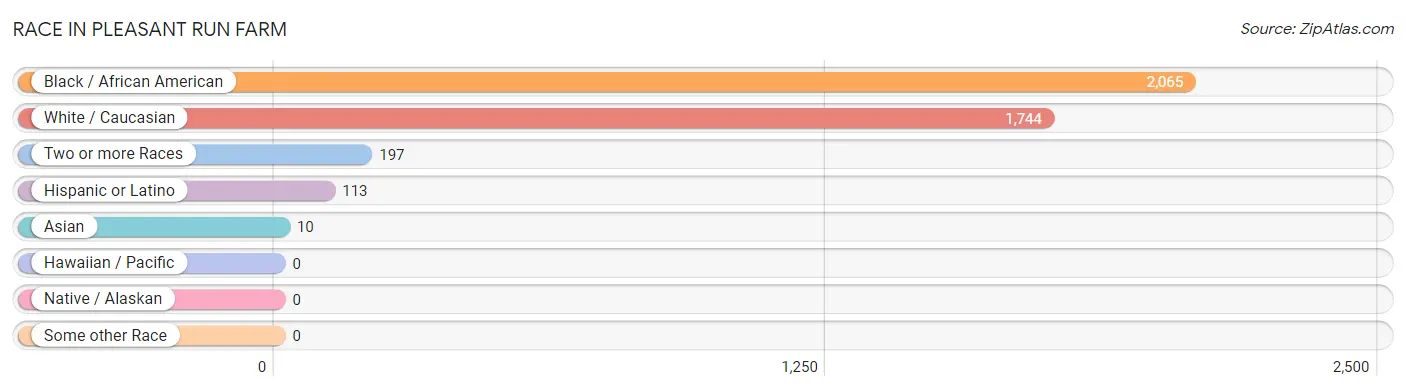
| Race | # Population | % Population |
| Asian | 10 | 0.3% |
| Black / African American | 2,065 | 51.4% |
| Hawaiian / Pacific | 0 | 0.0% |
| Hispanic or Latino | 113 | 2.8% |
| Native / Alaskan | 0 | 0.0% |
| White / Caucasian | 1,744 | 43.4% |
| Two or more Races | 197 | 4.9% |
| Some other Race | 0 | 0.0% |
| Total | 4,016 | 100.0% |
Ancestry in Pleasant Run Farm
The most populous ancestries reported in Pleasant Run Farm are German (715 | 17.8%), English (182 | 4.5%), American (158 | 3.9%), Irish (124 | 3.1%), and South American (98 | 2.4%), together accounting for 31.8% of all Pleasant Run Farm residents.
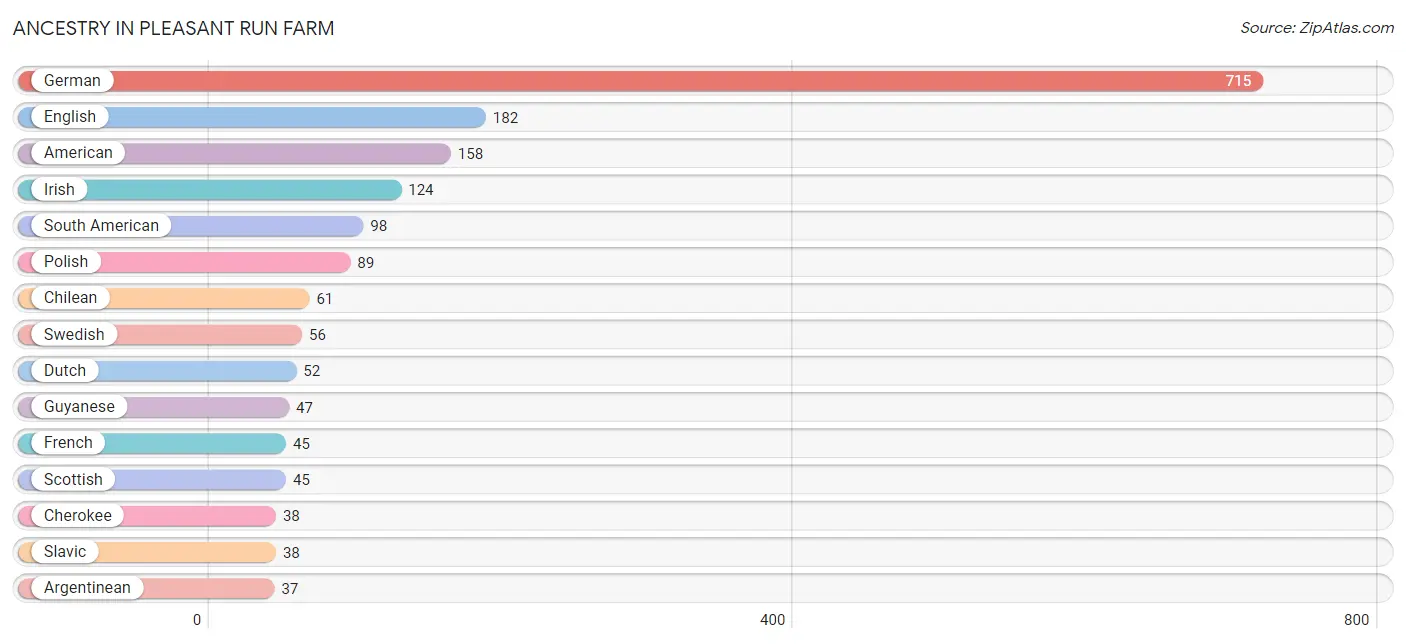
| Ancestry | # Population | % Population |
| American | 158 | 3.9% |
| Argentinean | 37 | 0.9% |
| Blackfeet | 4 | 0.1% |
| Cherokee | 38 | 0.9% |
| Chilean | 61 | 1.5% |
| Czech | 17 | 0.4% |
| Czechoslovakian | 9 | 0.2% |
| Dutch | 52 | 1.3% |
| English | 182 | 4.5% |
| European | 25 | 0.6% |
| French | 45 | 1.1% |
| German | 715 | 17.8% |
| Guyanese | 47 | 1.2% |
| Hungarian | 18 | 0.4% |
| Indian (Asian) | 10 | 0.3% |
| Irish | 124 | 3.1% |
| Italian | 8 | 0.2% |
| Mexican | 15 | 0.4% |
| Navajo | 16 | 0.4% |
| Norwegian | 11 | 0.3% |
| Polish | 89 | 2.2% |
| Russian | 12 | 0.3% |
| Scandinavian | 13 | 0.3% |
| Scottish | 45 | 1.1% |
| Slavic | 38 | 0.9% |
| South American | 98 | 2.4% |
| Subsaharan African | 17 | 0.4% |
| Swedish | 56 | 1.4% | View All 28 Rows |
Immigrants in Pleasant Run Farm
The most numerous immigrant groups reported in Pleasant Run Farm came from Latin America (127 | 3.2%), South America (118 | 2.9%), Chile (61 | 1.5%), Guyana (47 | 1.2%), and Argentina (10 | 0.3%), together accounting for 9.0% of all Pleasant Run Farm residents.
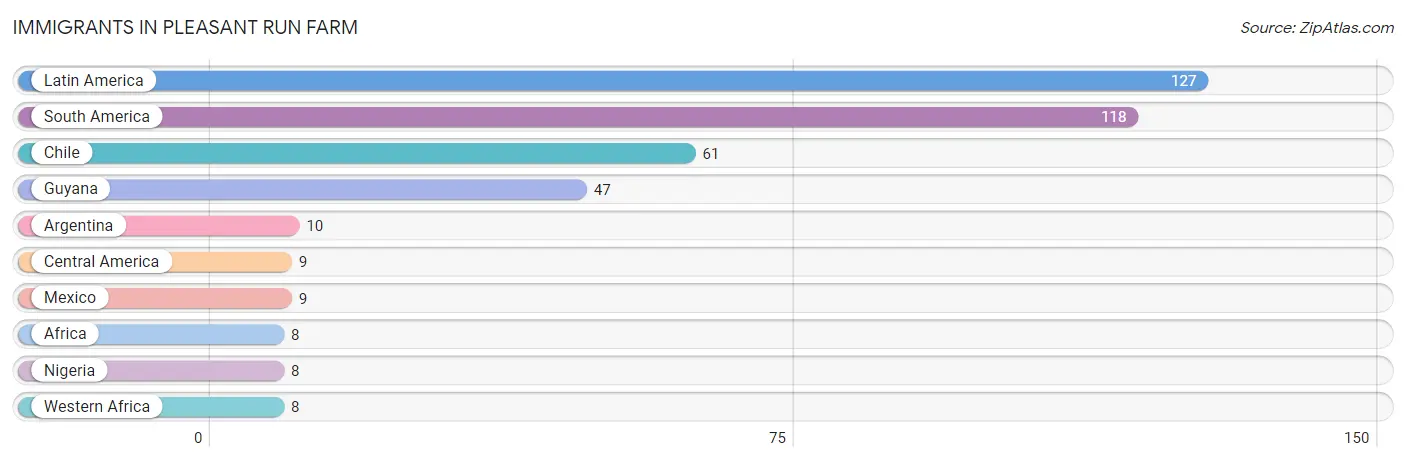
| Immigration Origin | # Population | % Population |
| Africa | 8 | 0.2% |
| Argentina | 10 | 0.3% |
| Central America | 9 | 0.2% |
| Chile | 61 | 1.5% |
| Guyana | 47 | 1.2% |
| Latin America | 127 | 3.2% |
| Mexico | 9 | 0.2% |
| Nigeria | 8 | 0.2% |
| South America | 118 | 2.9% |
| Western Africa | 8 | 0.2% | View All 10 Rows |
Sex and Age in Pleasant Run Farm
Sex and Age in Pleasant Run Farm
The most populous age groups in Pleasant Run Farm are Under 5 Years (249 | 12.3%) for men and 50 to 54 Years (245 | 12.3%) for women.
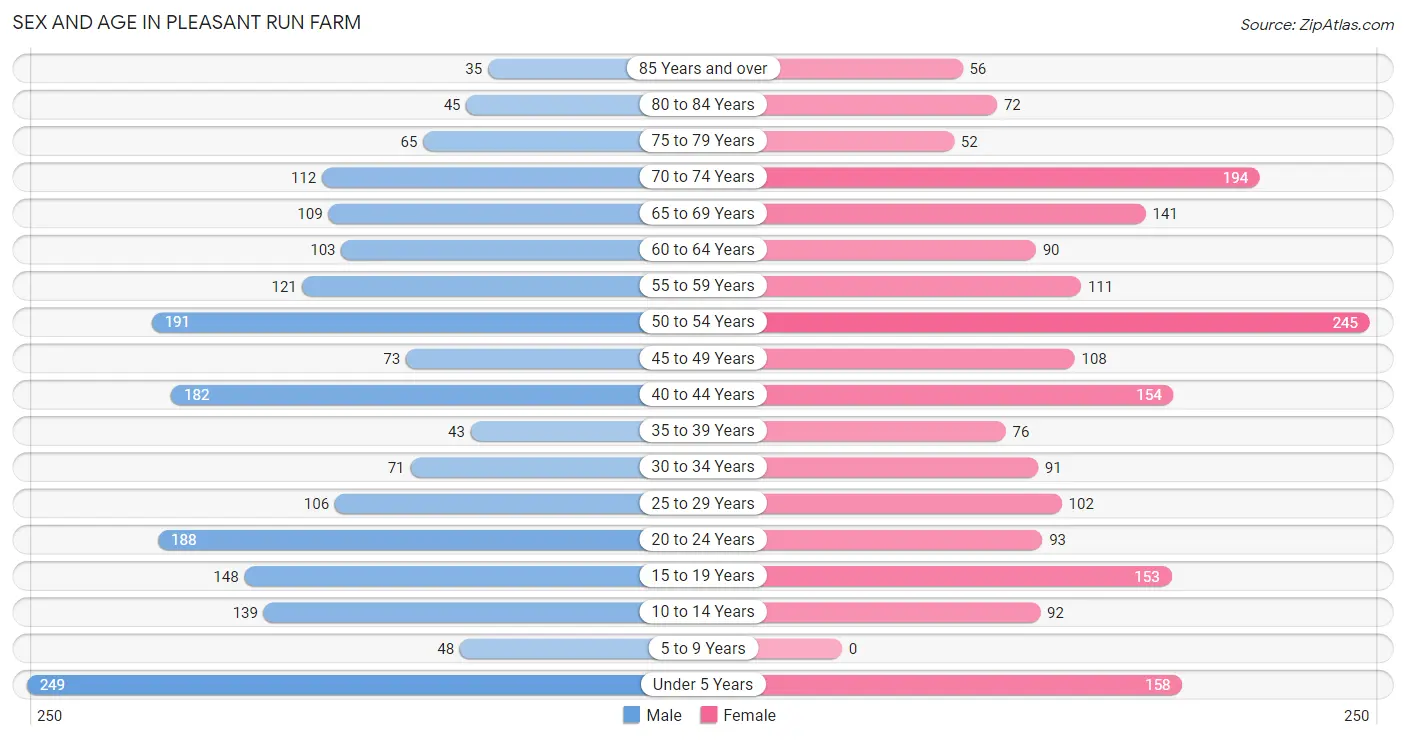
| Age Bracket | Male | Female |
| Under 5 Years | 249 (12.3%) | 158 (8.0%) |
| 5 to 9 Years | 48 (2.4%) | 0 (0.0%) |
| 10 to 14 Years | 139 (6.9%) | 92 (4.6%) |
| 15 to 19 Years | 148 (7.3%) | 153 (7.7%) |
| 20 to 24 Years | 188 (9.3%) | 93 (4.7%) |
| 25 to 29 Years | 106 (5.2%) | 102 (5.1%) |
| 30 to 34 Years | 71 (3.5%) | 91 (4.6%) |
| 35 to 39 Years | 43 (2.1%) | 76 (3.8%) |
| 40 to 44 Years | 182 (9.0%) | 154 (7.7%) |
| 45 to 49 Years | 73 (3.6%) | 108 (5.4%) |
| 50 to 54 Years | 191 (9.4%) | 245 (12.3%) |
| 55 to 59 Years | 121 (6.0%) | 111 (5.6%) |
| 60 to 64 Years | 103 (5.1%) | 90 (4.5%) |
| 65 to 69 Years | 109 (5.4%) | 141 (7.1%) |
| 70 to 74 Years | 112 (5.5%) | 194 (9.8%) |
| 75 to 79 Years | 65 (3.2%) | 52 (2.6%) |
| 80 to 84 Years | 45 (2.2%) | 72 (3.6%) |
| 85 Years and over | 35 (1.7%) | 56 (2.8%) |
| Total | 2,028 (100.0%) | 1,988 (100.0%) |
Families and Households in Pleasant Run Farm
Median Family Size in Pleasant Run Farm
The median family size in Pleasant Run Farm is 3.17 persons per family, with married-couple families (803 | 76.0%) accounting for the largest median family size of 3.26 persons per family. On the other hand, single male/father families (26 | 2.5%) represent the smallest median family size with 2.65 persons per family.
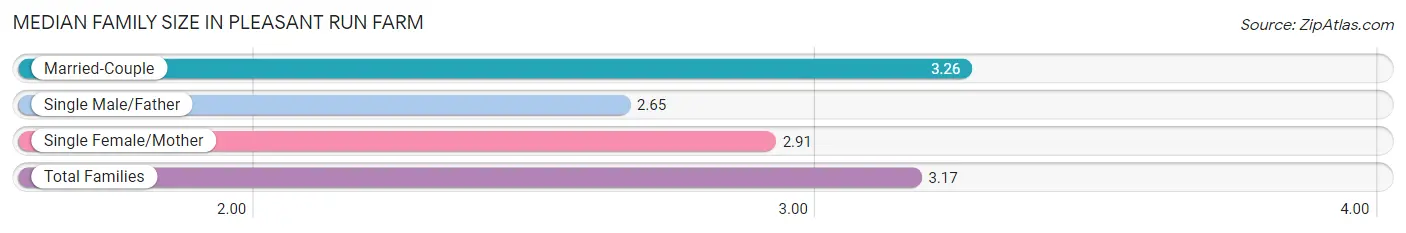
| Family Type | # Families | Family Size |
| Married-Couple | 803 (76.0%) | 3.26 |
| Single Male/Father | 26 (2.5%) | 2.65 |
| Single Female/Mother | 227 (21.5%) | 2.91 |
| Total Families | 1,056 (100.0%) | 3.17 |
Median Household Size in Pleasant Run Farm
The median household size in Pleasant Run Farm is 2.60 persons per household, with married-couple households (803 | 53.4%) accounting for the largest median household size of 3.26 persons per household. non-family households (449 | 29.8%) represent the smallest median household size with 1.13 persons per household.
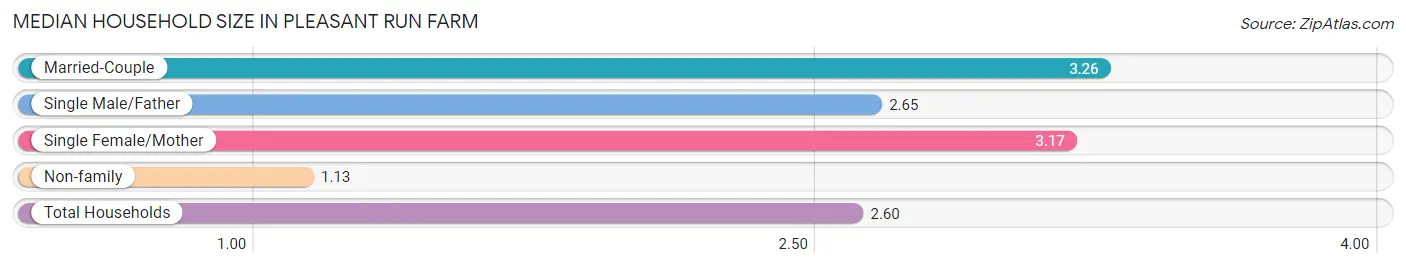
| Household Type | # Households | Household Size |
| Married-Couple | 803 (53.4%) | 3.26 |
| Single Male/Father | 26 (1.7%) | 2.65 |
| Single Female/Mother | 227 (15.1%) | 3.17 |
| Non-family | 449 (29.8%) | 1.13 |
| Total Households | 1,505 (100.0%) | 2.60 |
Household Size by Marriage Status in Pleasant Run Farm
Out of a total of 1,505 households in Pleasant Run Farm, 1,056 (70.2%) are family households, while 449 (29.8%) are nonfamily households. The most numerous type of family households are 3-person households, comprising 376, and the most common type of nonfamily households are 1-person households, comprising 413.
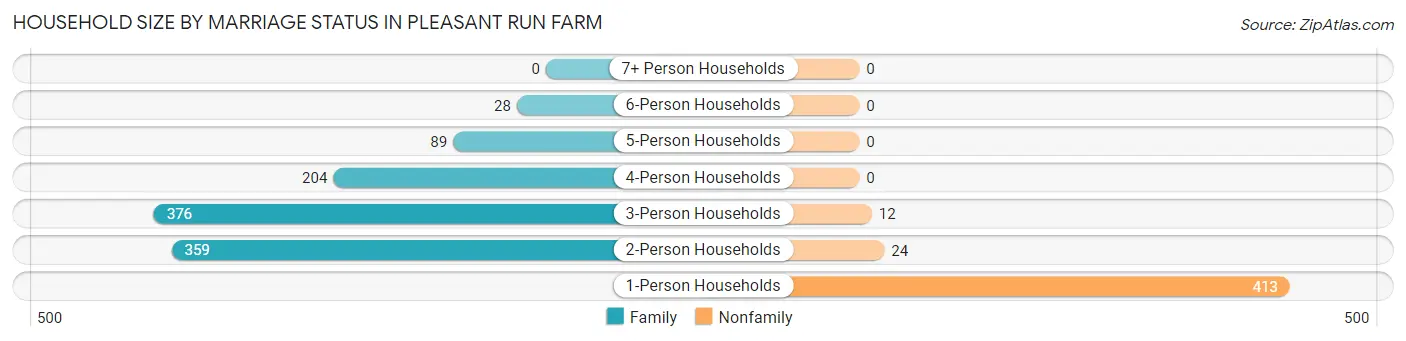
| Household Size | Family Households | Nonfamily Households |
| 1-Person Households | - | 413 (27.4%) |
| 2-Person Households | 359 (23.8%) | 24 (1.6%) |
| 3-Person Households | 376 (25.0%) | 12 (0.8%) |
| 4-Person Households | 204 (13.6%) | 0 (0.0%) |
| 5-Person Households | 89 (5.9%) | 0 (0.0%) |
| 6-Person Households | 28 (1.9%) | 0 (0.0%) |
| 7+ Person Households | 0 (0.0%) | 0 (0.0%) |
| Total | 1,056 (70.2%) | 449 (29.8%) |
Female Fertility in Pleasant Run Farm
Fertility by Age in Pleasant Run Farm
Average fertility rate in Pleasant Run Farm is 169.0 births per 1,000 women. Women in the age bracket of 20 to 34 years have the highest fertility rate with 374.0 births per 1,000 women. Women in the age bracket of 20 to 34 years acount for 79.3% of all women with births.
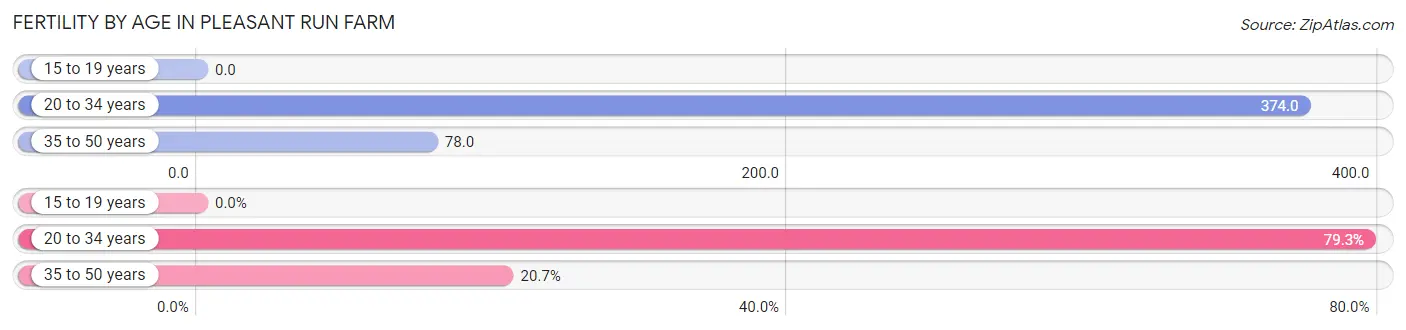
| Age Bracket | Women with Births | Births / 1,000 Women |
| 15 to 19 years | 0 (0.0%) | 0.0 |
| 20 to 34 years | 107 (79.3%) | 374.0 |
| 35 to 50 years | 28 (20.7%) | 78.0 |
| Total | 135 (100.0%) | 169.0 |
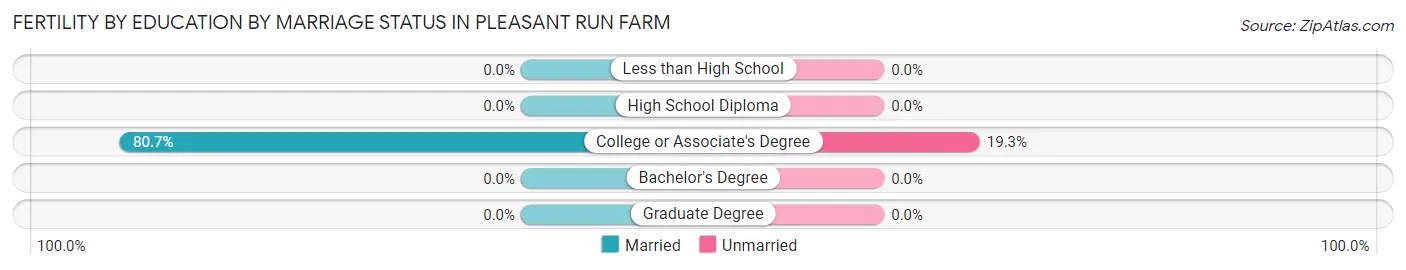
Fertility by Age by Marriage Status in Pleasant Run Farm
80.7% of women with births (135) in Pleasant Run Farm are married. The highest percentage of unmarried women with births falls into 20 to 34 years age bracket with 24.3% of them unmarried at the time of birth, while the lowest percentage of unmarried women with births belong to 35 to 50 years age bracket with 0.0% of them unmarried.
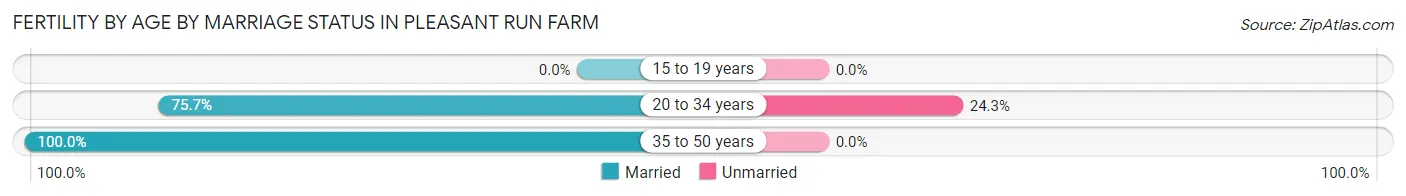
| Age Bracket | Married | Unmarried |
| 15 to 19 years | 0 (0.0%) | 0 (0.0%) |
| 20 to 34 years | 81 (75.7%) | 26 (24.3%) |
| 35 to 50 years | 28 (100.0%) | 0 (0.0%) |
| Total | 109 (80.7%) | 26 (19.3%) |
Fertility by Education in Pleasant Run Farm
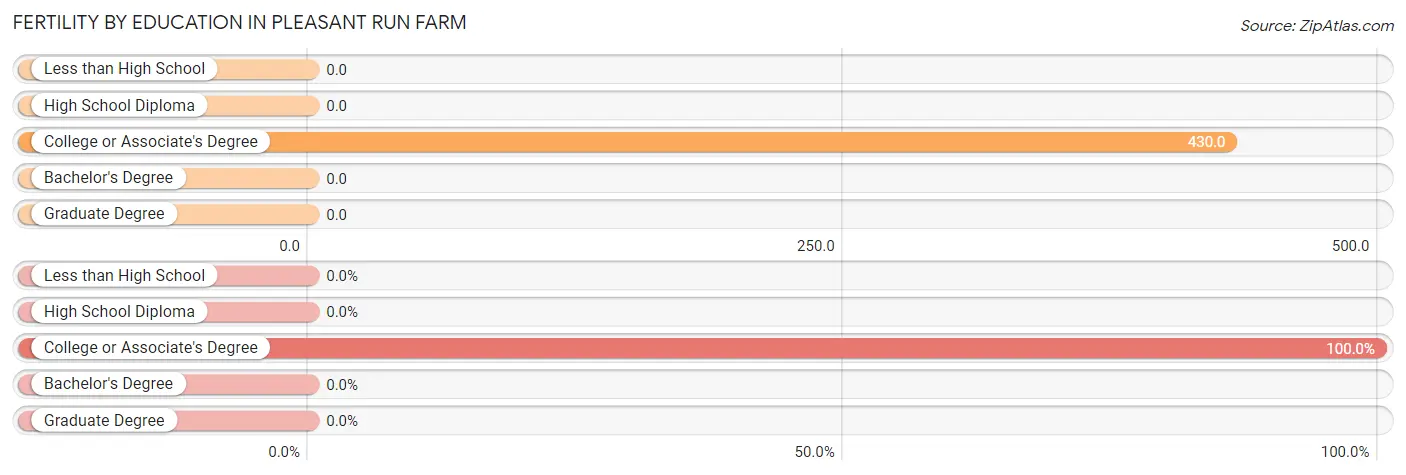
| Educational Attainment | Women with Births | Births / 1,000 Women |
| Less than High School | 0 (0.0%) | 0.0 |
| High School Diploma | 0 (0.0%) | 0.0 |
| College or Associate's Degree | 135 (100.0%) | 430.0 |
| Bachelor's Degree | 0 (0.0%) | 0.0 |
| Graduate Degree | 0 (0.0%) | 0.0 |
| Total | 135 (100.0%) | 169.0 |
Fertility by Education by Marriage Status in Pleasant Run Farm
19.3% of women with births in Pleasant Run Farm are unmarried. Women with the educational attainment of college or associate's degree are most likely to be married with 80.7% of them married at childbirth, while women with the educational attainment of college or associate's degree are least likely to be married with 19.3% of them unmarried at childbirth.
| Educational Attainment | Married | Unmarried |
| Less than High School | 0 (0.0%) | 0 (0.0%) |
| High School Diploma | 0 (0.0%) | 0 (0.0%) |
| College or Associate's Degree | 109 (80.7%) | 26 (19.3%) |
| Bachelor's Degree | 0 (0.0%) | 0 (0.0%) |
| Graduate Degree | 0 (0.0%) | 0 (0.0%) |
| Total | 109 (80.7%) | 26 (19.3%) |
Employment Characteristics in Pleasant Run Farm
Employment by Class of Employer in Pleasant Run Farm
Among the 1,910 employed individuals in Pleasant Run Farm, private company employees (1,244 | 65.1%), not-for-profit organizations (289 | 15.1%), and local government employees (188 | 9.8%) make up the most common classes of employment.
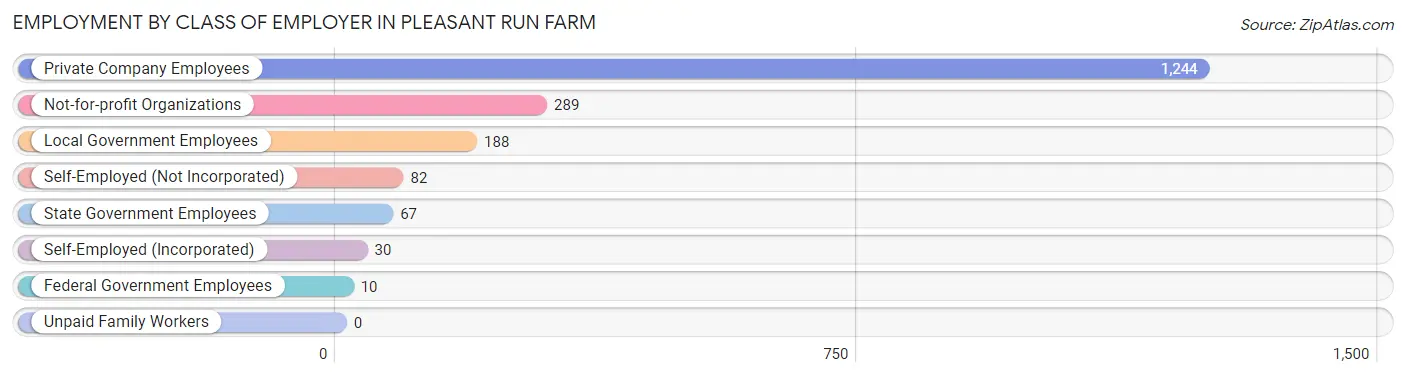
| Employer Class | # Employees | % Employees |
| Private Company Employees | 1,244 | 65.1% |
| Self-Employed (Incorporated) | 30 | 1.6% |
| Self-Employed (Not Incorporated) | 82 | 4.3% |
| Not-for-profit Organizations | 289 | 15.1% |
| Local Government Employees | 188 | 9.8% |
| State Government Employees | 67 | 3.5% |
| Federal Government Employees | 10 | 0.5% |
| Unpaid Family Workers | 0 | 0.0% |
| Total | 1,910 | 100.0% |
Employment Status by Age in Pleasant Run Farm
According to the labor force statistics for Pleasant Run Farm, out of the total population over 16 years of age (3,204), 60.3% or 1,932 individuals are in the labor force, with 0.7% or 14 of them unemployed. The age group with the highest labor force participation rate is 35 to 44 years, with 94.7% or 431 individuals in the labor force. Within the labor force, the 20 to 24 years age range has the highest percentage of unemployed individuals, with 9.1% or 14 of them being unemployed.
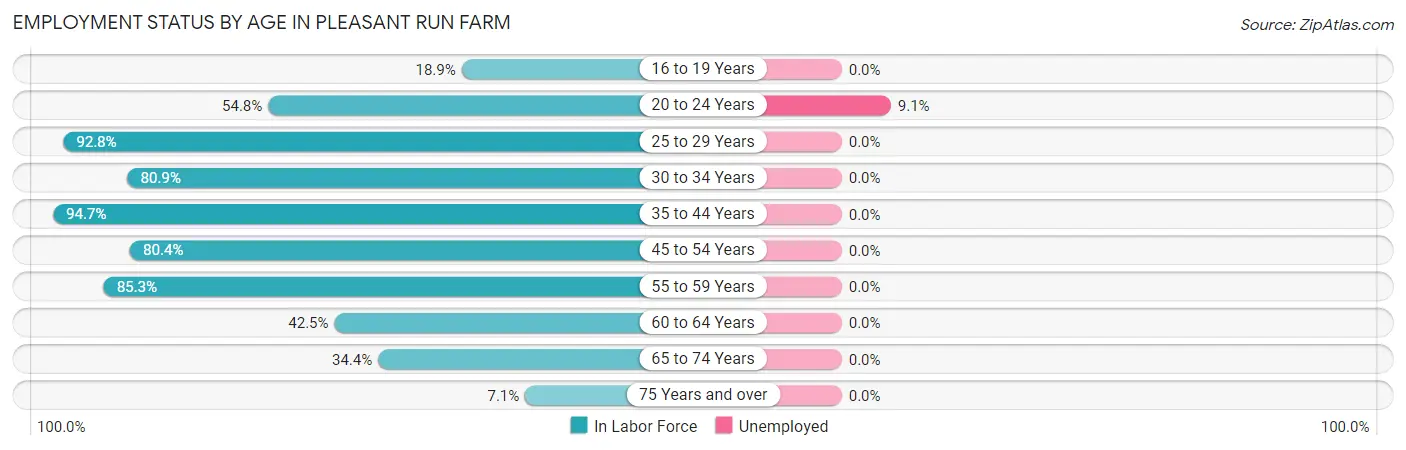
| Age Bracket | In Labor Force | Unemployed |
| 16 to 19 Years | 33 (18.9%) | 0 (0.0%) |
| 20 to 24 Years | 154 (54.8%) | 14 (9.1%) |
| 25 to 29 Years | 193 (92.8%) | 0 (0.0%) |
| 30 to 34 Years | 131 (80.9%) | 0 (0.0%) |
| 35 to 44 Years | 431 (94.7%) | 0 (0.0%) |
| 45 to 54 Years | 496 (80.4%) | 0 (0.0%) |
| 55 to 59 Years | 198 (85.3%) | 0 (0.0%) |
| 60 to 64 Years | 82 (42.5%) | 0 (0.0%) |
| 65 to 74 Years | 191 (34.4%) | 0 (0.0%) |
| 75 Years and over | 23 (7.1%) | 0 (0.0%) |
| Total | 1,932 (60.3%) | 14 (0.7%) |
Employment Status by Educational Attainment in Pleasant Run Farm
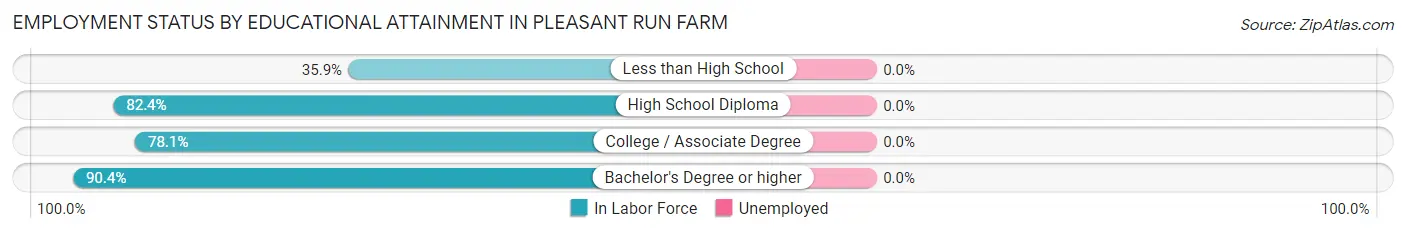
| Educational Attainment | In Labor Force | Unemployed |
| Less than High School | 28 (35.9%) | 0 (0.0%) |
| High School Diploma | 271 (82.4%) | 0 (0.0%) |
| College / Associate Degree | 561 (78.1%) | 0 (0.0%) |
| Bachelor's Degree or higher | 671 (90.4%) | 0 (0.0%) |
| Total | 1,531 (82.0%) | 0 (0.0%) |
Employment Occupations by Sex in Pleasant Run Farm
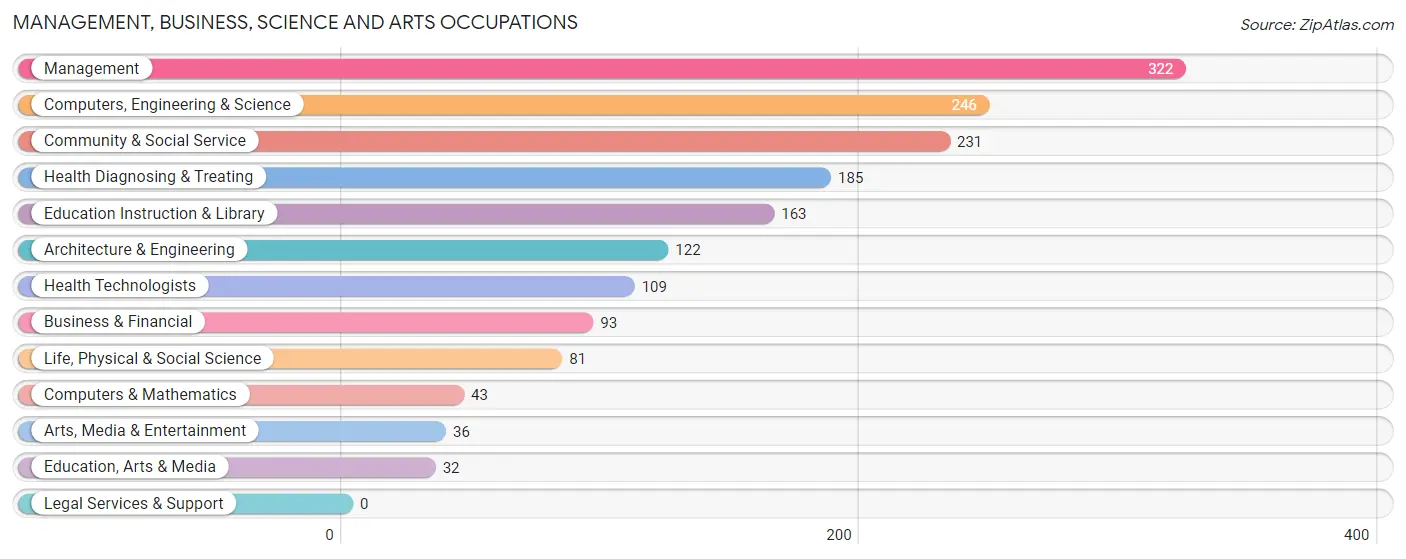
Management, Business, Science and Arts Occupations
The most common Management, Business, Science and Arts occupations in Pleasant Run Farm are Management (322 | 16.8%), Computers, Engineering & Science (246 | 12.8%), Community & Social Service (231 | 12.0%), Health Diagnosing & Treating (185 | 9.7%), and Education Instruction & Library (163 | 8.5%).
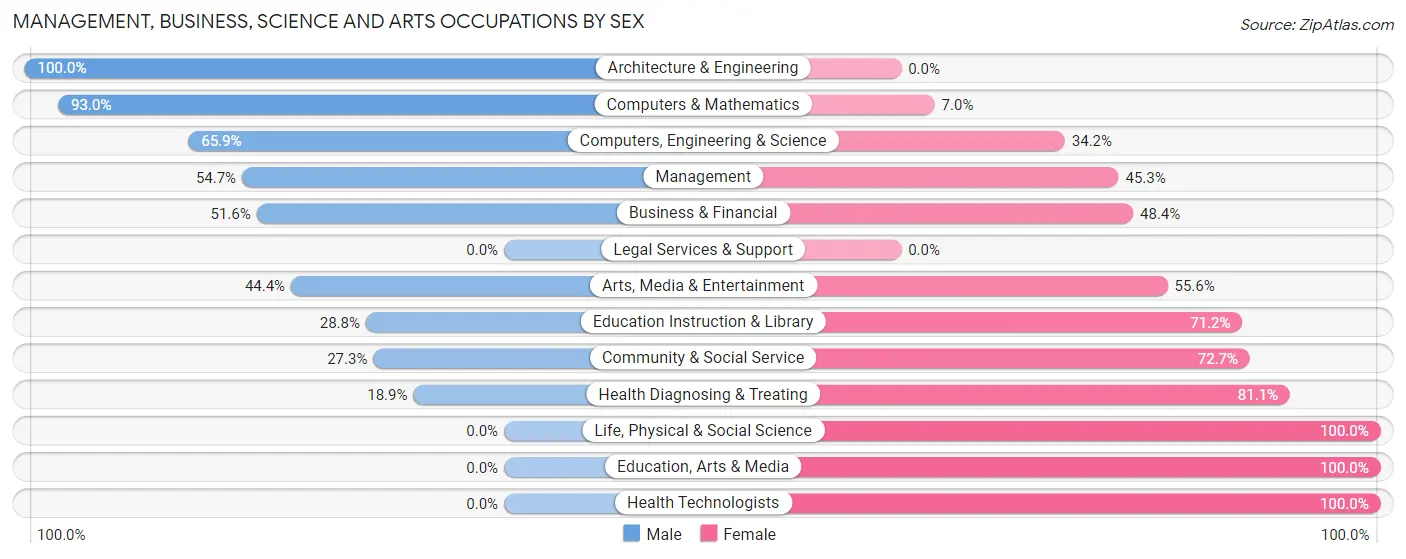
Management, Business, Science and Arts Occupations by Sex
Within the Management, Business, Science and Arts occupations in Pleasant Run Farm, the most male-oriented occupations are Architecture & Engineering (100.0%), Computers & Mathematics (93.0%), and Computers, Engineering & Science (65.8%), while the most female-oriented occupations are Life, Physical & Social Science (100.0%), Education, Arts & Media (100.0%), and Health Technologists (100.0%).
| Occupation | Male | Female |
| Management | 176 (54.7%) | 146 (45.3%) |
| Business & Financial | 48 (51.6%) | 45 (48.4%) |
| Computers, Engineering & Science | 162 (65.8%) | 84 (34.2%) |
| Computers & Mathematics | 40 (93.0%) | 3 (7.0%) |
| Architecture & Engineering | 122 (100.0%) | 0 (0.0%) |
| Life, Physical & Social Science | 0 (0.0%) | 81 (100.0%) |
| Community & Social Service | 63 (27.3%) | 168 (72.7%) |
| Education, Arts & Media | 0 (0.0%) | 32 (100.0%) |
| Legal Services & Support | 0 (0.0%) | 0 (0.0%) |
| Education Instruction & Library | 47 (28.8%) | 116 (71.2%) |
| Arts, Media & Entertainment | 16 (44.4%) | 20 (55.6%) |
| Health Diagnosing & Treating | 35 (18.9%) | 150 (81.1%) |
| Health Technologists | 0 (0.0%) | 109 (100.0%) |
| Total (Category) | 484 (44.9%) | 593 (55.1%) |
| Total (Overall) | 931 (48.5%) | 987 (51.5%) |
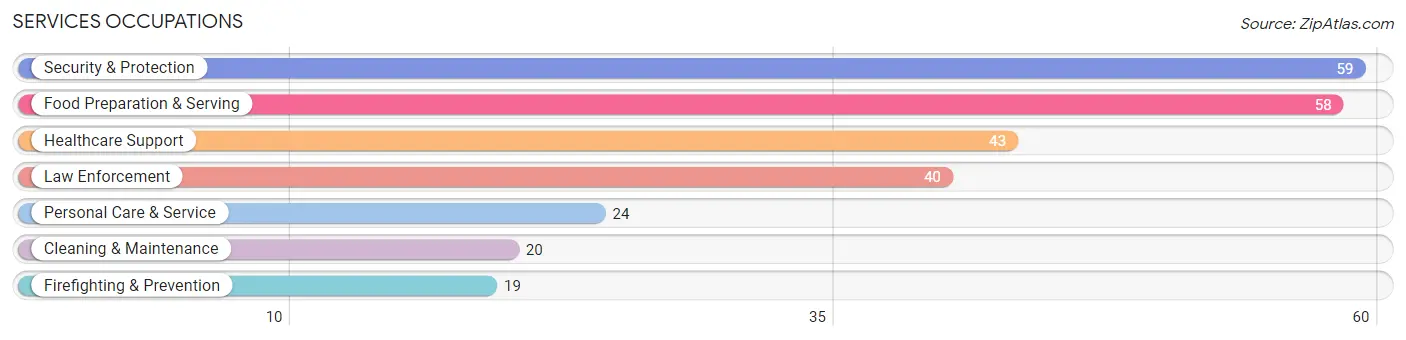
Services Occupations
The most common Services occupations in Pleasant Run Farm are Security & Protection (59 | 3.1%), Food Preparation & Serving (58 | 3.0%), Healthcare Support (43 | 2.2%), Law Enforcement (40 | 2.1%), and Personal Care & Service (24 | 1.3%).
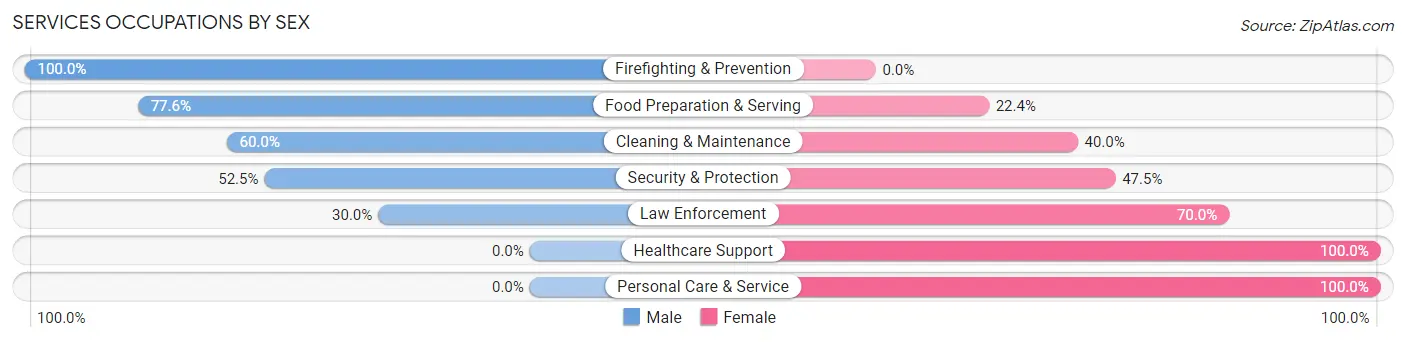
Services Occupations by Sex
Within the Services occupations in Pleasant Run Farm, the most male-oriented occupations are Firefighting & Prevention (100.0%), Food Preparation & Serving (77.6%), and Cleaning & Maintenance (60.0%), while the most female-oriented occupations are Healthcare Support (100.0%), Personal Care & Service (100.0%), and Law Enforcement (70.0%).
| Occupation | Male | Female |
| Healthcare Support | 0 (0.0%) | 43 (100.0%) |
| Security & Protection | 31 (52.5%) | 28 (47.5%) |
| Firefighting & Prevention | 19 (100.0%) | 0 (0.0%) |
| Law Enforcement | 12 (30.0%) | 28 (70.0%) |
| Food Preparation & Serving | 45 (77.6%) | 13 (22.4%) |
| Cleaning & Maintenance | 12 (60.0%) | 8 (40.0%) |
| Personal Care & Service | 0 (0.0%) | 24 (100.0%) |
| Total (Category) | 88 (43.1%) | 116 (56.9%) |
| Total (Overall) | 931 (48.5%) | 987 (51.5%) |
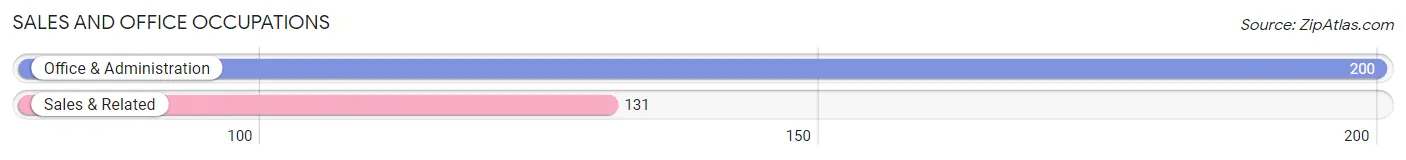
Sales and Office Occupations
The most common Sales and Office occupations in Pleasant Run Farm are Office & Administration (200 | 10.4%), and Sales & Related (131 | 6.8%).
Sales and Office Occupations by Sex
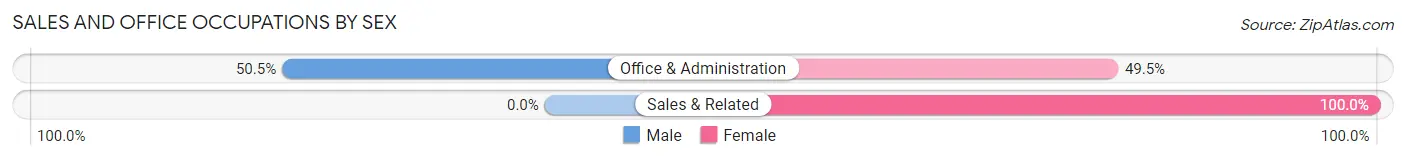
| Occupation | Male | Female |
| Sales & Related | 0 (0.0%) | 131 (100.0%) |
| Office & Administration | 101 (50.5%) | 99 (49.5%) |
| Total (Category) | 101 (30.5%) | 230 (69.5%) |
| Total (Overall) | 931 (48.5%) | 987 (51.5%) |
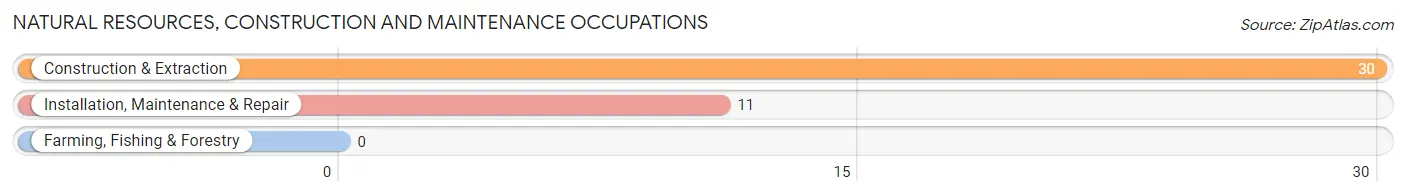
Natural Resources, Construction and Maintenance Occupations
The most common Natural Resources, Construction and Maintenance occupations in Pleasant Run Farm are Construction & Extraction (30 | 1.6%), and Installation, Maintenance & Repair (11 | 0.6%).
Natural Resources, Construction and Maintenance Occupations by Sex
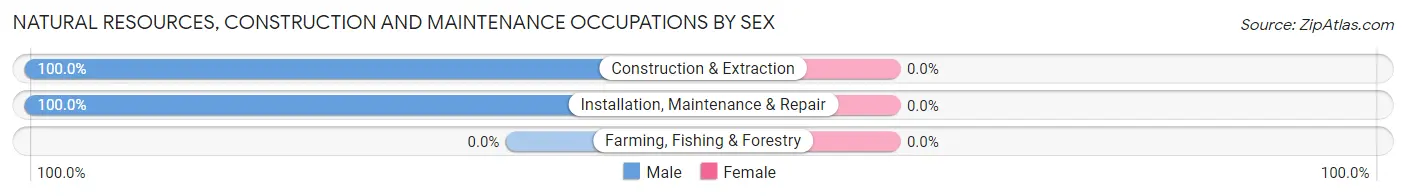
| Occupation | Male | Female |
| Farming, Fishing & Forestry | 0 (0.0%) | 0 (0.0%) |
| Construction & Extraction | 30 (100.0%) | 0 (0.0%) |
| Installation, Maintenance & Repair | 11 (100.0%) | 0 (0.0%) |
| Total (Category) | 41 (100.0%) | 0 (0.0%) |
| Total (Overall) | 931 (48.5%) | 987 (51.5%) |
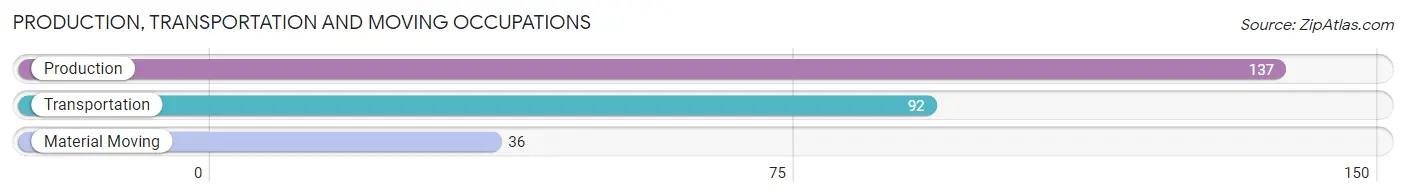
Production, Transportation and Moving Occupations
The most common Production, Transportation and Moving occupations in Pleasant Run Farm are Production (137 | 7.1%), Transportation (92 | 4.8%), and Material Moving (36 | 1.9%).
Production, Transportation and Moving Occupations by Sex
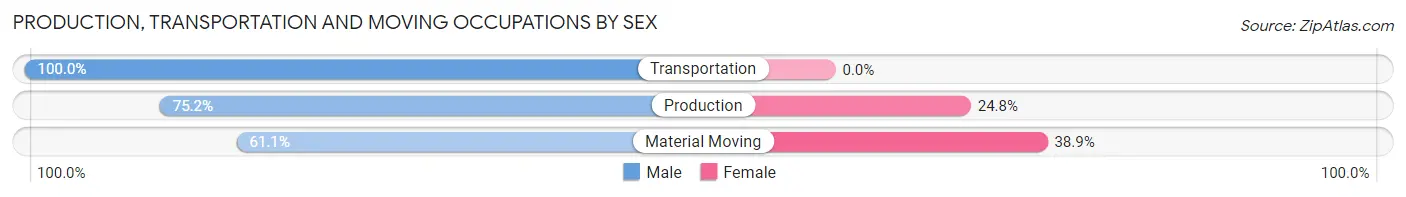
| Occupation | Male | Female |
| Production | 103 (75.2%) | 34 (24.8%) |
| Transportation | 92 (100.0%) | 0 (0.0%) |
| Material Moving | 22 (61.1%) | 14 (38.9%) |
| Total (Category) | 217 (81.9%) | 48 (18.1%) |
| Total (Overall) | 931 (48.5%) | 987 (51.5%) |
Employment Industries by Sex in Pleasant Run Farm
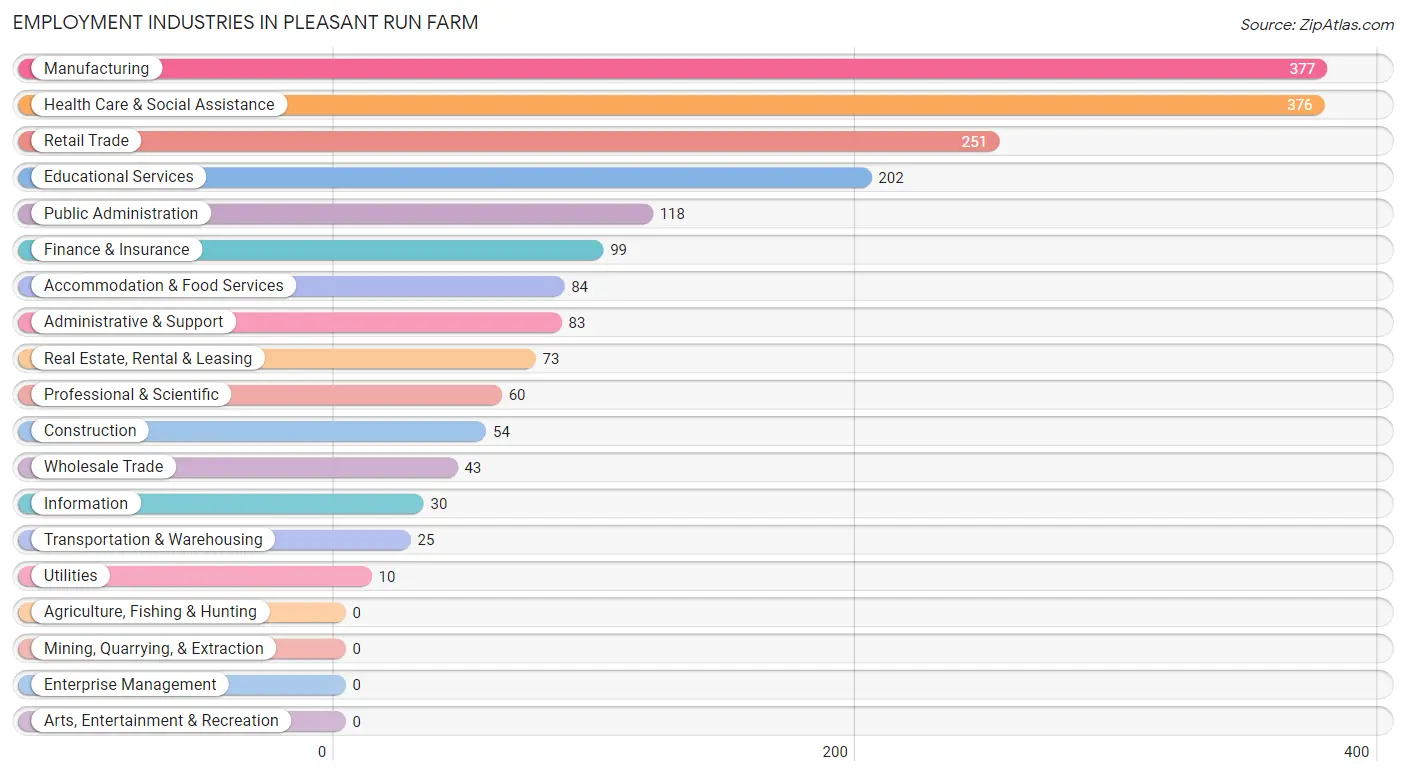
Employment Industries in Pleasant Run Farm
The major employment industries in Pleasant Run Farm include Manufacturing (377 | 19.7%), Health Care & Social Assistance (376 | 19.6%), Retail Trade (251 | 13.1%), Educational Services (202 | 10.5%), and Public Administration (118 | 6.1%).
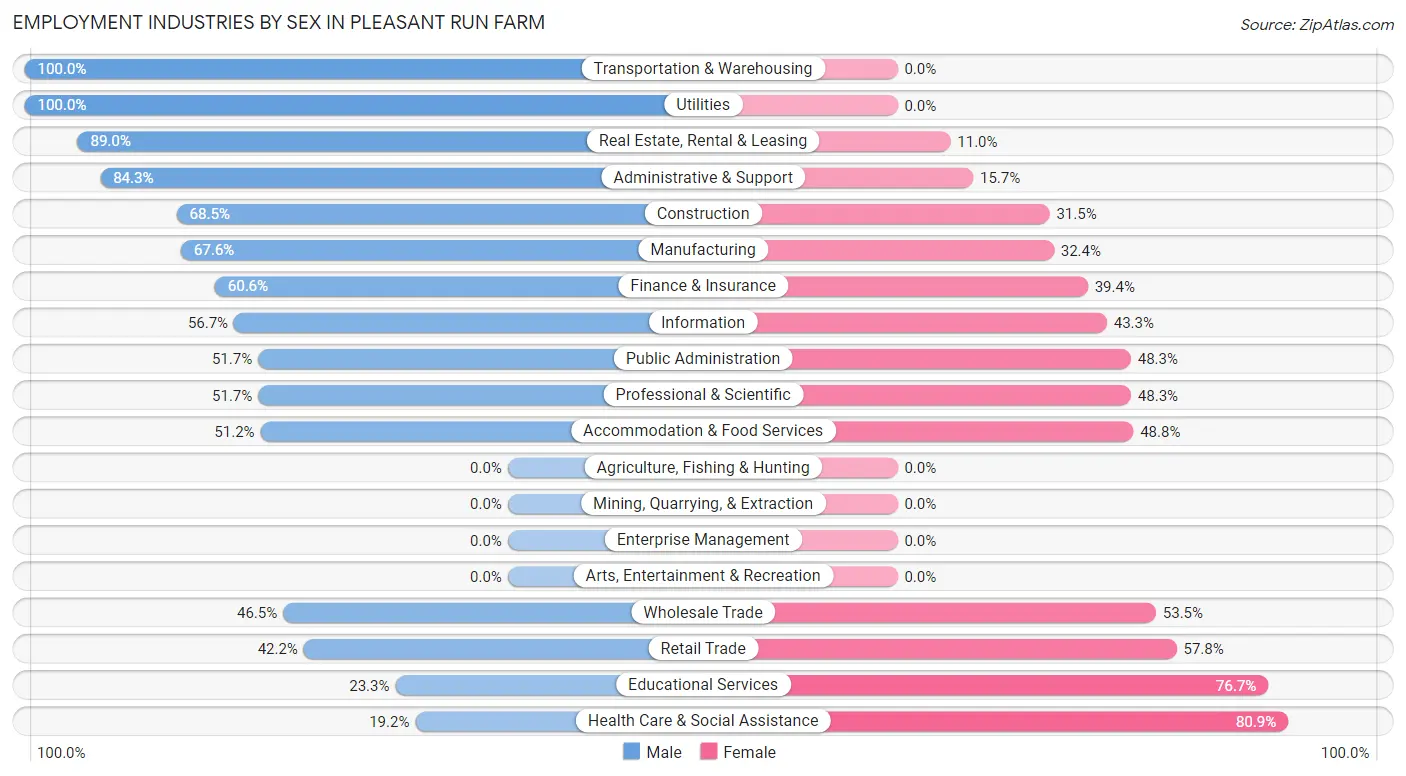
Employment Industries by Sex in Pleasant Run Farm
The Pleasant Run Farm industries that see more men than women are Transportation & Warehousing (100.0%), Utilities (100.0%), and Real Estate, Rental & Leasing (89.0%), whereas the industries that tend to have a higher number of women are Health Care & Social Assistance (80.8%), Educational Services (76.7%), and Retail Trade (57.8%).
| Industry | Male | Female |
| Agriculture, Fishing & Hunting | 0 (0.0%) | 0 (0.0%) |
| Mining, Quarrying, & Extraction | 0 (0.0%) | 0 (0.0%) |
| Construction | 37 (68.5%) | 17 (31.5%) |
| Manufacturing | 255 (67.6%) | 122 (32.4%) |
| Wholesale Trade | 20 (46.5%) | 23 (53.5%) |
| Retail Trade | 106 (42.2%) | 145 (57.8%) |
| Transportation & Warehousing | 25 (100.0%) | 0 (0.0%) |
| Utilities | 10 (100.0%) | 0 (0.0%) |
| Information | 17 (56.7%) | 13 (43.3%) |
| Finance & Insurance | 60 (60.6%) | 39 (39.4%) |
| Real Estate, Rental & Leasing | 65 (89.0%) | 8 (11.0%) |
| Professional & Scientific | 31 (51.7%) | 29 (48.3%) |
| Enterprise Management | 0 (0.0%) | 0 (0.0%) |
| Administrative & Support | 70 (84.3%) | 13 (15.7%) |
| Educational Services | 47 (23.3%) | 155 (76.7%) |
| Health Care & Social Assistance | 72 (19.2%) | 304 (80.8%) |
| Arts, Entertainment & Recreation | 0 (0.0%) | 0 (0.0%) |
| Accommodation & Food Services | 43 (51.2%) | 41 (48.8%) |
| Public Administration | 61 (51.7%) | 57 (48.3%) |
| Total | 931 (48.5%) | 987 (51.5%) |
Education in Pleasant Run Farm
School Enrollment in Pleasant Run Farm
The most common levels of schooling among the 1,001 students in Pleasant Run Farm are high school (339 | 33.9%), middle school (212 | 21.2%), and college / undergraduate (179 | 17.9%).
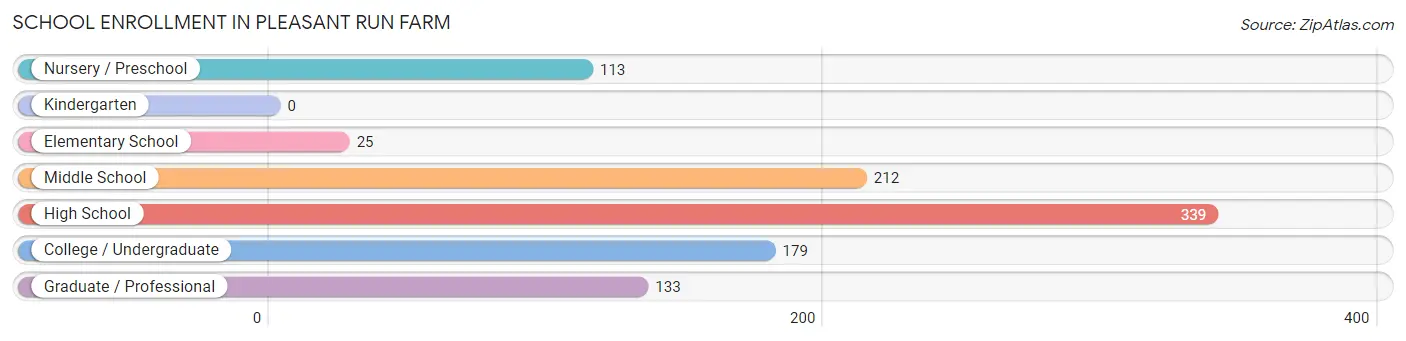
| School Level | # Students | % Students |
| Nursery / Preschool | 113 | 11.3% |
| Kindergarten | 0 | 0.0% |
| Elementary School | 25 | 2.5% |
| Middle School | 212 | 21.2% |
| High School | 339 | 33.9% |
| College / Undergraduate | 179 | 17.9% |
| Graduate / Professional | 133 | 13.3% |
| Total | 1,001 | 100.0% |
School Enrollment by Age by Funding Source in Pleasant Run Farm
Out of a total of 1,001 students who are enrolled in schools in Pleasant Run Farm, 302 (30.2%) attend a private institution, while the remaining 699 (69.8%) are enrolled in public schools. The age group of 25 to 34 year olds has the highest likelihood of being enrolled in private schools, with 81 (57.9% in the age bracket) enrolled. Conversely, the age group of 5 to 9 year old has the lowest likelihood of being enrolled in a private school, with 25 (100.0% in the age bracket) attending a public institution.
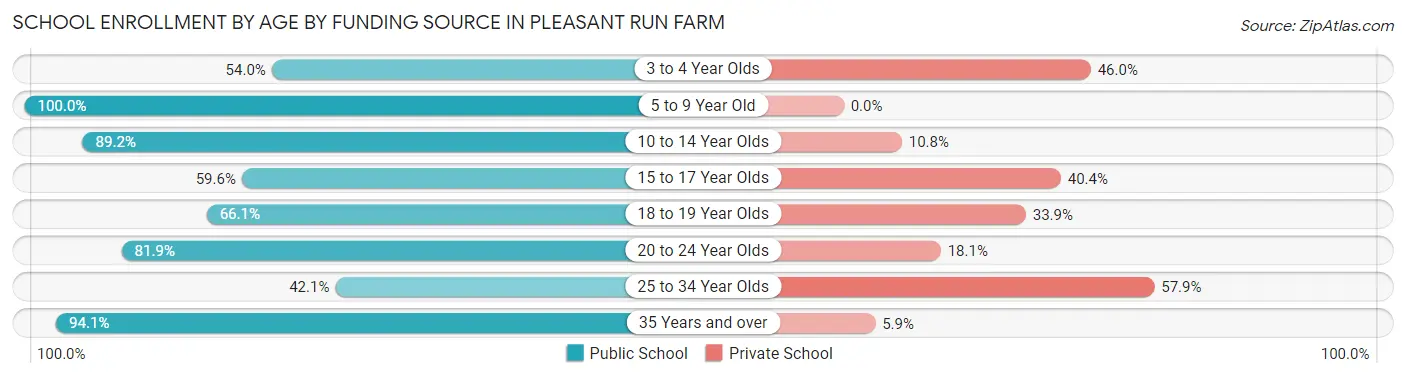
| Age Bracket | Public School | Private School |
| 3 to 4 Year Olds | 61 (54.0%) | 52 (46.0%) |
| 5 to 9 Year Old | 25 (100.0%) | 0 (0.0%) |
| 10 to 14 Year Olds | 206 (89.2%) | 25 (10.8%) |
| 15 to 17 Year Olds | 134 (59.6%) | 91 (40.4%) |
| 18 to 19 Year Olds | 37 (66.1%) | 19 (33.9%) |
| 20 to 24 Year Olds | 145 (81.9%) | 32 (18.1%) |
| 25 to 34 Year Olds | 59 (42.1%) | 81 (57.9%) |
| 35 Years and over | 32 (94.1%) | 2 (5.9%) |
| Total | 699 (69.8%) | 302 (30.2%) |
Educational Attainment by Field of Study in Pleasant Run Farm
Business (155 | 16.4%), education (131 | 13.9%), science & technology (115 | 12.2%), communications (92 | 9.7%), and bio, nature & agricultural (85 | 9.0%) are the most common fields of study among 946 individuals in Pleasant Run Farm who have obtained a bachelor's degree or higher.
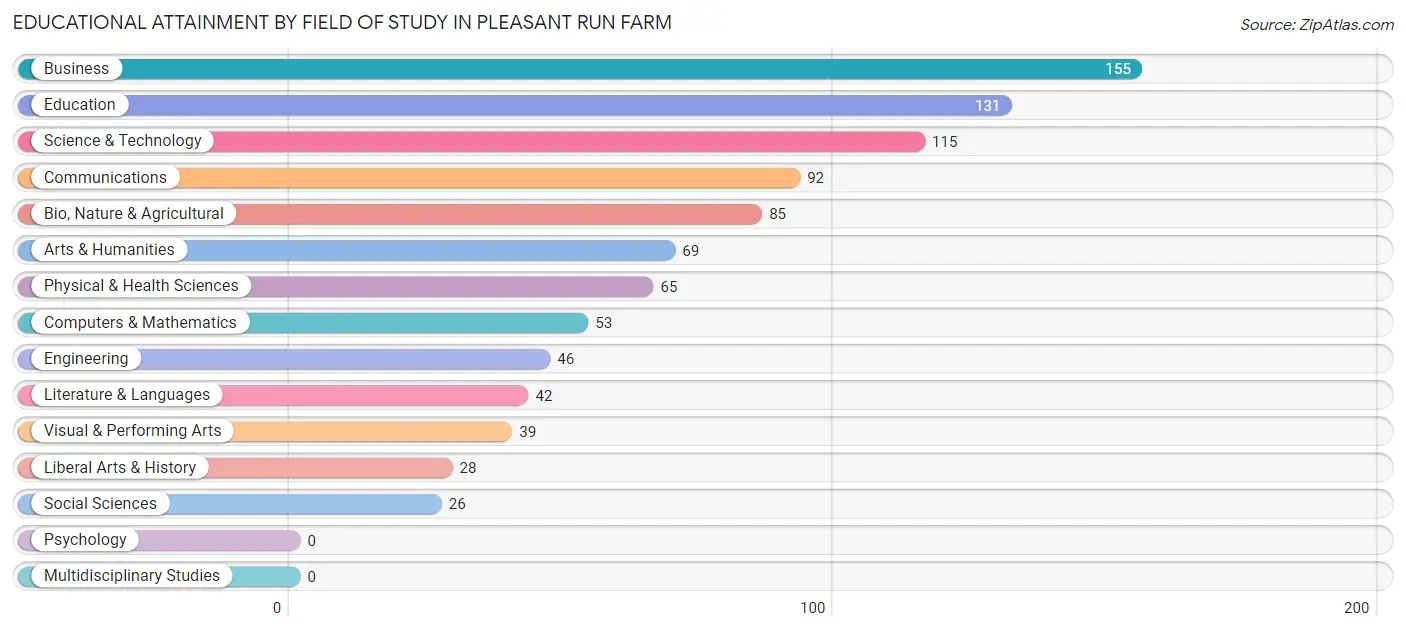
| Field of Study | # Graduates | % Graduates |
| Computers & Mathematics | 53 | 5.6% |
| Bio, Nature & Agricultural | 85 | 9.0% |
| Physical & Health Sciences | 65 | 6.9% |
| Psychology | 0 | 0.0% |
| Social Sciences | 26 | 2.8% |
| Engineering | 46 | 4.9% |
| Multidisciplinary Studies | 0 | 0.0% |
| Science & Technology | 115 | 12.2% |
| Business | 155 | 16.4% |
| Education | 131 | 13.9% |
| Literature & Languages | 42 | 4.4% |
| Liberal Arts & History | 28 | 3.0% |
| Visual & Performing Arts | 39 | 4.1% |
| Communications | 92 | 9.7% |
| Arts & Humanities | 69 | 7.3% |
| Total | 946 | 100.0% |
Transportation & Commute in Pleasant Run Farm
Vehicle Availability by Sex in Pleasant Run Farm
The most prevalent vehicle ownership categories in Pleasant Run Farm are males with 2 vehicles (385, accounting for 41.7%) and females with 2 vehicles (394, making up 39.0%).
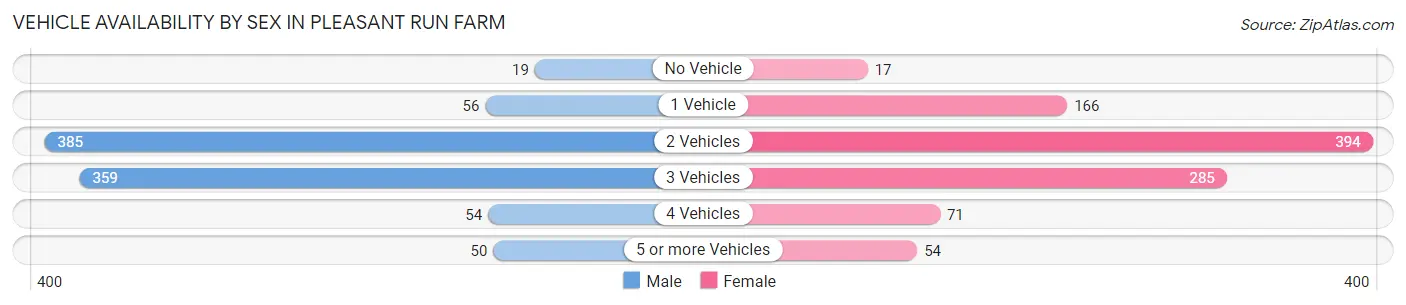
| Vehicles Available | Male | Female |
| No Vehicle | 19 (2.1%) | 17 (1.7%) |
| 1 Vehicle | 56 (6.1%) | 166 (16.8%) |
| 2 Vehicles | 385 (41.7%) | 394 (39.9%) |
| 3 Vehicles | 359 (38.9%) | 285 (28.9%) |
| 4 Vehicles | 54 (5.9%) | 71 (7.2%) |
| 5 or more Vehicles | 50 (5.4%) | 54 (5.5%) |
| Total | 923 (100.0%) | 987 (100.0%) |
Commute Time in Pleasant Run Farm
The most frequently occuring commute durations in Pleasant Run Farm are 30 to 34 minutes (399 commuters, 23.2%), 20 to 24 minutes (318 commuters, 18.5%), and 15 to 19 minutes (211 commuters, 12.3%).
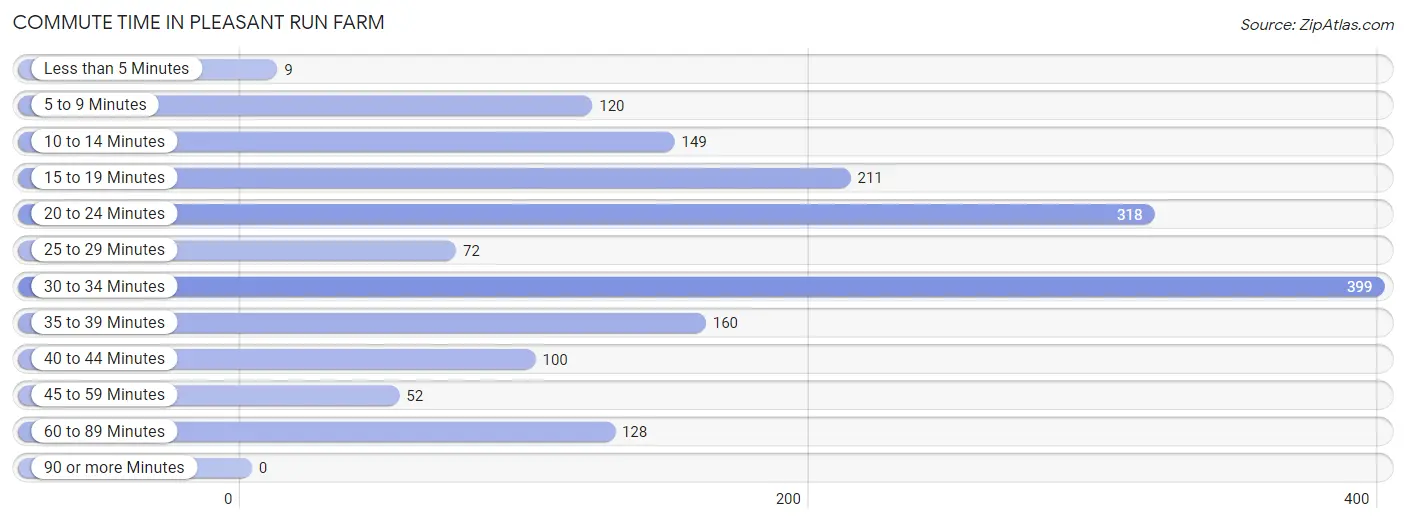
| Commute Time | # Commuters | % Commuters |
| Less than 5 Minutes | 9 | 0.5% |
| 5 to 9 Minutes | 120 | 7.0% |
| 10 to 14 Minutes | 149 | 8.7% |
| 15 to 19 Minutes | 211 | 12.3% |
| 20 to 24 Minutes | 318 | 18.5% |
| 25 to 29 Minutes | 72 | 4.2% |
| 30 to 34 Minutes | 399 | 23.2% |
| 35 to 39 Minutes | 160 | 9.3% |
| 40 to 44 Minutes | 100 | 5.8% |
| 45 to 59 Minutes | 52 | 3.0% |
| 60 to 89 Minutes | 128 | 7.4% |
| 90 or more Minutes | 0 | 0.0% |
Commute Time by Sex in Pleasant Run Farm
The most common commute times in Pleasant Run Farm are 30 to 34 minutes (241 commuters, 30.1%) for males and 20 to 24 minutes (185 commuters, 20.2%) for females.
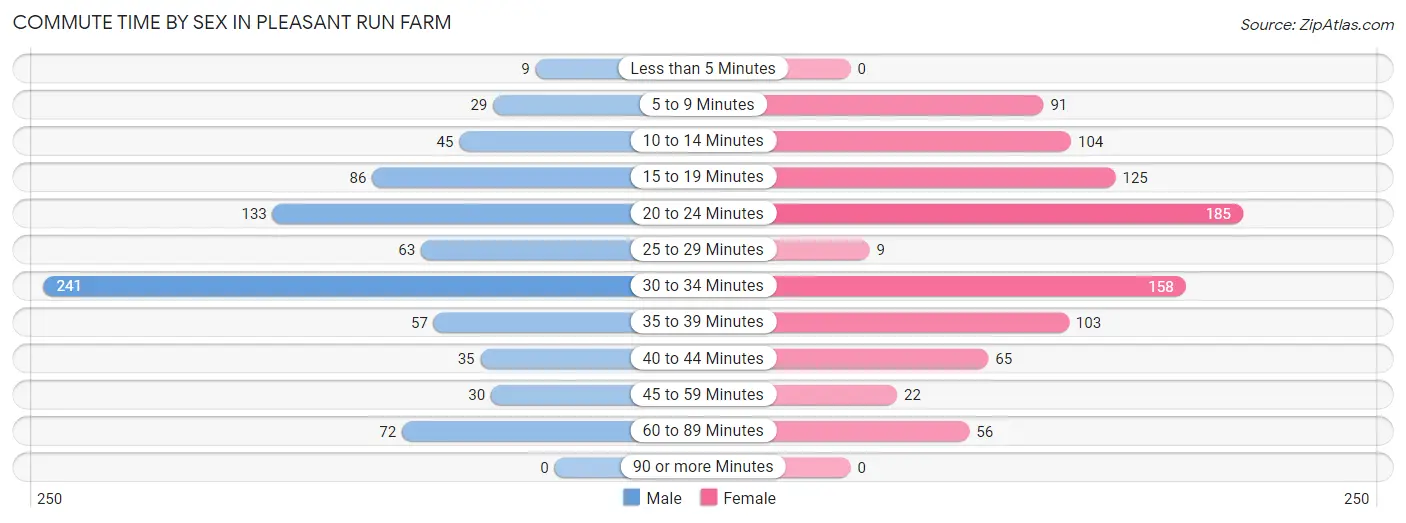
| Commute Time | Male | Female |
| Less than 5 Minutes | 9 (1.1%) | 0 (0.0%) |
| 5 to 9 Minutes | 29 (3.6%) | 91 (9.9%) |
| 10 to 14 Minutes | 45 (5.6%) | 104 (11.3%) |
| 15 to 19 Minutes | 86 (10.7%) | 125 (13.6%) |
| 20 to 24 Minutes | 133 (16.6%) | 185 (20.2%) |
| 25 to 29 Minutes | 63 (7.9%) | 9 (1.0%) |
| 30 to 34 Minutes | 241 (30.1%) | 158 (17.2%) |
| 35 to 39 Minutes | 57 (7.1%) | 103 (11.2%) |
| 40 to 44 Minutes | 35 (4.4%) | 65 (7.1%) |
| 45 to 59 Minutes | 30 (3.7%) | 22 (2.4%) |
| 60 to 89 Minutes | 72 (9.0%) | 56 (6.1%) |
| 90 or more Minutes | 0 (0.0%) | 0 (0.0%) |
Time of Departure to Work by Sex in Pleasant Run Farm
The most frequent times of departure to work in Pleasant Run Farm are 12:00 AM to 4:59 AM (179, 22.4%) for males and 7:30 AM to 7:59 AM (254, 27.7%) for females.
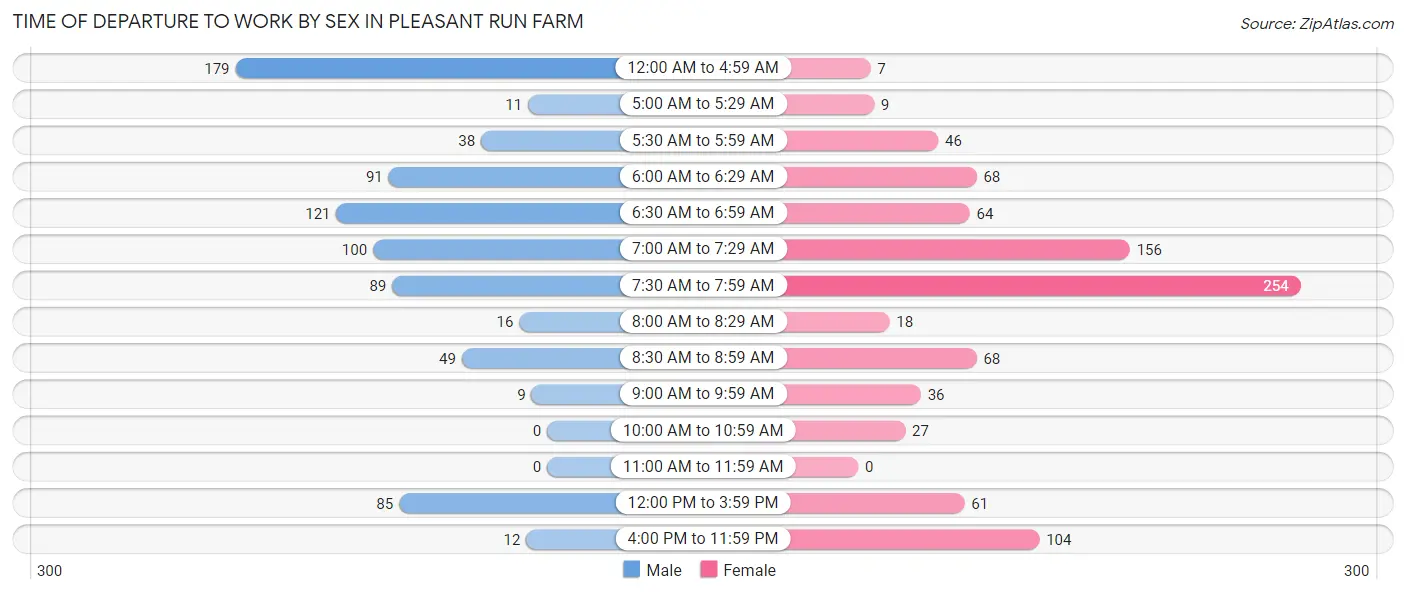
| Time of Departure | Male | Female |
| 12:00 AM to 4:59 AM | 179 (22.4%) | 7 (0.8%) |
| 5:00 AM to 5:29 AM | 11 (1.4%) | 9 (1.0%) |
| 5:30 AM to 5:59 AM | 38 (4.8%) | 46 (5.0%) |
| 6:00 AM to 6:29 AM | 91 (11.4%) | 68 (7.4%) |
| 6:30 AM to 6:59 AM | 121 (15.1%) | 64 (7.0%) |
| 7:00 AM to 7:29 AM | 100 (12.5%) | 156 (17.0%) |
| 7:30 AM to 7:59 AM | 89 (11.1%) | 254 (27.7%) |
| 8:00 AM to 8:29 AM | 16 (2.0%) | 18 (2.0%) |
| 8:30 AM to 8:59 AM | 49 (6.1%) | 68 (7.4%) |
| 9:00 AM to 9:59 AM | 9 (1.1%) | 36 (3.9%) |
| 10:00 AM to 10:59 AM | 0 (0.0%) | 27 (2.9%) |
| 11:00 AM to 11:59 AM | 0 (0.0%) | 0 (0.0%) |
| 12:00 PM to 3:59 PM | 85 (10.6%) | 61 (6.6%) |
| 4:00 PM to 11:59 PM | 12 (1.5%) | 104 (11.3%) |
| Total | 800 (100.0%) | 918 (100.0%) |
Housing Occupancy in Pleasant Run Farm
Occupancy by Ownership in Pleasant Run Farm
Of the total 1,505 dwellings in Pleasant Run Farm, owner-occupied units account for 1,246 (82.8%), while renter-occupied units make up 259 (17.2%).
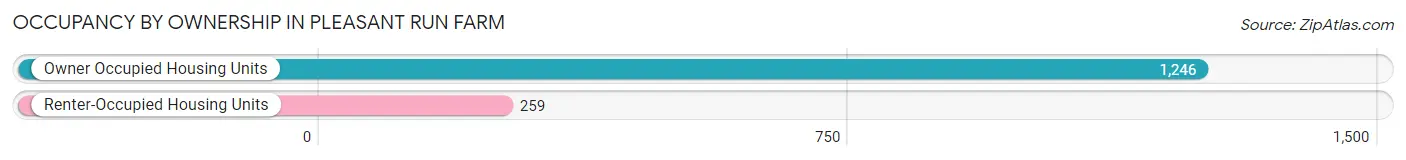
| Occupancy | # Housing Units | % Housing Units |
| Owner Occupied Housing Units | 1,246 | 82.8% |
| Renter-Occupied Housing Units | 259 | 17.2% |
| Total Occupied Housing Units | 1,505 | 100.0% |
Occupancy by Household Size in Pleasant Run Farm
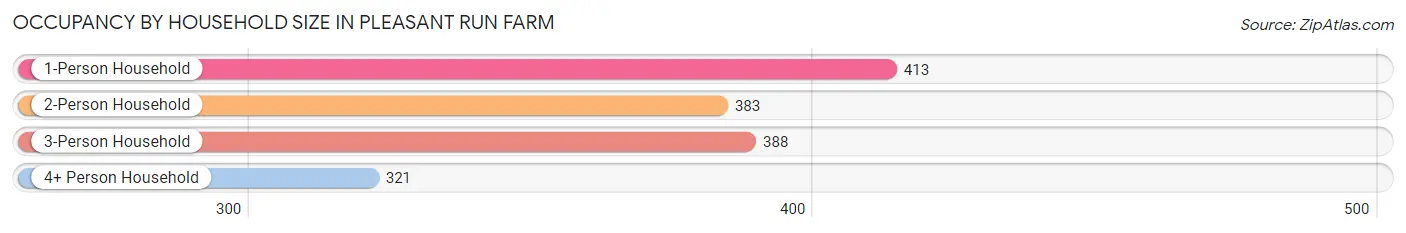
| Household Size | # Housing Units | % Housing Units |
| 1-Person Household | 413 | 27.4% |
| 2-Person Household | 383 | 25.5% |
| 3-Person Household | 388 | 25.8% |
| 4+ Person Household | 321 | 21.3% |
| Total Housing Units | 1,505 | 100.0% |
Occupancy by Ownership by Household Size in Pleasant Run Farm
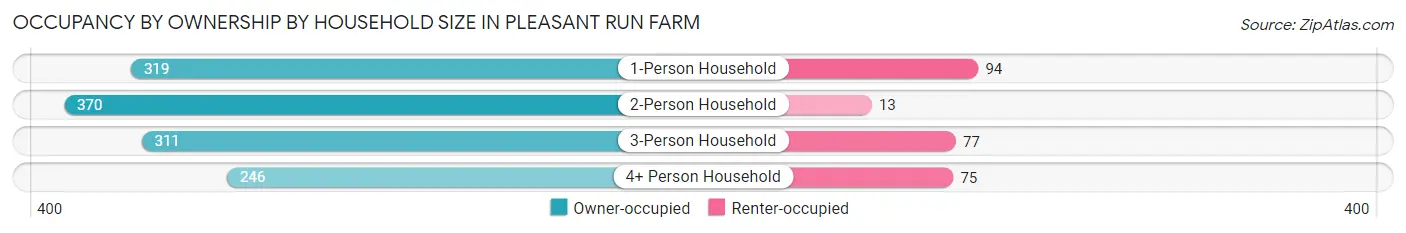
| Household Size | Owner-occupied | Renter-occupied |
| 1-Person Household | 319 (77.2%) | 94 (22.8%) |
| 2-Person Household | 370 (96.6%) | 13 (3.4%) |
| 3-Person Household | 311 (80.1%) | 77 (19.9%) |
| 4+ Person Household | 246 (76.6%) | 75 (23.4%) |
| Total Housing Units | 1,246 (82.8%) | 259 (17.2%) |
Occupancy by Educational Attainment in Pleasant Run Farm
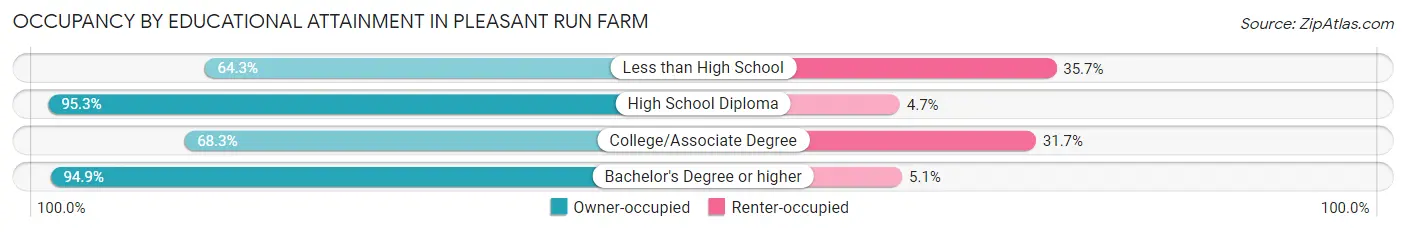
| Household Size | Owner-occupied | Renter-occupied |
| Less than High School | 18 (64.3%) | 10 (35.7%) |
| High School Diploma | 244 (95.3%) | 12 (4.7%) |
| College/Associate Degree | 449 (68.3%) | 208 (31.7%) |
| Bachelor's Degree or higher | 535 (94.9%) | 29 (5.1%) |
Occupancy by Age of Householder in Pleasant Run Farm
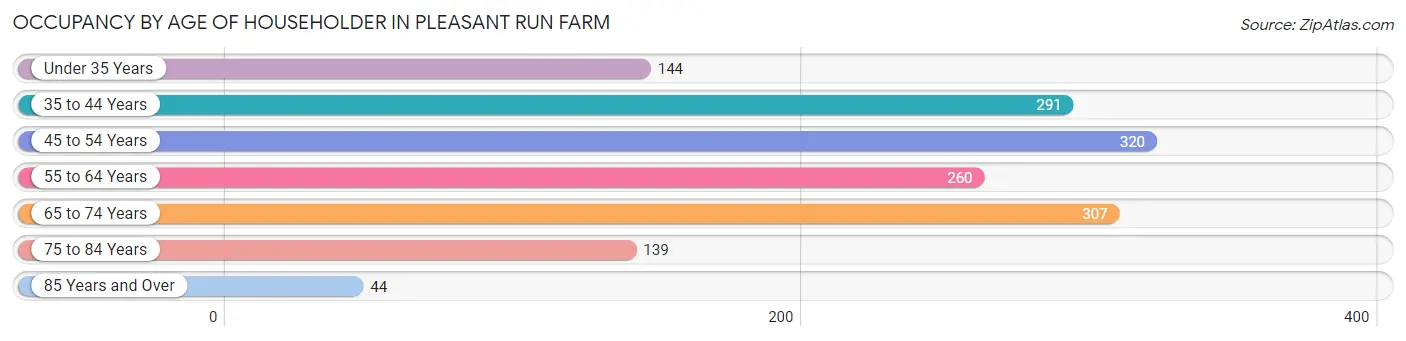
| Age Bracket | # Households | % Households |
| Under 35 Years | 144 | 9.6% |
| 35 to 44 Years | 291 | 19.3% |
| 45 to 54 Years | 320 | 21.3% |
| 55 to 64 Years | 260 | 17.3% |
| 65 to 74 Years | 307 | 20.4% |
| 75 to 84 Years | 139 | 9.2% |
| 85 Years and Over | 44 | 2.9% |
| Total | 1,505 | 100.0% |
Housing Finances in Pleasant Run Farm
Median Income by Occupancy in Pleasant Run Farm
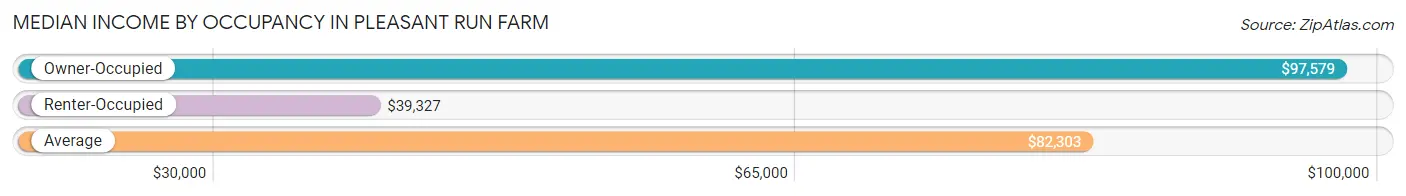
| Occupancy Type | # Households | Median Income |
| Owner-Occupied | 1,246 (82.8%) | $97,579 |
| Renter-Occupied | 259 (17.2%) | $39,327 |
| Average | 1,505 (100.0%) | $82,303 |
Occupancy by Householder Income Bracket in Pleasant Run Farm
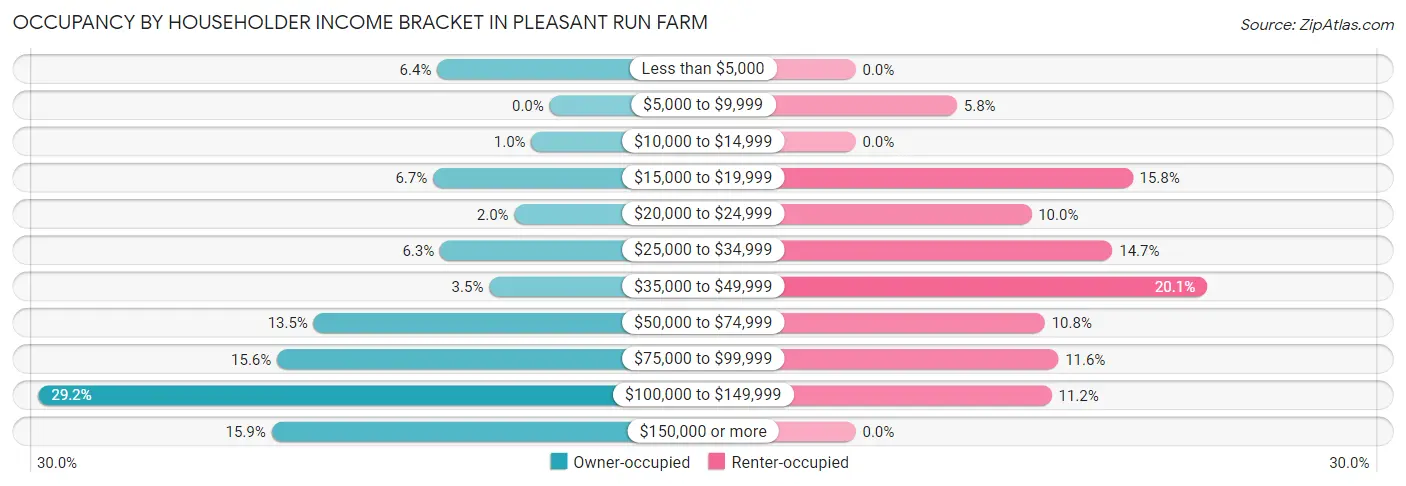
| Income Bracket | Owner-occupied | Renter-occupied |
| Less than $5,000 | 80 (6.4%) | 0 (0.0%) |
| $5,000 to $9,999 | 0 (0.0%) | 15 (5.8%) |
| $10,000 to $14,999 | 13 (1.0%) | 0 (0.0%) |
| $15,000 to $19,999 | 83 (6.7%) | 41 (15.8%) |
| $20,000 to $24,999 | 25 (2.0%) | 26 (10.0%) |
| $25,000 to $34,999 | 78 (6.3%) | 38 (14.7%) |
| $35,000 to $49,999 | 43 (3.5%) | 52 (20.1%) |
| $50,000 to $74,999 | 168 (13.5%) | 28 (10.8%) |
| $75,000 to $99,999 | 194 (15.6%) | 30 (11.6%) |
| $100,000 to $149,999 | 364 (29.2%) | 29 (11.2%) |
| $150,000 or more | 198 (15.9%) | 0 (0.0%) |
| Total | 1,246 (100.0%) | 259 (100.0%) |
Monthly Housing Cost Tiers in Pleasant Run Farm
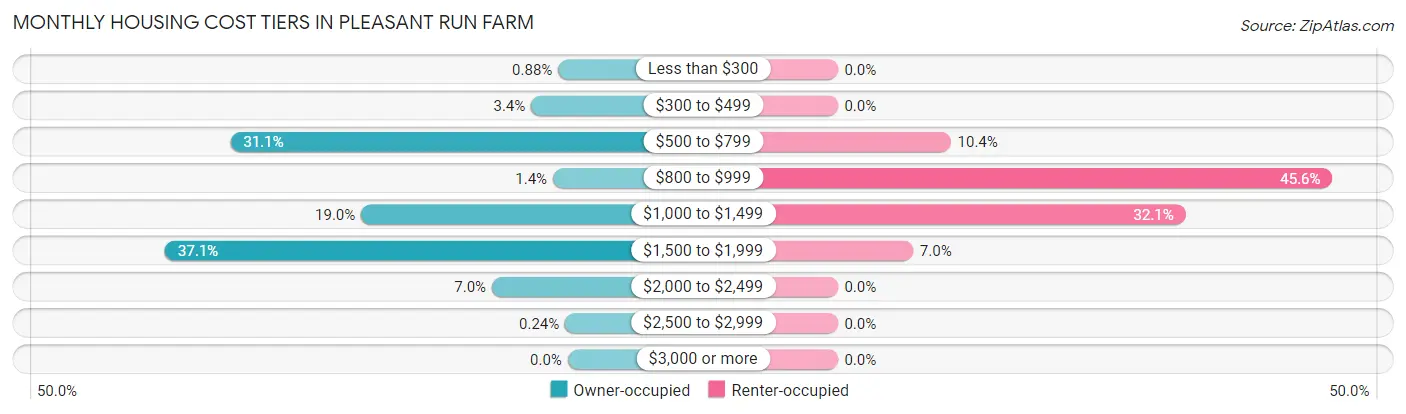
| Monthly Cost | Owner-occupied | Renter-occupied |
| Less than $300 | 11 (0.9%) | 0 (0.0%) |
| $300 to $499 | 42 (3.4%) | 0 (0.0%) |
| $500 to $799 | 387 (31.1%) | 27 (10.4%) |
| $800 to $999 | 17 (1.4%) | 118 (45.6%) |
| $1,000 to $1,499 | 237 (19.0%) | 83 (32.1%) |
| $1,500 to $1,999 | 462 (37.1%) | 18 (7.0%) |
| $2,000 to $2,499 | 87 (7.0%) | 0 (0.0%) |
| $2,500 to $2,999 | 3 (0.2%) | 0 (0.0%) |
| $3,000 or more | 0 (0.0%) | 0 (0.0%) |
| Total | 1,246 (100.0%) | 259 (100.0%) |
Physical Housing Characteristics in Pleasant Run Farm
Housing Structures in Pleasant Run Farm
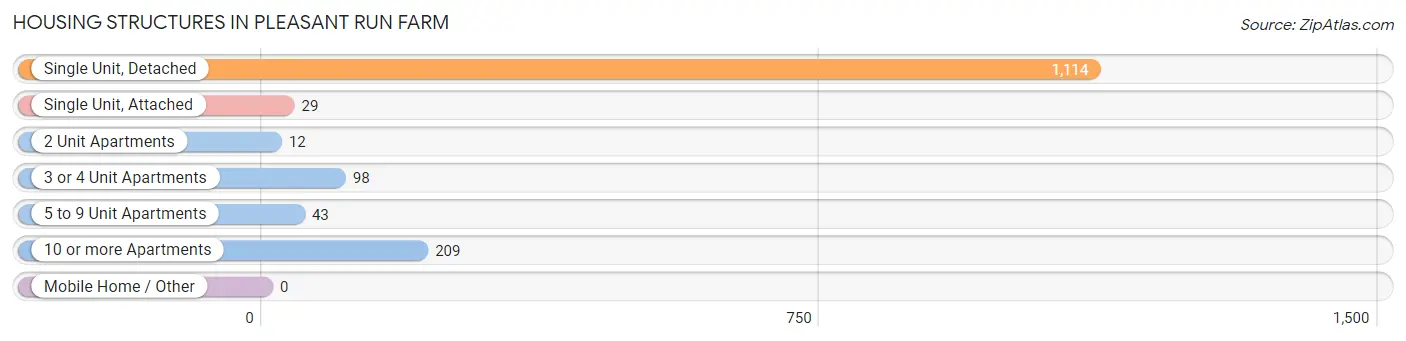
| Structure Type | # Housing Units | % Housing Units |
| Single Unit, Detached | 1,114 | 74.0% |
| Single Unit, Attached | 29 | 1.9% |
| 2 Unit Apartments | 12 | 0.8% |
| 3 or 4 Unit Apartments | 98 | 6.5% |
| 5 to 9 Unit Apartments | 43 | 2.9% |
| 10 or more Apartments | 209 | 13.9% |
| Mobile Home / Other | 0 | 0.0% |
| Total | 1,505 | 100.0% |
Housing Structures by Occupancy in Pleasant Run Farm
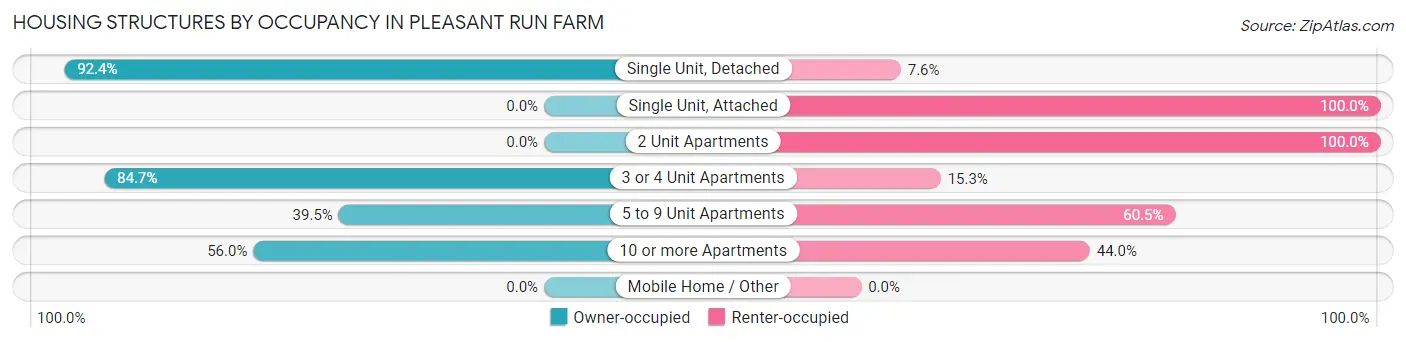
| Structure Type | Owner-occupied | Renter-occupied |
| Single Unit, Detached | 1,029 (92.4%) | 85 (7.6%) |
| Single Unit, Attached | 0 (0.0%) | 29 (100.0%) |
| 2 Unit Apartments | 0 (0.0%) | 12 (100.0%) |
| 3 or 4 Unit Apartments | 83 (84.7%) | 15 (15.3%) |
| 5 to 9 Unit Apartments | 17 (39.5%) | 26 (60.5%) |
| 10 or more Apartments | 117 (56.0%) | 92 (44.0%) |
| Mobile Home / Other | 0 (0.0%) | 0 (0.0%) |
| Total | 1,246 (82.8%) | 259 (17.2%) |
Housing Structures by Number of Rooms in Pleasant Run Farm
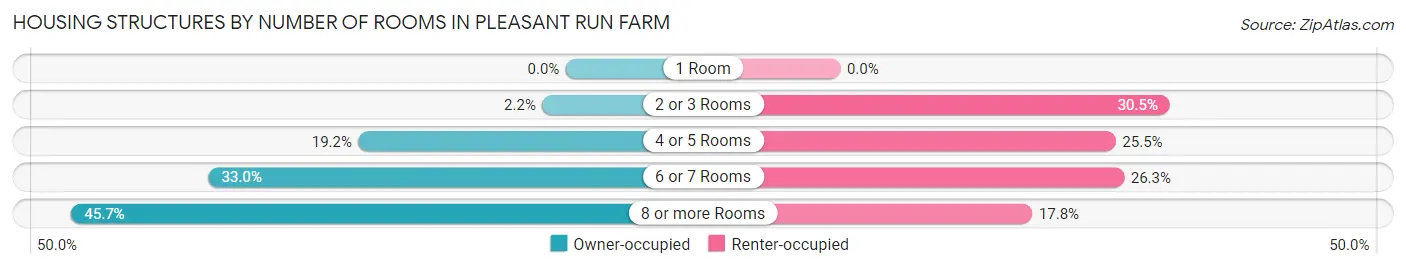
| Number of Rooms | Owner-occupied | Renter-occupied |
| 1 Room | 0 (0.0%) | 0 (0.0%) |
| 2 or 3 Rooms | 27 (2.2%) | 79 (30.5%) |
| 4 or 5 Rooms | 239 (19.2%) | 66 (25.5%) |
| 6 or 7 Rooms | 411 (33.0%) | 68 (26.3%) |
| 8 or more Rooms | 569 (45.7%) | 46 (17.8%) |
| Total | 1,246 (100.0%) | 259 (100.0%) |
Housing Structure by Heating Type in Pleasant Run Farm
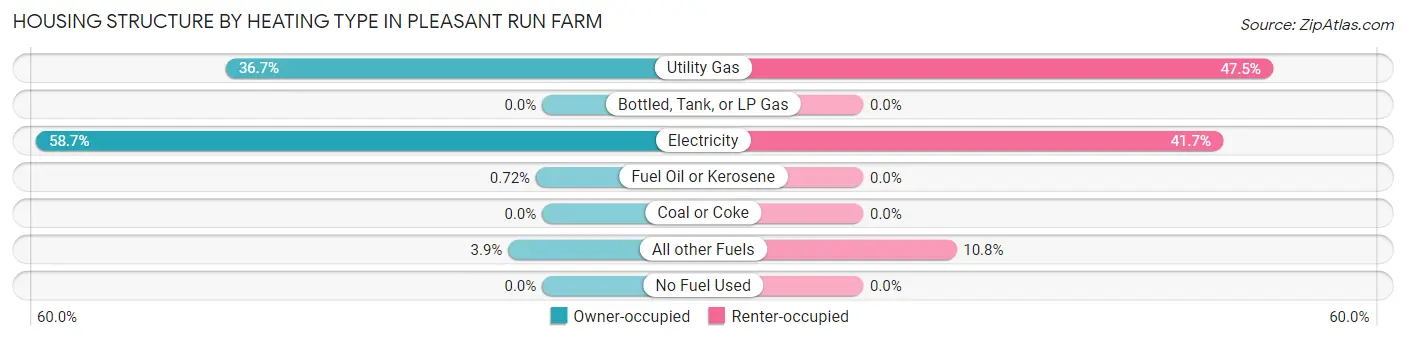
| Heating Type | Owner-occupied | Renter-occupied |
| Utility Gas | 457 (36.7%) | 123 (47.5%) |
| Bottled, Tank, or LP Gas | 0 (0.0%) | 0 (0.0%) |
| Electricity | 731 (58.7%) | 108 (41.7%) |
| Fuel Oil or Kerosene | 9 (0.7%) | 0 (0.0%) |
| Coal or Coke | 0 (0.0%) | 0 (0.0%) |
| All other Fuels | 49 (3.9%) | 28 (10.8%) |
| No Fuel Used | 0 (0.0%) | 0 (0.0%) |
| Total | 1,246 (100.0%) | 259 (100.0%) |
Household Vehicle Usage in Pleasant Run Farm
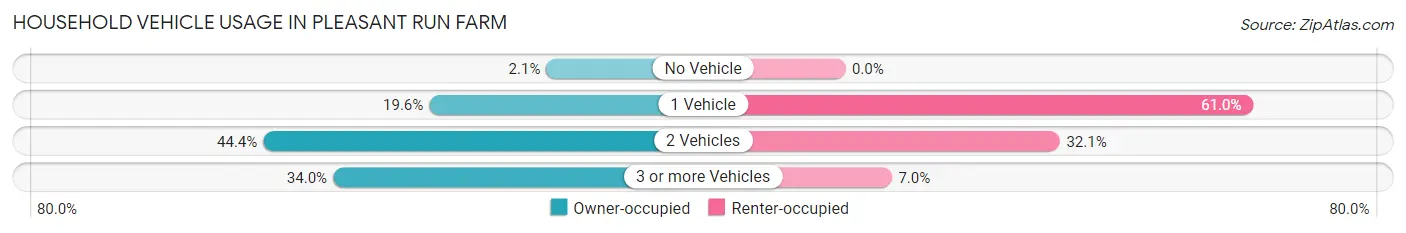
| Vehicles per Household | Owner-occupied | Renter-occupied |
| No Vehicle | 26 (2.1%) | 0 (0.0%) |
| 1 Vehicle | 244 (19.6%) | 158 (61.0%) |
| 2 Vehicles | 553 (44.4%) | 83 (32.1%) |
| 3 or more Vehicles | 423 (34.0%) | 18 (7.0%) |
| Total | 1,246 (100.0%) | 259 (100.0%) |
Real Estate & Mortgages in Pleasant Run Farm
Real Estate and Mortgage Overview in Pleasant Run Farm
| Characteristic | Without Mortgage | With Mortgage |
| Housing Units | 367 | 879 |
| Median Property Value | $150,600 | $203,000 |
| Median Household Income | $68,284 | $150 |
| Monthly Housing Costs | $562 | $0 |
| Real Estate Taxes | $2,777 | $28 |
Property Value by Mortgage Status in Pleasant Run Farm
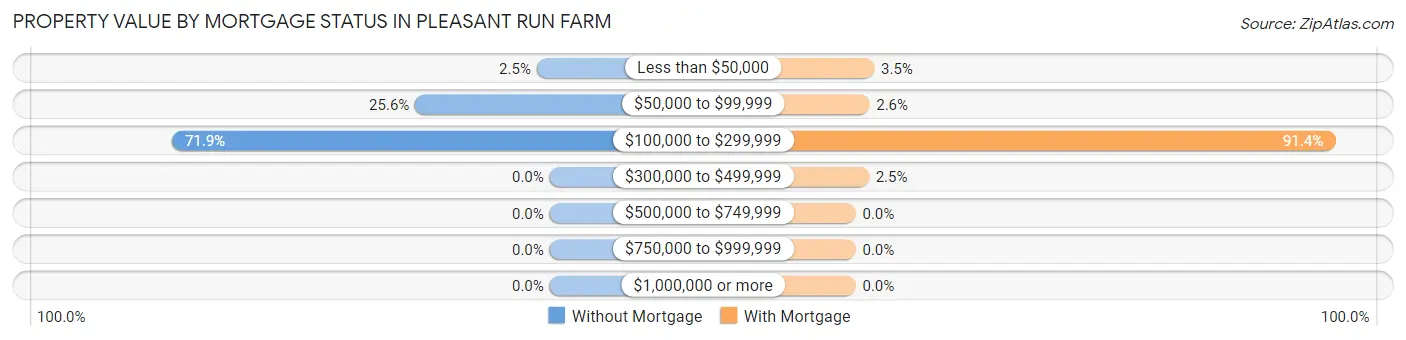
| Property Value | Without Mortgage | With Mortgage |
| Less than $50,000 | 9 (2.5%) | 31 (3.5%) |
| $50,000 to $99,999 | 94 (25.6%) | 23 (2.6%) |
| $100,000 to $299,999 | 264 (71.9%) | 803 (91.3%) |
| $300,000 to $499,999 | 0 (0.0%) | 22 (2.5%) |
| $500,000 to $749,999 | 0 (0.0%) | 0 (0.0%) |
| $750,000 to $999,999 | 0 (0.0%) | 0 (0.0%) |
| $1,000,000 or more | 0 (0.0%) | 0 (0.0%) |
| Total | 367 (100.0%) | 879 (100.0%) |
Household Income by Mortgage Status in Pleasant Run Farm
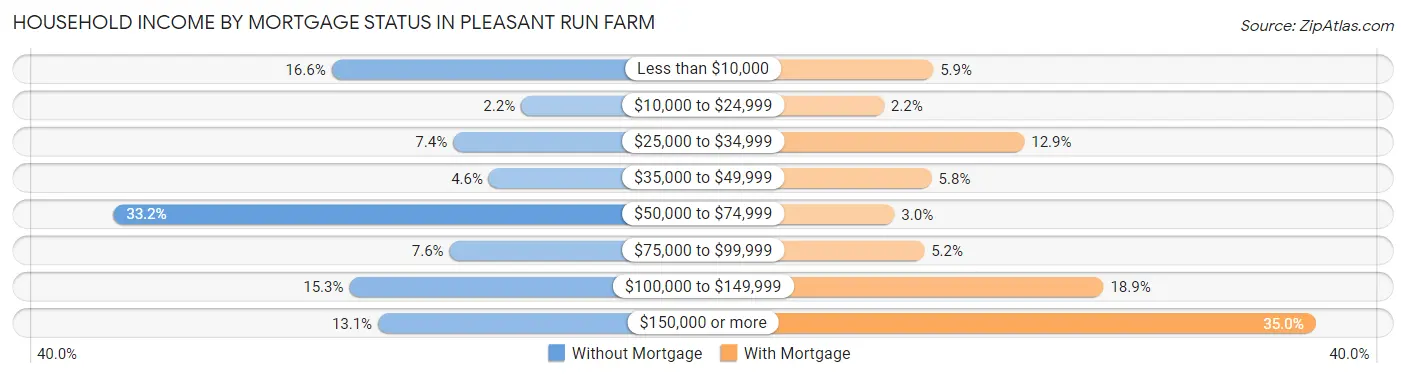
| Household Income | Without Mortgage | With Mortgage |
| Less than $10,000 | 61 (16.6%) | 52 (5.9%) |
| $10,000 to $24,999 | 8 (2.2%) | 19 (2.2%) |
| $25,000 to $34,999 | 27 (7.4%) | 113 (12.9%) |
| $35,000 to $49,999 | 17 (4.6%) | 51 (5.8%) |
| $50,000 to $74,999 | 122 (33.2%) | 26 (3.0%) |
| $75,000 to $99,999 | 28 (7.6%) | 46 (5.2%) |
| $100,000 to $149,999 | 56 (15.3%) | 166 (18.9%) |
| $150,000 or more | 48 (13.1%) | 308 (35.0%) |
| Total | 367 (100.0%) | 879 (100.0%) |
Property Value to Household Income Ratio in Pleasant Run Farm
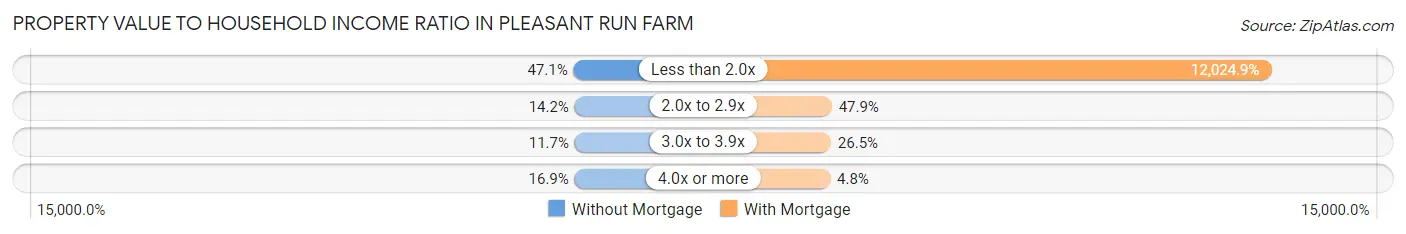
| Value-to-Income Ratio | Without Mortgage | With Mortgage |
| Less than 2.0x | 173 (47.1%) | 105,699 (12,024.9%) |
| 2.0x to 2.9x | 52 (14.2%) | 421 (47.9%) |
| 3.0x to 3.9x | 43 (11.7%) | 233 (26.5%) |
| 4.0x or more | 62 (16.9%) | 42 (4.8%) |
| Total | 367 (100.0%) | 879 (100.0%) |
Real Estate Taxes by Mortgage Status in Pleasant Run Farm
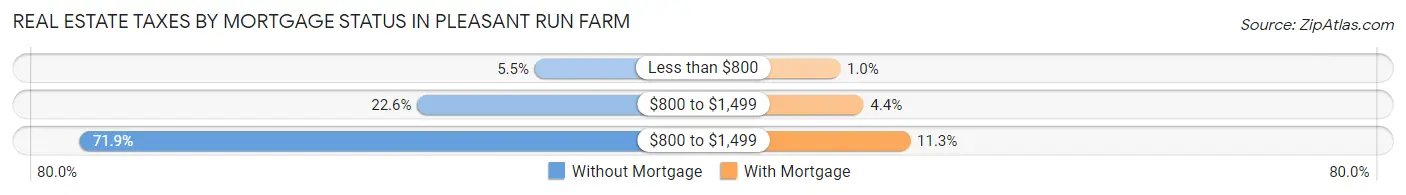
| Property Taxes | Without Mortgage | With Mortgage |
| Less than $800 | 20 (5.4%) | 9 (1.0%) |
| $800 to $1,499 | 83 (22.6%) | 39 (4.4%) |
| $800 to $1,499 | 264 (71.9%) | 99 (11.3%) |
| Total | 367 (100.0%) | 879 (100.0%) |
Health & Disability in Pleasant Run Farm
Health Insurance Coverage by Age in Pleasant Run Farm
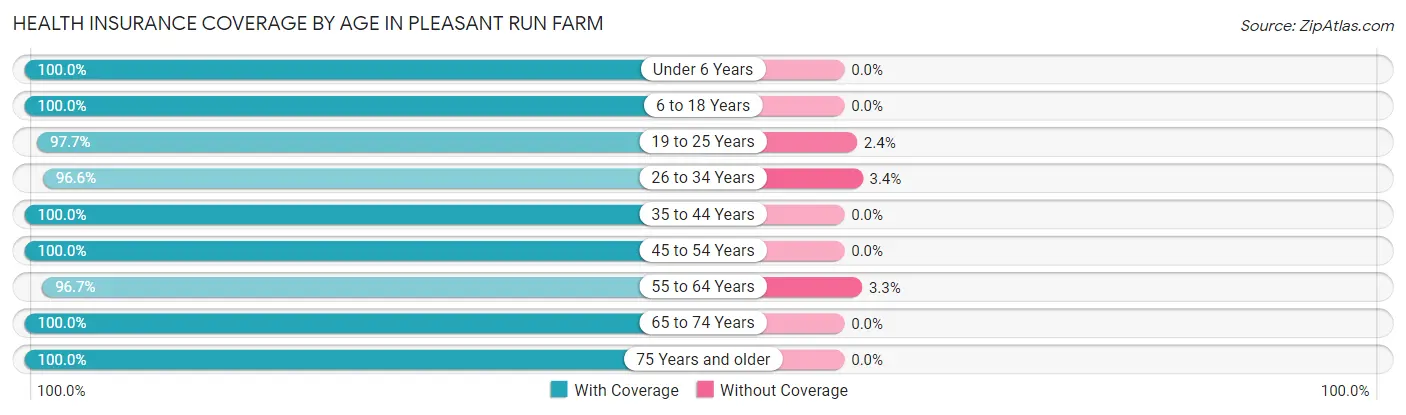
| Age Bracket | With Coverage | Without Coverage |
| Under 6 Years | 407 (100.0%) | 0 (0.0%) |
| 6 to 18 Years | 524 (100.0%) | 0 (0.0%) |
| 19 to 25 Years | 374 (97.7%) | 9 (2.4%) |
| 26 to 34 Years | 313 (96.6%) | 11 (3.4%) |
| 35 to 44 Years | 455 (100.0%) | 0 (0.0%) |
| 45 to 54 Years | 606 (100.0%) | 0 (0.0%) |
| 55 to 64 Years | 411 (96.7%) | 14 (3.3%) |
| 65 to 74 Years | 526 (100.0%) | 0 (0.0%) |
| 75 Years and older | 261 (100.0%) | 0 (0.0%) |
| Total | 3,877 (99.1%) | 34 (0.9%) |
Health Insurance Coverage by Citizenship Status in Pleasant Run Farm
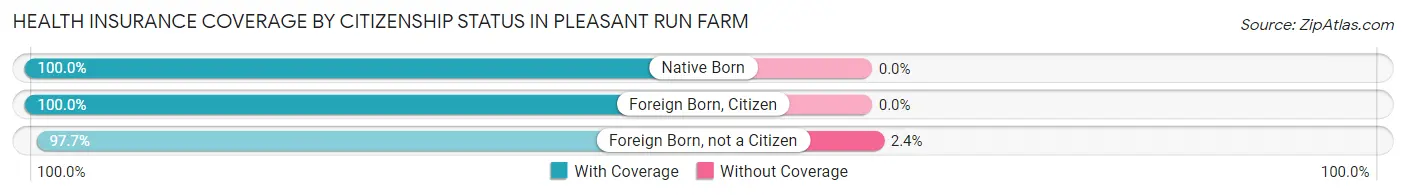
| Citizenship Status | With Coverage | Without Coverage |
| Native Born | 407 (100.0%) | 0 (0.0%) |
| Foreign Born, Citizen | 524 (100.0%) | 0 (0.0%) |
| Foreign Born, not a Citizen | 374 (97.7%) | 9 (2.4%) |
Health Insurance Coverage by Household Income in Pleasant Run Farm
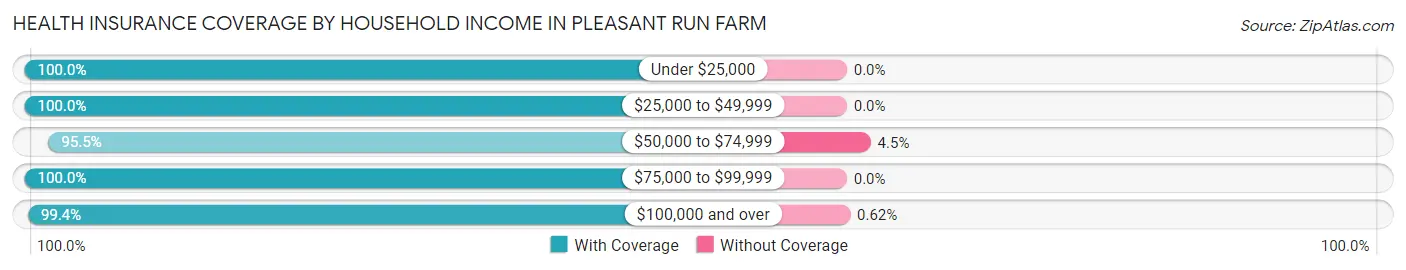
| Household Income | With Coverage | Without Coverage |
| Under $25,000 | 611 (100.0%) | 0 (0.0%) |
| $25,000 to $49,999 | 341 (100.0%) | 0 (0.0%) |
| $50,000 to $74,999 | 491 (95.5%) | 23 (4.5%) |
| $75,000 to $99,999 | 661 (100.0%) | 0 (0.0%) |
| $100,000 and over | 1,773 (99.4%) | 11 (0.6%) |
Public vs Private Health Insurance Coverage by Age in Pleasant Run Farm
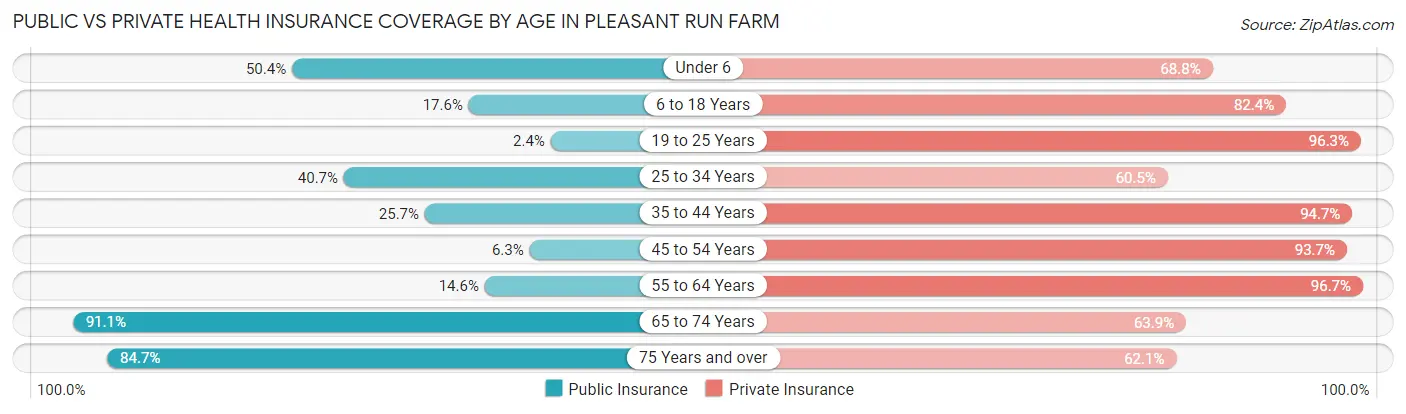
| Age Bracket | Public Insurance | Private Insurance |
| Under 6 | 205 (50.4%) | 280 (68.8%) |
| 6 to 18 Years | 92 (17.6%) | 432 (82.4%) |
| 19 to 25 Years | 9 (2.4%) | 369 (96.3%) |
| 25 to 34 Years | 132 (40.7%) | 196 (60.5%) |
| 35 to 44 Years | 117 (25.7%) | 431 (94.7%) |
| 45 to 54 Years | 38 (6.3%) | 568 (93.7%) |
| 55 to 64 Years | 62 (14.6%) | 411 (96.7%) |
| 65 to 74 Years | 479 (91.1%) | 336 (63.9%) |
| 75 Years and over | 221 (84.7%) | 162 (62.1%) |
| Total | 1,355 (34.6%) | 3,185 (81.4%) |
Disability Status by Sex by Age in Pleasant Run Farm
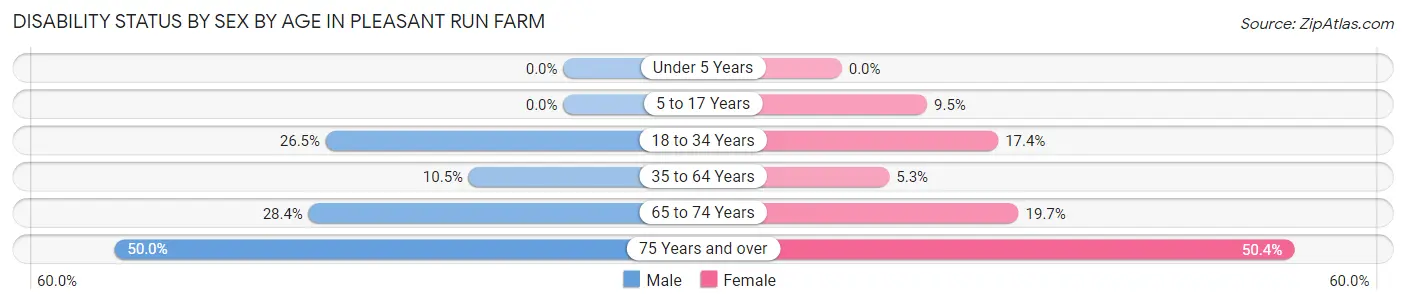
| Age Bracket | Male | Female |
| Under 5 Years | 0 (0.0%) | 0 (0.0%) |
| 5 to 17 Years | 0 (0.0%) | 21 (9.5%) |
| 18 to 34 Years | 105 (26.5%) | 54 (17.4%) |
| 35 to 64 Years | 75 (10.5%) | 41 (5.3%) |
| 65 to 74 Years | 57 (28.4%) | 64 (19.7%) |
| 75 Years and over | 62 (50.0%) | 69 (50.4%) |
Disability Class by Sex by Age in Pleasant Run Farm
Disability Class: Hearing Difficulty
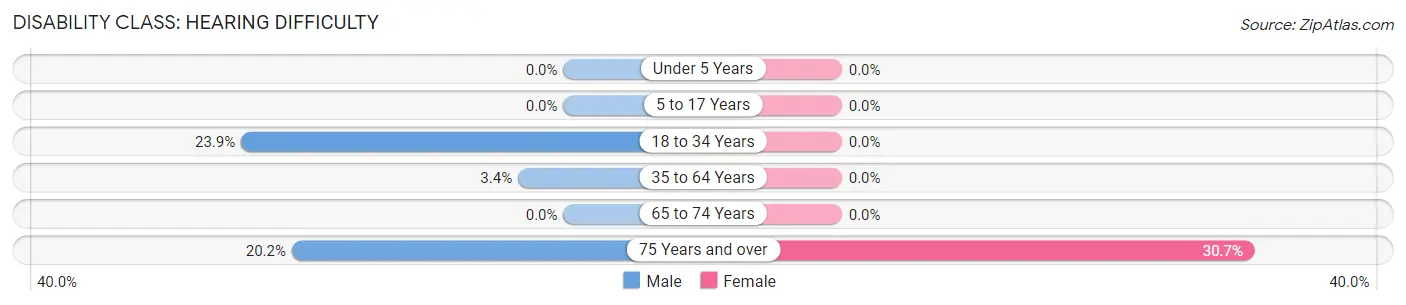
| Age Bracket | Male | Female |
| Under 5 Years | 0 (0.0%) | 0 (0.0%) |
| 5 to 17 Years | 0 (0.0%) | 0 (0.0%) |
| 18 to 34 Years | 95 (23.9%) | 0 (0.0%) |
| 35 to 64 Years | 24 (3.4%) | 0 (0.0%) |
| 65 to 74 Years | 0 (0.0%) | 0 (0.0%) |
| 75 Years and over | 25 (20.2%) | 42 (30.7%) |
Disability Class: Vision Difficulty
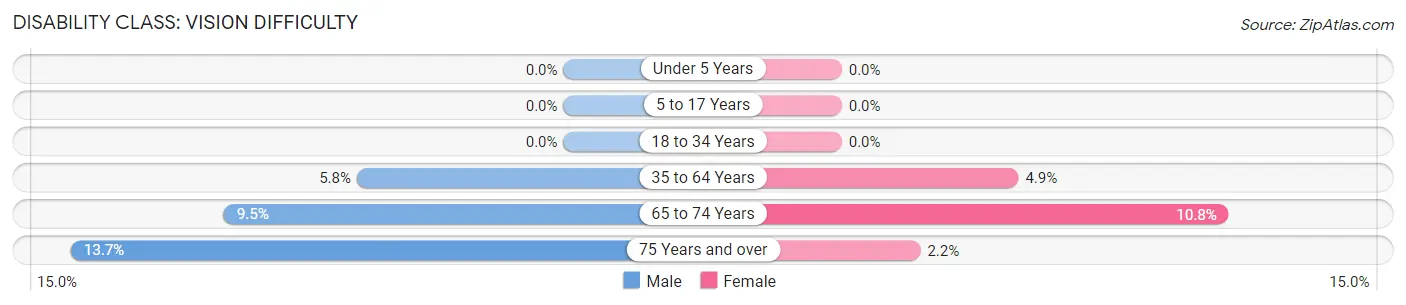
| Age Bracket | Male | Female |
| Under 5 Years | 0 (0.0%) | 0 (0.0%) |
| 5 to 17 Years | 0 (0.0%) | 0 (0.0%) |
| 18 to 34 Years | 0 (0.0%) | 0 (0.0%) |
| 35 to 64 Years | 41 (5.8%) | 38 (4.9%) |
| 65 to 74 Years | 19 (9.5%) | 35 (10.8%) |
| 75 Years and over | 17 (13.7%) | 3 (2.2%) |
Disability Class: Cognitive Difficulty
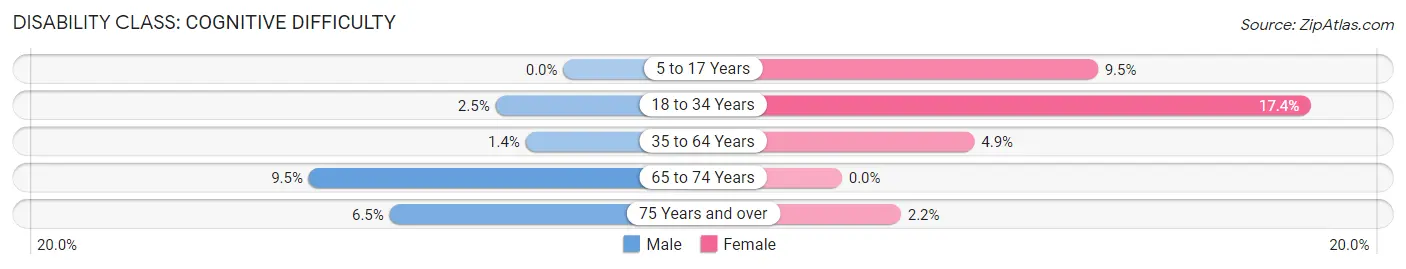
| Age Bracket | Male | Female |
| 5 to 17 Years | 0 (0.0%) | 21 (9.5%) |
| 18 to 34 Years | 10 (2.5%) | 54 (17.4%) |
| 35 to 64 Years | 10 (1.4%) | 38 (4.9%) |
| 65 to 74 Years | 19 (9.5%) | 0 (0.0%) |
| 75 Years and over | 8 (6.5%) | 3 (2.2%) |
Disability Class: Ambulatory Difficulty
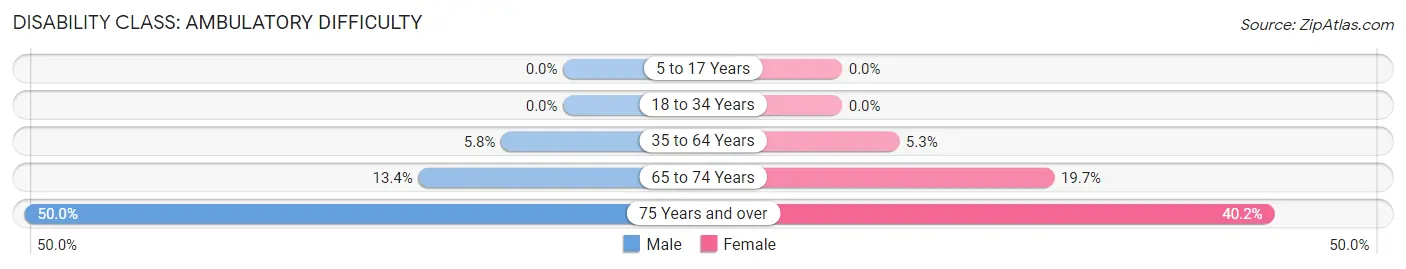
| Age Bracket | Male | Female |
| 5 to 17 Years | 0 (0.0%) | 0 (0.0%) |
| 18 to 34 Years | 0 (0.0%) | 0 (0.0%) |
| 35 to 64 Years | 41 (5.8%) | 41 (5.3%) |
| 65 to 74 Years | 27 (13.4%) | 64 (19.7%) |
| 75 Years and over | 62 (50.0%) | 55 (40.2%) |
Disability Class: Self-Care Difficulty
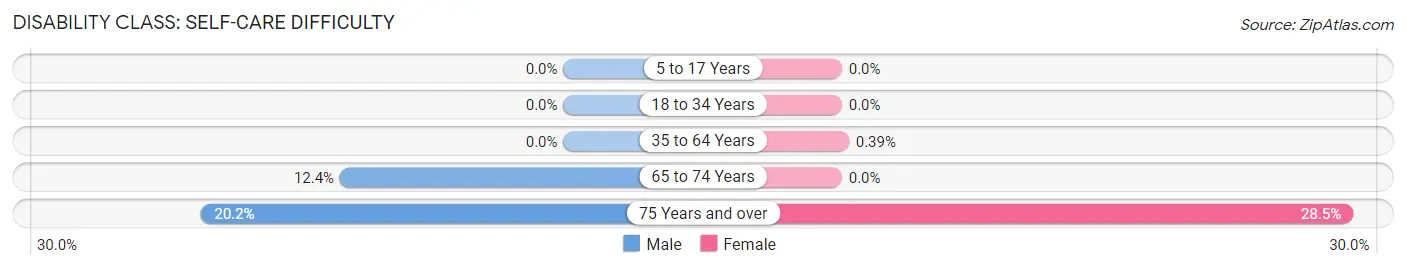
| Age Bracket | Male | Female |
| 5 to 17 Years | 0 (0.0%) | 0 (0.0%) |
| 18 to 34 Years | 0 (0.0%) | 0 (0.0%) |
| 35 to 64 Years | 0 (0.0%) | 3 (0.4%) |
| 65 to 74 Years | 25 (12.4%) | 0 (0.0%) |
| 75 Years and over | 25 (20.2%) | 39 (28.5%) |
Technology Access in Pleasant Run Farm
Computing Device Access in Pleasant Run Farm
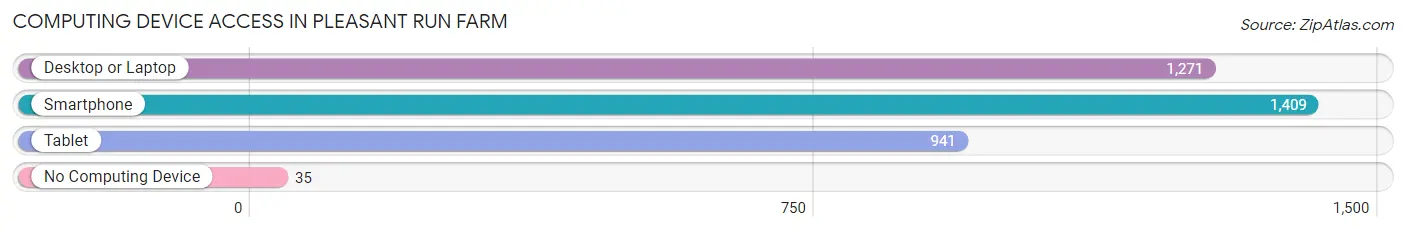
| Device Type | # Households | % Households |
| Desktop or Laptop | 1,271 | 84.5% |
| Smartphone | 1,409 | 93.6% |
| Tablet | 941 | 62.5% |
| No Computing Device | 35 | 2.3% |
| Total | 1,505 | 100.0% |
Internet Access in Pleasant Run Farm
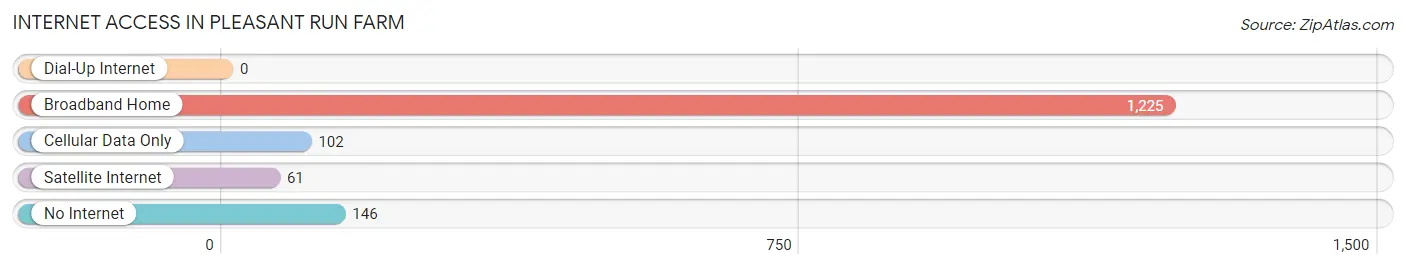
| Internet Type | # Households | % Households |
| Dial-Up Internet | 0 | 0.0% |
| Broadband Home | 1,225 | 81.4% |
| Cellular Data Only | 102 | 6.8% |
| Satellite Internet | 61 | 4.1% |
| No Internet | 146 | 9.7% |
| Total | 1,505 | 100.0% |
Pleasant Run Farm Summary
Pleasant Run Farm is a small unincorporated community located in Hamilton County, Ohio. It is situated in the southeastern corner of the county, just north of the city of Cincinnati. The community is bordered by the townships of Sycamore, Anderson, and Colerain. The population of Pleasant Run Farm was estimated to be 1,845 in 2019.
History
Pleasant Run Farm was first settled in the early 1800s by German immigrants. The community was originally known as “Pleasant Run” and was named after the nearby creek. The creek was named after the pleasant sound of the water running over the rocks. The community was later renamed “Pleasant Run Farm” when the area became known for its agricultural production.
The community was home to a variety of businesses, including a general store, a blacksmith shop, a sawmill, and a gristmill. The community also had a post office, which was established in 1845.
In the late 1800s, the community began to decline as the railroad bypassed the area. The post office closed in 1902 and the businesses began to move away. The population of Pleasant Run Farm decreased significantly over the next few decades.
Geography
Pleasant Run Farm is located in the southeastern corner of Hamilton County, Ohio. It is situated just north of the city of Cincinnati. The community is bordered by the townships of Sycamore, Anderson, and Colerain.
The terrain of Pleasant Run Farm is mostly flat, with some rolling hills. The area is mostly rural, with some residential and commercial development. The community is located near the Little Miami River and is surrounded by farmland.
Economy
The economy of Pleasant Run Farm is largely based on agriculture. The area is home to several farms, which produce a variety of crops, including corn, soybeans, wheat, and hay. The community is also home to several small businesses, including a gas station, a convenience store, and a restaurant.
Demographics
The population of Pleasant Run Farm was estimated to be 1,845 in 2019. The population is mostly white (94.3%), with a small percentage of African Americans (2.3%) and Hispanics (2.2%). The median household income is $50,945, and the median home value is $179,400.
Conclusion
Pleasant Run Farm is a small unincorporated community located in Hamilton County, Ohio. It is situated in the southeastern corner of the county, just north of the city of Cincinnati. The community is bordered by the townships of Sycamore, Anderson, and Colerain. The population of Pleasant Run Farm was estimated to be 1,845 in 2019. The economy of Pleasant Run Farm is largely based on agriculture, and the population is mostly white. The median household income is $50,945, and the median home value is $179,400.
Common Questions
What is Per Capita Income in Pleasant Run Farm?
Per Capita income in Pleasant Run Farm is $33,719.
What is the Median Family Income in Pleasant Run Farm?
Median Family Income in Pleasant Run Farm is $95,577.
What is the Median Household income in Pleasant Run Farm?
Median Household Income in Pleasant Run Farm is $82,303.
What is Income or Wage Gap in Pleasant Run Farm?
Income or Wage Gap in Pleasant Run Farm is 8.3%.
Women in Pleasant Run Farm earn 91.7 cents for every dollar earned by a man.
What is Inequality or Gini Index in Pleasant Run Farm?
Inequality or Gini Index in Pleasant Run Farm is 0.38.
What is the Total Population of Pleasant Run Farm?
Total Population of Pleasant Run Farm is 4,016.
What is the Total Male Population of Pleasant Run Farm?
Total Male Population of Pleasant Run Farm is 2,028.
What is the Total Female Population of Pleasant Run Farm?
Total Female Population of Pleasant Run Farm is 1,988.
What is the Ratio of Males per 100 Females in Pleasant Run Farm?
There are 102.01 Males per 100 Females in Pleasant Run Farm.
What is the Ratio of Females per 100 Males in Pleasant Run Farm?
There are 98.03 Females per 100 Males in Pleasant Run Farm.
What is the Median Population Age in Pleasant Run Farm?
Median Population Age in Pleasant Run Farm is 43.0 Years.
What is the Average Family Size in Pleasant Run Farm
Average Family Size in Pleasant Run Farm is 3.2 People.
What is the Average Household Size in Pleasant Run Farm
Average Household Size in Pleasant Run Farm is 2.6 People.
How Large is the Labor Force in Pleasant Run Farm?
There are 1,932 People in the Labor Forcein in Pleasant Run Farm.
What is the Percentage of People in the Labor Force in Pleasant Run Farm?
60.3% of People are in the Labor Force in Pleasant Run Farm.
What is the Unemployment Rate in Pleasant Run Farm?
Unemployment Rate in Pleasant Run Farm is 0.7%.