Lake Mohawk, OH Map & Demographics
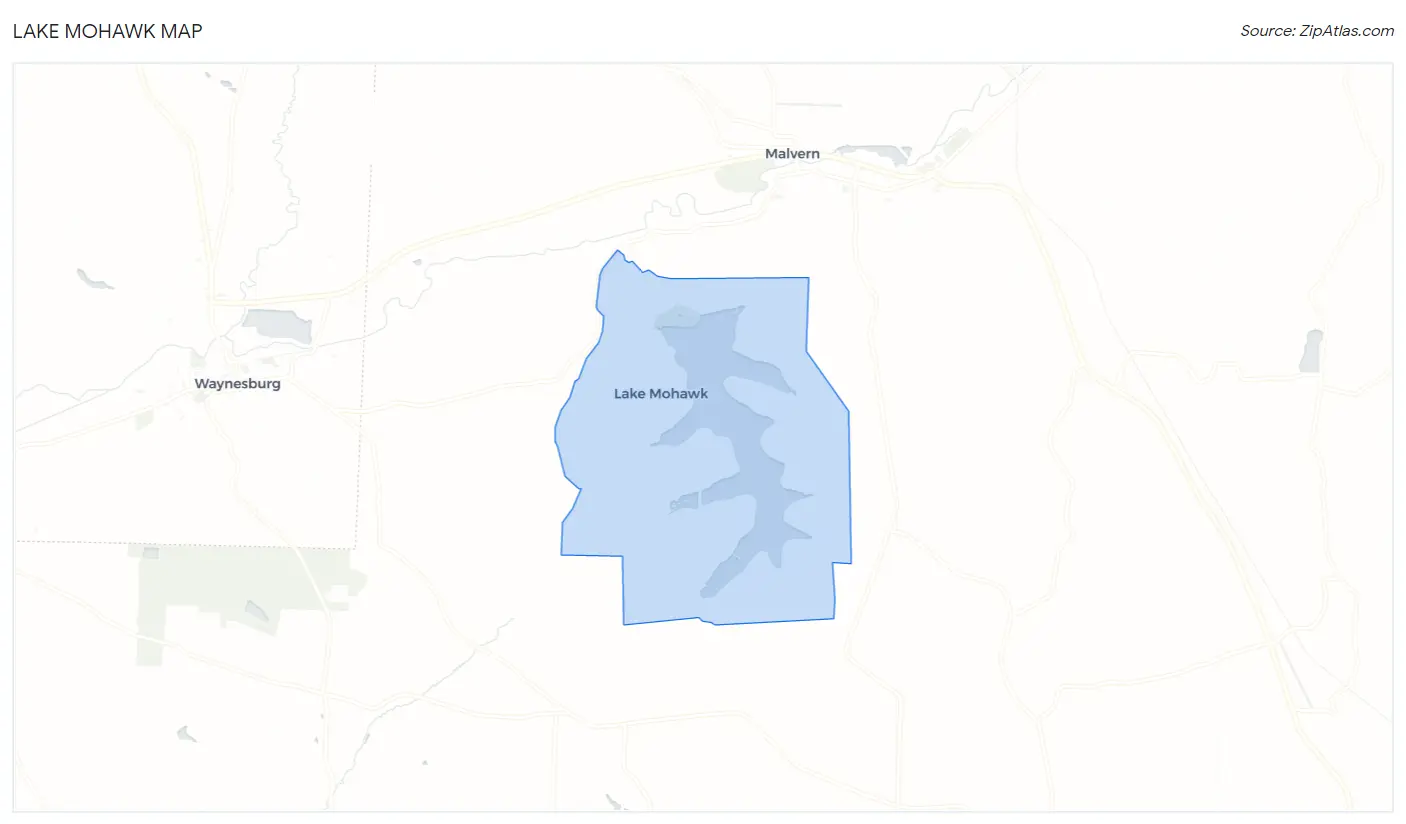
Lake Mohawk Map
Lake Mohawk Overview
$50,087
PER CAPITA INCOME
$101,726
AVG FAMILY INCOME
$84,514
AVG HOUSEHOLD INCOME
0.39
INEQUALITY / GINI INDEX
1,474
TOTAL POPULATION
698
MALE POPULATION
776
FEMALE POPULATION
89.95
MALES / 100 FEMALES
111.17
FEMALES / 100 MALES
61.4
MEDIAN AGE
2.5
AVG FAMILY SIZE
2.1
AVG HOUSEHOLD SIZE
687
LABOR FORCE [ PEOPLE ]
53.0%
PERCENT IN LABOR FORCE
Income in Lake Mohawk
Income Overview in Lake Mohawk
Per Capita Income in Lake Mohawk is $50,087, while median incomes of families and households are $101,726 and $84,514 respectively.
| Characteristic | Number | Measure |
| Per Capita Income | 1,474 | $50,087 |
| Median Family Income | 483 | $101,726 |
| Mean Family Income | 483 | $133,058 |
| Median Household Income | 715 | $84,514 |
| Mean Household Income | 715 | $105,071 |
| Income Deficit | 483 | $0 |
| Wage / Income Gap (%) | 1,474 | 0.00% |
| Wage / Income Gap ($) | 1,474 | 100.00¢ per $1 |
| Gini / Inequality Index | 1,474 | 0.39 |
Earnings by Sex in Lake Mohawk
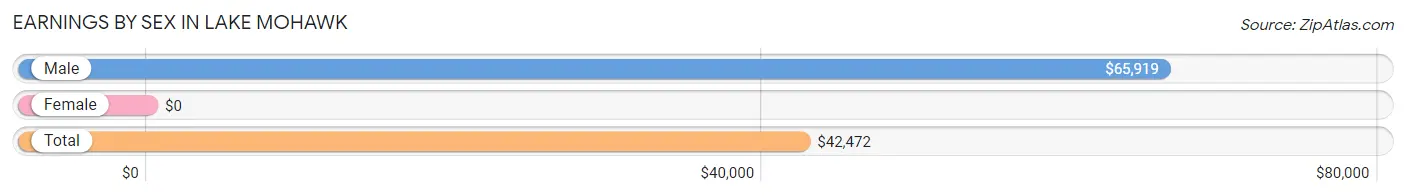
| Sex | Number | Average Earnings |
| Male | 463 (60.2%) | $65,919 |
| Female | 306 (39.8%) | $0 |
| Total | 769 (100.0%) | $42,472 |
Earnings by Sex by Income Bracket in Lake Mohawk
The most common earnings brackets in Lake Mohawk are $100,000+ for men (133 | 28.7%) and $40,000 to $44,999 for women (74 | 24.2%).
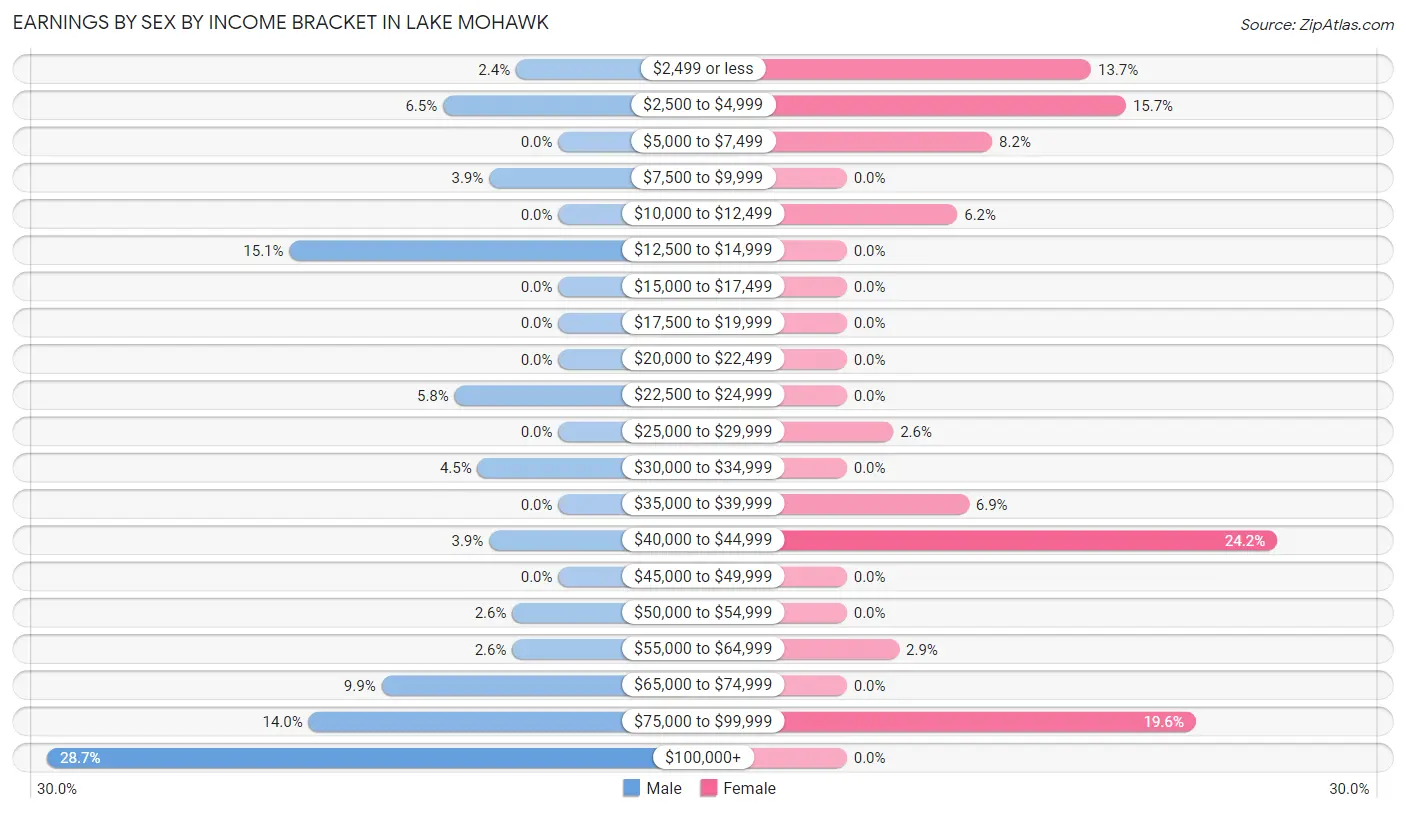
| Income | Male | Female |
| $2,499 or less | 11 (2.4%) | 42 (13.7%) |
| $2,500 to $4,999 | 30 (6.5%) | 48 (15.7%) |
| $5,000 to $7,499 | 0 (0.0%) | 25 (8.2%) |
| $7,500 to $9,999 | 18 (3.9%) | 0 (0.0%) |
| $10,000 to $12,499 | 0 (0.0%) | 19 (6.2%) |
| $12,500 to $14,999 | 70 (15.1%) | 0 (0.0%) |
| $15,000 to $17,499 | 0 (0.0%) | 0 (0.0%) |
| $17,500 to $19,999 | 0 (0.0%) | 0 (0.0%) |
| $20,000 to $22,499 | 0 (0.0%) | 0 (0.0%) |
| $22,500 to $24,999 | 27 (5.8%) | 0 (0.0%) |
| $25,000 to $29,999 | 0 (0.0%) | 8 (2.6%) |
| $30,000 to $34,999 | 21 (4.5%) | 0 (0.0%) |
| $35,000 to $39,999 | 0 (0.0%) | 21 (6.9%) |
| $40,000 to $44,999 | 18 (3.9%) | 74 (24.2%) |
| $45,000 to $49,999 | 0 (0.0%) | 0 (0.0%) |
| $50,000 to $54,999 | 12 (2.6%) | 0 (0.0%) |
| $55,000 to $64,999 | 12 (2.6%) | 9 (2.9%) |
| $65,000 to $74,999 | 46 (9.9%) | 0 (0.0%) |
| $75,000 to $99,999 | 65 (14.0%) | 60 (19.6%) |
| $100,000+ | 133 (28.7%) | 0 (0.0%) |
| Total | 463 (100.0%) | 306 (100.0%) |
Earnings by Sex by Educational Attainment in Lake Mohawk
Average earnings in Lake Mohawk are $67,243 for men and $40,203 for women, a difference of 40.2%. Men with an educational attainment of college or associate's degree enjoy the highest average annual earnings of $94,500, while those with high school diploma education earn the least with $44,250. Women with an educational attainment of graduate degree earn the most with the average annual earnings of $41,087, while those with graduate degree education have the smallest earnings of $41,087.
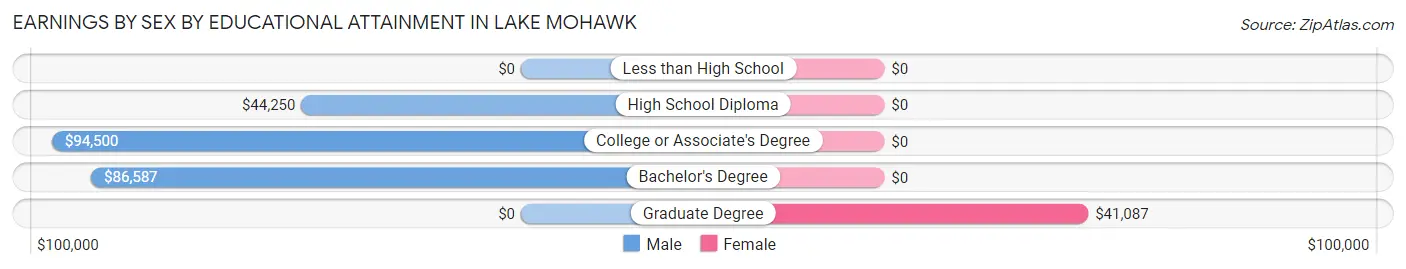
| Educational Attainment | Male Income | Female Income |
| Less than High School | - | - |
| High School Diploma | $44,250 | $0 |
| College or Associate's Degree | $94,500 | $0 |
| Bachelor's Degree | $86,587 | $0 |
| Graduate Degree | - | - |
| Total | $67,243 | $40,203 |
Family Income in Lake Mohawk
Family Income Brackets in Lake Mohawk
According to the Lake Mohawk family income data, there are 158 families falling into the $100,000 to $149,999 income range, which is the most common income bracket and makes up 32.7% of all families.
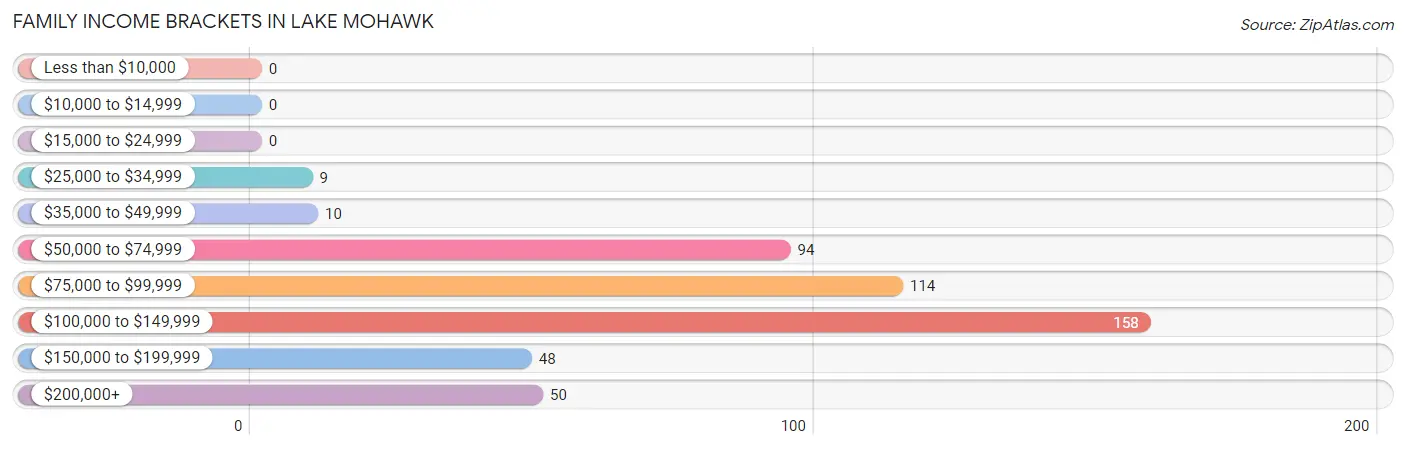
| Income Bracket | # Families | % Families |
| Less than $10,000 | 0 | 0.0% |
| $10,000 to $14,999 | 0 | 0.0% |
| $15,000 to $24,999 | 0 | 0.0% |
| $25,000 to $34,999 | 9 | 1.9% |
| $35,000 to $49,999 | 10 | 2.1% |
| $50,000 to $74,999 | 94 | 19.5% |
| $75,000 to $99,999 | 114 | 23.6% |
| $100,000 to $149,999 | 158 | 32.7% |
| $150,000 to $199,999 | 48 | 9.9% |
| $200,000+ | 50 | 10.4% |
Family Income by Famaliy Size in Lake Mohawk
3-person families (88 | 18.2%) account for the highest median family income in Lake Mohawk with $138,077 per family, while 2-person families (325 | 67.3%) have the highest median income of $46,546 per family member.
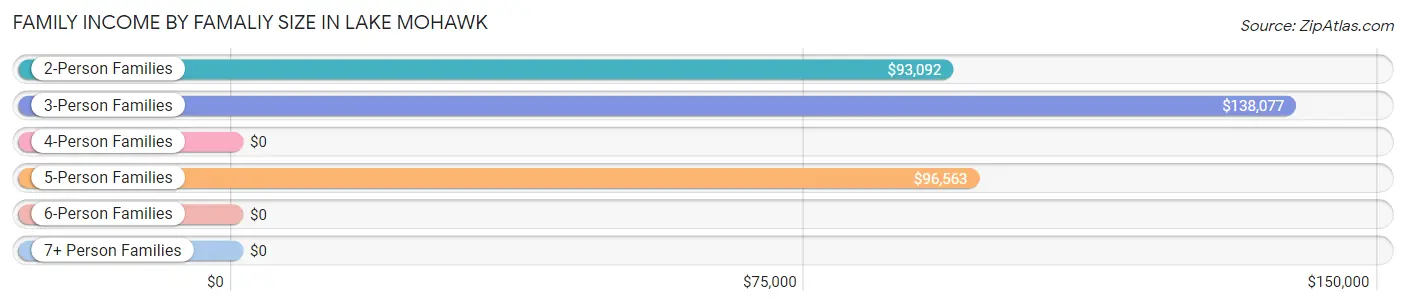
| Income Bracket | # Families | Median Income |
| 2-Person Families | 325 (67.3%) | $93,092 |
| 3-Person Families | 88 (18.2%) | $138,077 |
| 4-Person Families | 25 (5.2%) | $0 |
| 5-Person Families | 45 (9.3%) | $96,563 |
| 6-Person Families | 0 (0.0%) | $0 |
| 7+ Person Families | 0 (0.0%) | $0 |
| Total | 483 (100.0%) | $101,726 |
Family Income by Number of Earners in Lake Mohawk
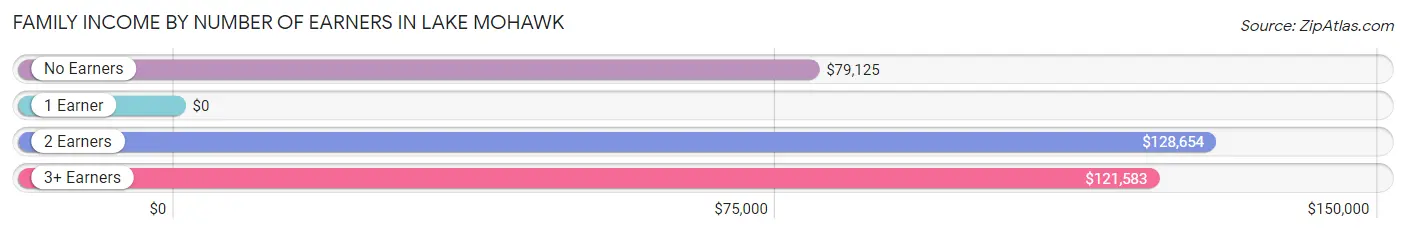
| Number of Earners | # Families | Median Income |
| No Earners | 93 (19.3%) | $79,125 |
| 1 Earner | 135 (28.0%) | $0 |
| 2 Earners | 216 (44.7%) | $128,654 |
| 3+ Earners | 39 (8.1%) | $121,583 |
| Total | 483 (100.0%) | $101,726 |
Household Income in Lake Mohawk
Household Income Brackets in Lake Mohawk
With 167 households falling in the category, the $75,000 to $99,999 income range is the most frequent in Lake Mohawk, accounting for 23.4% of all households.
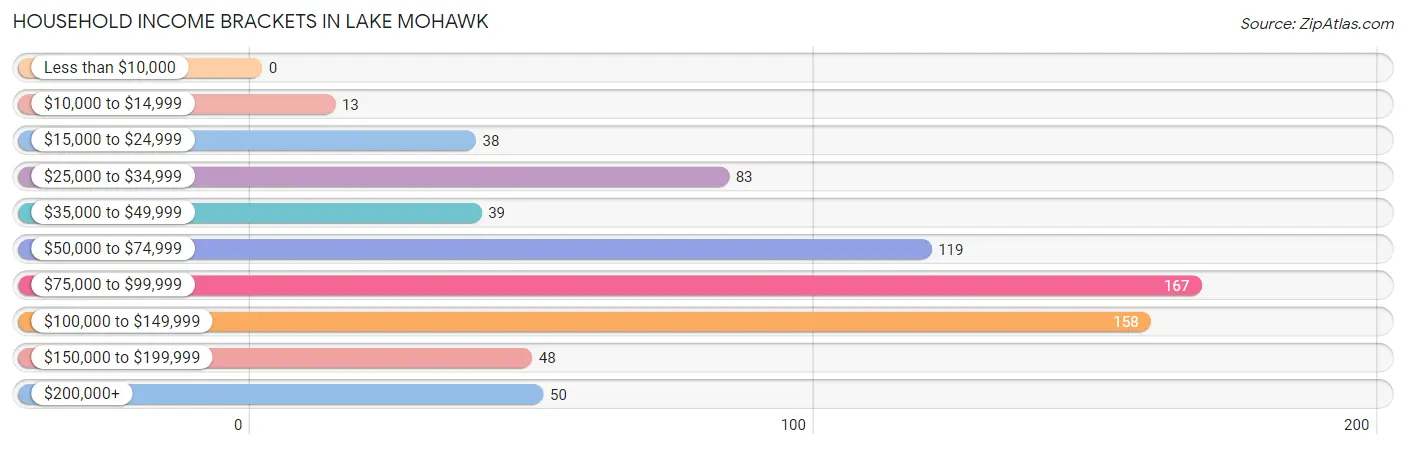
| Income Bracket | # Households | % Households |
| Less than $10,000 | 0 | 0.0% |
| $10,000 to $14,999 | 13 | 1.8% |
| $15,000 to $24,999 | 38 | 5.3% |
| $25,000 to $34,999 | 83 | 11.6% |
| $35,000 to $49,999 | 39 | 5.5% |
| $50,000 to $74,999 | 119 | 16.6% |
| $75,000 to $99,999 | 167 | 23.4% |
| $100,000 to $149,999 | 158 | 22.1% |
| $150,000 to $199,999 | 48 | 6.7% |
| $200,000+ | 50 | 7.0% |
Household Income by Householder Age in Lake Mohawk
The median household income in Lake Mohawk is $84,514, with the highest median household income of $124,886 found in the 45 to 64 years age bracket for the primary householder. A total of 253 households (35.4%) fall into this category.
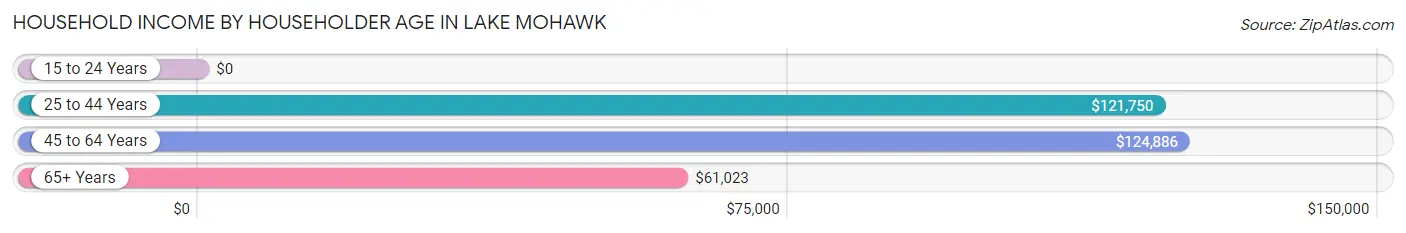
| Income Bracket | # Households | Median Income |
| 15 to 24 Years | 0 (0.0%) | $0 |
| 25 to 44 Years | 99 (13.9%) | $121,750 |
| 45 to 64 Years | 253 (35.4%) | $124,886 |
| 65+ Years | 363 (50.8%) | $61,023 |
| Total | 715 (100.0%) | $84,514 |
Poverty in Lake Mohawk
Income Below Poverty by Sex and Age in Lake Mohawk
With 0.9% poverty level for males and 3.9% for females among the residents of Lake Mohawk, 25 to 34 year old males and 16 and 17 year old females are the most vulnerable to poverty, with 6 males (100.0%) and 11 females (29.7%) in their respective age groups living below the poverty level.
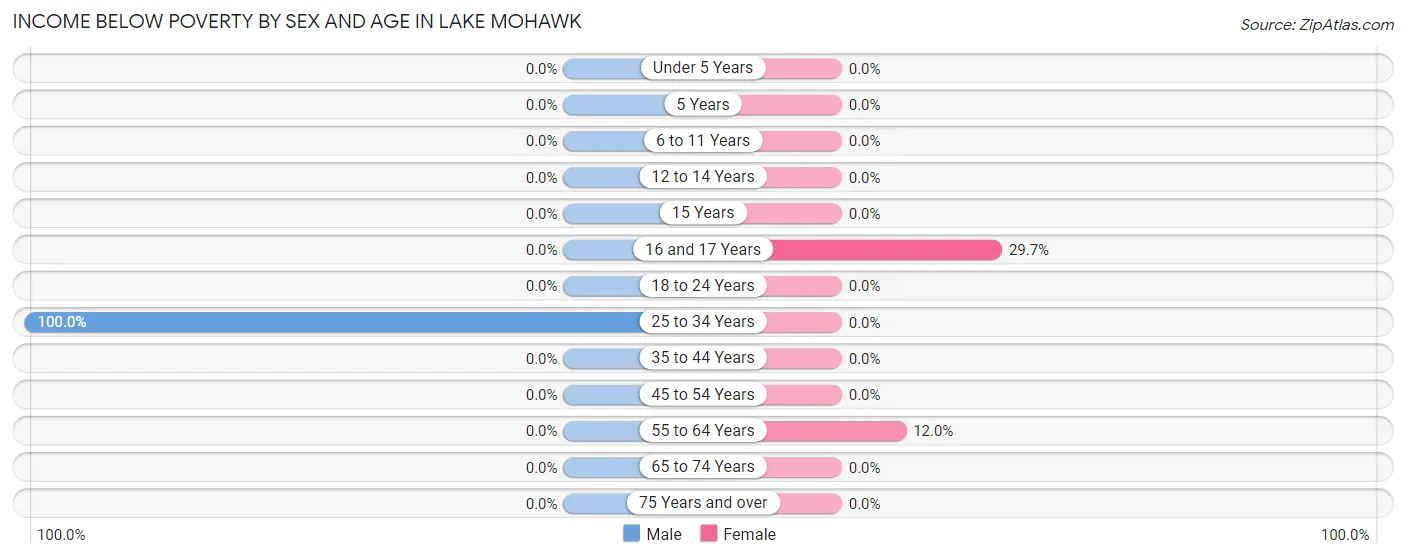
| Age Bracket | Male | Female |
| Under 5 Years | 0 (0.0%) | 0 (0.0%) |
| 5 Years | 0 (0.0%) | 0 (0.0%) |
| 6 to 11 Years | 0 (0.0%) | 0 (0.0%) |
| 12 to 14 Years | 0 (0.0%) | 0 (0.0%) |
| 15 Years | 0 (0.0%) | 0 (0.0%) |
| 16 and 17 Years | 0 (0.0%) | 11 (29.7%) |
| 18 to 24 Years | 0 (0.0%) | 0 (0.0%) |
| 25 to 34 Years | 6 (100.0%) | 0 (0.0%) |
| 35 to 44 Years | 0 (0.0%) | 0 (0.0%) |
| 45 to 54 Years | 0 (0.0%) | 0 (0.0%) |
| 55 to 64 Years | 0 (0.0%) | 19 (11.9%) |
| 65 to 74 Years | 0 (0.0%) | 0 (0.0%) |
| 75 Years and over | 0 (0.0%) | 0 (0.0%) |
| Total | 6 (0.9%) | 30 (3.9%) |
Income Above Poverty by Sex and Age in Lake Mohawk
According to the poverty statistics in Lake Mohawk, males aged under 5 years and females aged 5 years are the age groups that are most secure financially, with 100.0% of males and 100.0% of females in these age groups living above the poverty line.
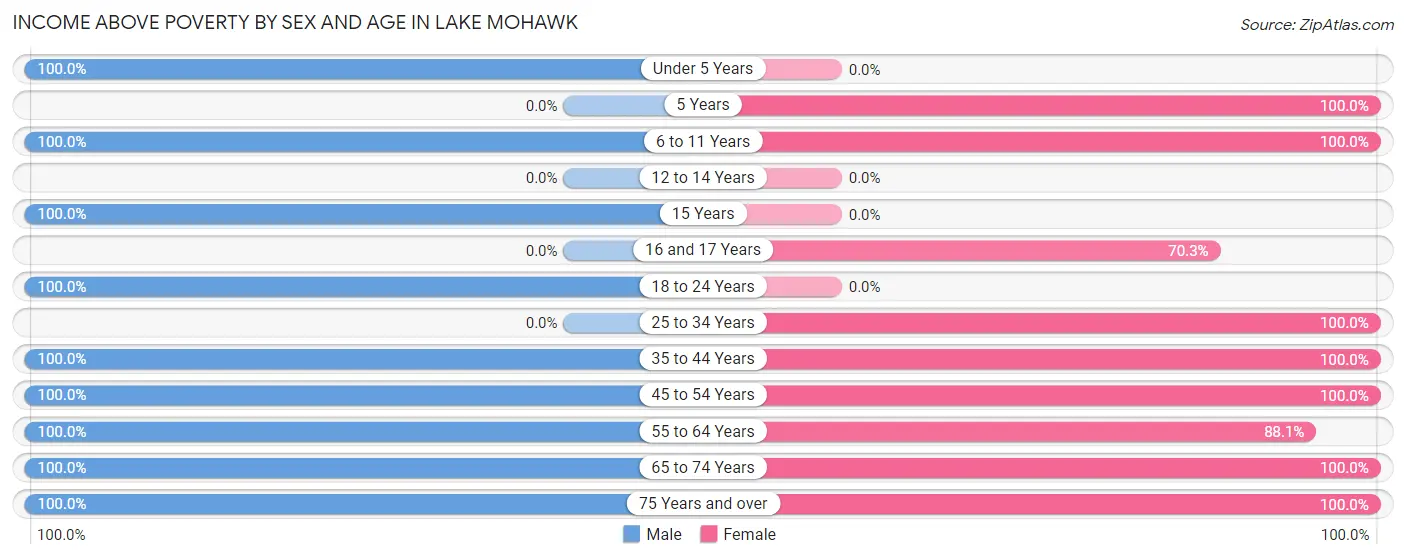
| Age Bracket | Male | Female |
| Under 5 Years | 59 (100.0%) | 0 (0.0%) |
| 5 Years | 0 (0.0%) | 21 (100.0%) |
| 6 to 11 Years | 21 (100.0%) | 62 (100.0%) |
| 12 to 14 Years | 0 (0.0%) | 0 (0.0%) |
| 15 Years | 14 (100.0%) | 0 (0.0%) |
| 16 and 17 Years | 0 (0.0%) | 26 (70.3%) |
| 18 to 24 Years | 36 (100.0%) | 0 (0.0%) |
| 25 to 34 Years | 0 (0.0%) | 65 (100.0%) |
| 35 to 44 Years | 95 (100.0%) | 40 (100.0%) |
| 45 to 54 Years | 38 (100.0%) | 56 (100.0%) |
| 55 to 64 Years | 162 (100.0%) | 140 (88.0%) |
| 65 to 74 Years | 181 (100.0%) | 196 (100.0%) |
| 75 Years and over | 86 (100.0%) | 140 (100.0%) |
| Total | 692 (99.1%) | 746 (96.1%) |
Income Below Poverty Among Married-Couple Families in Lake Mohawk
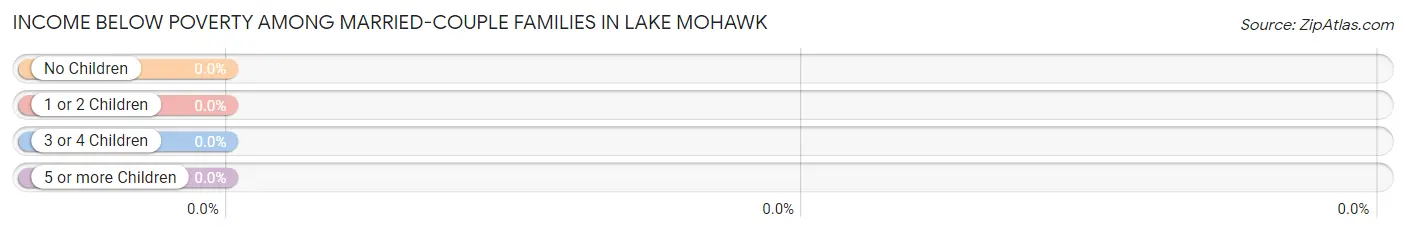
| Children | Above Poverty | Below Poverty |
| No Children | 360 (100.0%) | 0 (0.0%) |
| 1 or 2 Children | 84 (100.0%) | 0 (0.0%) |
| 3 or 4 Children | 20 (100.0%) | 0 (0.0%) |
| 5 or more Children | 0 (0.0%) | 0 (0.0%) |
| Total | 464 (100.0%) | 0 (0.0%) |
Income Below Poverty Among Single-Parent Households in Lake Mohawk
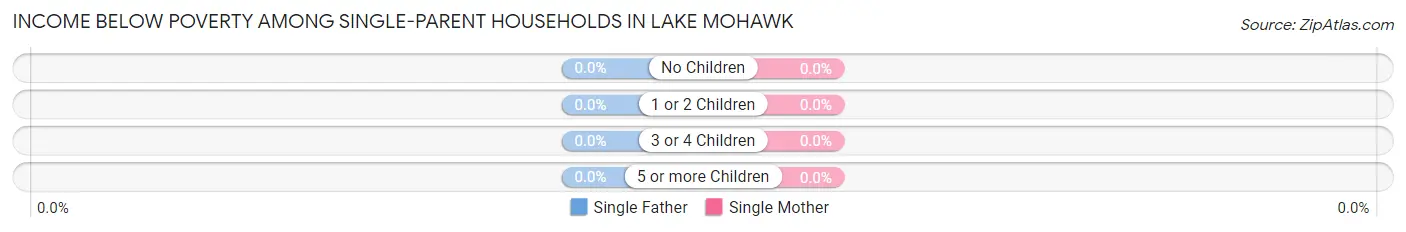
| Children | Single Father | Single Mother |
| No Children | 0 (0.0%) | 0 (0.0%) |
| 1 or 2 Children | 0 (0.0%) | 0 (0.0%) |
| 3 or 4 Children | 0 (0.0%) | 0 (0.0%) |
| 5 or more Children | 0 (0.0%) | 0 (0.0%) |
| Total | 0 (0.0%) | 0 (0.0%) |
Income Below Poverty Among Married-Couple vs Single-Parent Households in Lake Mohawk
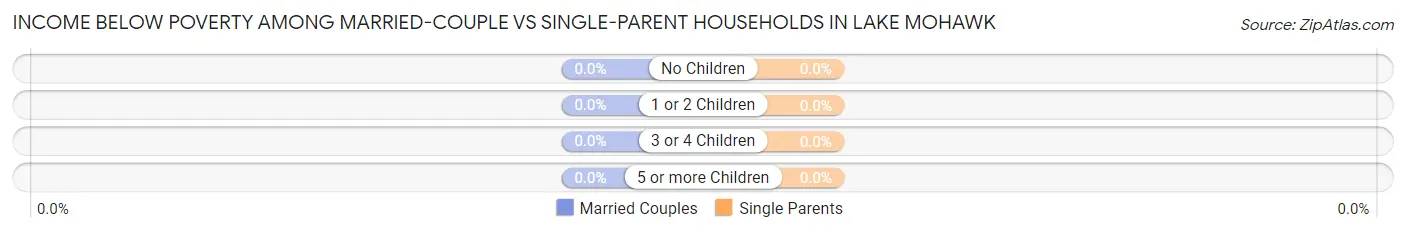
| Children | Married-Couple Families | Single-Parent Households |
| No Children | 0 (0.0%) | 0 (0.0%) |
| 1 or 2 Children | 0 (0.0%) | 0 (0.0%) |
| 3 or 4 Children | 0 (0.0%) | 0 (0.0%) |
| 5 or more Children | 0 (0.0%) | 0 (0.0%) |
| Total | 0 (0.0%) | 0 (0.0%) |
Race in Lake Mohawk
The most populous races in Lake Mohawk are White / Caucasian (1,378 | 93.5%), Some other Race (78 | 5.3%), and Black / African American (18 | 1.2%).
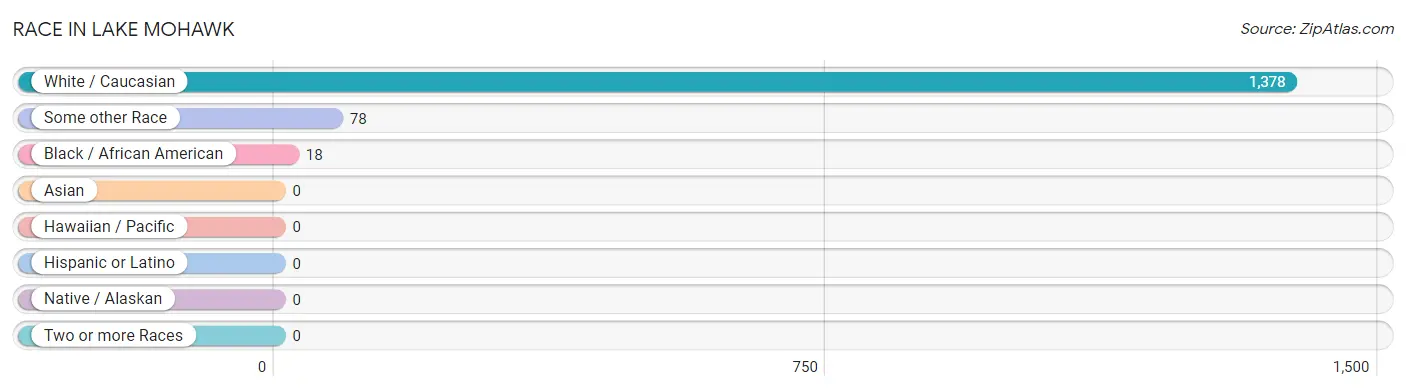
| Race | # Population | % Population |
| Asian | 0 | 0.0% |
| Black / African American | 18 | 1.2% |
| Hawaiian / Pacific | 0 | 0.0% |
| Hispanic or Latino | 0 | 0.0% |
| Native / Alaskan | 0 | 0.0% |
| White / Caucasian | 1,378 | 93.5% |
| Two or more Races | 0 | 0.0% |
| Some other Race | 78 | 5.3% |
| Total | 1,474 | 100.0% |
Ancestry in Lake Mohawk
The most populous ancestries reported in Lake Mohawk are German (373 | 25.3%), Italian (226 | 15.3%), English (180 | 12.2%), Hungarian (101 | 6.9%), and Irish (67 | 4.5%), together accounting for 64.2% of all Lake Mohawk residents.
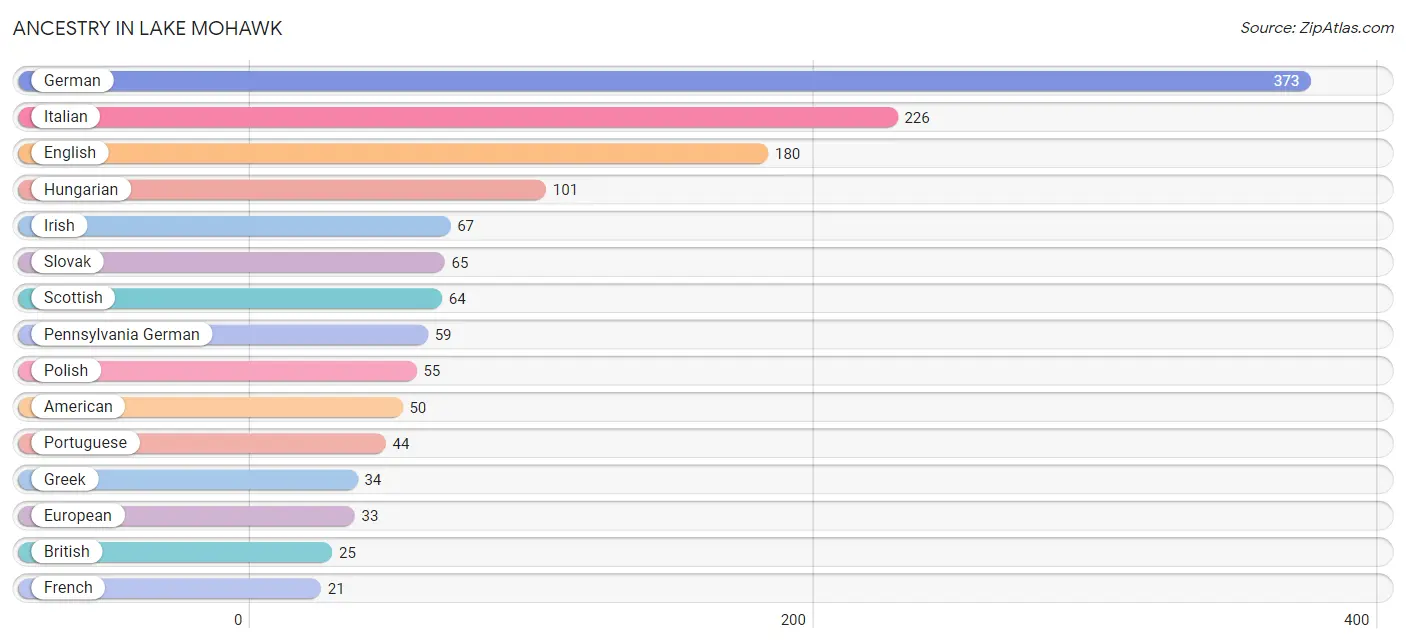
| Ancestry | # Population | % Population |
| American | 50 | 3.4% |
| Austrian | 11 | 0.7% |
| British | 25 | 1.7% |
| Danish | 13 | 0.9% |
| English | 180 | 12.2% |
| European | 33 | 2.2% |
| French | 21 | 1.4% |
| German | 373 | 25.3% |
| Greek | 34 | 2.3% |
| Hungarian | 101 | 6.9% |
| Irish | 67 | 4.5% |
| Italian | 226 | 15.3% |
| Northern European | 16 | 1.1% |
| Norwegian | 9 | 0.6% |
| Pennsylvania German | 59 | 4.0% |
| Polish | 55 | 3.7% |
| Portuguese | 44 | 3.0% |
| Scandinavian | 17 | 1.1% |
| Scotch-Irish | 10 | 0.7% |
| Scottish | 64 | 4.3% |
| Slovak | 65 | 4.4% |
| Swedish | 11 | 0.7% |
| Swiss | 13 | 0.9% |
| Welsh | 14 | 0.9% | View All 24 Rows |
Immigrants in Lake Mohawk
The most numerous immigrant groups reported in Lake Mohawk came from Europe (23 | 1.6%), Switzerland (12 | 0.8%), Western Europe (12 | 0.8%), Eastern Europe (11 | 0.7%), and Moldova (11 | 0.7%), together accounting for 4.7% of all Lake Mohawk residents.
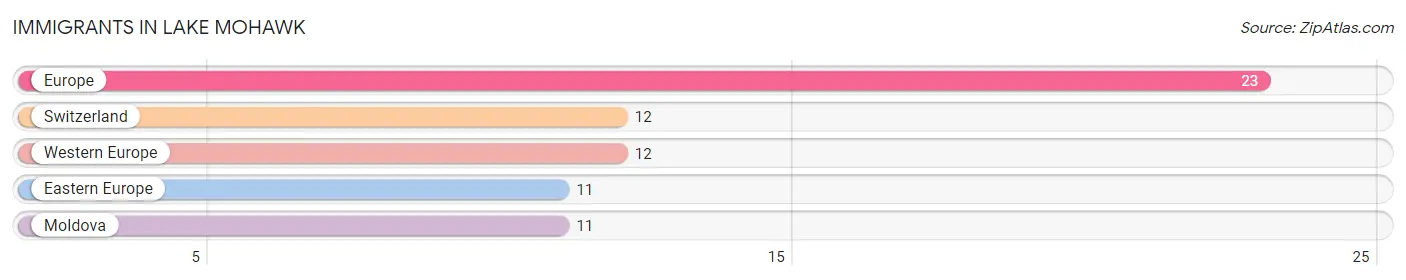
| Immigration Origin | # Population | % Population |
| Eastern Europe | 11 | 0.7% |
| Europe | 23 | 1.6% |
| Moldova | 11 | 0.7% |
| Switzerland | 12 | 0.8% |
| Western Europe | 12 | 0.8% | View All 5 Rows |
Sex and Age in Lake Mohawk
Sex and Age in Lake Mohawk
The most populous age groups in Lake Mohawk are 70 to 74 Years (130 | 18.6%) for men and 65 to 69 Years (135 | 17.4%) for women.
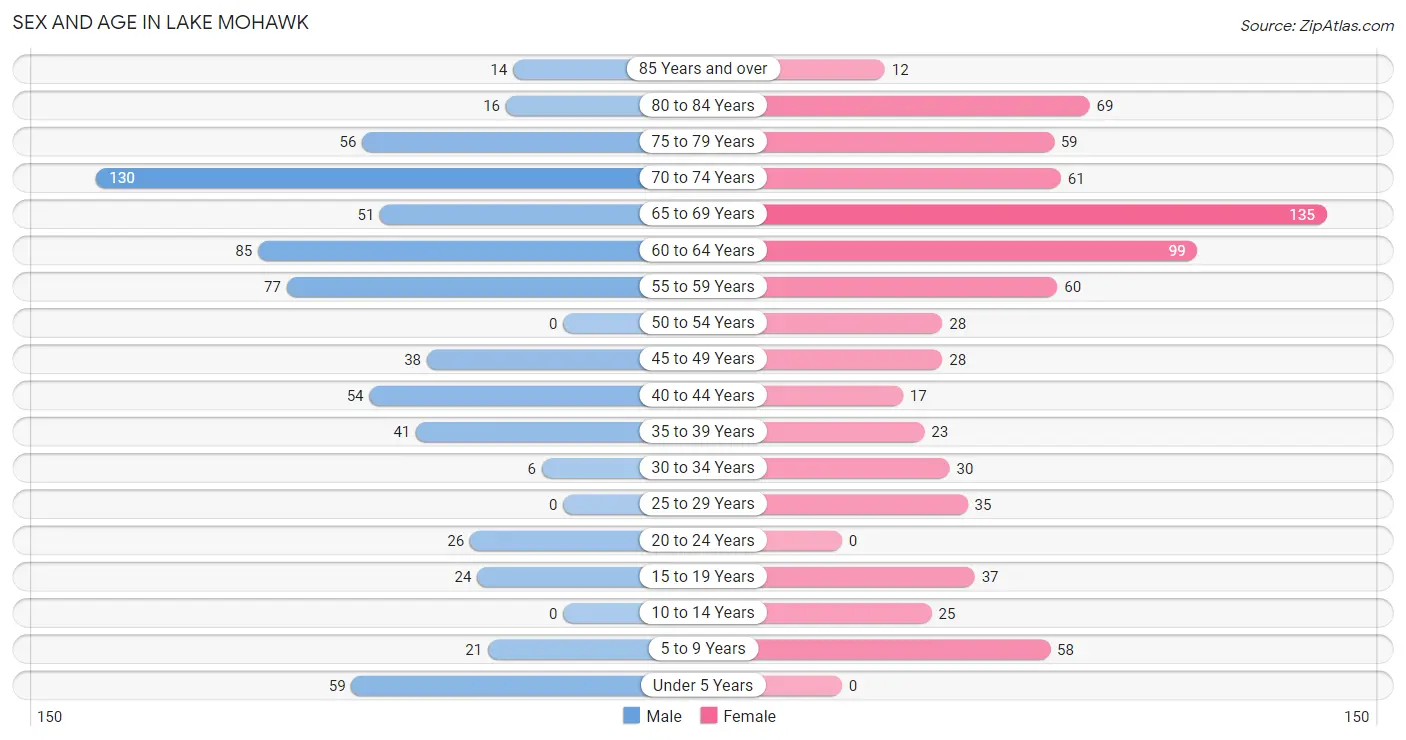
| Age Bracket | Male | Female |
| Under 5 Years | 59 (8.5%) | 0 (0.0%) |
| 5 to 9 Years | 21 (3.0%) | 58 (7.5%) |
| 10 to 14 Years | 0 (0.0%) | 25 (3.2%) |
| 15 to 19 Years | 24 (3.4%) | 37 (4.8%) |
| 20 to 24 Years | 26 (3.7%) | 0 (0.0%) |
| 25 to 29 Years | 0 (0.0%) | 35 (4.5%) |
| 30 to 34 Years | 6 (0.9%) | 30 (3.9%) |
| 35 to 39 Years | 41 (5.9%) | 23 (3.0%) |
| 40 to 44 Years | 54 (7.7%) | 17 (2.2%) |
| 45 to 49 Years | 38 (5.4%) | 28 (3.6%) |
| 50 to 54 Years | 0 (0.0%) | 28 (3.6%) |
| 55 to 59 Years | 77 (11.0%) | 60 (7.7%) |
| 60 to 64 Years | 85 (12.2%) | 99 (12.8%) |
| 65 to 69 Years | 51 (7.3%) | 135 (17.4%) |
| 70 to 74 Years | 130 (18.6%) | 61 (7.9%) |
| 75 to 79 Years | 56 (8.0%) | 59 (7.6%) |
| 80 to 84 Years | 16 (2.3%) | 69 (8.9%) |
| 85 Years and over | 14 (2.0%) | 12 (1.5%) |
| Total | 698 (100.0%) | 776 (100.0%) |
Families and Households in Lake Mohawk
Median Family Size in Lake Mohawk
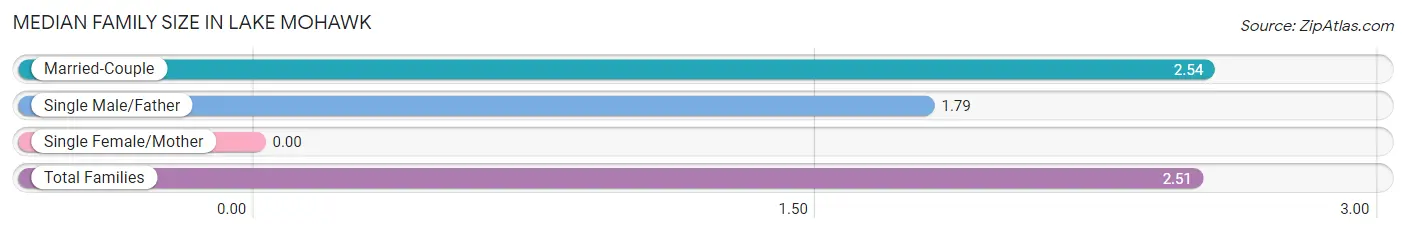
| Family Type | # Families | Family Size |
| Married-Couple | 464 (96.1%) | 2.54 |
| Single Male/Father | 19 (3.9%) | 1.79 |
| Single Female/Mother | 0 (0.0%) | - |
| Total Families | 483 (100.0%) | 2.51 |
Median Household Size in Lake Mohawk
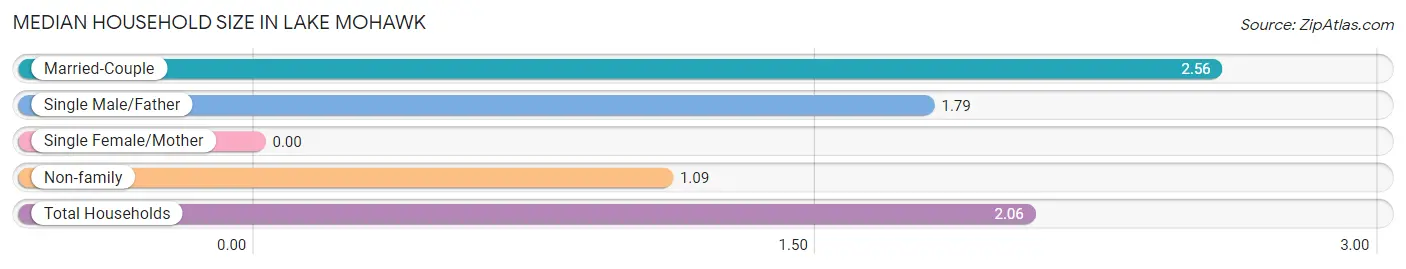
| Household Type | # Households | Household Size |
| Married-Couple | 464 (64.9%) | 2.56 |
| Single Male/Father | 19 (2.7%) | 1.79 |
| Single Female/Mother | 0 (0.0%) | - |
| Non-family | 232 (32.5%) | 1.09 |
| Total Households | 715 (100.0%) | 2.06 |
Household Size by Marriage Status in Lake Mohawk
Out of a total of 715 households in Lake Mohawk, 483 (67.5%) are family households, while 232 (32.5%) are nonfamily households. The most numerous type of family households are 2-person households, comprising 325, and the most common type of nonfamily households are 1-person households, comprising 212.
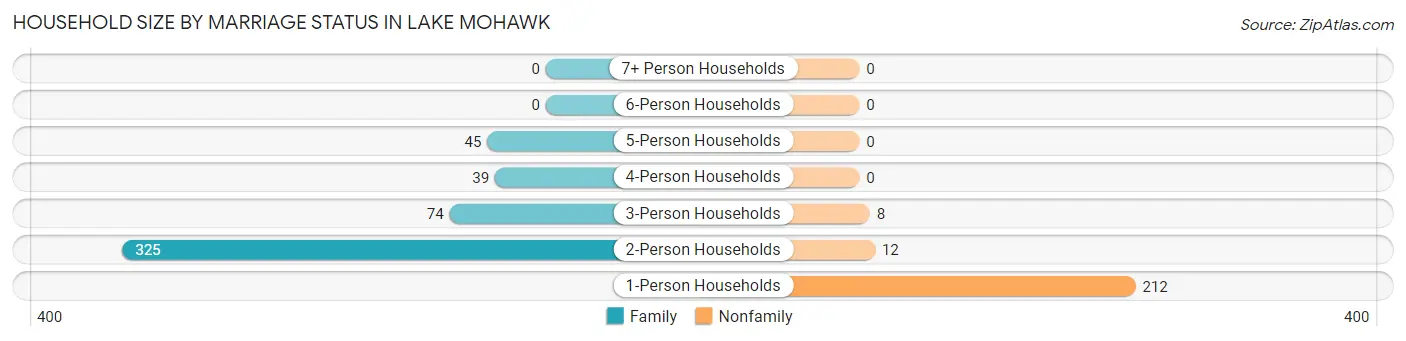
| Household Size | Family Households | Nonfamily Households |
| 1-Person Households | - | 212 (29.6%) |
| 2-Person Households | 325 (45.5%) | 12 (1.7%) |
| 3-Person Households | 74 (10.3%) | 8 (1.1%) |
| 4-Person Households | 39 (5.4%) | 0 (0.0%) |
| 5-Person Households | 45 (6.3%) | 0 (0.0%) |
| 6-Person Households | 0 (0.0%) | 0 (0.0%) |
| 7+ Person Households | 0 (0.0%) | 0 (0.0%) |
| Total | 483 (67.5%) | 232 (32.5%) |
Female Fertility in Lake Mohawk
Fertility by Age in Lake Mohawk
Average fertility rate in Lake Mohawk is 140.0 births per 1,000 women. Women in the age bracket of 20 to 34 years have the highest fertility rate with 385.0 births per 1,000 women. Women in the age bracket of 20 to 34 years acount for 100.0% of all women with births.
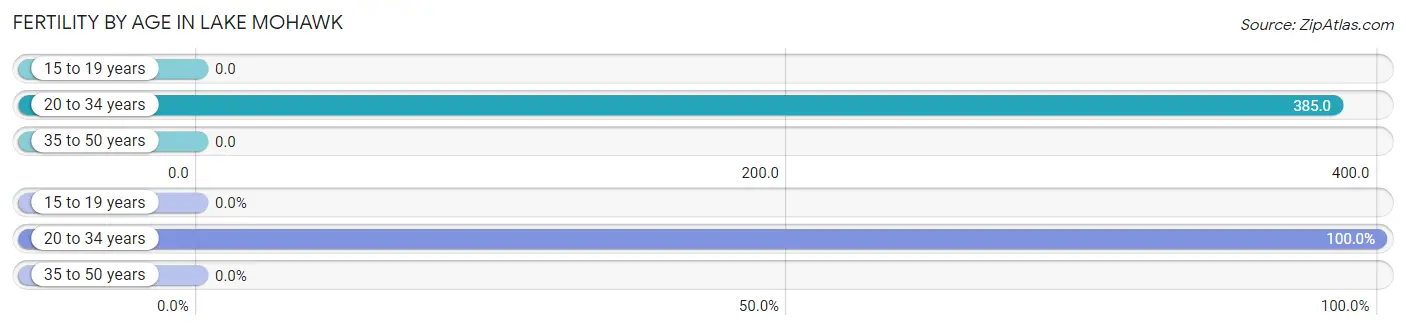
| Age Bracket | Women with Births | Births / 1,000 Women |
| 15 to 19 years | 0 (0.0%) | 0.0 |
| 20 to 34 years | 25 (100.0%) | 385.0 |
| 35 to 50 years | 0 (0.0%) | 0.0 |
| Total | 25 (100.0%) | 140.0 |
Fertility by Age by Marriage Status in Lake Mohawk
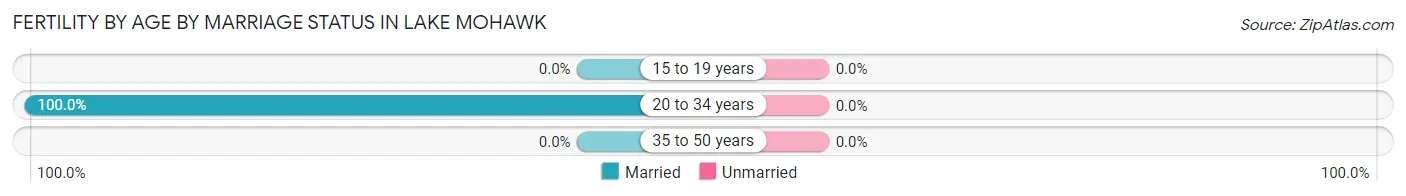
| Age Bracket | Married | Unmarried |
| 15 to 19 years | 0 (0.0%) | 0 (0.0%) |
| 20 to 34 years | 25 (100.0%) | 0 (0.0%) |
| 35 to 50 years | 0 (0.0%) | 0 (0.0%) |
| Total | 25 (100.0%) | 0 (0.0%) |
Fertility by Education in Lake Mohawk
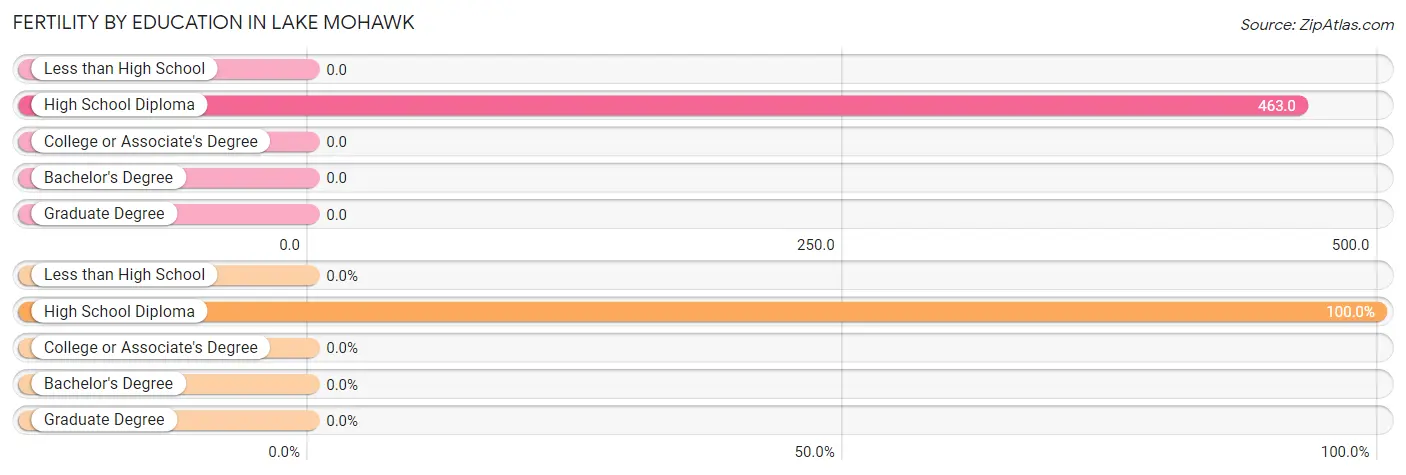
| Educational Attainment | Women with Births | Births / 1,000 Women |
| Less than High School | 0 (0.0%) | 0.0 |
| High School Diploma | 25 (100.0%) | 463.0 |
| College or Associate's Degree | 0 (0.0%) | 0.0 |
| Bachelor's Degree | 0 (0.0%) | 0.0 |
| Graduate Degree | 0 (0.0%) | 0.0 |
| Total | 25 (100.0%) | 140.0 |
Fertility by Education by Marriage Status in Lake Mohawk
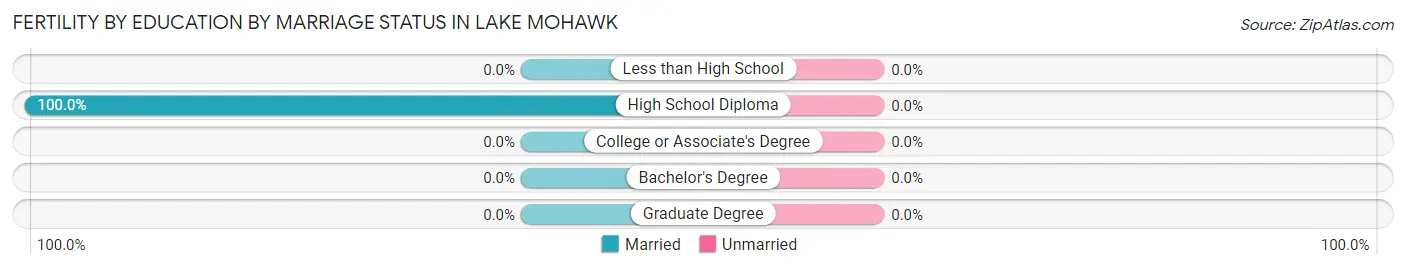
| Educational Attainment | Married | Unmarried |
| Less than High School | 0 (0.0%) | 0 (0.0%) |
| High School Diploma | 25 (100.0%) | 0 (0.0%) |
| College or Associate's Degree | 0 (0.0%) | 0 (0.0%) |
| Bachelor's Degree | 0 (0.0%) | 0 (0.0%) |
| Graduate Degree | 0 (0.0%) | 0 (0.0%) |
| Total | 25 (100.0%) | 0 (0.0%) |
Employment Characteristics in Lake Mohawk
Employment by Class of Employer in Lake Mohawk
Among the 687 employed individuals in Lake Mohawk, private company employees (527 | 76.7%), local government employees (65 | 9.5%), and self-employed (incorporated) (50 | 7.3%) make up the most common classes of employment.
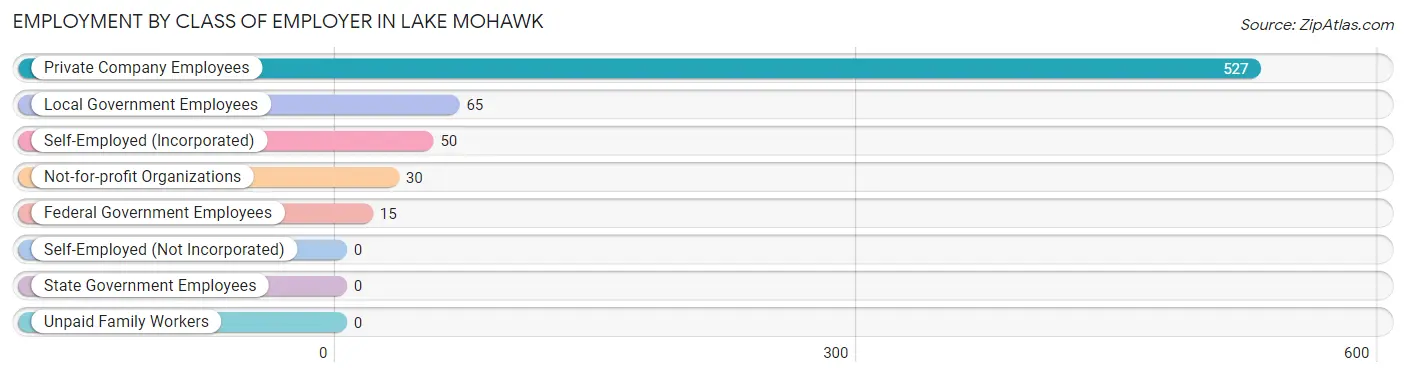
| Employer Class | # Employees | % Employees |
| Private Company Employees | 527 | 76.7% |
| Self-Employed (Incorporated) | 50 | 7.3% |
| Self-Employed (Not Incorporated) | 0 | 0.0% |
| Not-for-profit Organizations | 30 | 4.4% |
| Local Government Employees | 65 | 9.5% |
| State Government Employees | 0 | 0.0% |
| Federal Government Employees | 15 | 2.2% |
| Unpaid Family Workers | 0 | 0.0% |
| Total | 687 | 100.0% |
Employment Status by Age in Lake Mohawk
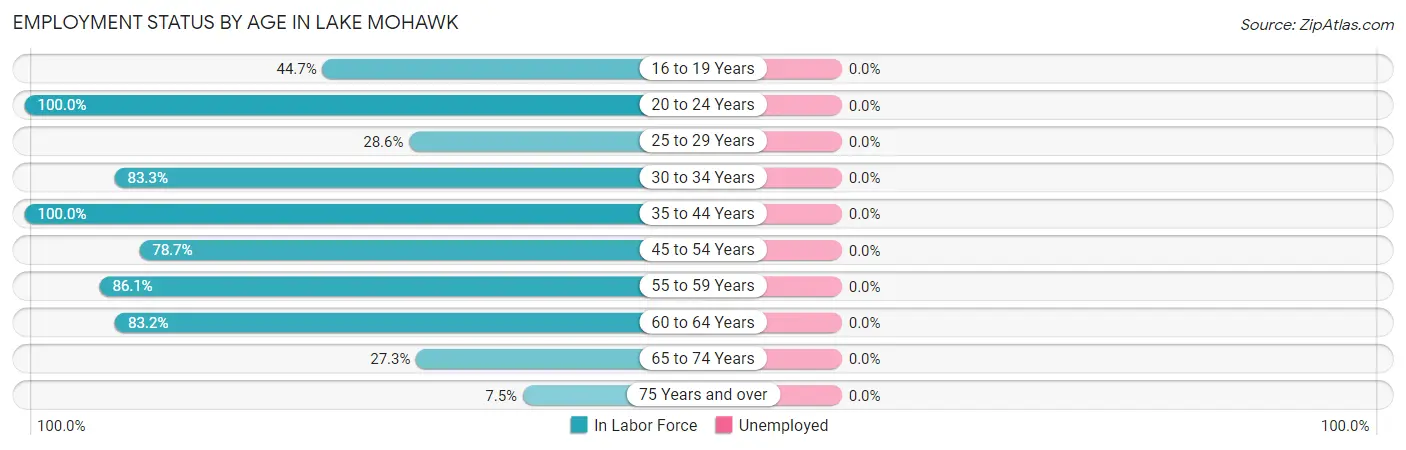
| Age Bracket | In Labor Force | Unemployed |
| 16 to 19 Years | 21 (44.7%) | 0 (0.0%) |
| 20 to 24 Years | 26 (100.0%) | 0 (0.0%) |
| 25 to 29 Years | 10 (28.6%) | 0 (0.0%) |
| 30 to 34 Years | 30 (83.3%) | 0 (0.0%) |
| 35 to 44 Years | 135 (100.0%) | 0 (0.0%) |
| 45 to 54 Years | 74 (78.7%) | 0 (0.0%) |
| 55 to 59 Years | 118 (86.1%) | 0 (0.0%) |
| 60 to 64 Years | 153 (83.2%) | 0 (0.0%) |
| 65 to 74 Years | 103 (27.3%) | 0 (0.0%) |
| 75 Years and over | 17 (7.5%) | 0 (0.0%) |
| Total | 687 (53.0%) | 0 (0.0%) |
Employment Status by Educational Attainment in Lake Mohawk
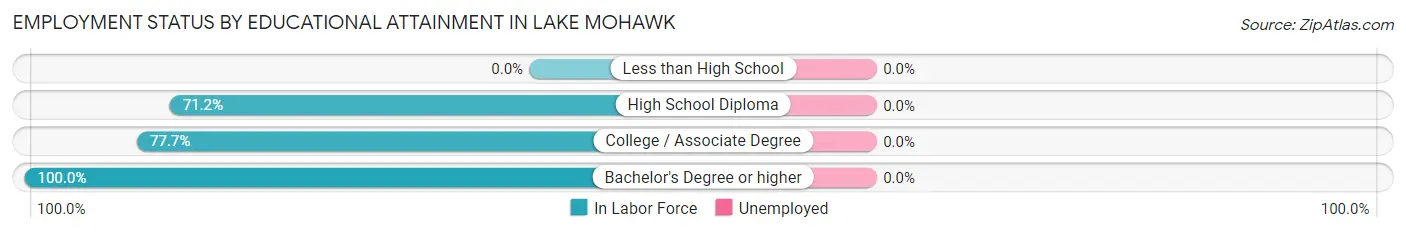
| Educational Attainment | In Labor Force | Unemployed |
| Less than High School | 0 (0.0%) | 0 (0.0%) |
| High School Diploma | 84 (71.2%) | 0 (0.0%) |
| College / Associate Degree | 212 (77.7%) | 0 (0.0%) |
| Bachelor's Degree or higher | 224 (100.0%) | 0 (0.0%) |
| Total | 520 (83.7%) | 0 (0.0%) |
Employment Occupations by Sex in Lake Mohawk
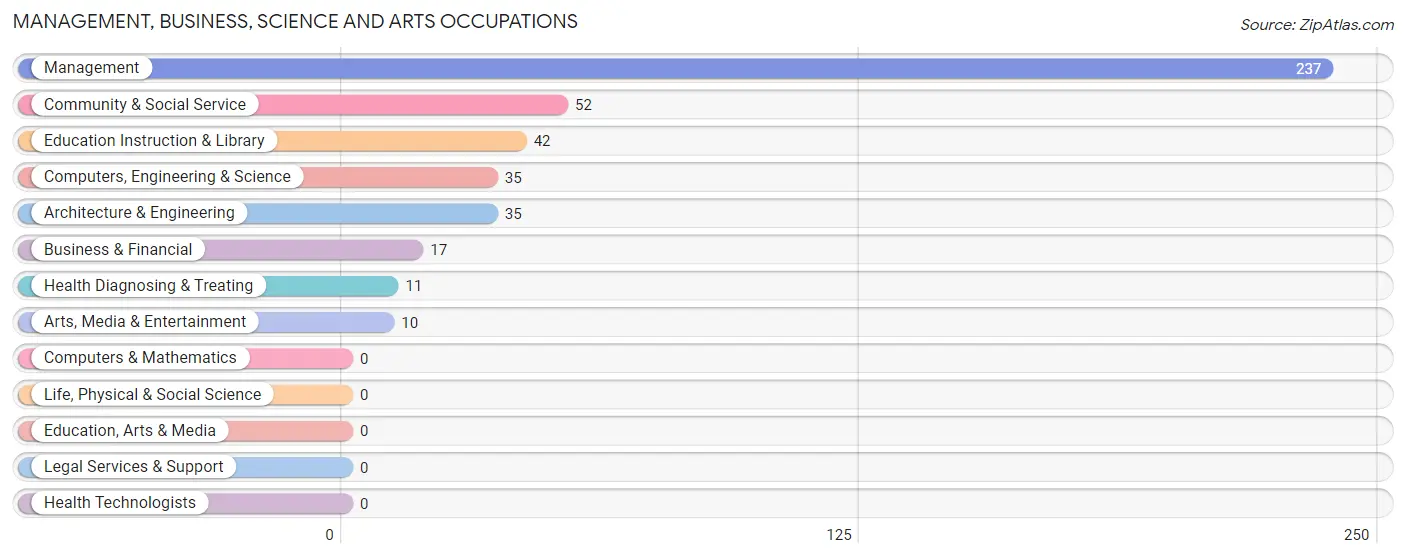
Management, Business, Science and Arts Occupations
The most common Management, Business, Science and Arts occupations in Lake Mohawk are Management (237 | 34.5%), Community & Social Service (52 | 7.6%), Education Instruction & Library (42 | 6.1%), Computers, Engineering & Science (35 | 5.1%), and Architecture & Engineering (35 | 5.1%).
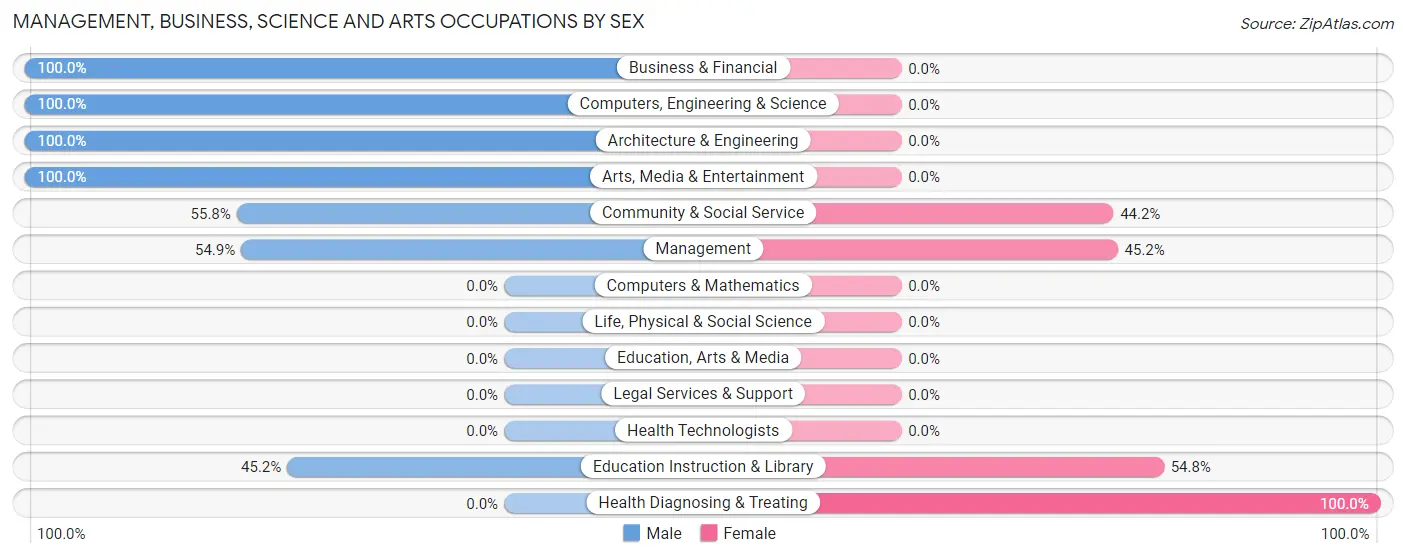
Management, Business, Science and Arts Occupations by Sex
Within the Management, Business, Science and Arts occupations in Lake Mohawk, the most male-oriented occupations are Business & Financial (100.0%), Computers, Engineering & Science (100.0%), and Architecture & Engineering (100.0%), while the most female-oriented occupations are Health Diagnosing & Treating (100.0%), Education Instruction & Library (54.8%), and Management (45.2%).
| Occupation | Male | Female |
| Management | 130 (54.8%) | 107 (45.2%) |
| Business & Financial | 17 (100.0%) | 0 (0.0%) |
| Computers, Engineering & Science | 35 (100.0%) | 0 (0.0%) |
| Computers & Mathematics | 0 (0.0%) | 0 (0.0%) |
| Architecture & Engineering | 35 (100.0%) | 0 (0.0%) |
| Life, Physical & Social Science | 0 (0.0%) | 0 (0.0%) |
| Community & Social Service | 29 (55.8%) | 23 (44.2%) |
| Education, Arts & Media | 0 (0.0%) | 0 (0.0%) |
| Legal Services & Support | 0 (0.0%) | 0 (0.0%) |
| Education Instruction & Library | 19 (45.2%) | 23 (54.8%) |
| Arts, Media & Entertainment | 10 (100.0%) | 0 (0.0%) |
| Health Diagnosing & Treating | 0 (0.0%) | 11 (100.0%) |
| Health Technologists | 0 (0.0%) | 0 (0.0%) |
| Total (Category) | 211 (59.9%) | 141 (40.1%) |
| Total (Overall) | 433 (63.0%) | 254 (37.0%) |
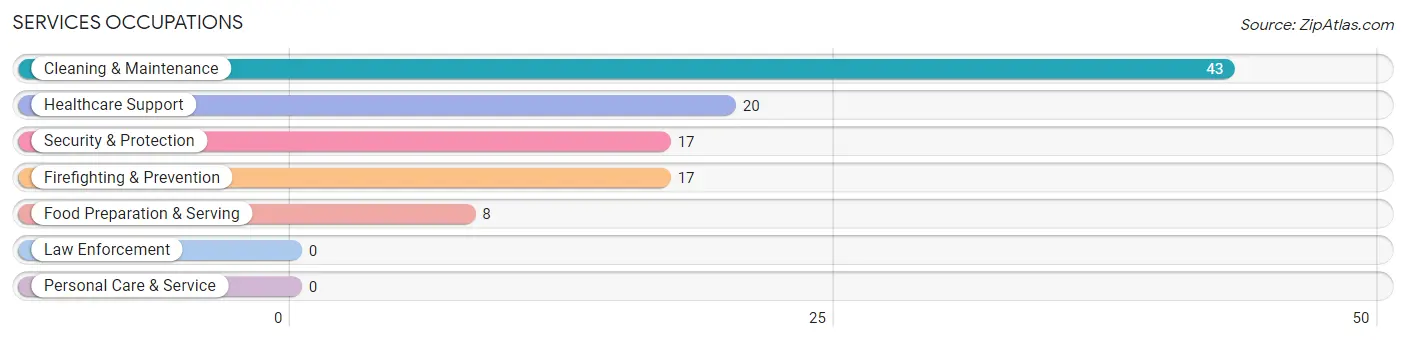
Services Occupations
The most common Services occupations in Lake Mohawk are Cleaning & Maintenance (43 | 6.3%), Healthcare Support (20 | 2.9%), Security & Protection (17 | 2.5%), Firefighting & Prevention (17 | 2.5%), and Food Preparation & Serving (8 | 1.2%).
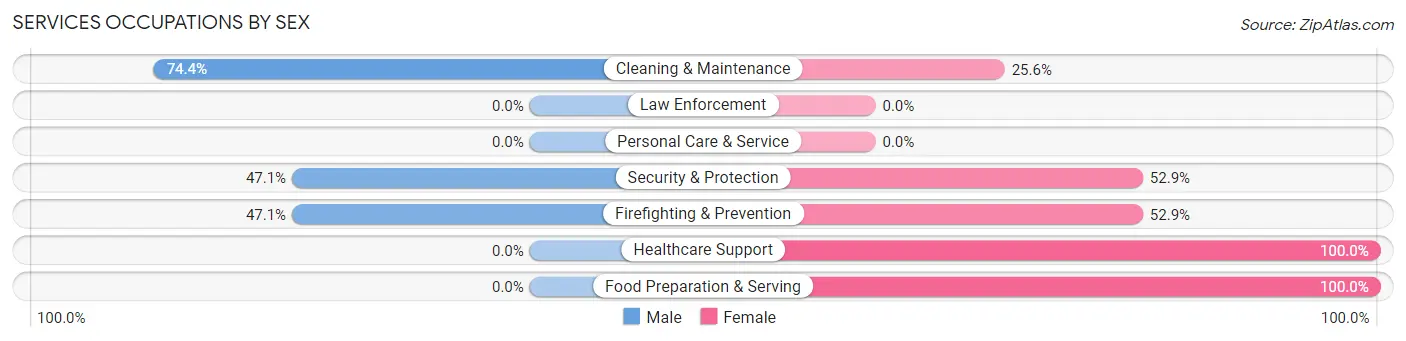
Services Occupations by Sex
Within the Services occupations in Lake Mohawk, the most male-oriented occupations are Cleaning & Maintenance (74.4%), Security & Protection (47.1%), and Firefighting & Prevention (47.1%), while the most female-oriented occupations are Healthcare Support (100.0%), Food Preparation & Serving (100.0%), and Security & Protection (52.9%).
| Occupation | Male | Female |
| Healthcare Support | 0 (0.0%) | 20 (100.0%) |
| Security & Protection | 8 (47.1%) | 9 (52.9%) |
| Firefighting & Prevention | 8 (47.1%) | 9 (52.9%) |
| Law Enforcement | 0 (0.0%) | 0 (0.0%) |
| Food Preparation & Serving | 0 (0.0%) | 8 (100.0%) |
| Cleaning & Maintenance | 32 (74.4%) | 11 (25.6%) |
| Personal Care & Service | 0 (0.0%) | 0 (0.0%) |
| Total (Category) | 40 (45.5%) | 48 (54.5%) |
| Total (Overall) | 433 (63.0%) | 254 (37.0%) |
Sales and Office Occupations
The most common Sales and Office occupations in Lake Mohawk are Office & Administration (117 | 17.0%), and Sales & Related (19 | 2.8%).
Sales and Office Occupations by Sex
| Occupation | Male | Female |
| Sales & Related | 0 (0.0%) | 19 (100.0%) |
| Office & Administration | 71 (60.7%) | 46 (39.3%) |
| Total (Category) | 71 (52.2%) | 65 (47.8%) |
| Total (Overall) | 433 (63.0%) | 254 (37.0%) |
Natural Resources, Construction and Maintenance Occupations
The most common Natural Resources, Construction and Maintenance occupations in Lake Mohawk are , and Installation, Maintenance & Repair (33 | 4.8%).
Natural Resources, Construction and Maintenance Occupations by Sex
| Occupation | Male | Female |
| Farming, Fishing & Forestry | 0 (0.0%) | 0 (0.0%) |
| Construction & Extraction | 0 (0.0%) | 0 (0.0%) |
| Installation, Maintenance & Repair | 33 (100.0%) | 0 (0.0%) |
| Total (Category) | 33 (100.0%) | 0 (0.0%) |
| Total (Overall) | 433 (63.0%) | 254 (37.0%) |
Production, Transportation and Moving Occupations
The most common Production, Transportation and Moving occupations in Lake Mohawk are Transportation (53 | 7.7%), and Production (25 | 3.6%).
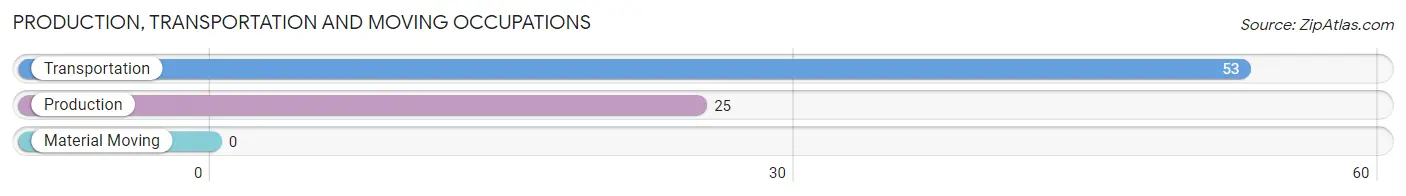
Production, Transportation and Moving Occupations by Sex
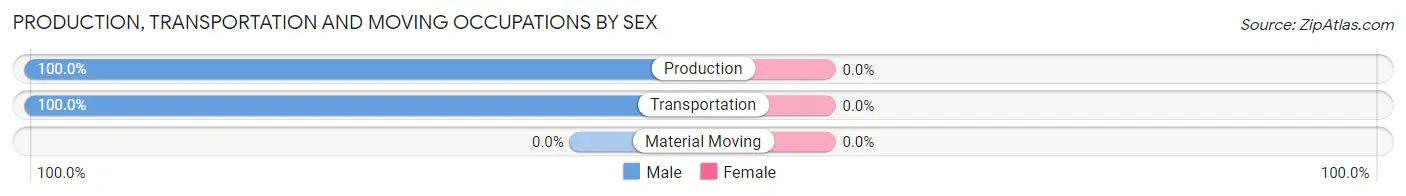
| Occupation | Male | Female |
| Production | 25 (100.0%) | 0 (0.0%) |
| Transportation | 53 (100.0%) | 0 (0.0%) |
| Material Moving | 0 (0.0%) | 0 (0.0%) |
| Total (Category) | 78 (100.0%) | 0 (0.0%) |
| Total (Overall) | 433 (63.0%) | 254 (37.0%) |
Employment Industries by Sex in Lake Mohawk
Employment Industries in Lake Mohawk
The major employment industries in Lake Mohawk include Professional & Scientific (92 | 13.4%), Manufacturing (89 | 13.0%), Real Estate, Rental & Leasing (81 | 11.8%), Educational Services (66 | 9.6%), and Construction (61 | 8.9%).
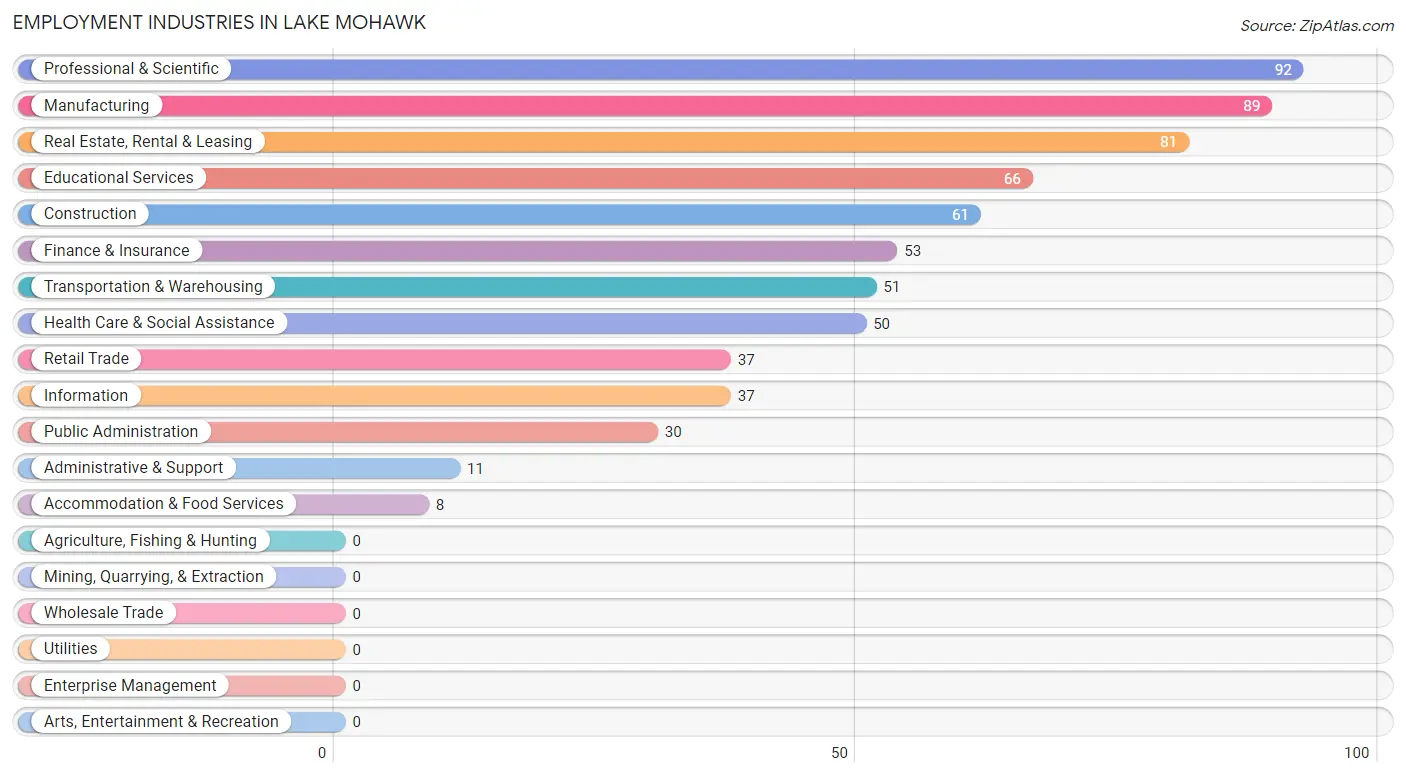
Employment Industries by Sex in Lake Mohawk
The Lake Mohawk industries that see more men than women are Construction (100.0%), Manufacturing (100.0%), and Professional & Scientific (100.0%), whereas the industries that tend to have a higher number of women are Health Care & Social Assistance (100.0%), Accommodation & Food Services (100.0%), and Finance & Insurance (77.4%).
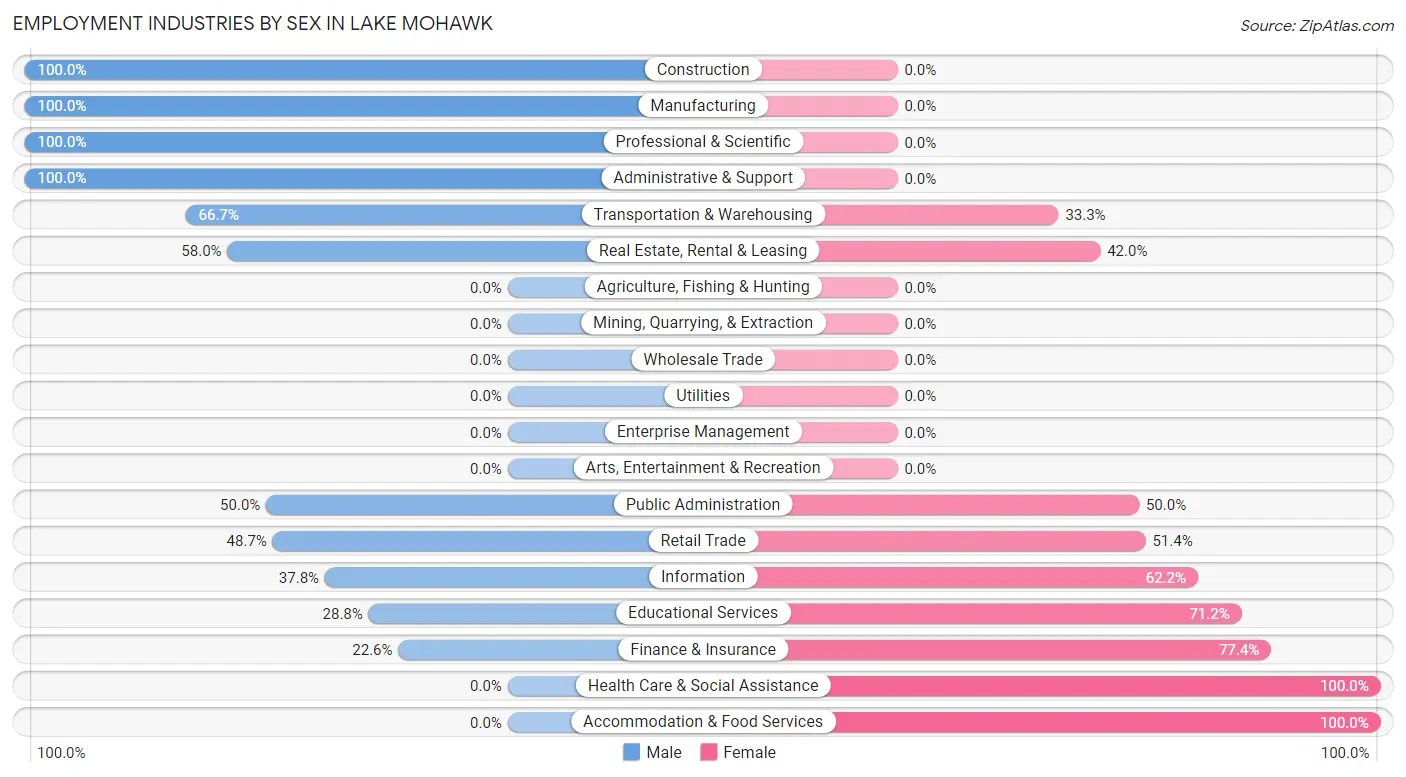
| Industry | Male | Female |
| Agriculture, Fishing & Hunting | 0 (0.0%) | 0 (0.0%) |
| Mining, Quarrying, & Extraction | 0 (0.0%) | 0 (0.0%) |
| Construction | 61 (100.0%) | 0 (0.0%) |
| Manufacturing | 89 (100.0%) | 0 (0.0%) |
| Wholesale Trade | 0 (0.0%) | 0 (0.0%) |
| Retail Trade | 18 (48.6%) | 19 (51.3%) |
| Transportation & Warehousing | 34 (66.7%) | 17 (33.3%) |
| Utilities | 0 (0.0%) | 0 (0.0%) |
| Information | 14 (37.8%) | 23 (62.2%) |
| Finance & Insurance | 12 (22.6%) | 41 (77.4%) |
| Real Estate, Rental & Leasing | 47 (58.0%) | 34 (42.0%) |
| Professional & Scientific | 92 (100.0%) | 0 (0.0%) |
| Enterprise Management | 0 (0.0%) | 0 (0.0%) |
| Administrative & Support | 11 (100.0%) | 0 (0.0%) |
| Educational Services | 19 (28.8%) | 47 (71.2%) |
| Health Care & Social Assistance | 0 (0.0%) | 50 (100.0%) |
| Arts, Entertainment & Recreation | 0 (0.0%) | 0 (0.0%) |
| Accommodation & Food Services | 0 (0.0%) | 8 (100.0%) |
| Public Administration | 15 (50.0%) | 15 (50.0%) |
| Total | 433 (63.0%) | 254 (37.0%) |
Education in Lake Mohawk
School Enrollment in Lake Mohawk
The most common levels of schooling among the 190 students in Lake Mohawk are elementary school (68 | 35.8%), high school (51 | 26.8%), and kindergarten (21 | 11.1%).
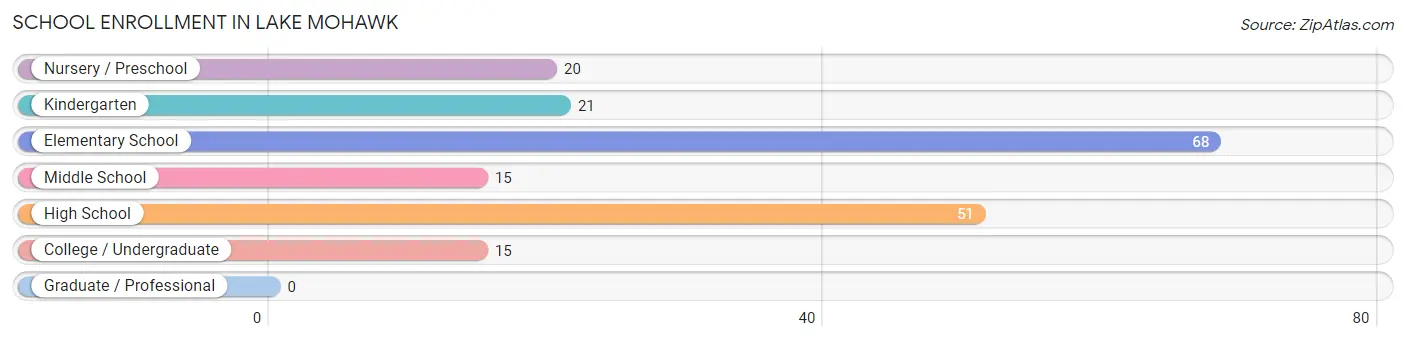
| School Level | # Students | % Students |
| Nursery / Preschool | 20 | 10.5% |
| Kindergarten | 21 | 11.1% |
| Elementary School | 68 | 35.8% |
| Middle School | 15 | 7.9% |
| High School | 51 | 26.8% |
| College / Undergraduate | 15 | 7.9% |
| Graduate / Professional | 0 | 0.0% |
| Total | 190 | 100.0% |
School Enrollment by Age by Funding Source in Lake Mohawk
Out of a total of 190 students who are enrolled in schools in Lake Mohawk, 20 (10.5%) attend a private institution, while the remaining 170 (89.5%) are enrolled in public schools. The age group of 3 to 4 year olds has the highest likelihood of being enrolled in private schools, with 20 (100.0% in the age bracket) enrolled. Conversely, the age group of 5 to 9 year old has the lowest likelihood of being enrolled in a private school, with 79 (100.0% in the age bracket) attending a public institution.
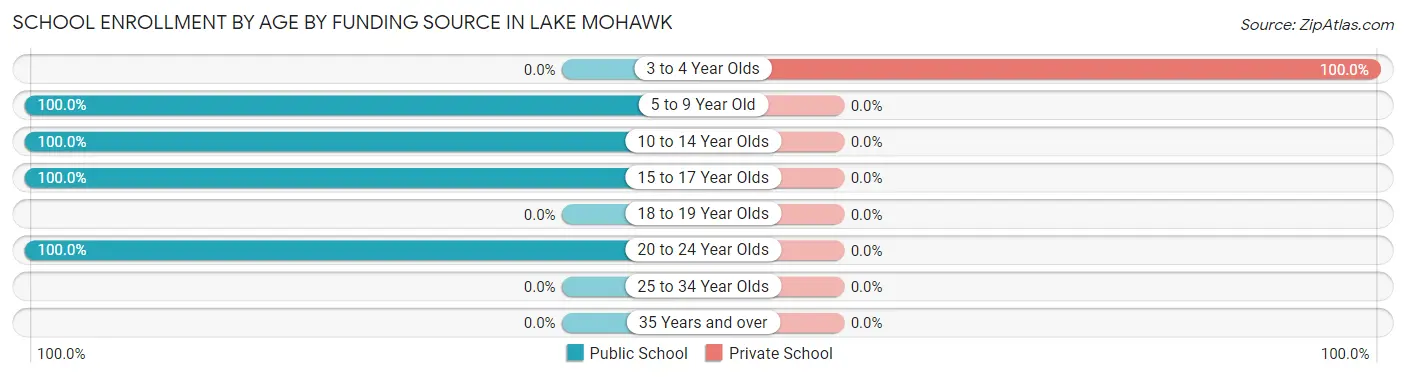
| Age Bracket | Public School | Private School |
| 3 to 4 Year Olds | 0 (0.0%) | 20 (100.0%) |
| 5 to 9 Year Old | 79 (100.0%) | 0 (0.0%) |
| 10 to 14 Year Olds | 25 (100.0%) | 0 (0.0%) |
| 15 to 17 Year Olds | 51 (100.0%) | 0 (0.0%) |
| 18 to 19 Year Olds | 0 (0.0%) | 0 (0.0%) |
| 20 to 24 Year Olds | 15 (100.0%) | 0 (0.0%) |
| 25 to 34 Year Olds | 0 (0.0%) | 0 (0.0%) |
| 35 Years and over | 0 (0.0%) | 0 (0.0%) |
| Total | 170 (89.5%) | 20 (10.5%) |
Educational Attainment by Field of Study in Lake Mohawk
Education (145 | 29.8%), business (91 | 18.7%), science & technology (72 | 14.8%), engineering (46 | 9.5%), and physical & health sciences (34 | 7.0%) are the most common fields of study among 487 individuals in Lake Mohawk who have obtained a bachelor's degree or higher.
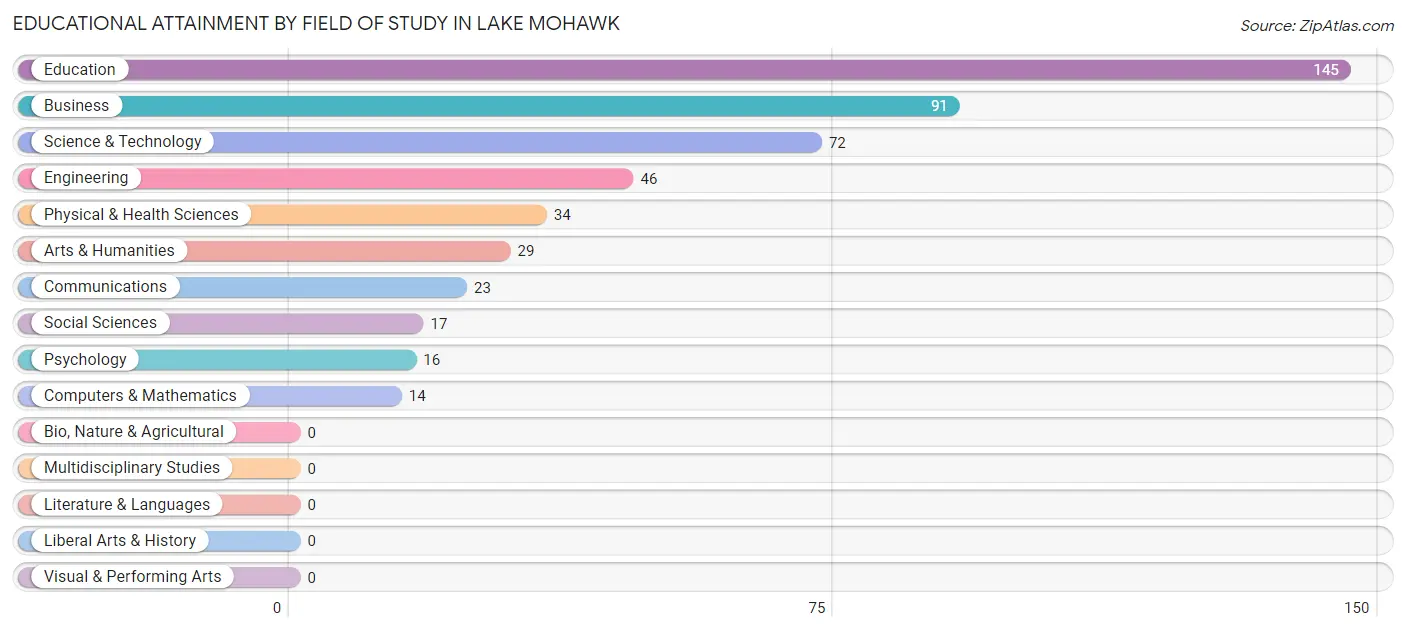
| Field of Study | # Graduates | % Graduates |
| Computers & Mathematics | 14 | 2.9% |
| Bio, Nature & Agricultural | 0 | 0.0% |
| Physical & Health Sciences | 34 | 7.0% |
| Psychology | 16 | 3.3% |
| Social Sciences | 17 | 3.5% |
| Engineering | 46 | 9.5% |
| Multidisciplinary Studies | 0 | 0.0% |
| Science & Technology | 72 | 14.8% |
| Business | 91 | 18.7% |
| Education | 145 | 29.8% |
| Literature & Languages | 0 | 0.0% |
| Liberal Arts & History | 0 | 0.0% |
| Visual & Performing Arts | 0 | 0.0% |
| Communications | 23 | 4.7% |
| Arts & Humanities | 29 | 5.9% |
| Total | 487 | 100.0% |
Transportation & Commute in Lake Mohawk
Vehicle Availability by Sex in Lake Mohawk
The most prevalent vehicle ownership categories in Lake Mohawk are males with 2 vehicles (233, accounting for 53.8%) and females with 2 vehicles (100, making up 91.7%).
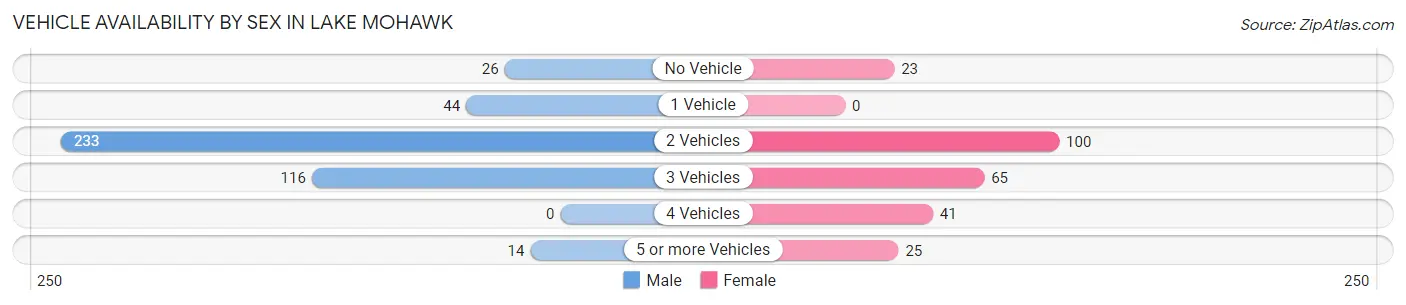
| Vehicles Available | Male | Female |
| No Vehicle | 26 (6.0%) | 23 (9.1%) |
| 1 Vehicle | 44 (10.2%) | 0 (0.0%) |
| 2 Vehicles | 233 (53.8%) | 100 (39.4%) |
| 3 Vehicles | 116 (26.8%) | 65 (25.6%) |
| 4 Vehicles | 0 (0.0%) | 41 (16.1%) |
| 5 or more Vehicles | 14 (3.2%) | 25 (9.8%) |
| Total | 433 (100.0%) | 254 (100.0%) |
Commute Time in Lake Mohawk
The most frequently occuring commute durations in Lake Mohawk are 60 to 89 minutes (103 commuters, 16.4%), 35 to 39 minutes (91 commuters, 14.5%), and 40 to 44 minutes (83 commuters, 13.2%).
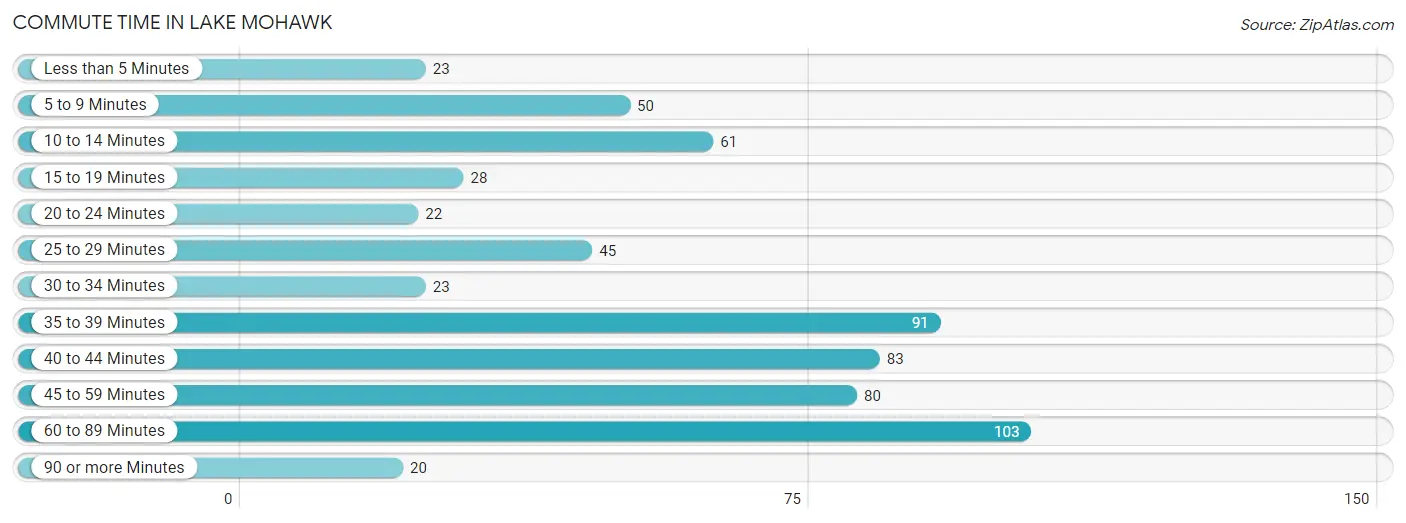
| Commute Time | # Commuters | % Commuters |
| Less than 5 Minutes | 23 | 3.7% |
| 5 to 9 Minutes | 50 | 8.0% |
| 10 to 14 Minutes | 61 | 9.7% |
| 15 to 19 Minutes | 28 | 4.4% |
| 20 to 24 Minutes | 22 | 3.5% |
| 25 to 29 Minutes | 45 | 7.1% |
| 30 to 34 Minutes | 23 | 3.7% |
| 35 to 39 Minutes | 91 | 14.5% |
| 40 to 44 Minutes | 83 | 13.2% |
| 45 to 59 Minutes | 80 | 12.7% |
| 60 to 89 Minutes | 103 | 16.4% |
| 90 or more Minutes | 20 | 3.2% |
Commute Time by Sex in Lake Mohawk
The most common commute times in Lake Mohawk are 60 to 89 minutes (62 commuters, 16.5%) for males and 40 to 44 minutes (52 commuters, 20.5%) for females.
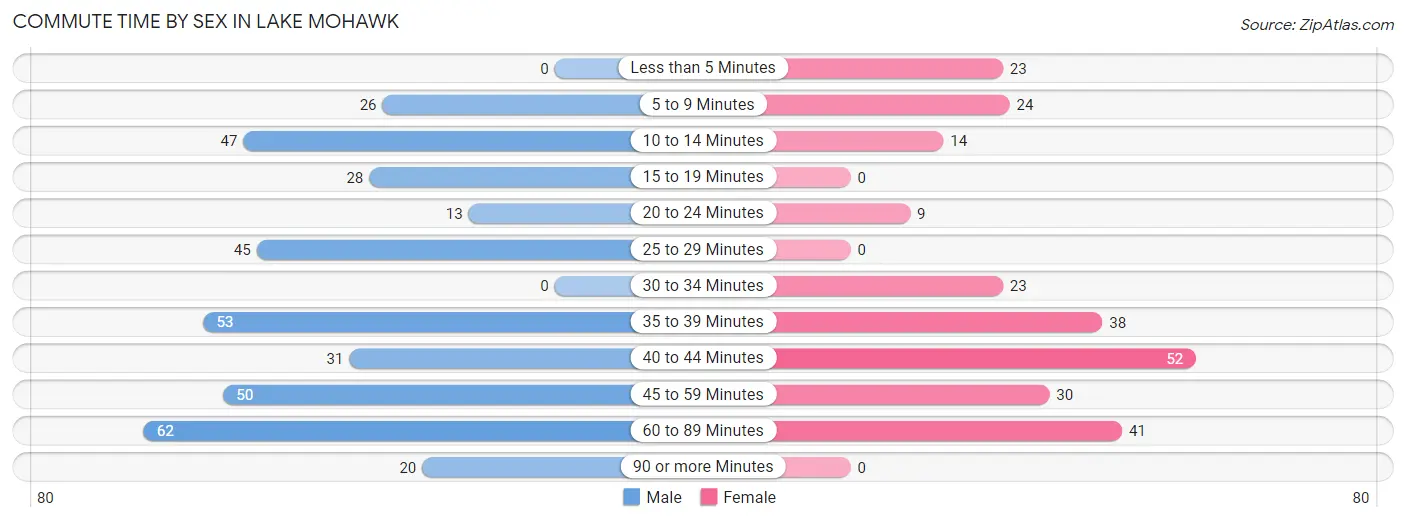
| Commute Time | Male | Female |
| Less than 5 Minutes | 0 (0.0%) | 23 (9.1%) |
| 5 to 9 Minutes | 26 (6.9%) | 24 (9.5%) |
| 10 to 14 Minutes | 47 (12.5%) | 14 (5.5%) |
| 15 to 19 Minutes | 28 (7.5%) | 0 (0.0%) |
| 20 to 24 Minutes | 13 (3.5%) | 9 (3.5%) |
| 25 to 29 Minutes | 45 (12.0%) | 0 (0.0%) |
| 30 to 34 Minutes | 0 (0.0%) | 23 (9.1%) |
| 35 to 39 Minutes | 53 (14.1%) | 38 (15.0%) |
| 40 to 44 Minutes | 31 (8.3%) | 52 (20.5%) |
| 45 to 59 Minutes | 50 (13.3%) | 30 (11.8%) |
| 60 to 89 Minutes | 62 (16.5%) | 41 (16.1%) |
| 90 or more Minutes | 20 (5.3%) | 0 (0.0%) |
Time of Departure to Work by Sex in Lake Mohawk
The most frequent times of departure to work in Lake Mohawk are 8:00 AM to 8:29 AM (115, 30.7%) for males and 8:00 AM to 8:29 AM (74, 29.1%) for females.
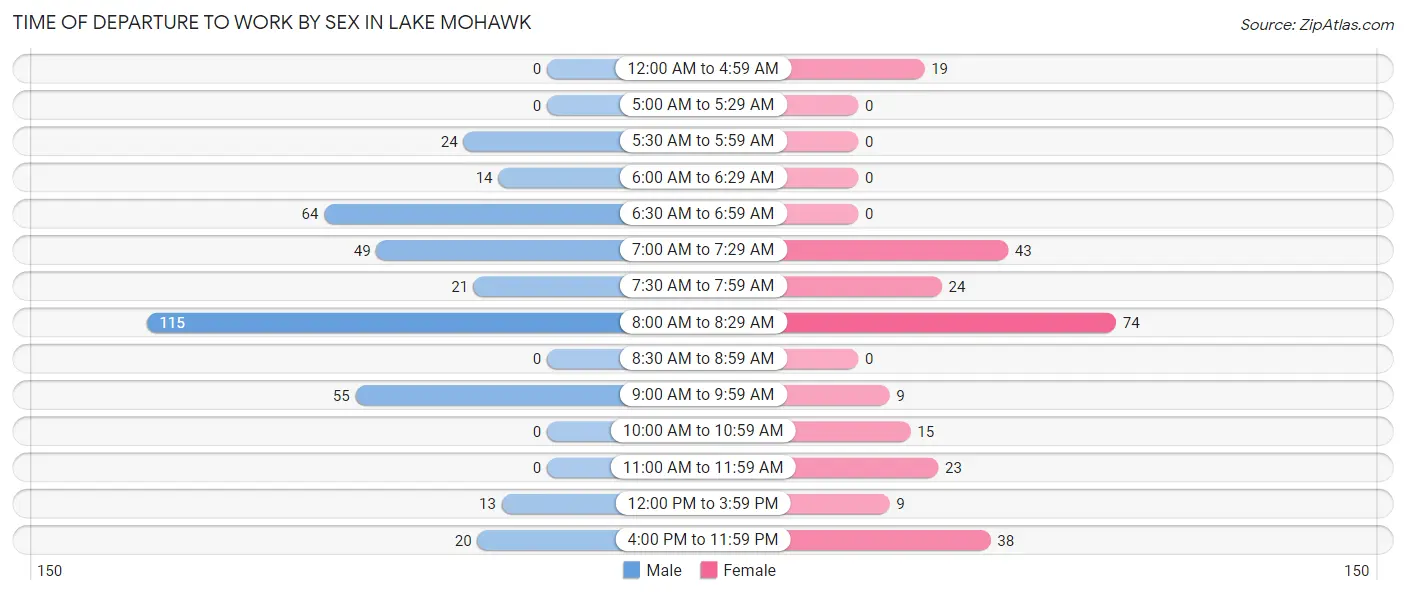
| Time of Departure | Male | Female |
| 12:00 AM to 4:59 AM | 0 (0.0%) | 19 (7.5%) |
| 5:00 AM to 5:29 AM | 0 (0.0%) | 0 (0.0%) |
| 5:30 AM to 5:59 AM | 24 (6.4%) | 0 (0.0%) |
| 6:00 AM to 6:29 AM | 14 (3.7%) | 0 (0.0%) |
| 6:30 AM to 6:59 AM | 64 (17.1%) | 0 (0.0%) |
| 7:00 AM to 7:29 AM | 49 (13.1%) | 43 (16.9%) |
| 7:30 AM to 7:59 AM | 21 (5.6%) | 24 (9.5%) |
| 8:00 AM to 8:29 AM | 115 (30.7%) | 74 (29.1%) |
| 8:30 AM to 8:59 AM | 0 (0.0%) | 0 (0.0%) |
| 9:00 AM to 9:59 AM | 55 (14.7%) | 9 (3.5%) |
| 10:00 AM to 10:59 AM | 0 (0.0%) | 15 (5.9%) |
| 11:00 AM to 11:59 AM | 0 (0.0%) | 23 (9.1%) |
| 12:00 PM to 3:59 PM | 13 (3.5%) | 9 (3.5%) |
| 4:00 PM to 11:59 PM | 20 (5.3%) | 38 (15.0%) |
| Total | 375 (100.0%) | 254 (100.0%) |
Housing Occupancy in Lake Mohawk
Occupancy by Ownership in Lake Mohawk
Of the total 715 dwellings in Lake Mohawk, owner-occupied units account for 707 (98.9%), while renter-occupied units make up 8 (1.1%).
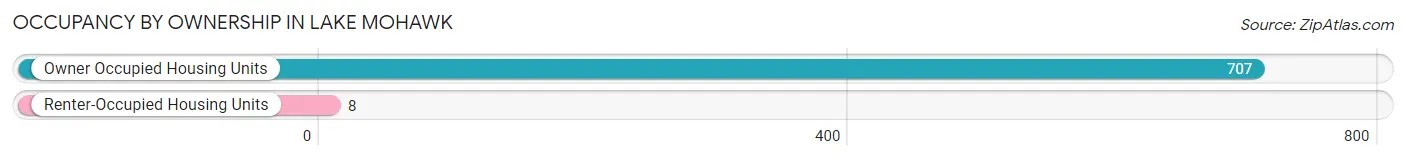
| Occupancy | # Housing Units | % Housing Units |
| Owner Occupied Housing Units | 707 | 98.9% |
| Renter-Occupied Housing Units | 8 | 1.1% |
| Total Occupied Housing Units | 715 | 100.0% |
Occupancy by Household Size in Lake Mohawk
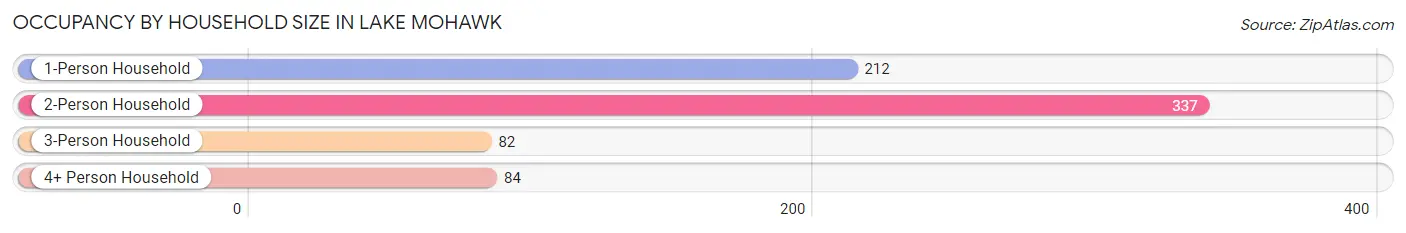
| Household Size | # Housing Units | % Housing Units |
| 1-Person Household | 212 | 29.6% |
| 2-Person Household | 337 | 47.1% |
| 3-Person Household | 82 | 11.5% |
| 4+ Person Household | 84 | 11.7% |
| Total Housing Units | 715 | 100.0% |
Occupancy by Ownership by Household Size in Lake Mohawk
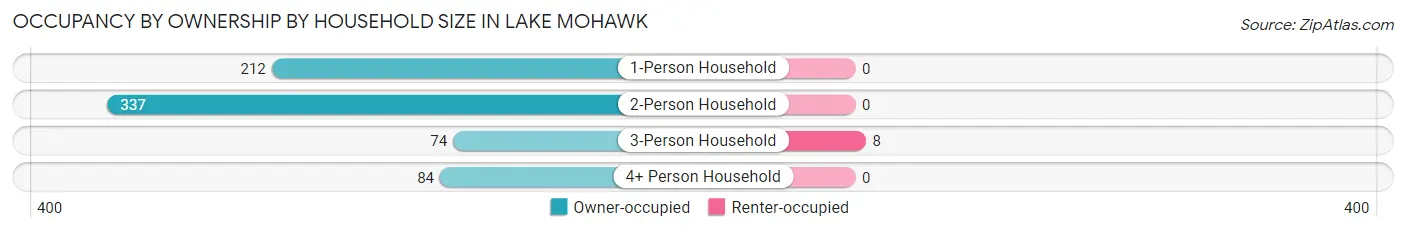
| Household Size | Owner-occupied | Renter-occupied |
| 1-Person Household | 212 (100.0%) | 0 (0.0%) |
| 2-Person Household | 337 (100.0%) | 0 (0.0%) |
| 3-Person Household | 74 (90.2%) | 8 (9.8%) |
| 4+ Person Household | 84 (100.0%) | 0 (0.0%) |
| Total Housing Units | 707 (98.9%) | 8 (1.1%) |
Occupancy by Educational Attainment in Lake Mohawk
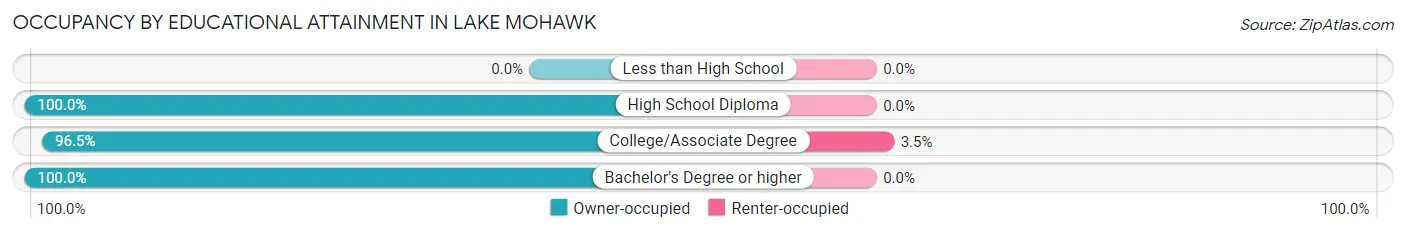
| Household Size | Owner-occupied | Renter-occupied |
| Less than High School | 0 (0.0%) | 0 (0.0%) |
| High School Diploma | 186 (100.0%) | 0 (0.0%) |
| College/Associate Degree | 222 (96.5%) | 8 (3.5%) |
| Bachelor's Degree or higher | 299 (100.0%) | 0 (0.0%) |
Occupancy by Age of Householder in Lake Mohawk
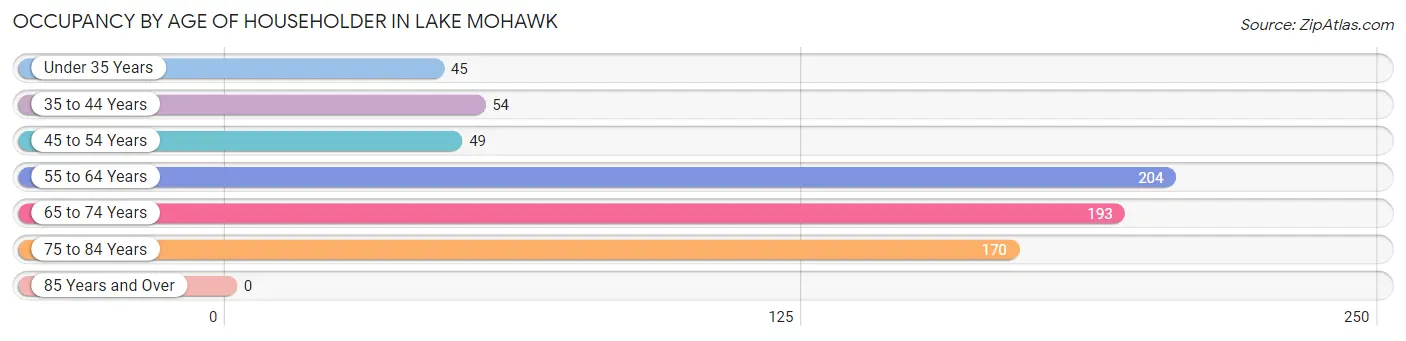
| Age Bracket | # Households | % Households |
| Under 35 Years | 45 | 6.3% |
| 35 to 44 Years | 54 | 7.5% |
| 45 to 54 Years | 49 | 6.9% |
| 55 to 64 Years | 204 | 28.5% |
| 65 to 74 Years | 193 | 27.0% |
| 75 to 84 Years | 170 | 23.8% |
| 85 Years and Over | 0 | 0.0% |
| Total | 715 | 100.0% |
Housing Finances in Lake Mohawk
Median Income by Occupancy in Lake Mohawk
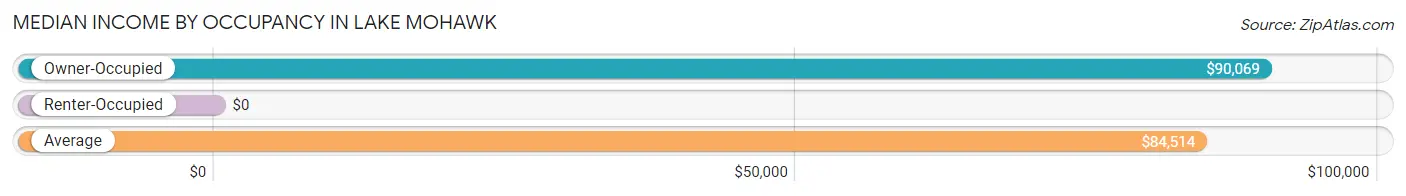
| Occupancy Type | # Households | Median Income |
| Owner-Occupied | 707 (98.9%) | $90,069 |
| Renter-Occupied | 8 (1.1%) | $0 |
| Average | 715 (100.0%) | $84,514 |
Occupancy by Householder Income Bracket in Lake Mohawk
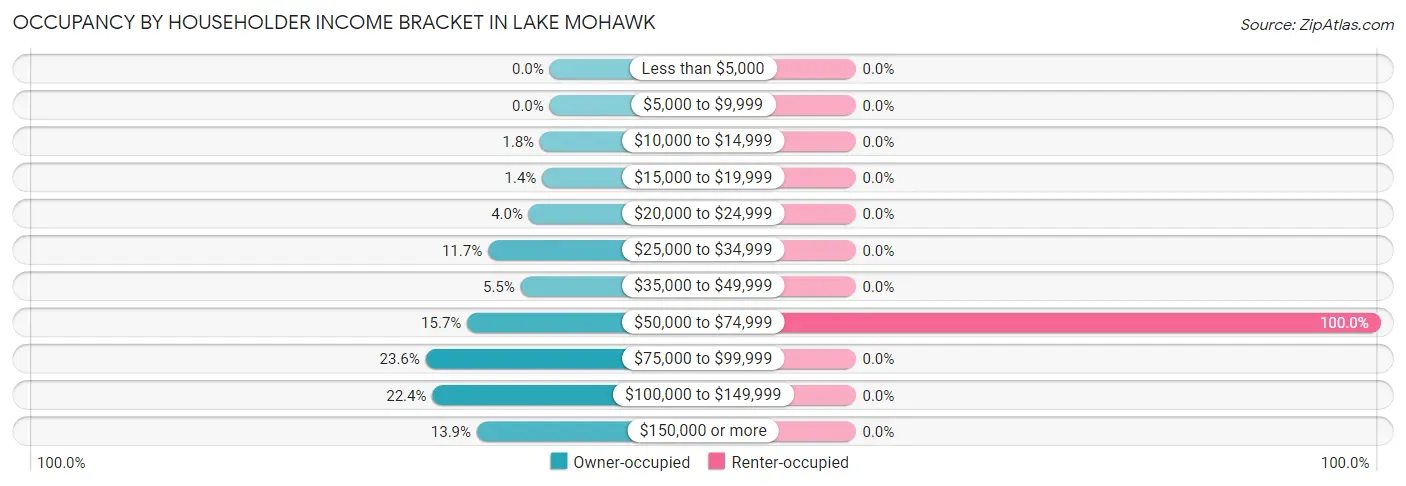
| Income Bracket | Owner-occupied | Renter-occupied |
| Less than $5,000 | 0 (0.0%) | 0 (0.0%) |
| $5,000 to $9,999 | 0 (0.0%) | 0 (0.0%) |
| $10,000 to $14,999 | 13 (1.8%) | 0 (0.0%) |
| $15,000 to $19,999 | 10 (1.4%) | 0 (0.0%) |
| $20,000 to $24,999 | 28 (4.0%) | 0 (0.0%) |
| $25,000 to $34,999 | 83 (11.7%) | 0 (0.0%) |
| $35,000 to $49,999 | 39 (5.5%) | 0 (0.0%) |
| $50,000 to $74,999 | 111 (15.7%) | 8 (100.0%) |
| $75,000 to $99,999 | 167 (23.6%) | 0 (0.0%) |
| $100,000 to $149,999 | 158 (22.4%) | 0 (0.0%) |
| $150,000 or more | 98 (13.9%) | 0 (0.0%) |
| Total | 707 (100.0%) | 8 (100.0%) |
Monthly Housing Cost Tiers in Lake Mohawk
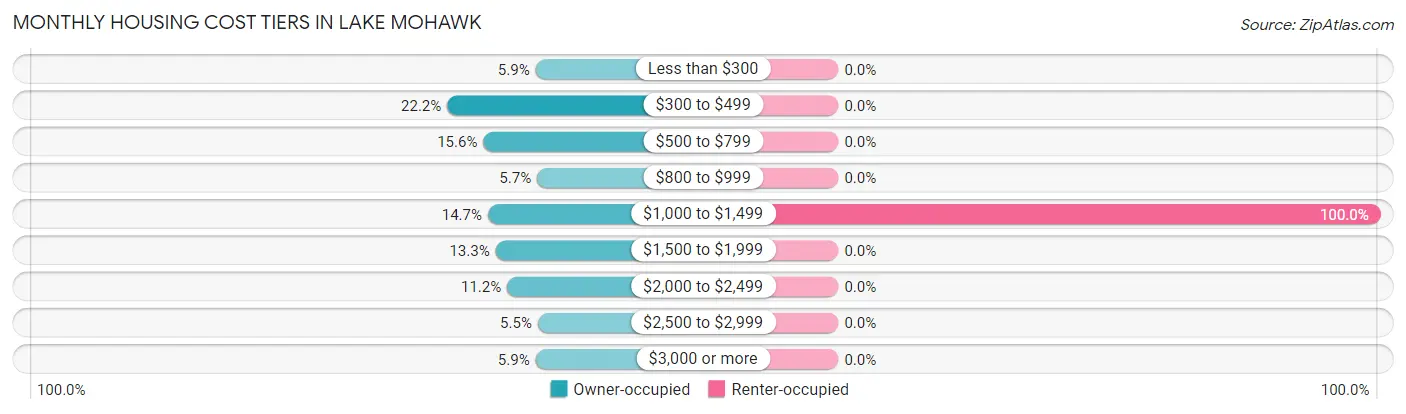
| Monthly Cost | Owner-occupied | Renter-occupied |
| Less than $300 | 42 (5.9%) | 0 (0.0%) |
| $300 to $499 | 157 (22.2%) | 0 (0.0%) |
| $500 to $799 | 110 (15.6%) | 0 (0.0%) |
| $800 to $999 | 40 (5.7%) | 0 (0.0%) |
| $1,000 to $1,499 | 104 (14.7%) | 8 (100.0%) |
| $1,500 to $1,999 | 94 (13.3%) | 0 (0.0%) |
| $2,000 to $2,499 | 79 (11.2%) | 0 (0.0%) |
| $2,500 to $2,999 | 39 (5.5%) | 0 (0.0%) |
| $3,000 or more | 42 (5.9%) | 0 (0.0%) |
| Total | 707 (100.0%) | 8 (100.0%) |
Physical Housing Characteristics in Lake Mohawk
Housing Structures in Lake Mohawk
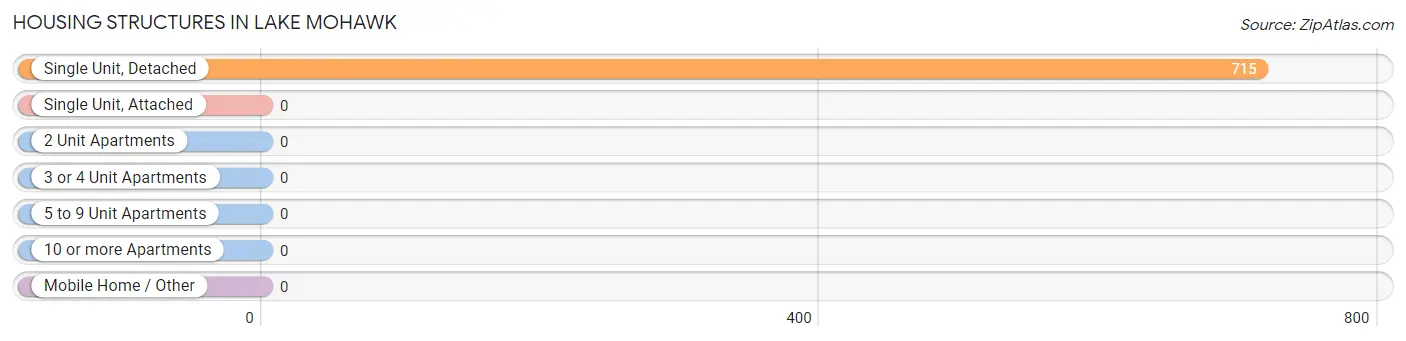
| Structure Type | # Housing Units | % Housing Units |
| Single Unit, Detached | 715 | 100.0% |
| Single Unit, Attached | 0 | 0.0% |
| 2 Unit Apartments | 0 | 0.0% |
| 3 or 4 Unit Apartments | 0 | 0.0% |
| 5 to 9 Unit Apartments | 0 | 0.0% |
| 10 or more Apartments | 0 | 0.0% |
| Mobile Home / Other | 0 | 0.0% |
| Total | 715 | 100.0% |
Housing Structures by Occupancy in Lake Mohawk
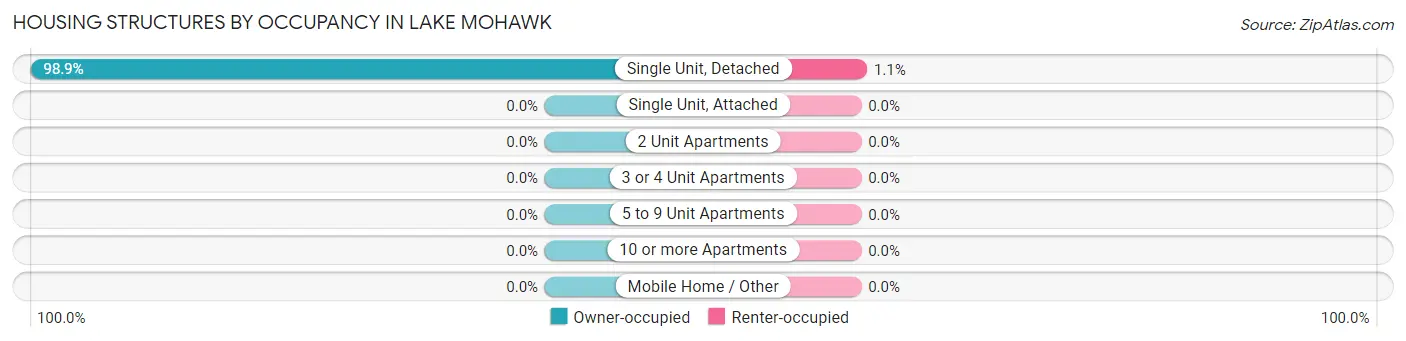
| Structure Type | Owner-occupied | Renter-occupied |
| Single Unit, Detached | 707 (98.9%) | 8 (1.1%) |
| Single Unit, Attached | 0 (0.0%) | 0 (0.0%) |
| 2 Unit Apartments | 0 (0.0%) | 0 (0.0%) |
| 3 or 4 Unit Apartments | 0 (0.0%) | 0 (0.0%) |
| 5 to 9 Unit Apartments | 0 (0.0%) | 0 (0.0%) |
| 10 or more Apartments | 0 (0.0%) | 0 (0.0%) |
| Mobile Home / Other | 0 (0.0%) | 0 (0.0%) |
| Total | 707 (98.9%) | 8 (1.1%) |
Housing Structures by Number of Rooms in Lake Mohawk
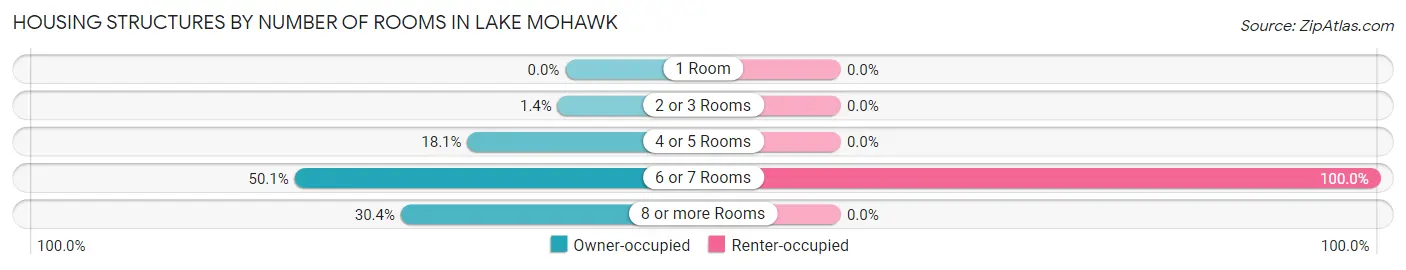
| Number of Rooms | Owner-occupied | Renter-occupied |
| 1 Room | 0 (0.0%) | 0 (0.0%) |
| 2 or 3 Rooms | 10 (1.4%) | 0 (0.0%) |
| 4 or 5 Rooms | 128 (18.1%) | 0 (0.0%) |
| 6 or 7 Rooms | 354 (50.1%) | 8 (100.0%) |
| 8 or more Rooms | 215 (30.4%) | 0 (0.0%) |
| Total | 707 (100.0%) | 8 (100.0%) |
Housing Structure by Heating Type in Lake Mohawk
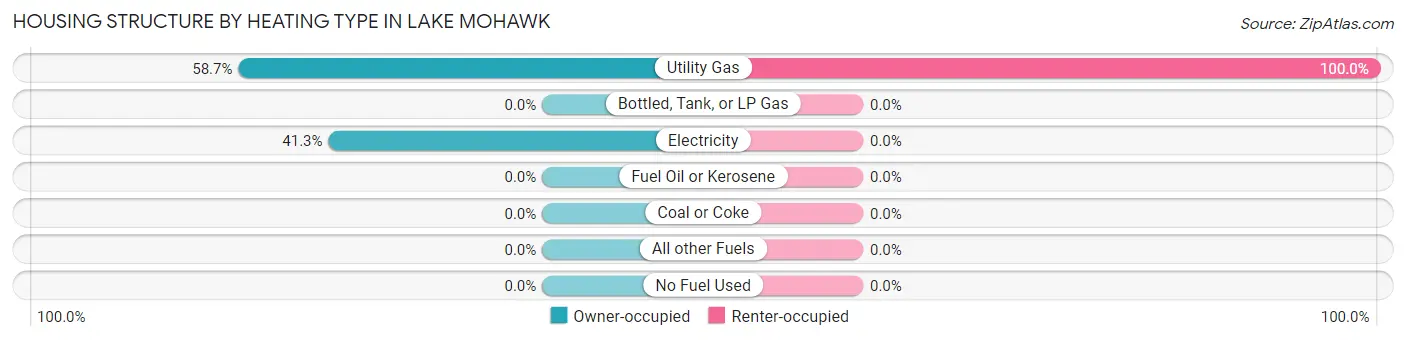
| Heating Type | Owner-occupied | Renter-occupied |
| Utility Gas | 415 (58.7%) | 8 (100.0%) |
| Bottled, Tank, or LP Gas | 0 (0.0%) | 0 (0.0%) |
| Electricity | 292 (41.3%) | 0 (0.0%) |
| Fuel Oil or Kerosene | 0 (0.0%) | 0 (0.0%) |
| Coal or Coke | 0 (0.0%) | 0 (0.0%) |
| All other Fuels | 0 (0.0%) | 0 (0.0%) |
| No Fuel Used | 0 (0.0%) | 0 (0.0%) |
| Total | 707 (100.0%) | 8 (100.0%) |
Household Vehicle Usage in Lake Mohawk
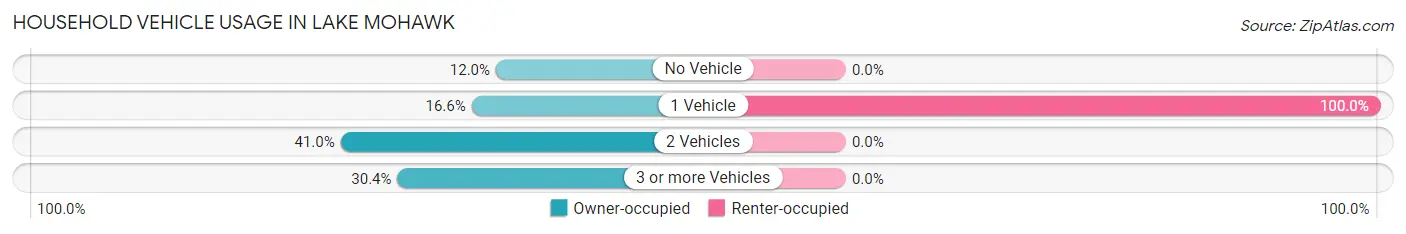
| Vehicles per Household | Owner-occupied | Renter-occupied |
| No Vehicle | 85 (12.0%) | 0 (0.0%) |
| 1 Vehicle | 117 (16.6%) | 8 (100.0%) |
| 2 Vehicles | 290 (41.0%) | 0 (0.0%) |
| 3 or more Vehicles | 215 (30.4%) | 0 (0.0%) |
| Total | 707 (100.0%) | 8 (100.0%) |
Real Estate & Mortgages in Lake Mohawk
Real Estate and Mortgage Overview in Lake Mohawk
| Characteristic | Without Mortgage | With Mortgage |
| Housing Units | 309 | 398 |
| Median Property Value | $162,100 | $306,700 |
| Median Household Income | $72,723 | $78 |
| Monthly Housing Costs | $449 | $42 |
| Real Estate Taxes | $1,930 | $0 |
Property Value by Mortgage Status in Lake Mohawk
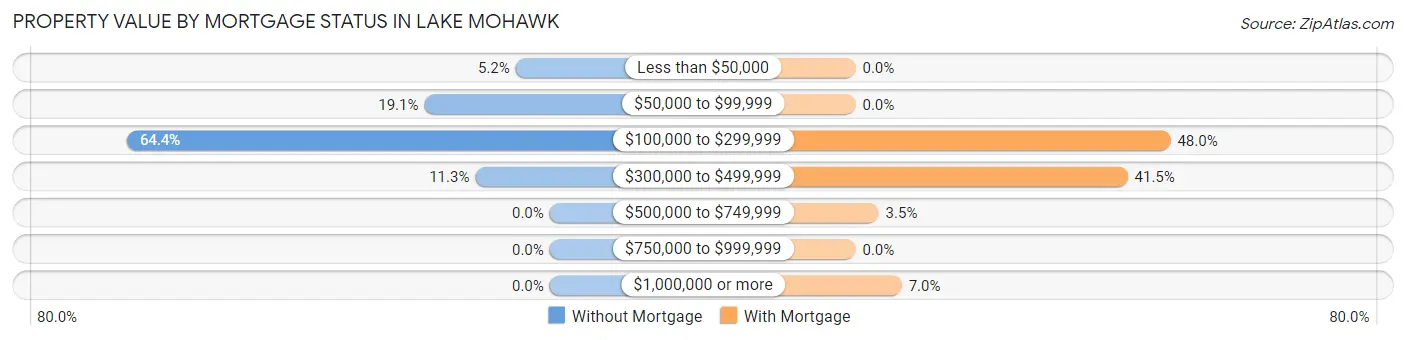
| Property Value | Without Mortgage | With Mortgage |
| Less than $50,000 | 16 (5.2%) | 0 (0.0%) |
| $50,000 to $99,999 | 59 (19.1%) | 0 (0.0%) |
| $100,000 to $299,999 | 199 (64.4%) | 191 (48.0%) |
| $300,000 to $499,999 | 35 (11.3%) | 165 (41.5%) |
| $500,000 to $749,999 | 0 (0.0%) | 14 (3.5%) |
| $750,000 to $999,999 | 0 (0.0%) | 0 (0.0%) |
| $1,000,000 or more | 0 (0.0%) | 28 (7.0%) |
| Total | 309 (100.0%) | 398 (100.0%) |
Household Income by Mortgage Status in Lake Mohawk
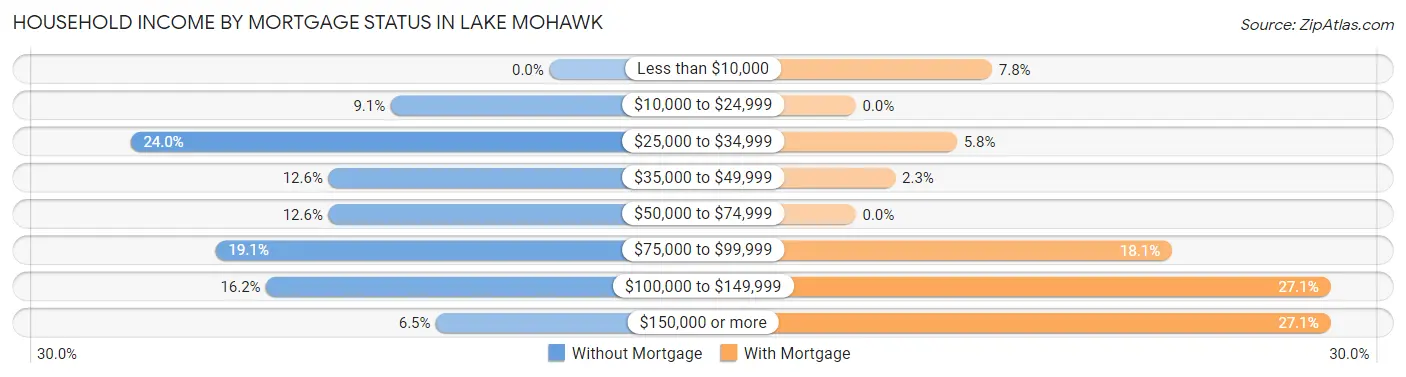
| Household Income | Without Mortgage | With Mortgage |
| Less than $10,000 | 0 (0.0%) | 31 (7.8%) |
| $10,000 to $24,999 | 28 (9.1%) | 0 (0.0%) |
| $25,000 to $34,999 | 74 (23.9%) | 23 (5.8%) |
| $35,000 to $49,999 | 39 (12.6%) | 9 (2.3%) |
| $50,000 to $74,999 | 39 (12.6%) | 0 (0.0%) |
| $75,000 to $99,999 | 59 (19.1%) | 72 (18.1%) |
| $100,000 to $149,999 | 50 (16.2%) | 108 (27.1%) |
| $150,000 or more | 20 (6.5%) | 108 (27.1%) |
| Total | 309 (100.0%) | 398 (100.0%) |
Property Value to Household Income Ratio in Lake Mohawk
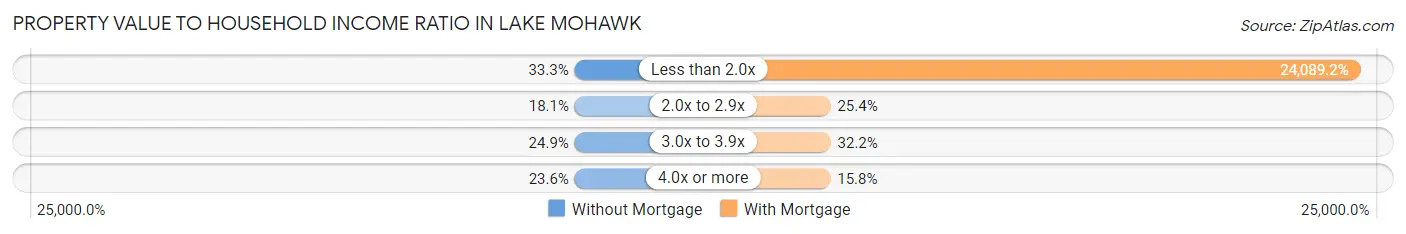
| Value-to-Income Ratio | Without Mortgage | With Mortgage |
| Less than 2.0x | 103 (33.3%) | 95,875 (24,089.2%) |
| 2.0x to 2.9x | 56 (18.1%) | 101 (25.4%) |
| 3.0x to 3.9x | 77 (24.9%) | 128 (32.2%) |
| 4.0x or more | 73 (23.6%) | 63 (15.8%) |
| Total | 309 (100.0%) | 398 (100.0%) |
Real Estate Taxes by Mortgage Status in Lake Mohawk
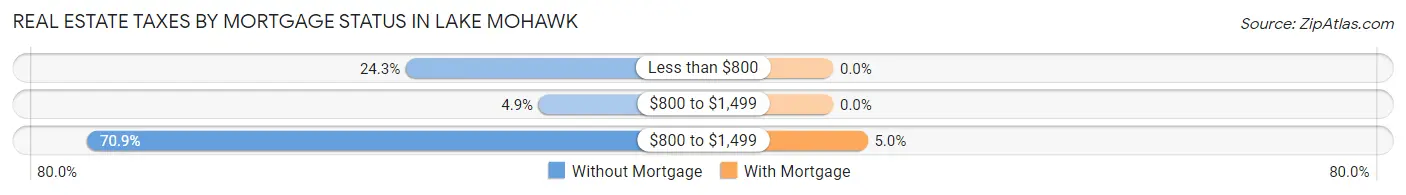
| Property Taxes | Without Mortgage | With Mortgage |
| Less than $800 | 75 (24.3%) | 0 (0.0%) |
| $800 to $1,499 | 15 (4.9%) | 0 (0.0%) |
| $800 to $1,499 | 219 (70.9%) | 20 (5.0%) |
| Total | 309 (100.0%) | 398 (100.0%) |
Health & Disability in Lake Mohawk
Health Insurance Coverage by Age in Lake Mohawk
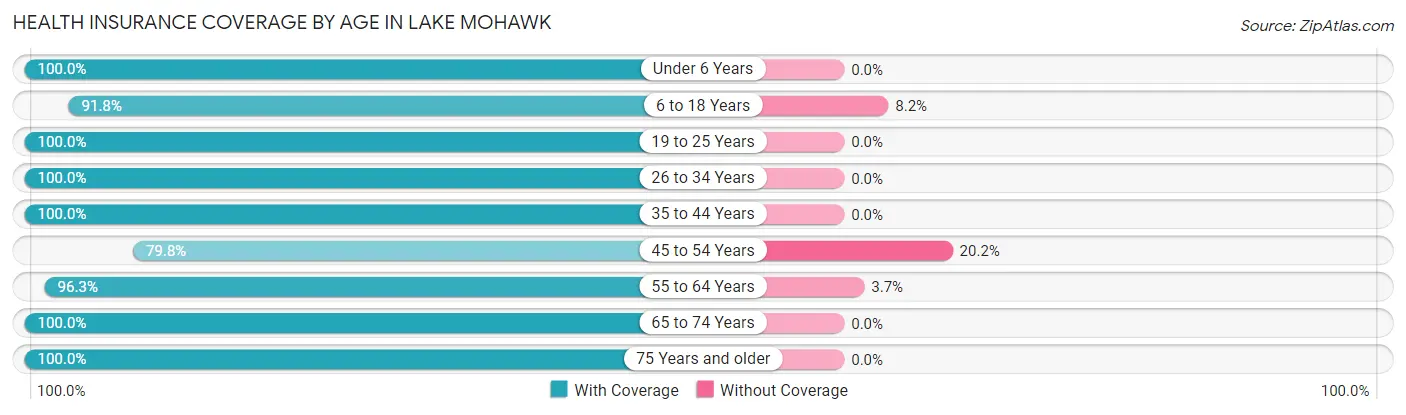
| Age Bracket | With Coverage | Without Coverage |
| Under 6 Years | 80 (100.0%) | 0 (0.0%) |
| 6 to 18 Years | 123 (91.8%) | 11 (8.2%) |
| 19 to 25 Years | 46 (100.0%) | 0 (0.0%) |
| 26 to 34 Years | 61 (100.0%) | 0 (0.0%) |
| 35 to 44 Years | 135 (100.0%) | 0 (0.0%) |
| 45 to 54 Years | 75 (79.8%) | 19 (20.2%) |
| 55 to 64 Years | 309 (96.3%) | 12 (3.7%) |
| 65 to 74 Years | 377 (100.0%) | 0 (0.0%) |
| 75 Years and older | 226 (100.0%) | 0 (0.0%) |
| Total | 1,432 (97.2%) | 42 (2.9%) |
Health Insurance Coverage by Citizenship Status in Lake Mohawk
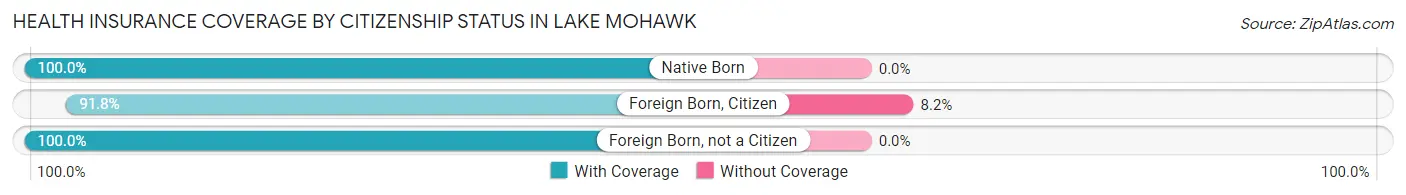
| Citizenship Status | With Coverage | Without Coverage |
| Native Born | 80 (100.0%) | 0 (0.0%) |
| Foreign Born, Citizen | 123 (91.8%) | 11 (8.2%) |
| Foreign Born, not a Citizen | 46 (100.0%) | 0 (0.0%) |
Health Insurance Coverage by Household Income in Lake Mohawk
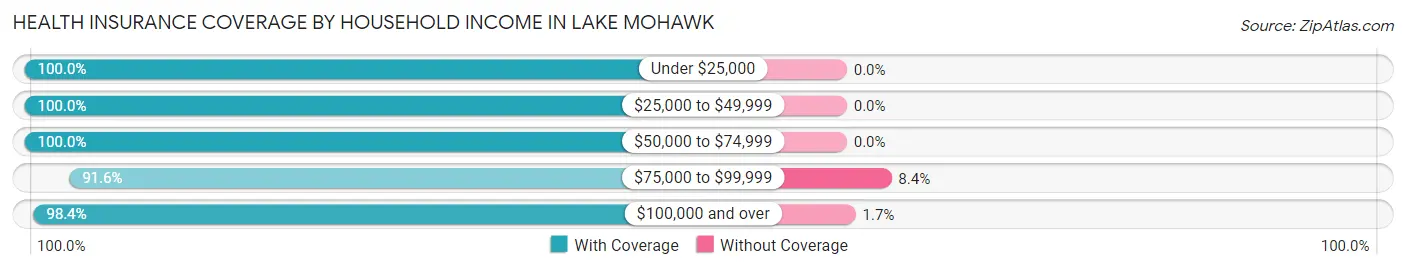
| Household Income | With Coverage | Without Coverage |
| Under $25,000 | 51 (100.0%) | 0 (0.0%) |
| $25,000 to $49,999 | 153 (100.0%) | 0 (0.0%) |
| $50,000 to $74,999 | 233 (100.0%) | 0 (0.0%) |
| $75,000 to $99,999 | 340 (91.6%) | 31 (8.4%) |
| $100,000 and over | 655 (98.4%) | 11 (1.7%) |
Public vs Private Health Insurance Coverage by Age in Lake Mohawk
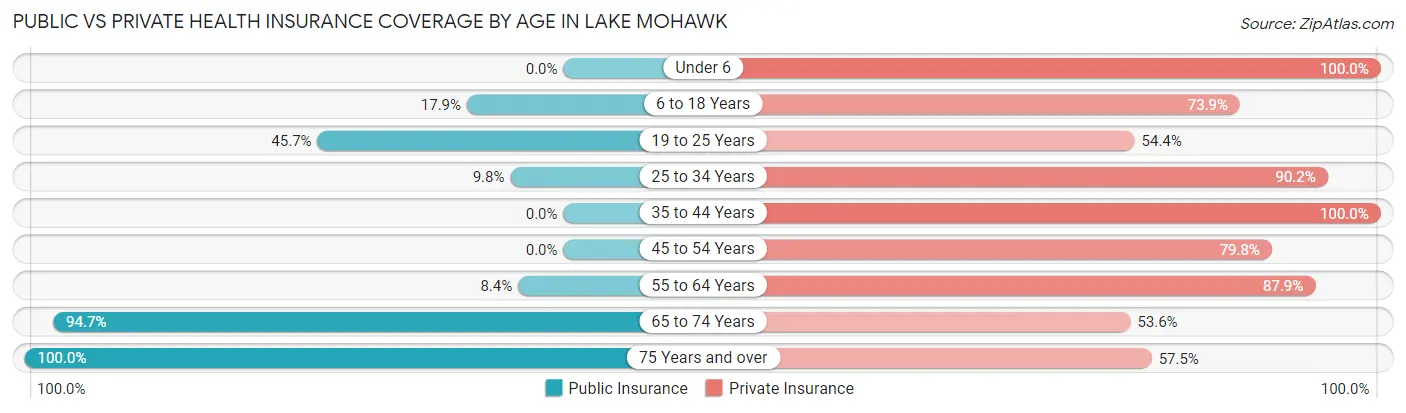
| Age Bracket | Public Insurance | Private Insurance |
| Under 6 | 0 (0.0%) | 80 (100.0%) |
| 6 to 18 Years | 24 (17.9%) | 99 (73.9%) |
| 19 to 25 Years | 21 (45.7%) | 25 (54.3%) |
| 25 to 34 Years | 6 (9.8%) | 55 (90.2%) |
| 35 to 44 Years | 0 (0.0%) | 135 (100.0%) |
| 45 to 54 Years | 0 (0.0%) | 75 (79.8%) |
| 55 to 64 Years | 27 (8.4%) | 282 (87.8%) |
| 65 to 74 Years | 357 (94.7%) | 202 (53.6%) |
| 75 Years and over | 226 (100.0%) | 130 (57.5%) |
| Total | 661 (44.8%) | 1,083 (73.5%) |
Disability Status by Sex by Age in Lake Mohawk
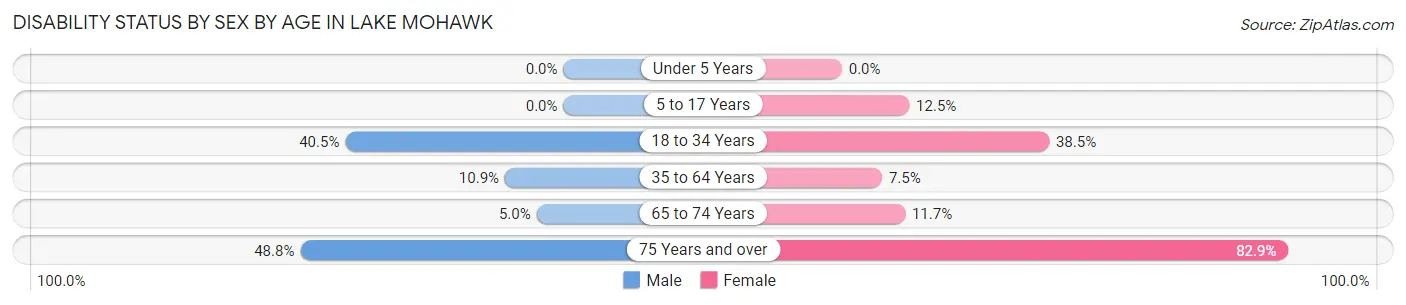
| Age Bracket | Male | Female |
| Under 5 Years | 0 (0.0%) | 0 (0.0%) |
| 5 to 17 Years | 0 (0.0%) | 15 (12.5%) |
| 18 to 34 Years | 17 (40.5%) | 25 (38.5%) |
| 35 to 64 Years | 32 (10.8%) | 19 (7.4%) |
| 65 to 74 Years | 9 (5.0%) | 23 (11.7%) |
| 75 Years and over | 42 (48.8%) | 116 (82.9%) |
Disability Class by Sex by Age in Lake Mohawk
Disability Class: Hearing Difficulty
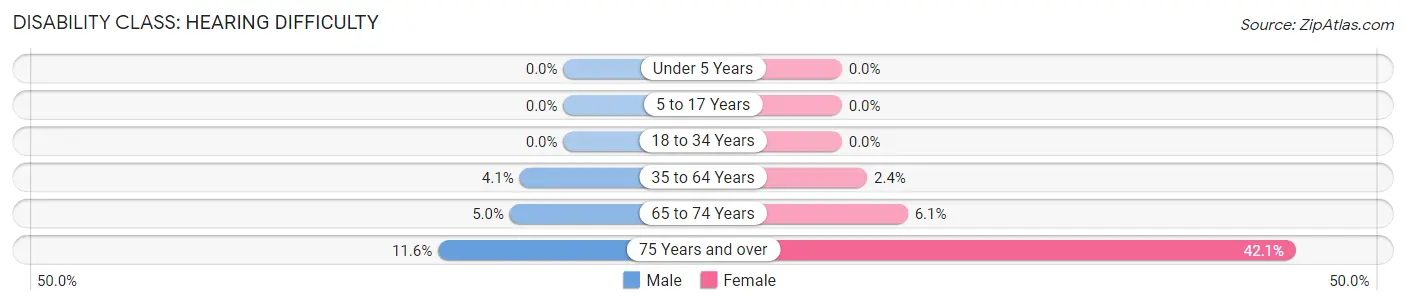
| Age Bracket | Male | Female |
| Under 5 Years | 0 (0.0%) | 0 (0.0%) |
| 5 to 17 Years | 0 (0.0%) | 0 (0.0%) |
| 18 to 34 Years | 0 (0.0%) | 0 (0.0%) |
| 35 to 64 Years | 12 (4.1%) | 6 (2.4%) |
| 65 to 74 Years | 9 (5.0%) | 12 (6.1%) |
| 75 Years and over | 10 (11.6%) | 59 (42.1%) |
Disability Class: Vision Difficulty
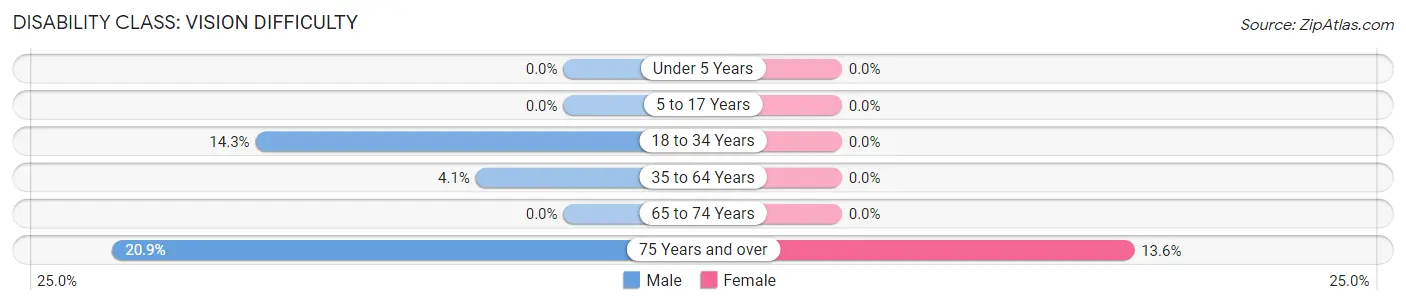
| Age Bracket | Male | Female |
| Under 5 Years | 0 (0.0%) | 0 (0.0%) |
| 5 to 17 Years | 0 (0.0%) | 0 (0.0%) |
| 18 to 34 Years | 6 (14.3%) | 0 (0.0%) |
| 35 to 64 Years | 12 (4.1%) | 0 (0.0%) |
| 65 to 74 Years | 0 (0.0%) | 0 (0.0%) |
| 75 Years and over | 18 (20.9%) | 19 (13.6%) |
Disability Class: Cognitive Difficulty
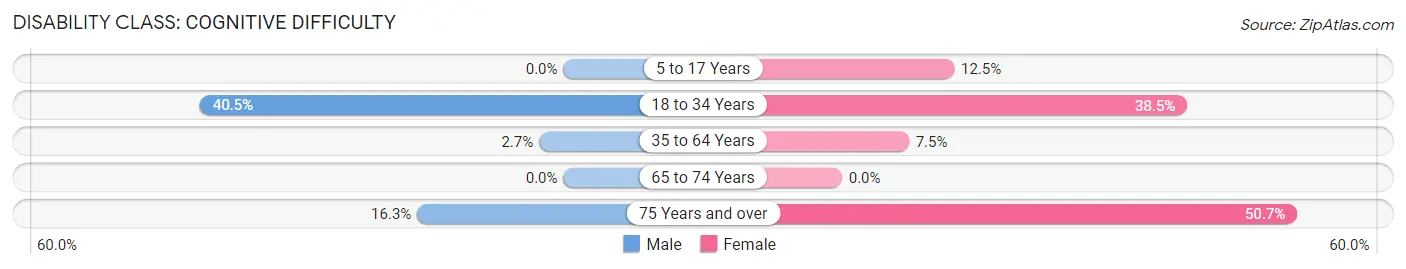
| Age Bracket | Male | Female |
| 5 to 17 Years | 0 (0.0%) | 15 (12.5%) |
| 18 to 34 Years | 17 (40.5%) | 25 (38.5%) |
| 35 to 64 Years | 8 (2.7%) | 19 (7.4%) |
| 65 to 74 Years | 0 (0.0%) | 0 (0.0%) |
| 75 Years and over | 14 (16.3%) | 71 (50.7%) |
Disability Class: Ambulatory Difficulty
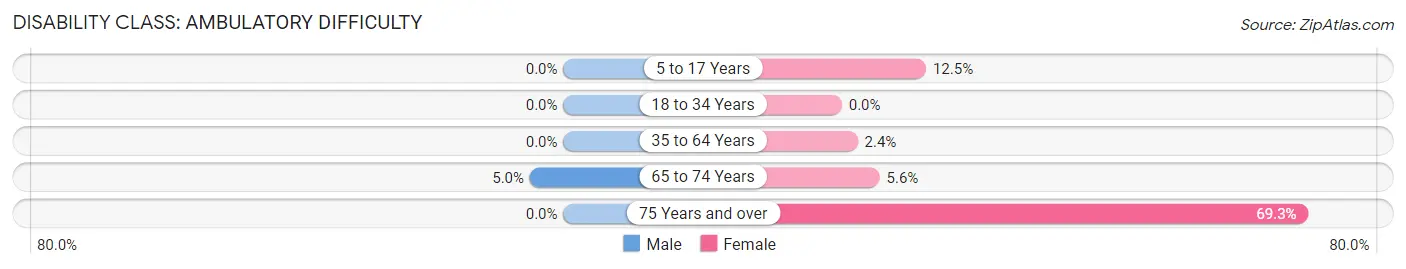
| Age Bracket | Male | Female |
| 5 to 17 Years | 0 (0.0%) | 15 (12.5%) |
| 18 to 34 Years | 0 (0.0%) | 0 (0.0%) |
| 35 to 64 Years | 0 (0.0%) | 6 (2.4%) |
| 65 to 74 Years | 9 (5.0%) | 11 (5.6%) |
| 75 Years and over | 0 (0.0%) | 97 (69.3%) |
Disability Class: Self-Care Difficulty
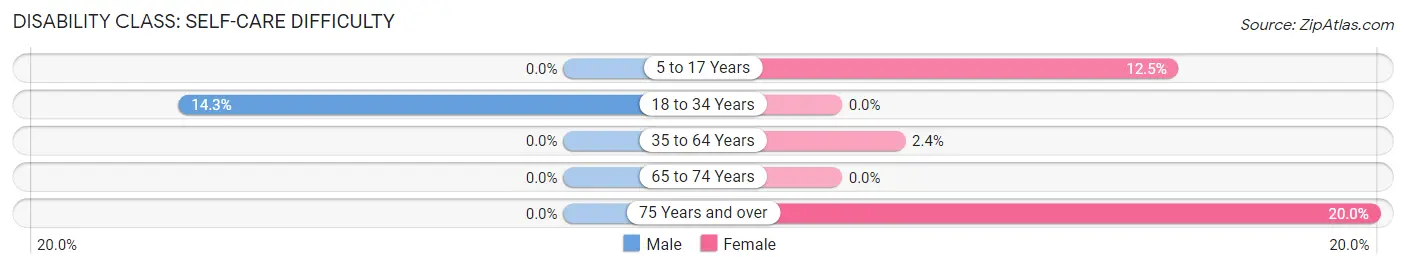
| Age Bracket | Male | Female |
| 5 to 17 Years | 0 (0.0%) | 15 (12.5%) |
| 18 to 34 Years | 6 (14.3%) | 0 (0.0%) |
| 35 to 64 Years | 0 (0.0%) | 6 (2.4%) |
| 65 to 74 Years | 0 (0.0%) | 0 (0.0%) |
| 75 Years and over | 0 (0.0%) | 28 (20.0%) |
Technology Access in Lake Mohawk
Computing Device Access in Lake Mohawk
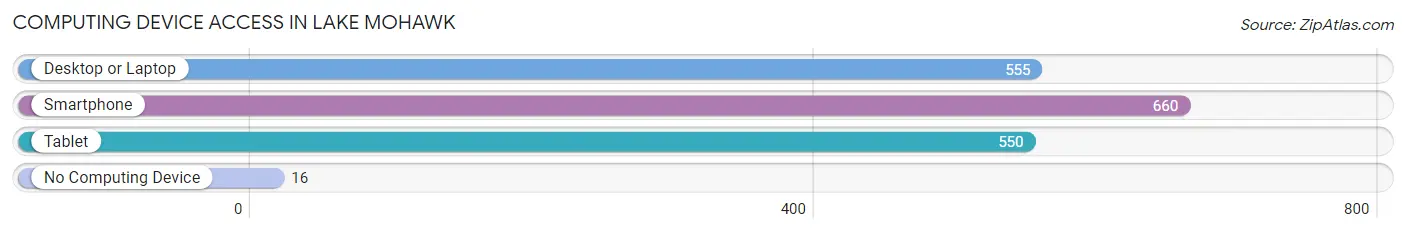
| Device Type | # Households | % Households |
| Desktop or Laptop | 555 | 77.6% |
| Smartphone | 660 | 92.3% |
| Tablet | 550 | 76.9% |
| No Computing Device | 16 | 2.2% |
| Total | 715 | 100.0% |
Internet Access in Lake Mohawk
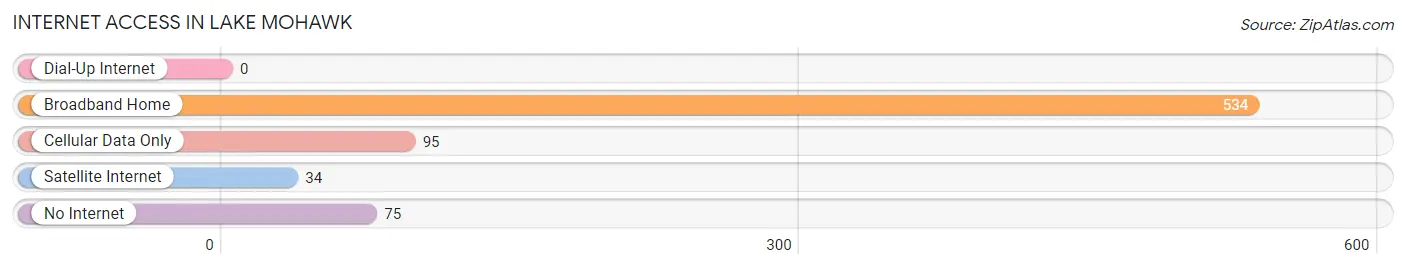
| Internet Type | # Households | % Households |
| Dial-Up Internet | 0 | 0.0% |
| Broadband Home | 534 | 74.7% |
| Cellular Data Only | 95 | 13.3% |
| Satellite Internet | 34 | 4.8% |
| No Internet | 75 | 10.5% |
| Total | 715 | 100.0% |
Lake Mohawk Summary
History
Lake Mohawk is a private residential community located in Stark County, Ohio. It was founded in 1925 by the Ohio Power Company, which was later acquired by American Electric Power. The community was designed to be a recreational area for the employees of the company. The community was designed by the Olmsted Brothers, a landscape architecture firm, and was modeled after a Swiss village. The community was designed to be a self-contained village with its own lake, beach, golf course, and other amenities.
The community was originally intended to be a summer resort, but it quickly became a year-round community. The community was designed to be a self-contained village with its own lake, beach, golf course, and other amenities. The community was designed to be a safe and secure place for families to live and enjoy the outdoors.
The community has grown over the years and now includes over 1,000 homes, a marina, a country club, and a variety of other amenities. The community is still owned and operated by American Electric Power and is governed by a board of trustees.
Geography
Lake Mohawk is located in Stark County, Ohio, approximately 25 miles south of Akron and 40 miles south of Cleveland. The community is situated on the western shore of the Mohawk Reservoir, which is part of the Muskingum River watershed. The community is surrounded by rolling hills and wooded areas, and is home to a variety of wildlife.
The community is divided into two sections, the North Shore and the South Shore. The North Shore is the more developed area of the community, with a variety of homes, businesses, and amenities. The South Shore is more rural, with fewer homes and businesses.
Economy
The economy of Lake Mohawk is largely based on tourism and recreation. The community is home to a variety of businesses, including restaurants, retail stores, and marinas. The community also has a variety of recreational activities, including golf, boating, fishing, and swimming.
The community is also home to a variety of manufacturing and industrial businesses. These businesses include a variety of metal fabrication and machining companies, as well as a variety of other businesses.
Demographics
As of the 2010 census, the population of Lake Mohawk was 1,845. The median age of the population was 48.7 years, and the median household income was $68,944. The racial makeup of the community was 97.3% White, 0.7% African American, 0.3% Native American, 0.3% Asian, and 1.4% from other races.
The community is largely a middle-class community, with a variety of housing options ranging from single-family homes to condominiums. The community is also home to a variety of businesses, including restaurants, retail stores, and marinas. The community is also home to a variety of recreational activities, including golf, boating, fishing, and swimming.
Common Questions
What is Per Capita Income in Lake Mohawk?
Per Capita income in Lake Mohawk is $50,087.
What is the Median Family Income in Lake Mohawk?
Median Family Income in Lake Mohawk is $101,726.
What is the Median Household income in Lake Mohawk?
Median Household Income in Lake Mohawk is $84,514.
What is Inequality or Gini Index in Lake Mohawk?
Inequality or Gini Index in Lake Mohawk is 0.39.
What is the Total Population of Lake Mohawk?
Total Population of Lake Mohawk is 1,474.
What is the Total Male Population of Lake Mohawk?
Total Male Population of Lake Mohawk is 698.
What is the Total Female Population of Lake Mohawk?
Total Female Population of Lake Mohawk is 776.
What is the Ratio of Males per 100 Females in Lake Mohawk?
There are 89.95 Males per 100 Females in Lake Mohawk.
What is the Ratio of Females per 100 Males in Lake Mohawk?
There are 111.17 Females per 100 Males in Lake Mohawk.
What is the Median Population Age in Lake Mohawk?
Median Population Age in Lake Mohawk is 61.4 Years.
What is the Average Family Size in Lake Mohawk
Average Family Size in Lake Mohawk is 2.5 People.
What is the Average Household Size in Lake Mohawk
Average Household Size in Lake Mohawk is 2.1 People.
How Large is the Labor Force in Lake Mohawk?
There are 687 People in the Labor Forcein in Lake Mohawk.
What is the Percentage of People in the Labor Force in Lake Mohawk?
53.0% of People are in the Labor Force in Lake Mohawk.