Beavercreek, OH Map & Demographics
Beavercreek Map
Beavercreek Overview
$52,173
PER CAPITA INCOME
$135,420
AVG FAMILY INCOME
$108,140
AVG HOUSEHOLD INCOME
27.4%
WAGE / INCOME GAP [ % ]
72.6¢/ $1
WAGE / INCOME GAP [ $ ]
$9,393
FAMILY INCOME DEFICIT
0.38
INEQUALITY / GINI INDEX
46,576
TOTAL POPULATION
23,209
MALE POPULATION
23,367
FEMALE POPULATION
99.32
MALES / 100 FEMALES
100.68
FEMALES / 100 MALES
41.1
MEDIAN AGE
2.9
AVG FAMILY SIZE
2.4
AVG HOUSEHOLD SIZE
24,661
LABOR FORCE [ PEOPLE ]
65.0%
PERCENT IN LABOR FORCE
2.8%
UNEMPLOYMENT RATE
Beavercreek Area Codes
Income in Beavercreek
Income Overview in Beavercreek
Per Capita Income in Beavercreek is $52,173, while median incomes of families and households are $135,420 and $108,140 respectively.
| Characteristic | Number | Measure |
| Per Capita Income | 46,576 | $52,173 |
| Median Family Income | 12,846 | $135,420 |
| Mean Family Income | 12,846 | $150,535 |
| Median Household Income | 18,891 | $108,140 |
| Mean Household Income | 18,891 | $127,709 |
| Income Deficit | 12,846 | $9,393 |
| Wage / Income Gap (%) | 46,576 | 27.38% |
| Wage / Income Gap ($) | 46,576 | 72.62¢ per $1 |
| Gini / Inequality Index | 46,576 | 0.38 |
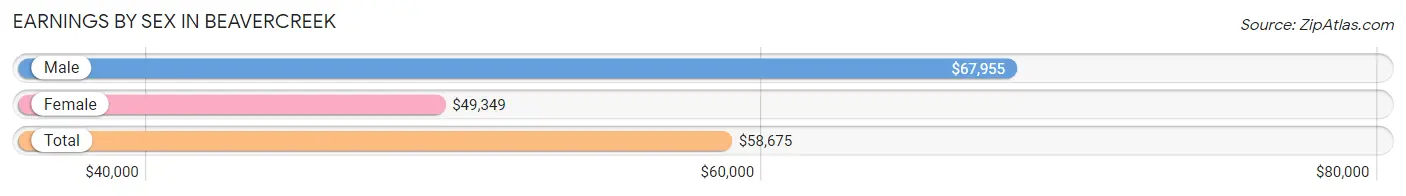
Earnings by Sex in Beavercreek
Average Earnings in Beavercreek are $58,675, $67,955 for men and $49,349 for women, a difference of 27.4%.
| Sex | Number | Average Earnings |
| Male | 14,383 (55.8%) | $67,955 |
| Female | 11,402 (44.2%) | $49,349 |
| Total | 25,785 (100.0%) | $58,675 |
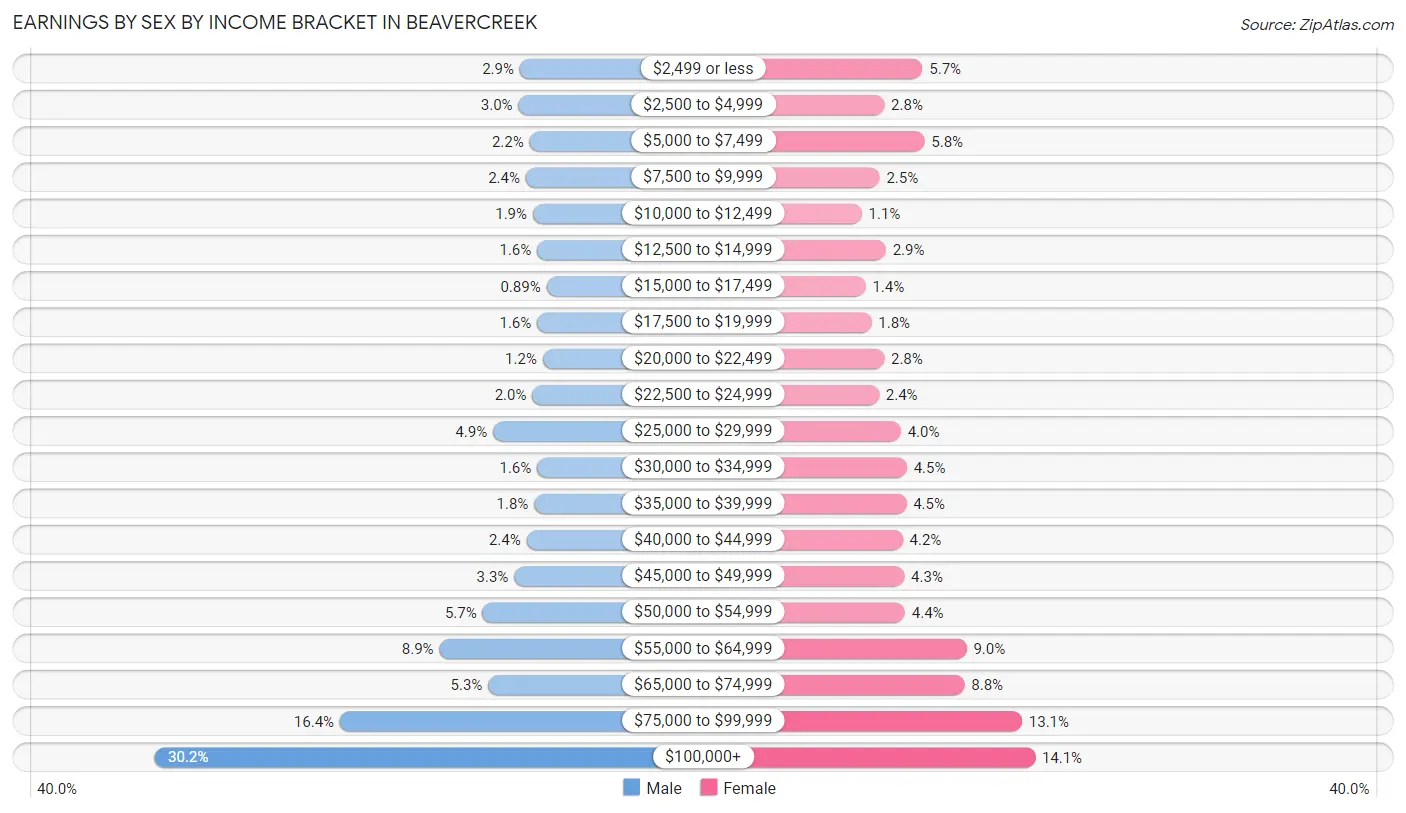
Earnings by Sex by Income Bracket in Beavercreek
The most common earnings brackets in Beavercreek are $100,000+ for men (4,346 | 30.2%) and $100,000+ for women (1,608 | 14.1%).
| Income | Male | Female |
| $2,499 or less | 416 (2.9%) | 645 (5.7%) |
| $2,500 to $4,999 | 430 (3.0%) | 319 (2.8%) |
| $5,000 to $7,499 | 310 (2.2%) | 663 (5.8%) |
| $7,500 to $9,999 | 351 (2.4%) | 279 (2.5%) |
| $10,000 to $12,499 | 274 (1.9%) | 127 (1.1%) |
| $12,500 to $14,999 | 229 (1.6%) | 333 (2.9%) |
| $15,000 to $17,499 | 128 (0.9%) | 160 (1.4%) |
| $17,500 to $19,999 | 228 (1.6%) | 210 (1.8%) |
| $20,000 to $22,499 | 169 (1.2%) | 318 (2.8%) |
| $22,500 to $24,999 | 280 (1.9%) | 274 (2.4%) |
| $25,000 to $29,999 | 705 (4.9%) | 461 (4.0%) |
| $30,000 to $34,999 | 228 (1.6%) | 512 (4.5%) |
| $35,000 to $39,999 | 260 (1.8%) | 507 (4.4%) |
| $40,000 to $44,999 | 343 (2.4%) | 477 (4.2%) |
| $45,000 to $49,999 | 476 (3.3%) | 490 (4.3%) |
| $50,000 to $54,999 | 817 (5.7%) | 496 (4.3%) |
| $55,000 to $64,999 | 1,282 (8.9%) | 1,023 (9.0%) |
| $65,000 to $74,999 | 756 (5.3%) | 1,004 (8.8%) |
| $75,000 to $99,999 | 2,355 (16.4%) | 1,496 (13.1%) |
| $100,000+ | 4,346 (30.2%) | 1,608 (14.1%) |
| Total | 14,383 (100.0%) | 11,402 (100.0%) |
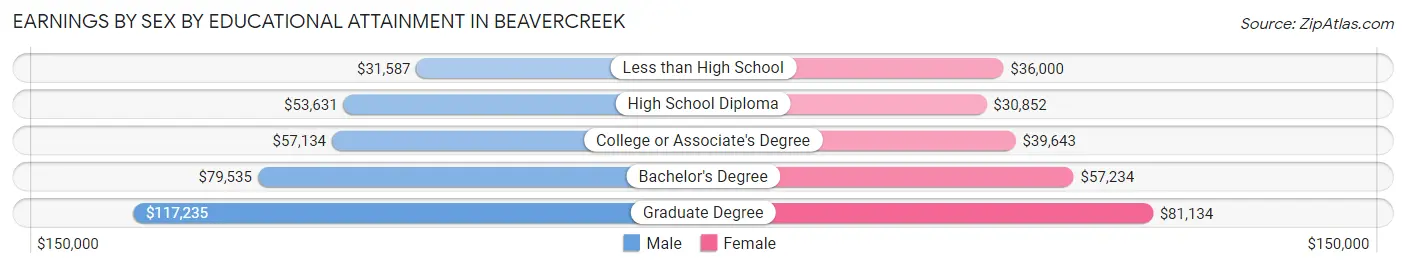
Earnings by Sex by Educational Attainment in Beavercreek
Average earnings in Beavercreek are $78,933 for men and $55,441 for women, a difference of 29.8%. Men with an educational attainment of graduate degree enjoy the highest average annual earnings of $117,235, while those with less than high school education earn the least with $31,587. Women with an educational attainment of graduate degree earn the most with the average annual earnings of $81,134, while those with high school diploma education have the smallest earnings of $30,852.
| Educational Attainment | Male Income | Female Income |
| Less than High School | $31,587 | $36,000 |
| High School Diploma | $53,631 | $30,852 |
| College or Associate's Degree | $57,134 | $39,643 |
| Bachelor's Degree | $79,535 | $57,234 |
| Graduate Degree | $117,235 | $81,134 |
| Total | $78,933 | $55,441 |
Family Income in Beavercreek
Family Income Brackets in Beavercreek
According to the Beavercreek family income data, there are 3,327 families falling into the $100,000 to $149,999 income range, which is the most common income bracket and makes up 25.9% of all families. Conversely, the $10,000 to $14,999 income bracket is the least frequent group with only 116 families (0.9%) belonging to this category.
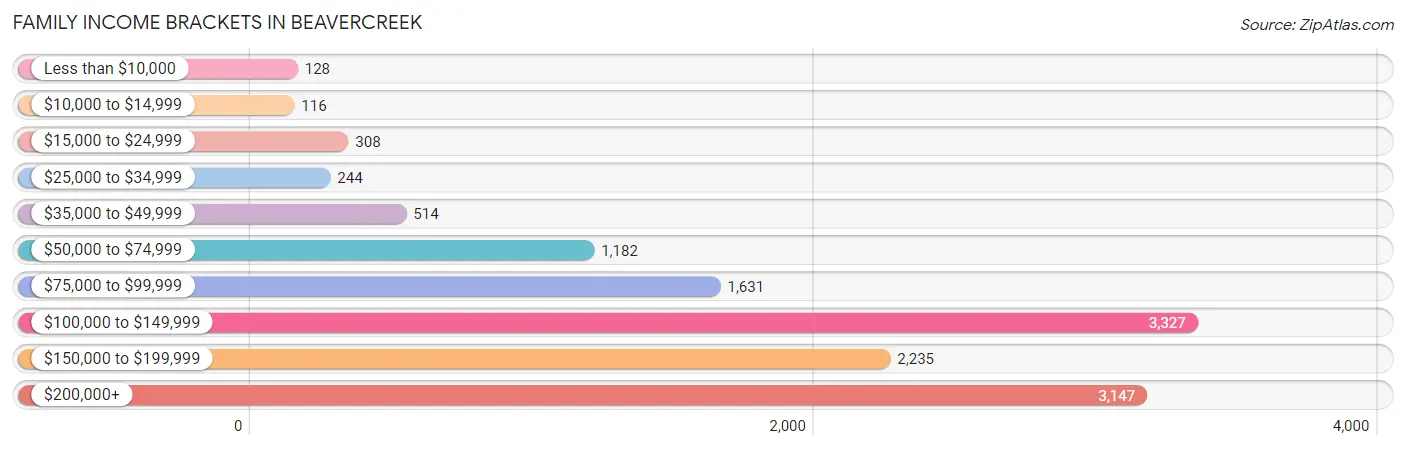
| Income Bracket | # Families | % Families |
| Less than $10,000 | 128 | 1.0% |
| $10,000 to $14,999 | 116 | 0.9% |
| $15,000 to $24,999 | 308 | 2.4% |
| $25,000 to $34,999 | 244 | 1.9% |
| $35,000 to $49,999 | 514 | 4.0% |
| $50,000 to $74,999 | 1,182 | 9.2% |
| $75,000 to $99,999 | 1,631 | 12.7% |
| $100,000 to $149,999 | 3,327 | 25.9% |
| $150,000 to $199,999 | 2,235 | 17.4% |
| $200,000+ | 3,147 | 24.5% |
Family Income by Famaliy Size in Beavercreek
7+ person families (110 | 0.9%) account for the highest median family income in Beavercreek with $230,481 per family, while 2-person families (6,449 | 50.2%) have the highest median income of $61,636 per family member.
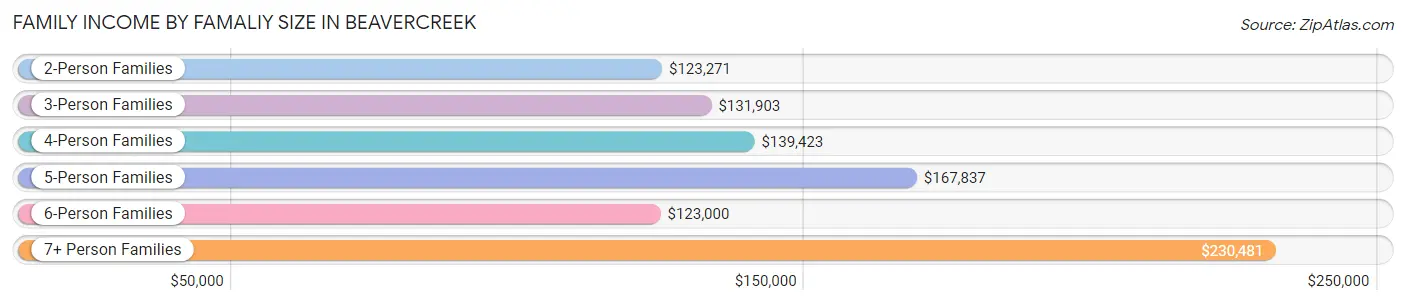
| Income Bracket | # Families | Median Income |
| 2-Person Families | 6,449 (50.2%) | $123,271 |
| 3-Person Families | 2,346 (18.3%) | $131,903 |
| 4-Person Families | 2,410 (18.8%) | $139,423 |
| 5-Person Families | 985 (7.7%) | $167,837 |
| 6-Person Families | 546 (4.3%) | $123,000 |
| 7+ Person Families | 110 (0.9%) | $230,481 |
| Total | 12,846 (100.0%) | $135,420 |
Family Income by Number of Earners in Beavercreek
The median family income in Beavercreek is $135,420, with families comprising 3+ earners (1,402) having the highest median family income of $201,591, while families with no earners (2,067) have the lowest median family income of $90,840, accounting for 10.9% and 16.1% of families, respectively.
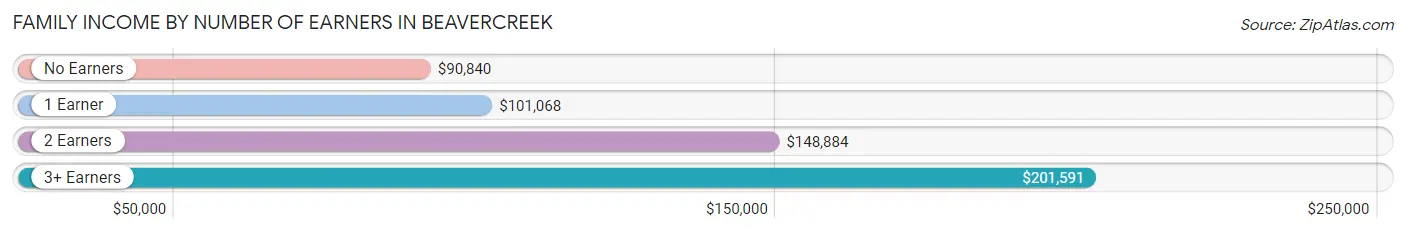
| Number of Earners | # Families | Median Income |
| No Earners | 2,067 (16.1%) | $90,840 |
| 1 Earner | 3,359 (26.2%) | $101,068 |
| 2 Earners | 6,018 (46.9%) | $148,884 |
| 3+ Earners | 1,402 (10.9%) | $201,591 |
| Total | 12,846 (100.0%) | $135,420 |
Household Income in Beavercreek
Household Income Brackets in Beavercreek
With 4,383 households falling in the category, the $100,000 to $149,999 income range is the most frequent in Beavercreek, accounting for 23.2% of all households. In contrast, only 151 households (0.8%) fall into the $10,000 to $14,999 income bracket, making it the least populous group.
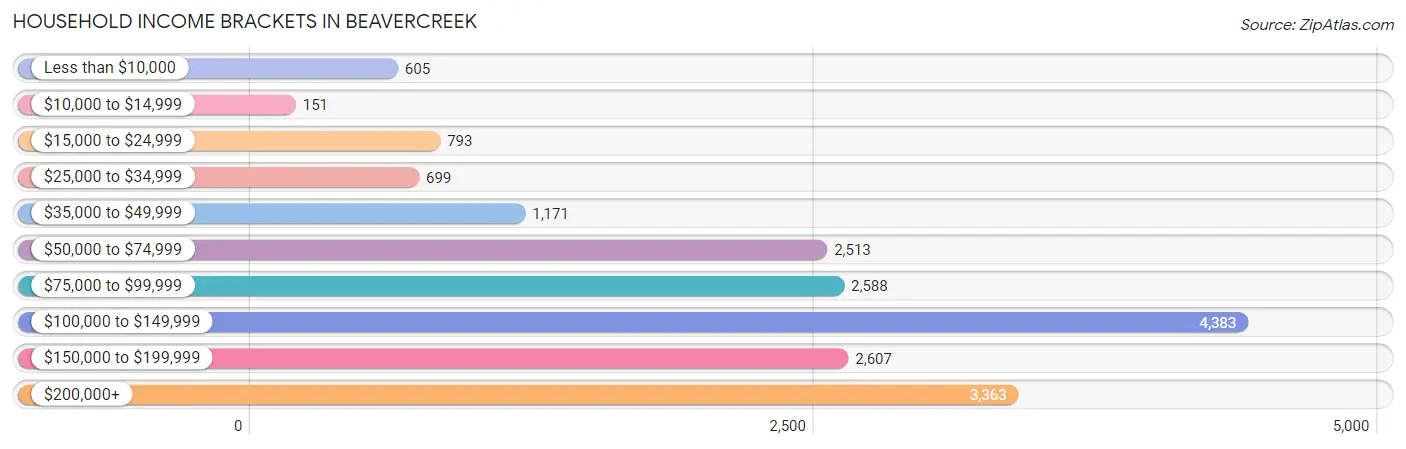
| Income Bracket | # Households | % Households |
| Less than $10,000 | 605 | 3.2% |
| $10,000 to $14,999 | 151 | 0.8% |
| $15,000 to $24,999 | 793 | 4.2% |
| $25,000 to $34,999 | 699 | 3.7% |
| $35,000 to $49,999 | 1,171 | 6.2% |
| $50,000 to $74,999 | 2,513 | 13.3% |
| $75,000 to $99,999 | 2,588 | 13.7% |
| $100,000 to $149,999 | 4,383 | 23.2% |
| $150,000 to $199,999 | 2,607 | 13.8% |
| $200,000+ | 3,363 | 17.8% |
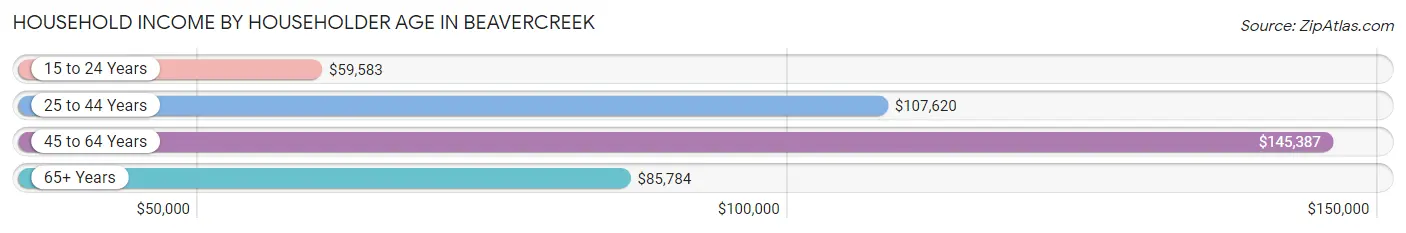
Household Income by Householder Age in Beavercreek
The median household income in Beavercreek is $108,140, with the highest median household income of $145,387 found in the 45 to 64 years age bracket for the primary householder. A total of 6,824 households (36.1%) fall into this category. Meanwhile, the 15 to 24 years age bracket for the primary householder has the lowest median household income of $59,583, with 819 households (4.3%) in this group.
| Income Bracket | # Households | Median Income |
| 15 to 24 Years | 819 (4.3%) | $59,583 |
| 25 to 44 Years | 6,054 (32.1%) | $107,620 |
| 45 to 64 Years | 6,824 (36.1%) | $145,387 |
| 65+ Years | 5,194 (27.5%) | $85,784 |
| Total | 18,891 (100.0%) | $108,140 |
Poverty in Beavercreek
Income Below Poverty by Sex and Age in Beavercreek
With 6.2% poverty level for males and 7.5% for females among the residents of Beavercreek, 18 to 24 year old males and 12 to 14 year old females are the most vulnerable to poverty, with 437 males (22.8%) and 308 females (26.4%) in their respective age groups living below the poverty level.
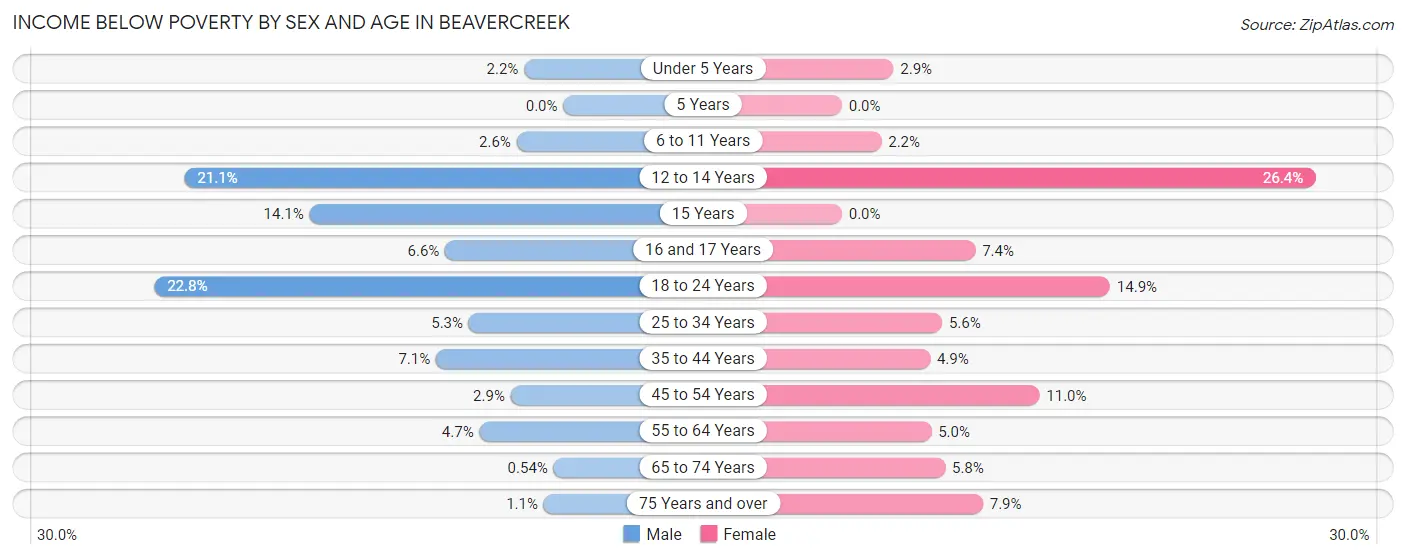
| Age Bracket | Male | Female |
| Under 5 Years | 24 (2.2%) | 32 (2.9%) |
| 5 Years | 0 (0.0%) | 0 (0.0%) |
| 6 to 11 Years | 40 (2.6%) | 34 (2.2%) |
| 12 to 14 Years | 191 (21.1%) | 308 (26.4%) |
| 15 Years | 51 (14.1%) | 0 (0.0%) |
| 16 and 17 Years | 39 (6.6%) | 46 (7.4%) |
| 18 to 24 Years | 437 (22.8%) | 227 (14.9%) |
| 25 to 34 Years | 174 (5.3%) | 163 (5.6%) |
| 35 to 44 Years | 204 (7.1%) | 135 (4.9%) |
| 45 to 54 Years | 84 (2.9%) | 304 (11.0%) |
| 55 to 64 Years | 153 (4.7%) | 161 (5.0%) |
| 65 to 74 Years | 14 (0.5%) | 179 (5.8%) |
| 75 Years and over | 15 (1.1%) | 143 (7.9%) |
| Total | 1,426 (6.2%) | 1,732 (7.5%) |
Income Above Poverty by Sex and Age in Beavercreek
According to the poverty statistics in Beavercreek, males aged 5 years and females aged 5 years are the age groups that are most secure financially, with 100.0% of males and 100.0% of females in these age groups living above the poverty line.
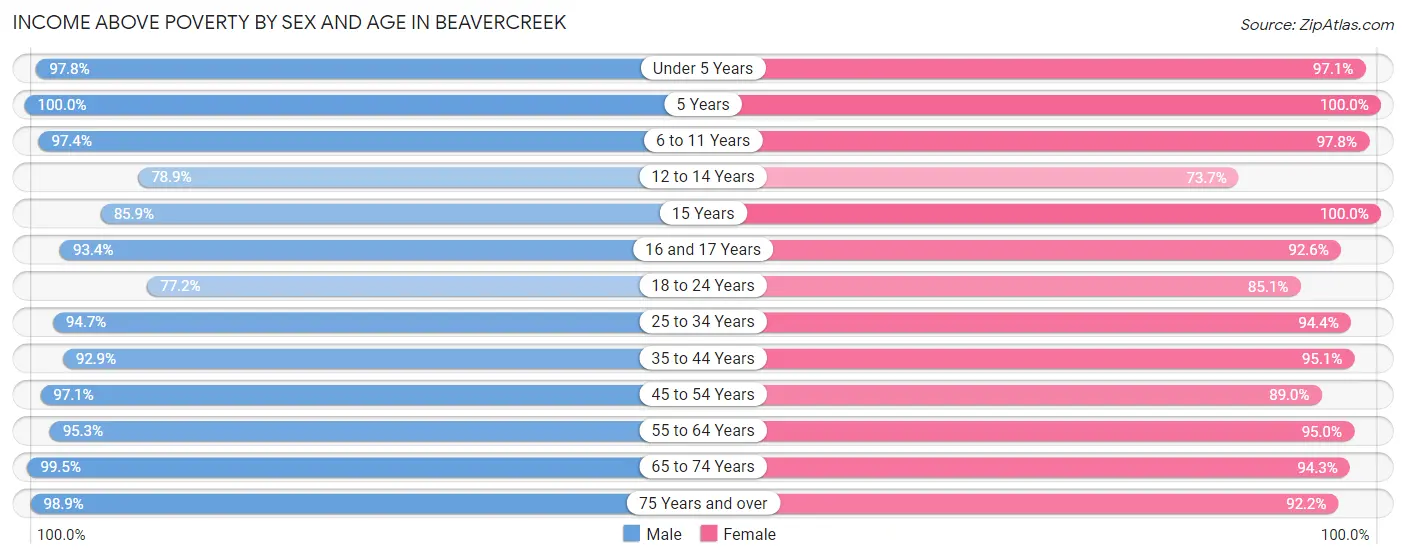
| Age Bracket | Male | Female |
| Under 5 Years | 1,075 (97.8%) | 1,084 (97.1%) |
| 5 Years | 210 (100.0%) | 237 (100.0%) |
| 6 to 11 Years | 1,499 (97.4%) | 1,512 (97.8%) |
| 12 to 14 Years | 714 (78.9%) | 861 (73.7%) |
| 15 Years | 310 (85.9%) | 259 (100.0%) |
| 16 and 17 Years | 554 (93.4%) | 573 (92.6%) |
| 18 to 24 Years | 1,481 (77.2%) | 1,293 (85.1%) |
| 25 to 34 Years | 3,131 (94.7%) | 2,760 (94.4%) |
| 35 to 44 Years | 2,673 (92.9%) | 2,615 (95.1%) |
| 45 to 54 Years | 2,780 (97.1%) | 2,459 (89.0%) |
| 55 to 64 Years | 3,123 (95.3%) | 3,069 (95.0%) |
| 65 to 74 Years | 2,572 (99.5%) | 2,933 (94.3%) |
| 75 Years and over | 1,362 (98.9%) | 1,679 (92.1%) |
| Total | 21,484 (93.8%) | 21,334 (92.5%) |
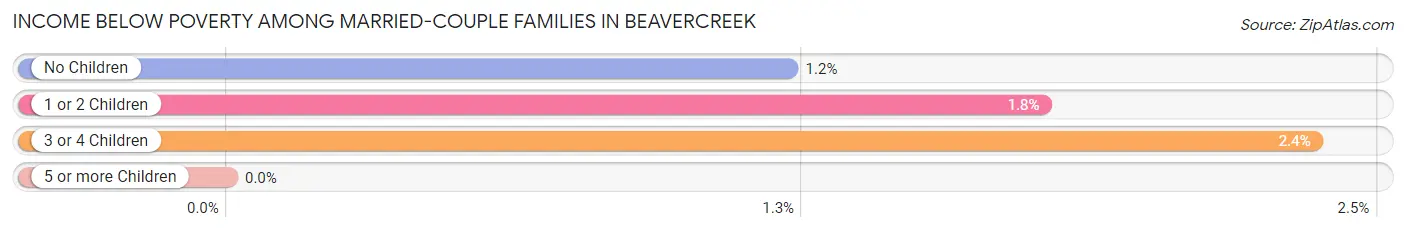
Income Below Poverty Among Married-Couple Families in Beavercreek
The poverty statistics for married-couple families in Beavercreek show that 1.5% or 164 of the total 11,050 families live below the poverty line. Families with 3 or 4 children have the highest poverty rate of 2.4%, comprising of 24 families. On the other hand, families with 5 or more children have the lowest poverty rate of 0.0%, which includes 0 families.
| Children | Above Poverty | Below Poverty |
| No Children | 6,631 (98.8%) | 82 (1.2%) |
| 1 or 2 Children | 3,223 (98.2%) | 58 (1.8%) |
| 3 or 4 Children | 991 (97.6%) | 24 (2.4%) |
| 5 or more Children | 41 (100.0%) | 0 (0.0%) |
| Total | 10,886 (98.5%) | 164 (1.5%) |
Income Below Poverty Among Single-Parent Households in Beavercreek
According to the poverty data in Beavercreek, 10.5% or 88 single-father households and 29.1% or 278 single-mother households are living below the poverty line. Among single-father households, those with 1 or 2 children have the highest poverty rate, with 81 households (15.1%) experiencing poverty. Likewise, among single-mother households, those with 3 or 4 children have the highest poverty rate, with 9 households (47.4%) falling below the poverty line.
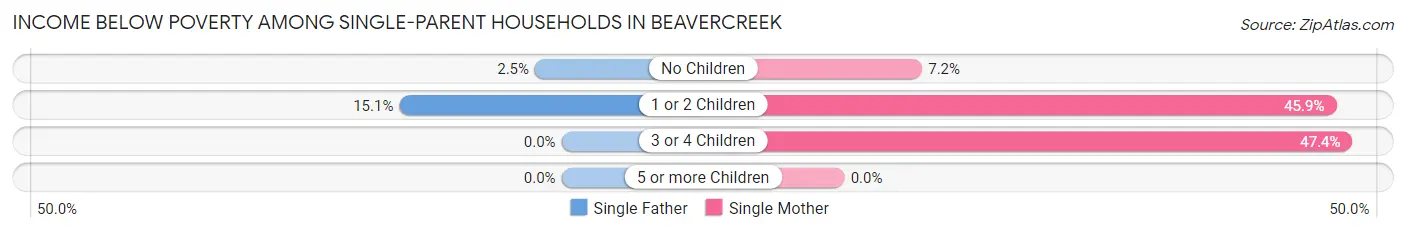
| Children | Single Father | Single Mother |
| No Children | 7 (2.5%) | 30 (7.2%) |
| 1 or 2 Children | 81 (15.1%) | 239 (45.9%) |
| 3 or 4 Children | 0 (0.0%) | 9 (47.4%) |
| 5 or more Children | 0 (0.0%) | 0 (0.0%) |
| Total | 88 (10.5%) | 278 (29.1%) |
Income Below Poverty Among Married-Couple vs Single-Parent Households in Beavercreek
The poverty data for Beavercreek shows that 164 of the married-couple family households (1.5%) and 366 of the single-parent households (20.4%) are living below the poverty level. Within the married-couple family households, those with 3 or 4 children have the highest poverty rate, with 24 households (2.4%) falling below the poverty line. Among the single-parent households, those with 1 or 2 children have the highest poverty rate, with 320 household (30.3%) living below poverty.
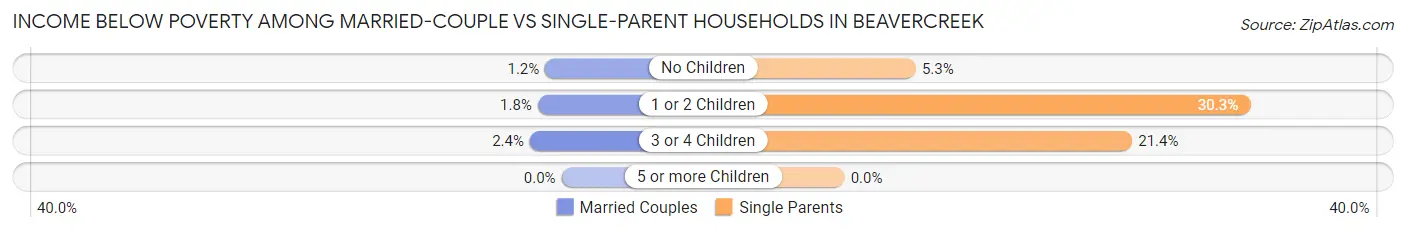
| Children | Married-Couple Families | Single-Parent Households |
| No Children | 82 (1.2%) | 37 (5.3%) |
| 1 or 2 Children | 58 (1.8%) | 320 (30.3%) |
| 3 or 4 Children | 24 (2.4%) | 9 (21.4%) |
| 5 or more Children | 0 (0.0%) | 0 (0.0%) |
| Total | 164 (1.5%) | 366 (20.4%) |
Race in Beavercreek
The most populous races in Beavercreek are White / Caucasian (38,623 | 82.9%), Two or more Races (3,288 | 7.1%), and Asian (2,571 | 5.5%).
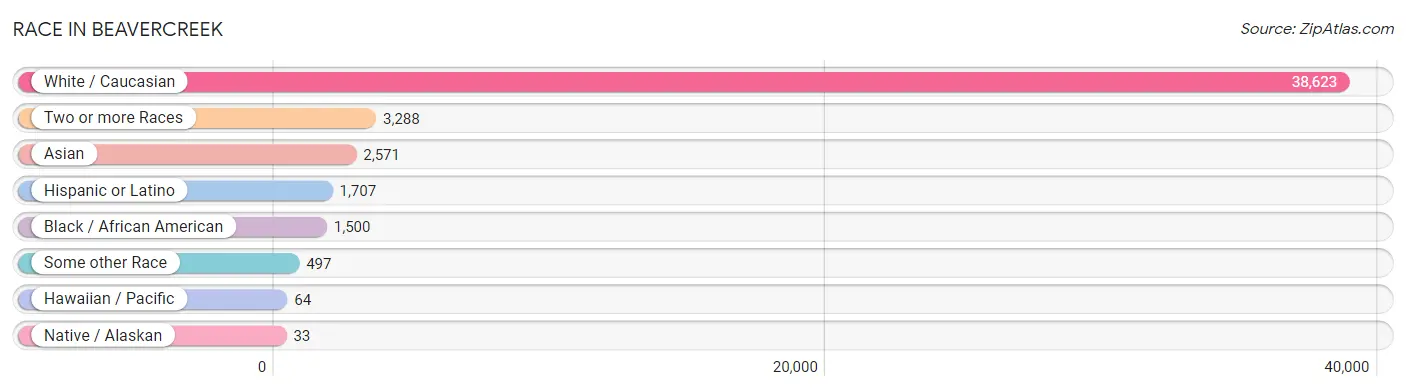
| Race | # Population | % Population |
| Asian | 2,571 | 5.5% |
| Black / African American | 1,500 | 3.2% |
| Hawaiian / Pacific | 64 | 0.1% |
| Hispanic or Latino | 1,707 | 3.7% |
| Native / Alaskan | 33 | 0.1% |
| White / Caucasian | 38,623 | 82.9% |
| Two or more Races | 3,288 | 7.1% |
| Some other Race | 497 | 1.1% |
| Total | 46,576 | 100.0% |
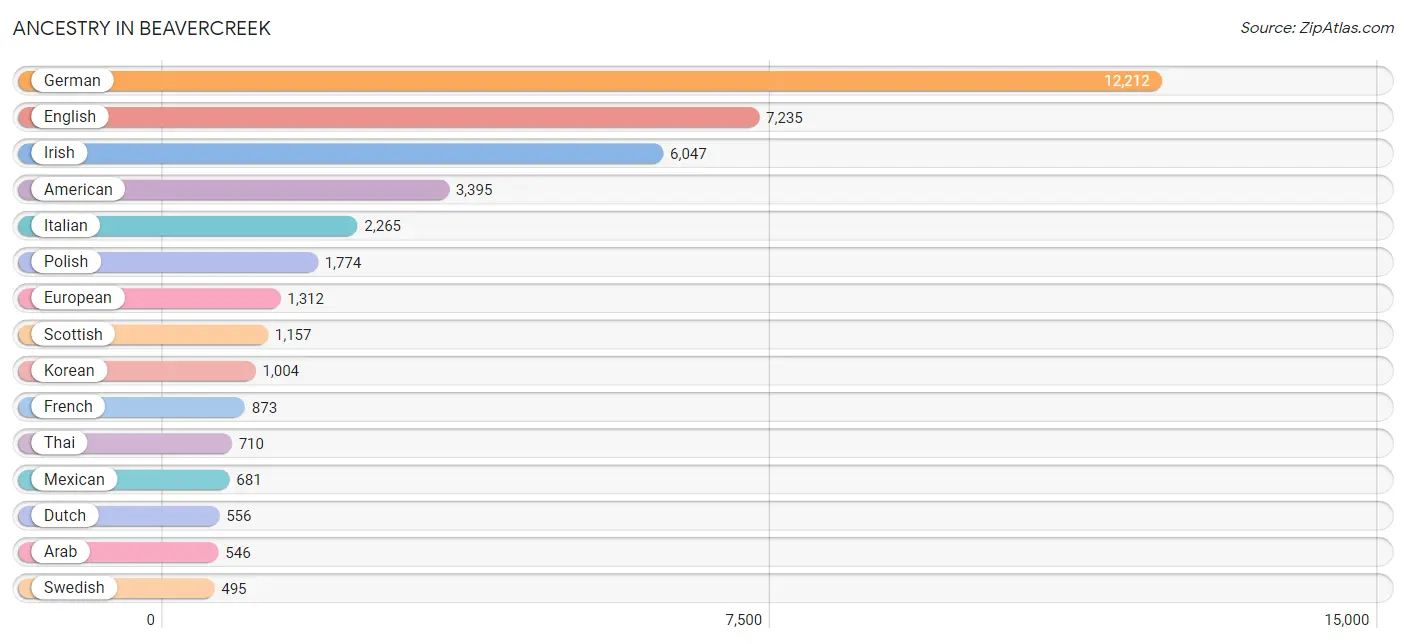
Ancestry in Beavercreek
The most populous ancestries reported in Beavercreek are German (12,212 | 26.2%), English (7,235 | 15.5%), Irish (6,047 | 13.0%), American (3,395 | 7.3%), and Italian (2,265 | 4.9%), together accounting for 66.9% of all Beavercreek residents.
| Ancestry | # Population | % Population |
| African | 133 | 0.3% |
| Alaska Native | 54 | 0.1% |
| American | 3,395 | 7.3% |
| Apache | 18 | 0.0% |
| Arab | 546 | 1.2% |
| Arapaho | 22 | 0.1% |
| Armenian | 86 | 0.2% |
| Australian | 64 | 0.1% |
| Austrian | 120 | 0.3% |
| Basque | 7 | 0.0% |
| Belgian | 8 | 0.0% |
| Bhutanese | 376 | 0.8% |
| Brazilian | 22 | 0.1% |
| British | 283 | 0.6% |
| Bulgarian | 8 | 0.0% |
| Burmese | 401 | 0.9% |
| Canadian | 83 | 0.2% |
| Celtic | 85 | 0.2% |
| Central American | 38 | 0.1% |
| Cherokee | 132 | 0.3% |
| Chilean | 62 | 0.1% |
| Chippewa | 79 | 0.2% |
| Colombian | 15 | 0.0% |
| Croatian | 122 | 0.3% |
| Cuban | 133 | 0.3% |
| Czech | 81 | 0.2% |
| Czechoslovakian | 54 | 0.1% |
| Danish | 86 | 0.2% |
| Dutch | 556 | 1.2% |
| Dutch West Indian | 14 | 0.0% |
| Eastern European | 40 | 0.1% |
| Egyptian | 52 | 0.1% |
| English | 7,235 | 15.5% |
| Estonian | 75 | 0.2% |
| European | 1,312 | 2.8% |
| Filipino | 32 | 0.1% |
| Finnish | 173 | 0.4% |
| French | 873 | 1.9% |
| French Canadian | 133 | 0.3% |
| German | 12,212 | 26.2% |
| Greek | 47 | 0.1% |
| Hungarian | 245 | 0.5% |
| Icelander | 16 | 0.0% |
| Indian (Asian) | 249 | 0.5% |
| Iranian | 40 | 0.1% |
| Irish | 6,047 | 13.0% |
| Italian | 2,265 | 4.9% |
| Japanese | 7 | 0.0% |
| Korean | 1,004 | 2.2% |
| Lebanese | 241 | 0.5% |
| Lithuanian | 204 | 0.4% |
| Maltese | 49 | 0.1% |
| Mexican | 681 | 1.5% |
| Moroccan | 15 | 0.0% |
| Native Hawaiian | 64 | 0.1% |
| Navajo | 19 | 0.0% |
| Nicaraguan | 38 | 0.1% |
| Nigerian | 23 | 0.1% |
| Northern European | 48 | 0.1% |
| Norwegian | 470 | 1.0% |
| Okinawan | 18 | 0.0% |
| Pakistani | 51 | 0.1% |
| Palestinian | 17 | 0.0% |
| Peruvian | 8 | 0.0% |
| Polish | 1,774 | 3.8% |
| Portuguese | 67 | 0.1% |
| Puerto Rican | 451 | 1.0% |
| Romanian | 9 | 0.0% |
| Russian | 135 | 0.3% |
| Samoan | 103 | 0.2% |
| Scandinavian | 182 | 0.4% |
| Scotch-Irish | 490 | 1.1% |
| Scottish | 1,157 | 2.5% |
| Sioux | 33 | 0.1% |
| Slavic | 23 | 0.1% |
| Slovak | 175 | 0.4% |
| Slovene | 13 | 0.0% |
| South American | 85 | 0.2% |
| Spaniard | 164 | 0.4% |
| Spanish | 91 | 0.2% |
| Sri Lankan | 345 | 0.7% |
| Subsaharan African | 172 | 0.4% |
| Swedish | 495 | 1.1% |
| Swiss | 198 | 0.4% |
| Syrian | 23 | 0.1% |
| Thai | 710 | 1.5% |
| Trinidadian and Tobagonian | 17 | 0.0% |
| Ukrainian | 61 | 0.1% |
| Vietnamese | 265 | 0.6% |
| Welsh | 467 | 1.0% |
| Yugoslavian | 24 | 0.1% | View All 91 Rows |
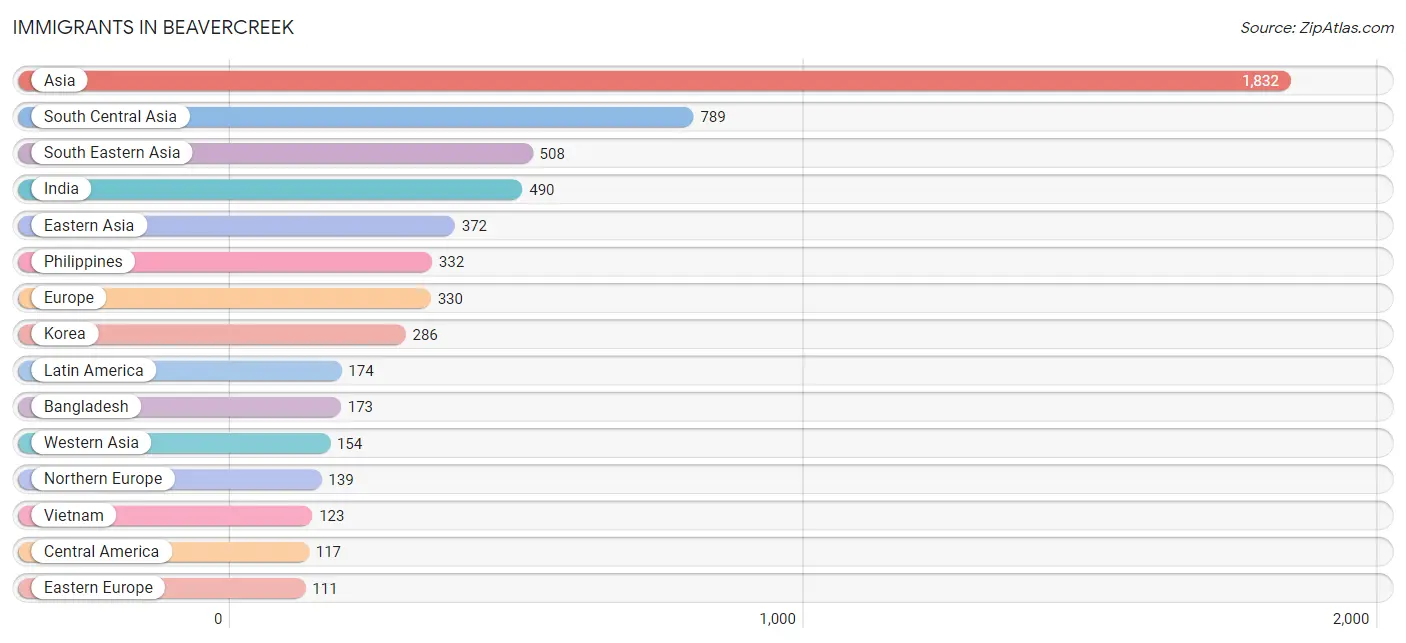
Immigrants in Beavercreek
The most numerous immigrant groups reported in Beavercreek came from Asia (1,832 | 3.9%), South Central Asia (789 | 1.7%), South Eastern Asia (508 | 1.1%), India (490 | 1.1%), and Eastern Asia (372 | 0.8%), together accounting for 8.6% of all Beavercreek residents.
| Immigration Origin | # Population | % Population |
| Africa | 74 | 0.2% |
| Asia | 1,832 | 3.9% |
| Australia | 40 | 0.1% |
| Bangladesh | 173 | 0.4% |
| Belarus | 16 | 0.0% |
| Brazil | 32 | 0.1% |
| Bulgaria | 8 | 0.0% |
| Cambodia | 2 | 0.0% |
| Canada | 68 | 0.2% |
| Caribbean | 17 | 0.0% |
| Central America | 117 | 0.3% |
| China | 53 | 0.1% |
| Congo | 1 | 0.0% |
| Eastern Africa | 1 | 0.0% |
| Eastern Asia | 372 | 0.8% |
| Eastern Europe | 111 | 0.2% |
| England | 71 | 0.2% |
| Europe | 330 | 0.7% |
| Germany | 66 | 0.1% |
| India | 490 | 1.1% |
| Iraq | 19 | 0.0% |
| Japan | 33 | 0.1% |
| Korea | 286 | 0.6% |
| Latin America | 174 | 0.4% |
| Lebanon | 10 | 0.0% |
| Mexico | 93 | 0.2% |
| Middle Africa | 1 | 0.0% |
| Morocco | 24 | 0.1% |
| Nepal | 8 | 0.0% |
| Nicaragua | 24 | 0.1% |
| Northern Africa | 72 | 0.2% |
| Northern Europe | 139 | 0.3% |
| Oceania | 40 | 0.1% |
| Pakistan | 104 | 0.2% |
| Peru | 8 | 0.0% |
| Philippines | 332 | 0.7% |
| Russia | 30 | 0.1% |
| Saudi Arabia | 35 | 0.1% |
| Scotland | 62 | 0.1% |
| Singapore | 5 | 0.0% |
| South America | 40 | 0.1% |
| South Central Asia | 789 | 1.7% |
| South Eastern Asia | 508 | 1.1% |
| Southern Europe | 14 | 0.0% |
| Spain | 14 | 0.0% |
| Syria | 32 | 0.1% |
| Taiwan | 5 | 0.0% |
| Thailand | 46 | 0.1% |
| Trinidad and Tobago | 17 | 0.0% |
| Uzbekistan | 14 | 0.0% |
| Vietnam | 123 | 0.3% |
| Western Asia | 154 | 0.3% |
| Western Europe | 66 | 0.1% | View All 53 Rows |
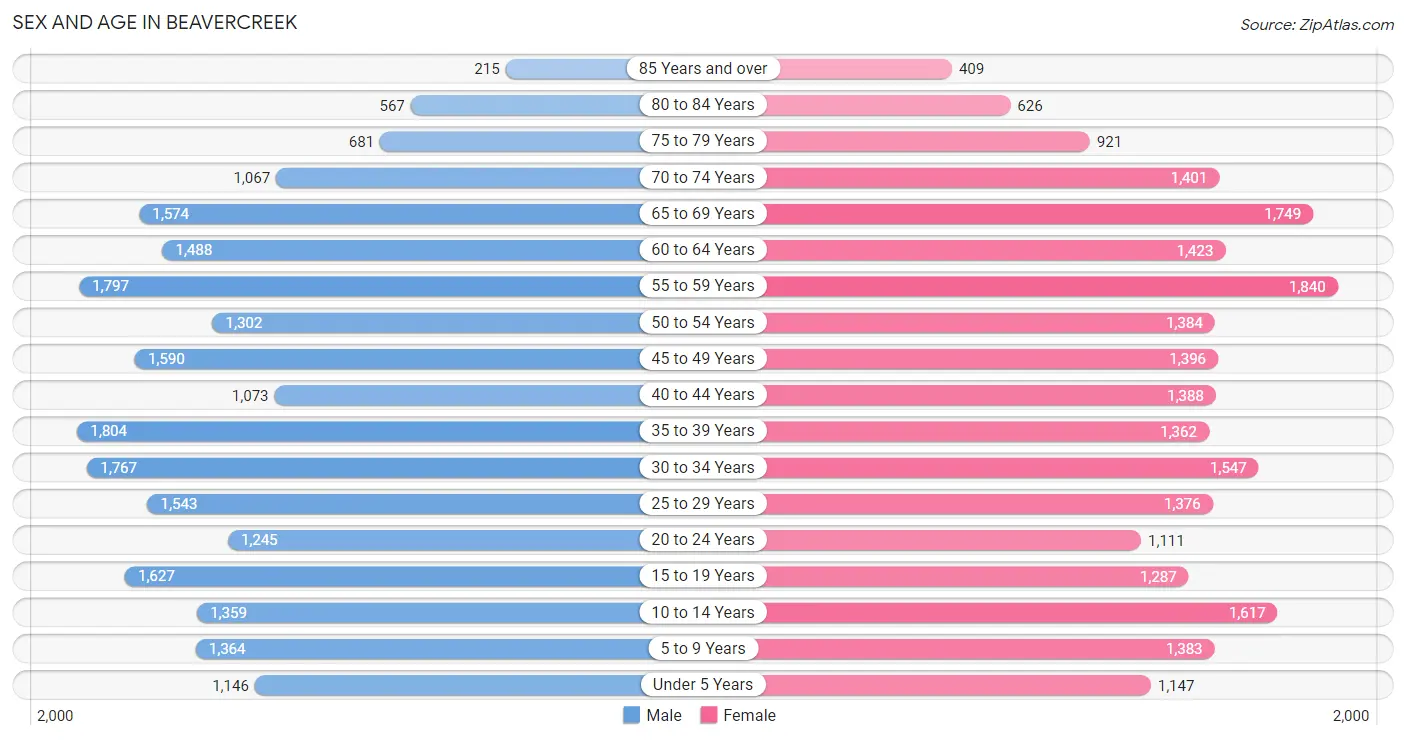
Sex and Age in Beavercreek
Sex and Age in Beavercreek
The most populous age groups in Beavercreek are 35 to 39 Years (1,804 | 7.8%) for men and 55 to 59 Years (1,840 | 7.9%) for women.
| Age Bracket | Male | Female |
| Under 5 Years | 1,146 (4.9%) | 1,147 (4.9%) |
| 5 to 9 Years | 1,364 (5.9%) | 1,383 (5.9%) |
| 10 to 14 Years | 1,359 (5.9%) | 1,617 (6.9%) |
| 15 to 19 Years | 1,627 (7.0%) | 1,287 (5.5%) |
| 20 to 24 Years | 1,245 (5.4%) | 1,111 (4.8%) |
| 25 to 29 Years | 1,543 (6.7%) | 1,376 (5.9%) |
| 30 to 34 Years | 1,767 (7.6%) | 1,547 (6.6%) |
| 35 to 39 Years | 1,804 (7.8%) | 1,362 (5.8%) |
| 40 to 44 Years | 1,073 (4.6%) | 1,388 (5.9%) |
| 45 to 49 Years | 1,590 (6.9%) | 1,396 (6.0%) |
| 50 to 54 Years | 1,302 (5.6%) | 1,384 (5.9%) |
| 55 to 59 Years | 1,797 (7.7%) | 1,840 (7.9%) |
| 60 to 64 Years | 1,488 (6.4%) | 1,423 (6.1%) |
| 65 to 69 Years | 1,574 (6.8%) | 1,749 (7.5%) |
| 70 to 74 Years | 1,067 (4.6%) | 1,401 (6.0%) |
| 75 to 79 Years | 681 (2.9%) | 921 (3.9%) |
| 80 to 84 Years | 567 (2.4%) | 626 (2.7%) |
| 85 Years and over | 215 (0.9%) | 409 (1.8%) |
| Total | 23,209 (100.0%) | 23,367 (100.0%) |
Families and Households in Beavercreek
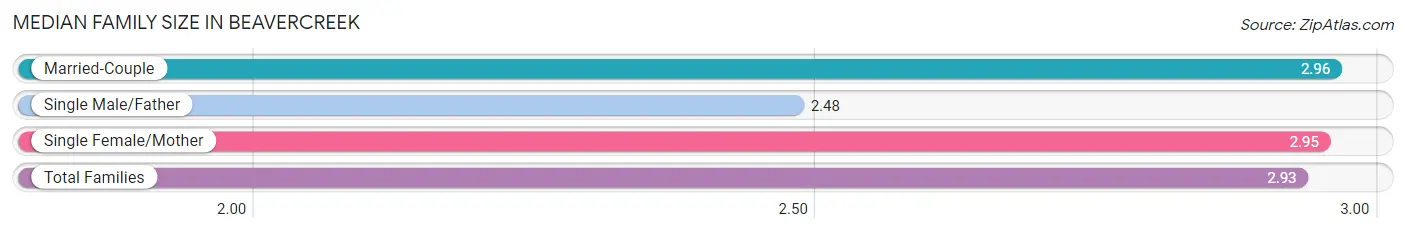
Median Family Size in Beavercreek
The median family size in Beavercreek is 2.93 persons per family, with married-couple families (11,050 | 86.0%) accounting for the largest median family size of 2.96 persons per family. On the other hand, single male/father families (841 | 6.6%) represent the smallest median family size with 2.48 persons per family.
| Family Type | # Families | Family Size |
| Married-Couple | 11,050 (86.0%) | 2.96 |
| Single Male/Father | 841 (6.6%) | 2.48 |
| Single Female/Mother | 955 (7.4%) | 2.95 |
| Total Families | 12,846 (100.0%) | 2.93 |
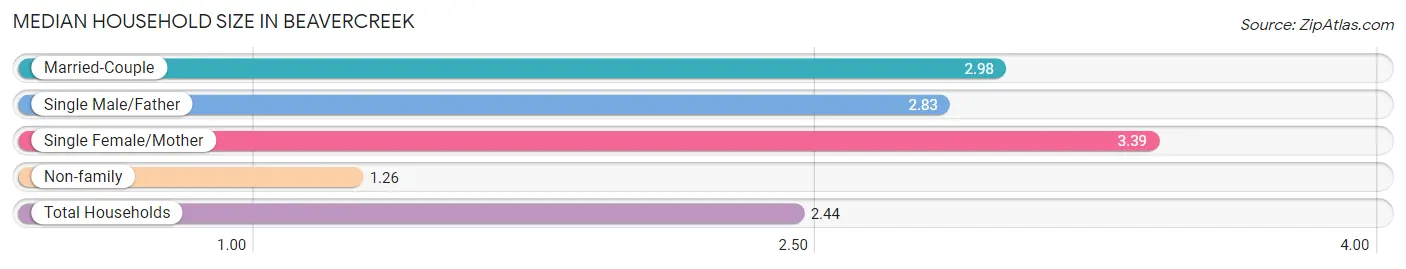
Median Household Size in Beavercreek
The median household size in Beavercreek is 2.44 persons per household, with single female/mother households (955 | 5.1%) accounting for the largest median household size of 3.39 persons per household. non-family households (6,045 | 32.0%) represent the smallest median household size with 1.26 persons per household.
| Household Type | # Households | Household Size |
| Married-Couple | 11,050 (58.5%) | 2.98 |
| Single Male/Father | 841 (4.4%) | 2.83 |
| Single Female/Mother | 955 (5.1%) | 3.39 |
| Non-family | 6,045 (32.0%) | 1.26 |
| Total Households | 18,891 (100.0%) | 2.44 |
Household Size by Marriage Status in Beavercreek
Out of a total of 18,891 households in Beavercreek, 12,846 (68.0%) are family households, while 6,045 (32.0%) are nonfamily households. The most numerous type of family households are 2-person households, comprising 6,267, and the most common type of nonfamily households are 1-person households, comprising 4,923.
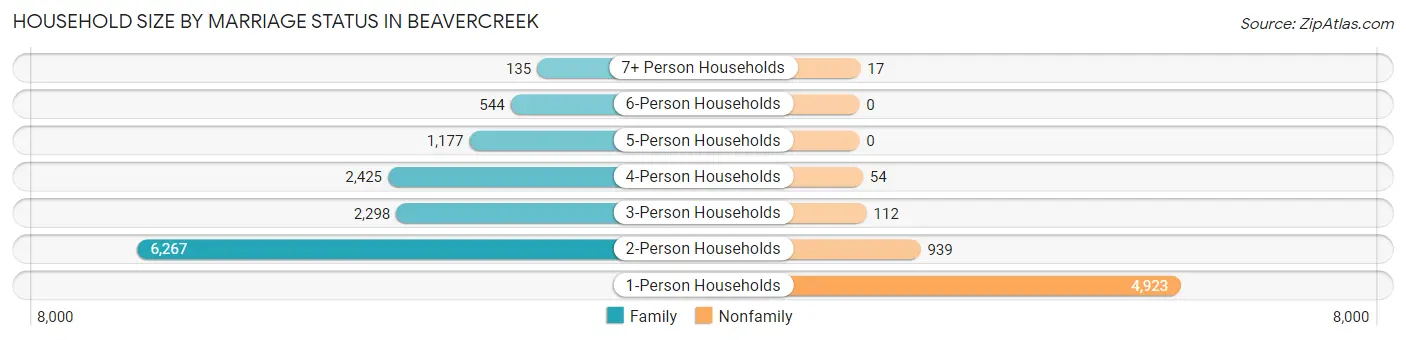
| Household Size | Family Households | Nonfamily Households |
| 1-Person Households | - | 4,923 (26.1%) |
| 2-Person Households | 6,267 (33.2%) | 939 (5.0%) |
| 3-Person Households | 2,298 (12.2%) | 112 (0.6%) |
| 4-Person Households | 2,425 (12.8%) | 54 (0.3%) |
| 5-Person Households | 1,177 (6.2%) | 0 (0.0%) |
| 6-Person Households | 544 (2.9%) | 0 (0.0%) |
| 7+ Person Households | 135 (0.7%) | 17 (0.1%) |
| Total | 12,846 (68.0%) | 6,045 (32.0%) |
Female Fertility in Beavercreek
Fertility by Age in Beavercreek
Average fertility rate in Beavercreek is 59.0 births per 1,000 women. Women in the age bracket of 20 to 34 years have the highest fertility rate with 98.0 births per 1,000 women. Women in the age bracket of 20 to 34 years acount for 69.4% of all women with births.
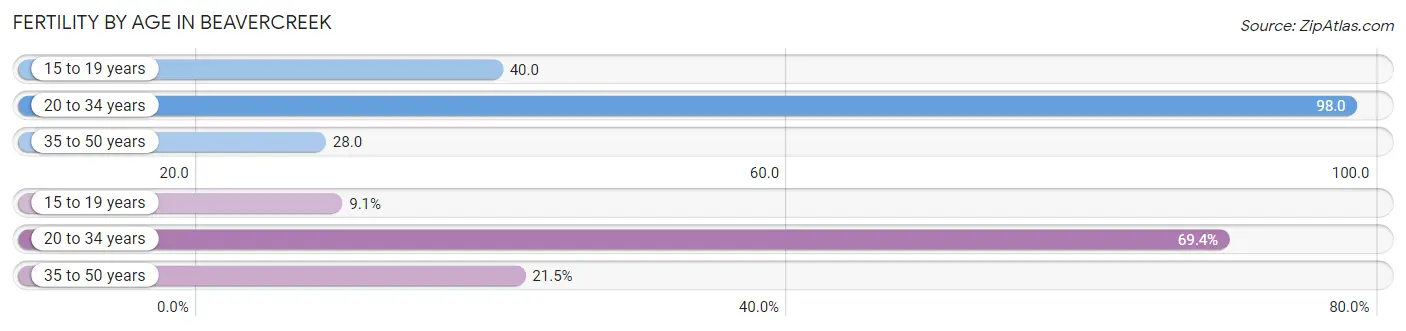
| Age Bracket | Women with Births | Births / 1,000 Women |
| 15 to 19 years | 52 (9.1%) | 40.0 |
| 20 to 34 years | 396 (69.4%) | 98.0 |
| 35 to 50 years | 123 (21.5%) | 28.0 |
| Total | 571 (100.0%) | 59.0 |
Fertility by Age by Marriage Status in Beavercreek
86.0% of women with births (571) in Beavercreek are married. The highest percentage of unmarried women with births falls into 15 to 19 years age bracket with 100.0% of them unmarried at the time of birth, while the lowest percentage of unmarried women with births belong to 20 to 34 years age bracket with 4.0% of them unmarried.
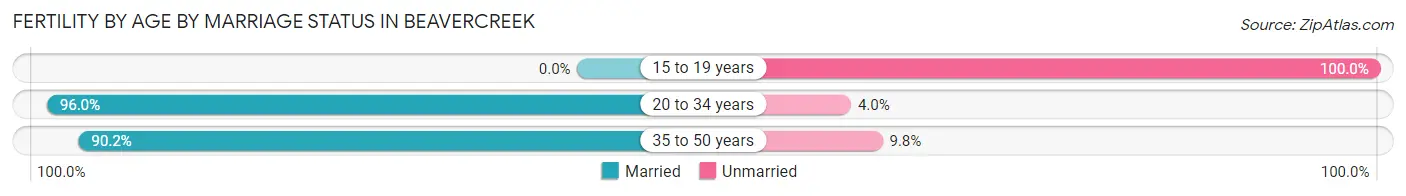
| Age Bracket | Married | Unmarried |
| 15 to 19 years | 0 (0.0%) | 52 (100.0%) |
| 20 to 34 years | 380 (96.0%) | 16 (4.0%) |
| 35 to 50 years | 111 (90.2%) | 12 (9.8%) |
| Total | 491 (86.0%) | 80 (14.0%) |
Fertility by Education in Beavercreek
Average fertility rate in Beavercreek is 59.0 births per 1,000 women. Women with the education attainment of graduate degree have the highest fertility rate of 82.0 births per 1,000 women, while women with the education attainment of less than high school have the lowest fertility at 45.0 births per 1,000 women. Women with the education attainment of graduate degree represent 29.4% of all women with births.
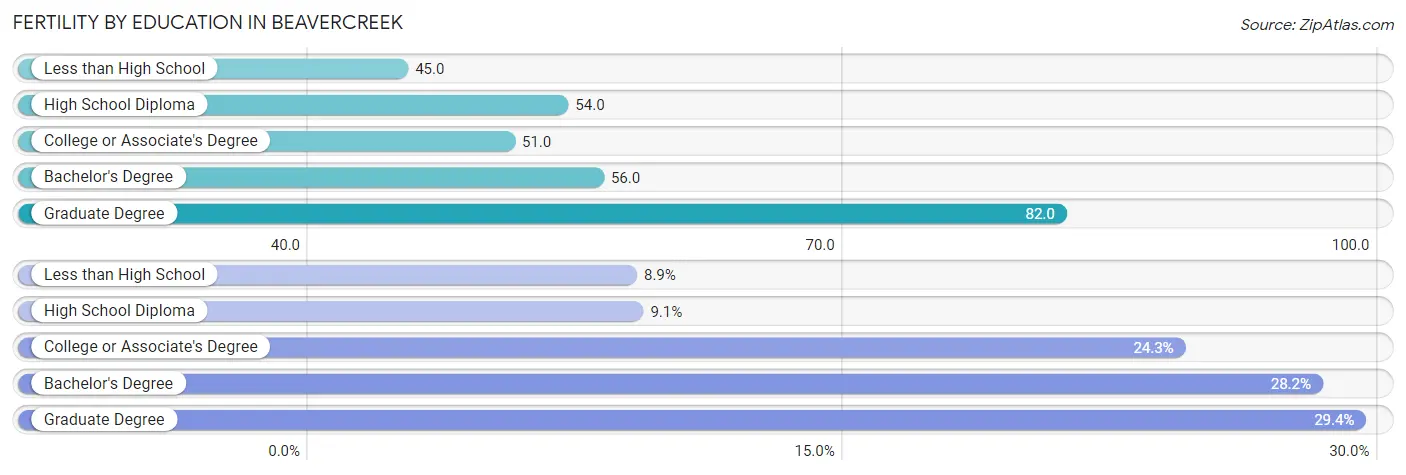
| Educational Attainment | Women with Births | Births / 1,000 Women |
| Less than High School | 51 (8.9%) | 45.0 |
| High School Diploma | 52 (9.1%) | 54.0 |
| College or Associate's Degree | 139 (24.3%) | 51.0 |
| Bachelor's Degree | 161 (28.2%) | 56.0 |
| Graduate Degree | 168 (29.4%) | 82.0 |
| Total | 571 (100.0%) | 59.0 |
Fertility by Education by Marriage Status in Beavercreek
14.0% of women with births in Beavercreek are unmarried. Women with the educational attainment of high school diploma are most likely to be married with 100.0% of them married at childbirth, while women with the educational attainment of less than high school are least likely to be married with 100.0% of them unmarried at childbirth.
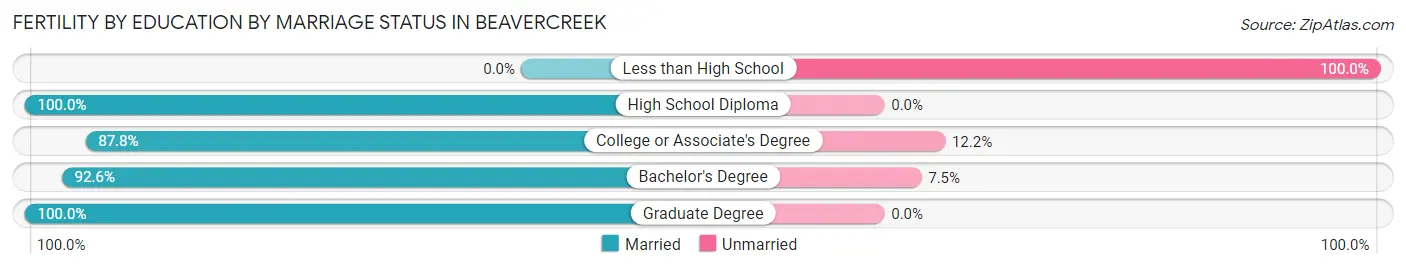
| Educational Attainment | Married | Unmarried |
| Less than High School | 0 (0.0%) | 51 (100.0%) |
| High School Diploma | 52 (100.0%) | 0 (0.0%) |
| College or Associate's Degree | 122 (87.8%) | 17 (12.2%) |
| Bachelor's Degree | 149 (92.5%) | 12 (7.4%) |
| Graduate Degree | 168 (100.0%) | 0 (0.0%) |
| Total | 491 (86.0%) | 80 (14.0%) |
Employment Characteristics in Beavercreek
Employment by Class of Employer in Beavercreek
Among the 23,404 employed individuals in Beavercreek, private company employees (13,020 | 55.6%), federal government employees (4,478 | 19.1%), and not-for-profit organizations (2,484 | 10.6%) make up the most common classes of employment.
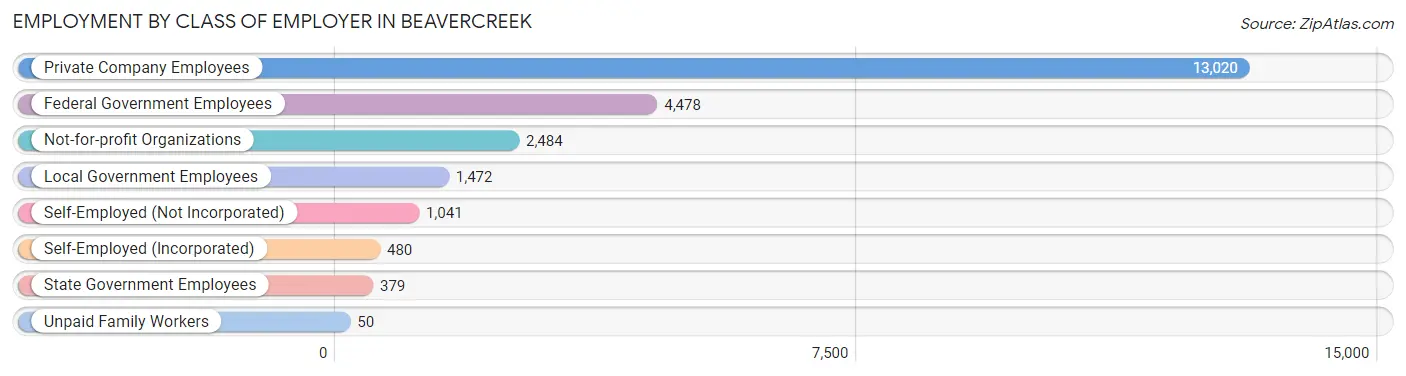
| Employer Class | # Employees | % Employees |
| Private Company Employees | 13,020 | 55.6% |
| Self-Employed (Incorporated) | 480 | 2.1% |
| Self-Employed (Not Incorporated) | 1,041 | 4.4% |
| Not-for-profit Organizations | 2,484 | 10.6% |
| Local Government Employees | 1,472 | 6.3% |
| State Government Employees | 379 | 1.6% |
| Federal Government Employees | 4,478 | 19.1% |
| Unpaid Family Workers | 50 | 0.2% |
| Total | 23,404 | 100.0% |
Employment Status by Age in Beavercreek
According to the labor force statistics for Beavercreek, out of the total population over 16 years of age (37,940), 65.0% or 24,661 individuals are in the labor force, with 2.8% or 691 of them unemployed. The age group with the highest labor force participation rate is 35 to 44 years, with 87.3% or 4,912 individuals in the labor force. Within the labor force, the 20 to 24 years age range has the highest percentage of unemployed individuals, with 6.5% or 129 of them being unemployed.
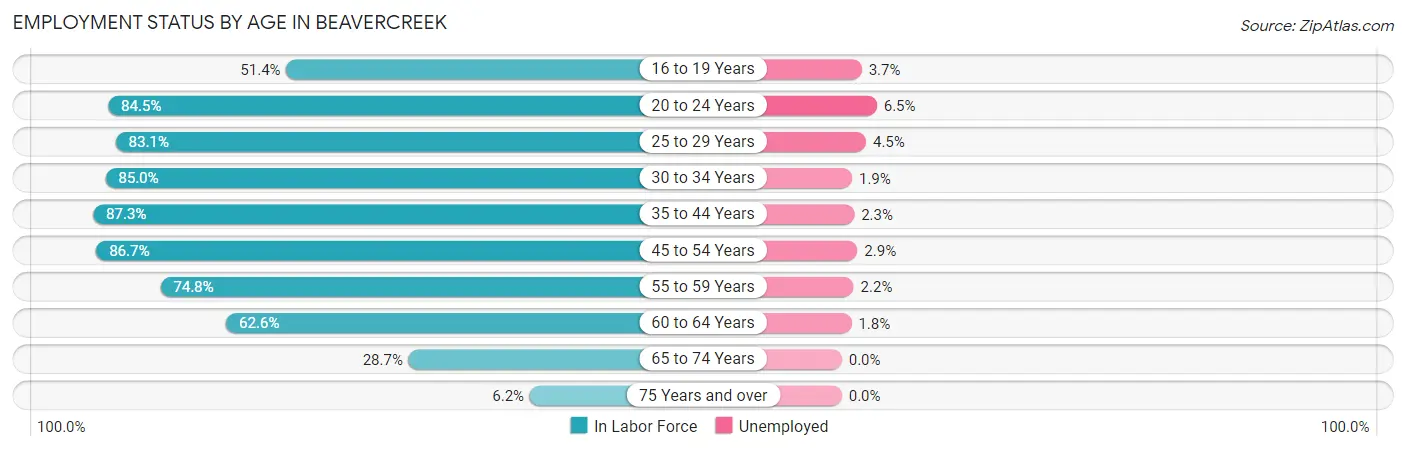
| Age Bracket | In Labor Force | Unemployed |
| 16 to 19 Years | 1,179 (51.4%) | 44 (3.7%) |
| 20 to 24 Years | 1,991 (84.5%) | 129 (6.5%) |
| 25 to 29 Years | 2,426 (83.1%) | 109 (4.5%) |
| 30 to 34 Years | 2,817 (85.0%) | 54 (1.9%) |
| 35 to 44 Years | 4,912 (87.3%) | 113 (2.3%) |
| 45 to 54 Years | 4,918 (86.7%) | 143 (2.9%) |
| 55 to 59 Years | 2,720 (74.8%) | 60 (2.2%) |
| 60 to 64 Years | 1,822 (62.6%) | 33 (1.8%) |
| 65 to 74 Years | 1,662 (28.7%) | 0 (0.0%) |
| 75 Years and over | 212 (6.2%) | 0 (0.0%) |
| Total | 24,661 (65.0%) | 691 (2.8%) |
Employment Status by Educational Attainment in Beavercreek
According to labor force statistics for Beavercreek, 81.4% of individuals (19,601) out of the total population between 25 and 64 years of age (24,080) are in the labor force, with 2.6% or 510 of them being unemployed. The group with the highest labor force participation rate are those with the educational attainment of bachelor's degree or higher, with 85.5% or 11,359 individuals in the labor force. Within the labor force, individuals with college / associate degree education have the highest percentage of unemployment, with 2.8% or 170 of them being unemployed.
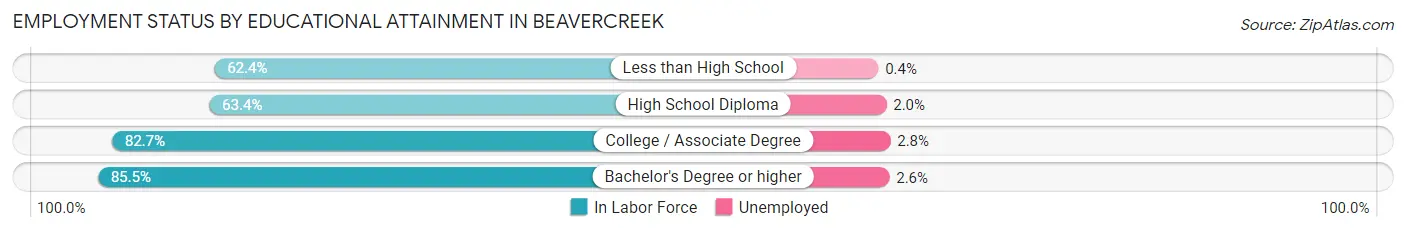
| Educational Attainment | In Labor Force | Unemployed |
| Less than High School | 267 (62.4%) | 2 (0.4%) |
| High School Diploma | 1,923 (63.4%) | 61 (2.0%) |
| College / Associate Degree | 6,065 (82.7%) | 205 (2.8%) |
| Bachelor's Degree or higher | 11,359 (85.5%) | 345 (2.6%) |
| Total | 19,601 (81.4%) | 626 (2.6%) |
Employment Occupations by Sex in Beavercreek
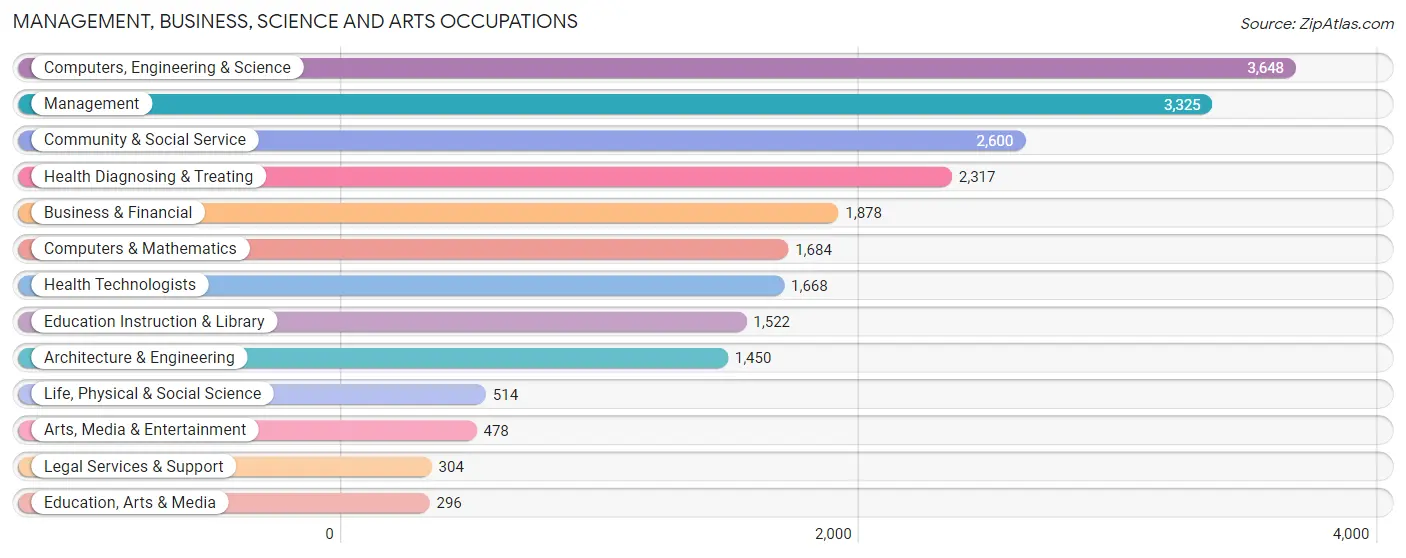
Management, Business, Science and Arts Occupations
The most common Management, Business, Science and Arts occupations in Beavercreek are Computers, Engineering & Science (3,648 | 15.8%), Management (3,325 | 14.4%), Community & Social Service (2,600 | 11.2%), Health Diagnosing & Treating (2,317 | 10.0%), and Business & Financial (1,878 | 8.1%).
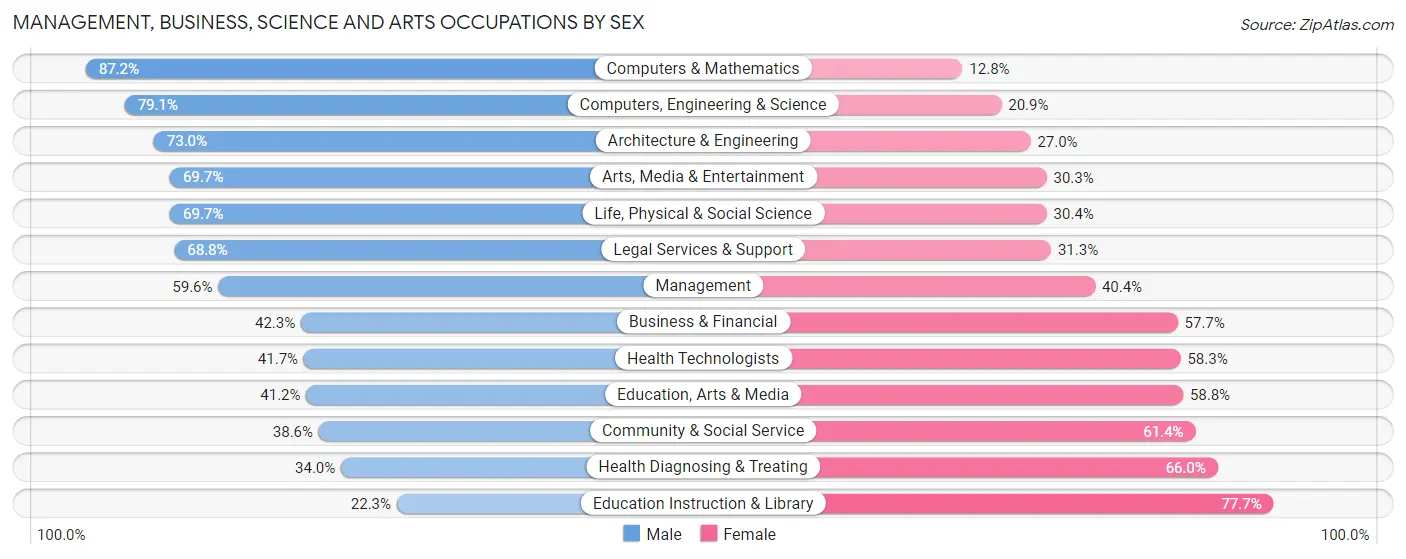
Management, Business, Science and Arts Occupations by Sex
Within the Management, Business, Science and Arts occupations in Beavercreek, the most male-oriented occupations are Computers & Mathematics (87.2%), Computers, Engineering & Science (79.1%), and Architecture & Engineering (73.0%), while the most female-oriented occupations are Education Instruction & Library (77.7%), Health Diagnosing & Treating (66.0%), and Community & Social Service (61.4%).
| Occupation | Male | Female |
| Management | 1,981 (59.6%) | 1,344 (40.4%) |
| Business & Financial | 795 (42.3%) | 1,083 (57.7%) |
| Computers, Engineering & Science | 2,886 (79.1%) | 762 (20.9%) |
| Computers & Mathematics | 1,469 (87.2%) | 215 (12.8%) |
| Architecture & Engineering | 1,059 (73.0%) | 391 (27.0%) |
| Life, Physical & Social Science | 358 (69.7%) | 156 (30.3%) |
| Community & Social Service | 1,004 (38.6%) | 1,596 (61.4%) |
| Education, Arts & Media | 122 (41.2%) | 174 (58.8%) |
| Legal Services & Support | 209 (68.8%) | 95 (31.2%) |
| Education Instruction & Library | 340 (22.3%) | 1,182 (77.7%) |
| Arts, Media & Entertainment | 333 (69.7%) | 145 (30.3%) |
| Health Diagnosing & Treating | 787 (34.0%) | 1,530 (66.0%) |
| Health Technologists | 696 (41.7%) | 972 (58.3%) |
| Total (Category) | 7,453 (54.1%) | 6,315 (45.9%) |
| Total (Overall) | 12,891 (55.7%) | 10,237 (44.3%) |
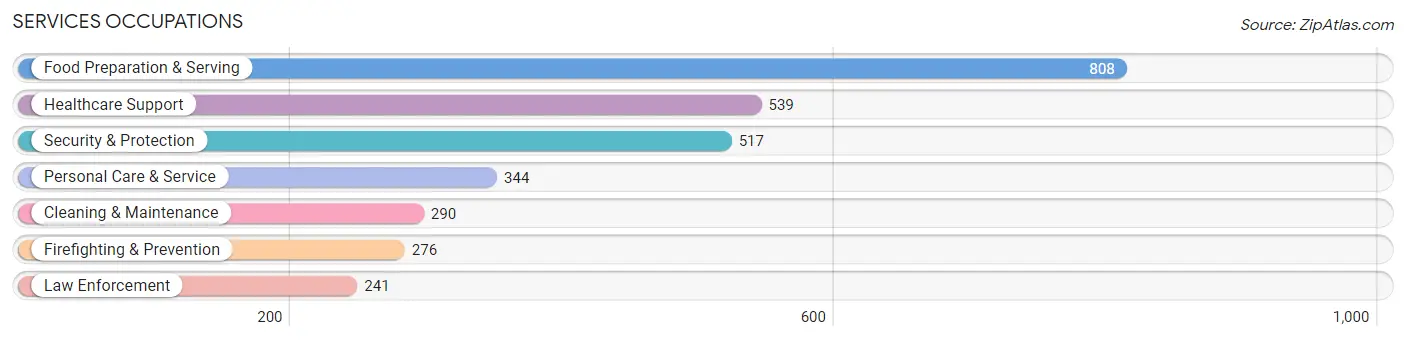
Services Occupations
The most common Services occupations in Beavercreek are Food Preparation & Serving (808 | 3.5%), Healthcare Support (539 | 2.3%), Security & Protection (517 | 2.2%), Personal Care & Service (344 | 1.5%), and Cleaning & Maintenance (290 | 1.3%).
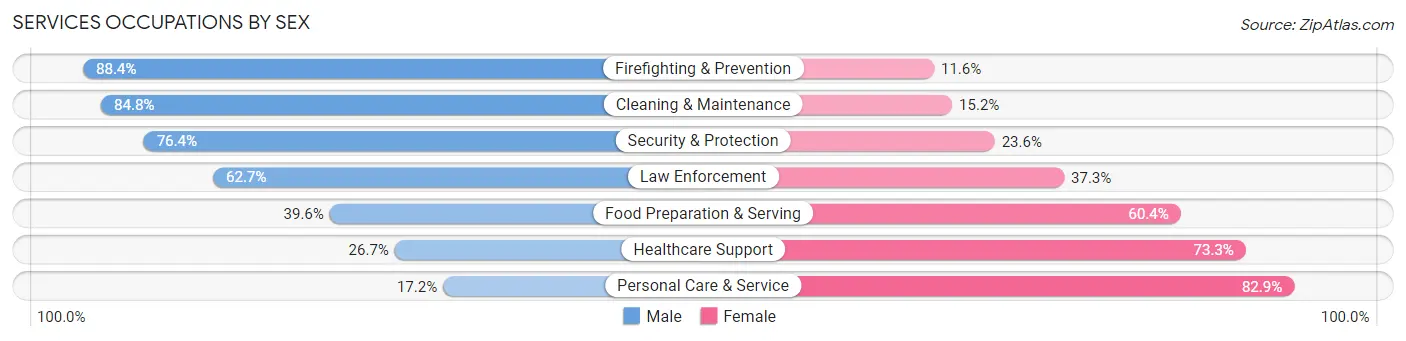
Services Occupations by Sex
Within the Services occupations in Beavercreek, the most male-oriented occupations are Firefighting & Prevention (88.4%), Cleaning & Maintenance (84.8%), and Security & Protection (76.4%), while the most female-oriented occupations are Personal Care & Service (82.9%), Healthcare Support (73.3%), and Food Preparation & Serving (60.4%).
| Occupation | Male | Female |
| Healthcare Support | 144 (26.7%) | 395 (73.3%) |
| Security & Protection | 395 (76.4%) | 122 (23.6%) |
| Firefighting & Prevention | 244 (88.4%) | 32 (11.6%) |
| Law Enforcement | 151 (62.7%) | 90 (37.3%) |
| Food Preparation & Serving | 320 (39.6%) | 488 (60.4%) |
| Cleaning & Maintenance | 246 (84.8%) | 44 (15.2%) |
| Personal Care & Service | 59 (17.2%) | 285 (82.9%) |
| Total (Category) | 1,164 (46.6%) | 1,334 (53.4%) |
| Total (Overall) | 12,891 (55.7%) | 10,237 (44.3%) |
Sales and Office Occupations
The most common Sales and Office occupations in Beavercreek are Office & Administration (2,076 | 9.0%), and Sales & Related (1,974 | 8.5%).

Sales and Office Occupations by Sex
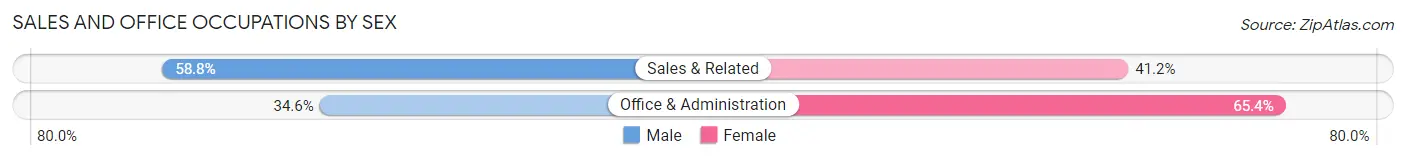
| Occupation | Male | Female |
| Sales & Related | 1,161 (58.8%) | 813 (41.2%) |
| Office & Administration | 719 (34.6%) | 1,357 (65.4%) |
| Total (Category) | 1,880 (46.4%) | 2,170 (53.6%) |
| Total (Overall) | 12,891 (55.7%) | 10,237 (44.3%) |
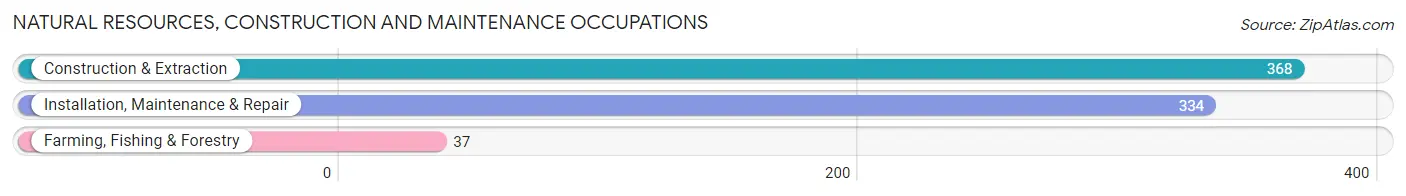
Natural Resources, Construction and Maintenance Occupations
The most common Natural Resources, Construction and Maintenance occupations in Beavercreek are Construction & Extraction (368 | 1.6%), Installation, Maintenance & Repair (334 | 1.4%), and Farming, Fishing & Forestry (37 | 0.2%).
Natural Resources, Construction and Maintenance Occupations by Sex
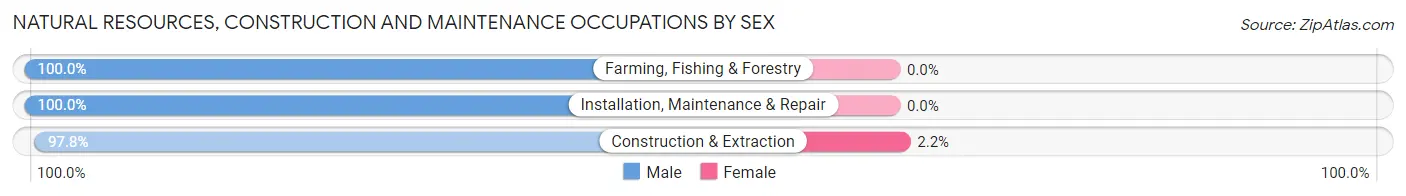
| Occupation | Male | Female |
| Farming, Fishing & Forestry | 37 (100.0%) | 0 (0.0%) |
| Construction & Extraction | 360 (97.8%) | 8 (2.2%) |
| Installation, Maintenance & Repair | 334 (100.0%) | 0 (0.0%) |
| Total (Category) | 731 (98.9%) | 8 (1.1%) |
| Total (Overall) | 12,891 (55.7%) | 10,237 (44.3%) |
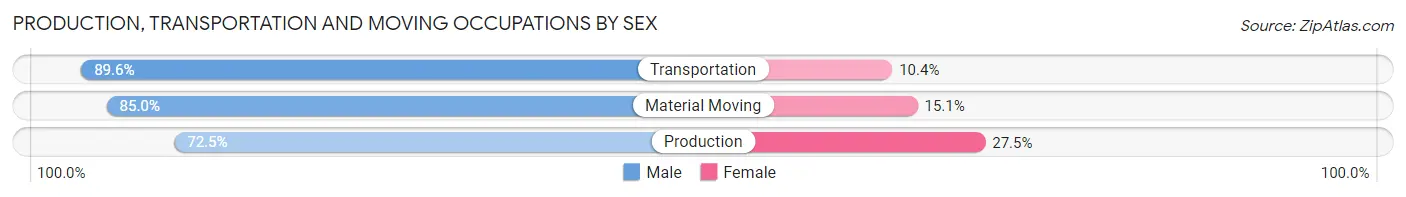
Production, Transportation and Moving Occupations
The most common Production, Transportation and Moving occupations in Beavercreek are Production (1,012 | 4.4%), Transportation (596 | 2.6%), and Material Moving (465 | 2.0%).
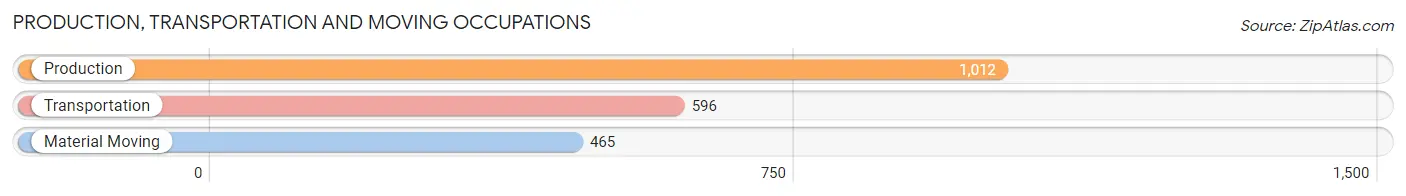
Production, Transportation and Moving Occupations by Sex
| Occupation | Male | Female |
| Production | 734 (72.5%) | 278 (27.5%) |
| Transportation | 534 (89.6%) | 62 (10.4%) |
| Material Moving | 395 (85.0%) | 70 (15.0%) |
| Total (Category) | 1,663 (80.2%) | 410 (19.8%) |
| Total (Overall) | 12,891 (55.7%) | 10,237 (44.3%) |
Employment Industries by Sex in Beavercreek
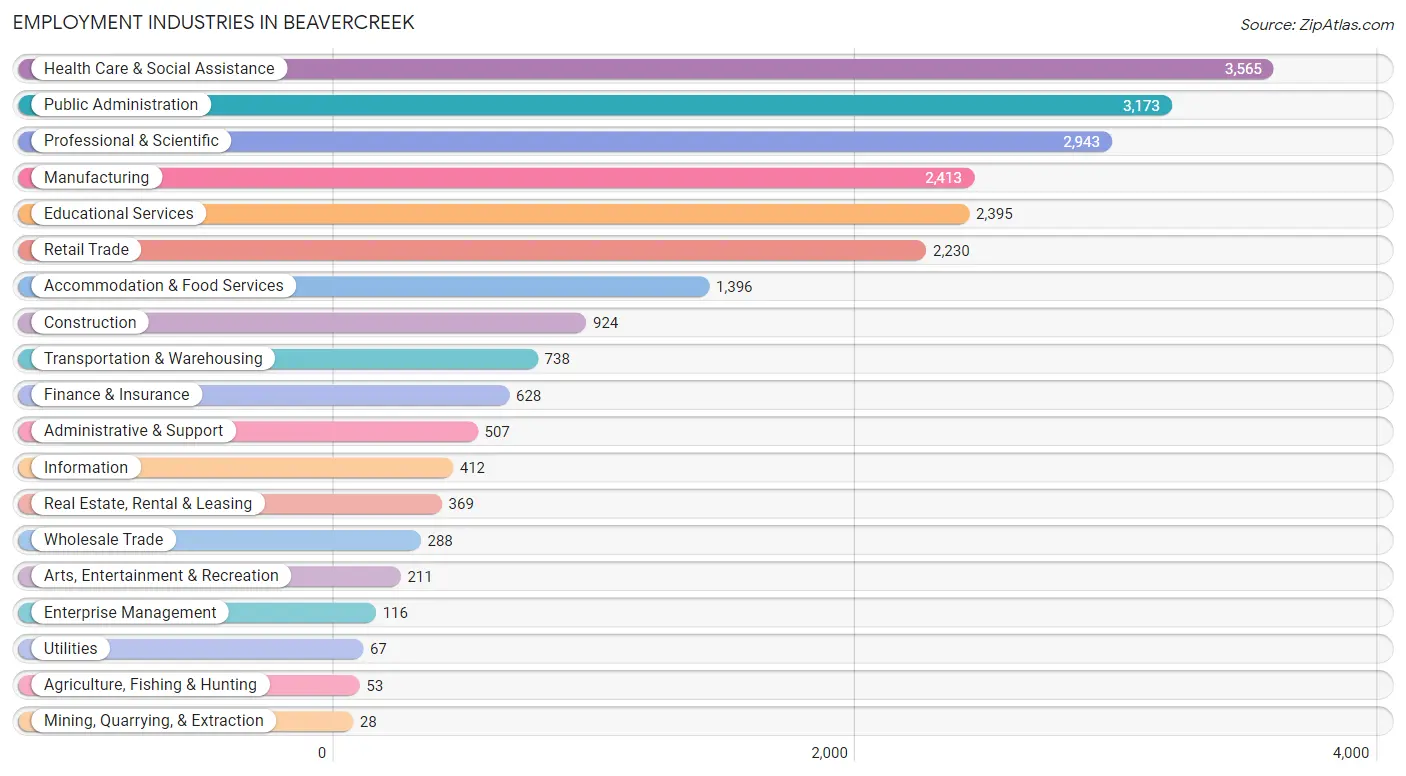
Employment Industries in Beavercreek
The major employment industries in Beavercreek include Health Care & Social Assistance (3,565 | 15.4%), Public Administration (3,173 | 13.7%), Professional & Scientific (2,943 | 12.7%), Manufacturing (2,413 | 10.4%), and Educational Services (2,395 | 10.4%).
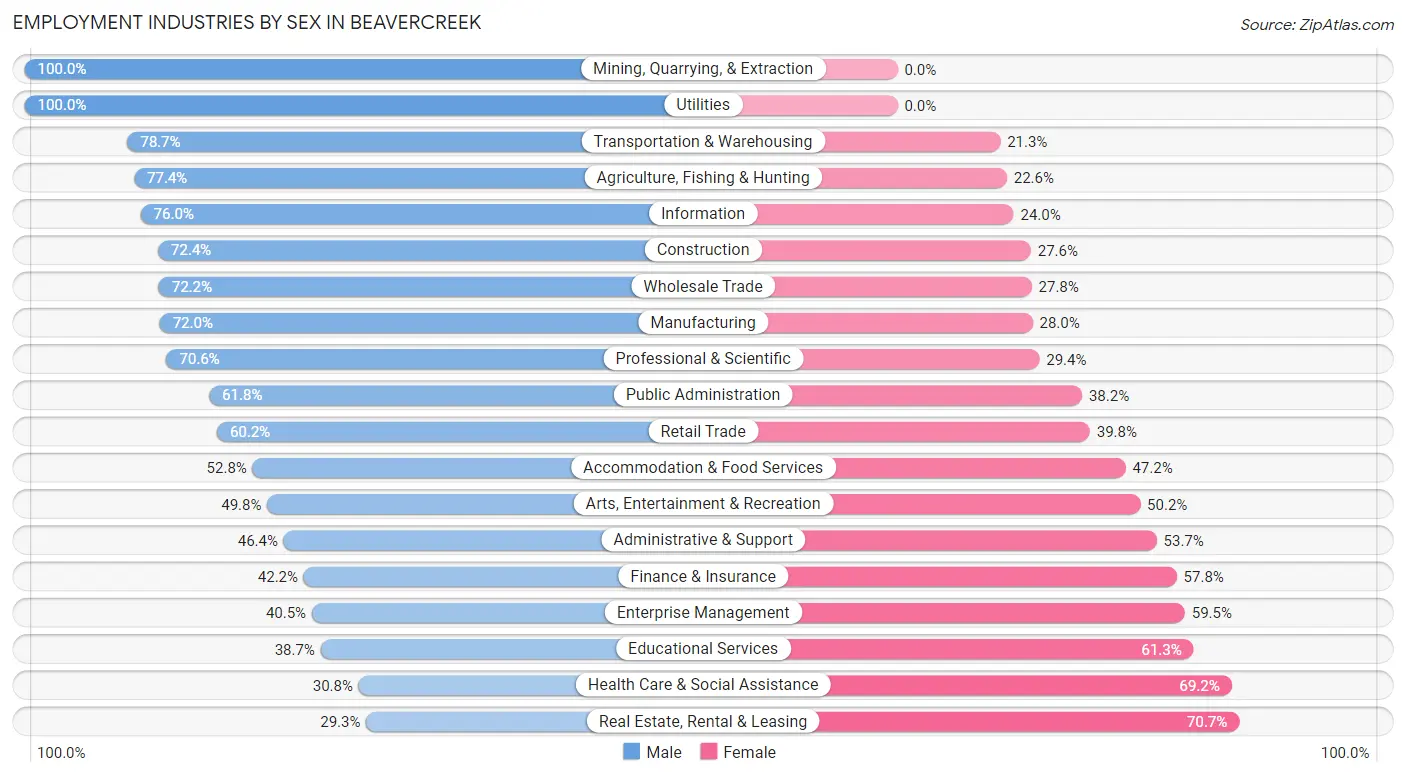
Employment Industries by Sex in Beavercreek
The Beavercreek industries that see more men than women are Mining, Quarrying, & Extraction (100.0%), Utilities (100.0%), and Transportation & Warehousing (78.7%), whereas the industries that tend to have a higher number of women are Real Estate, Rental & Leasing (70.7%), Health Care & Social Assistance (69.2%), and Educational Services (61.3%).
| Industry | Male | Female |
| Agriculture, Fishing & Hunting | 41 (77.4%) | 12 (22.6%) |
| Mining, Quarrying, & Extraction | 28 (100.0%) | 0 (0.0%) |
| Construction | 669 (72.4%) | 255 (27.6%) |
| Manufacturing | 1,738 (72.0%) | 675 (28.0%) |
| Wholesale Trade | 208 (72.2%) | 80 (27.8%) |
| Retail Trade | 1,342 (60.2%) | 888 (39.8%) |
| Transportation & Warehousing | 581 (78.7%) | 157 (21.3%) |
| Utilities | 67 (100.0%) | 0 (0.0%) |
| Information | 313 (76.0%) | 99 (24.0%) |
| Finance & Insurance | 265 (42.2%) | 363 (57.8%) |
| Real Estate, Rental & Leasing | 108 (29.3%) | 261 (70.7%) |
| Professional & Scientific | 2,079 (70.6%) | 864 (29.4%) |
| Enterprise Management | 47 (40.5%) | 69 (59.5%) |
| Administrative & Support | 235 (46.4%) | 272 (53.6%) |
| Educational Services | 927 (38.7%) | 1,468 (61.3%) |
| Health Care & Social Assistance | 1,099 (30.8%) | 2,466 (69.2%) |
| Arts, Entertainment & Recreation | 105 (49.8%) | 106 (50.2%) |
| Accommodation & Food Services | 737 (52.8%) | 659 (47.2%) |
| Public Administration | 1,961 (61.8%) | 1,212 (38.2%) |
| Total | 12,891 (55.7%) | 10,237 (44.3%) |
Education in Beavercreek
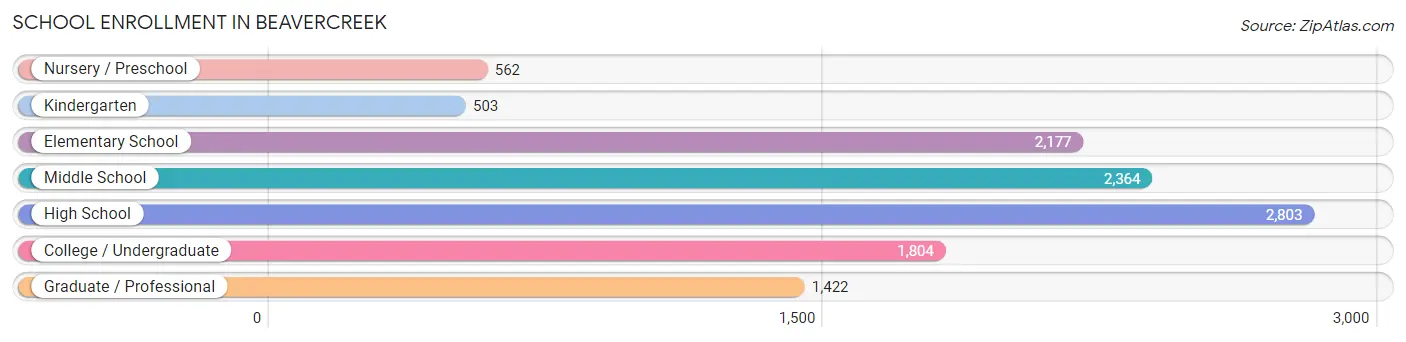
School Enrollment in Beavercreek
The most common levels of schooling among the 11,635 students in Beavercreek are high school (2,803 | 24.1%), middle school (2,364 | 20.3%), and elementary school (2,177 | 18.7%).
| School Level | # Students | % Students |
| Nursery / Preschool | 562 | 4.8% |
| Kindergarten | 503 | 4.3% |
| Elementary School | 2,177 | 18.7% |
| Middle School | 2,364 | 20.3% |
| High School | 2,803 | 24.1% |
| College / Undergraduate | 1,804 | 15.5% |
| Graduate / Professional | 1,422 | 12.2% |
| Total | 11,635 | 100.0% |
School Enrollment by Age by Funding Source in Beavercreek
Out of a total of 11,635 students who are enrolled in schools in Beavercreek, 2,653 (22.8%) attend a private institution, while the remaining 8,982 (77.2%) are enrolled in public schools. The age group of 35 years and over has the highest likelihood of being enrolled in private schools, with 375 (41.9% in the age bracket) enrolled. Conversely, the age group of 15 to 17 year olds has the lowest likelihood of being enrolled in a private school, with 1,607 (87.7% in the age bracket) attending a public institution.
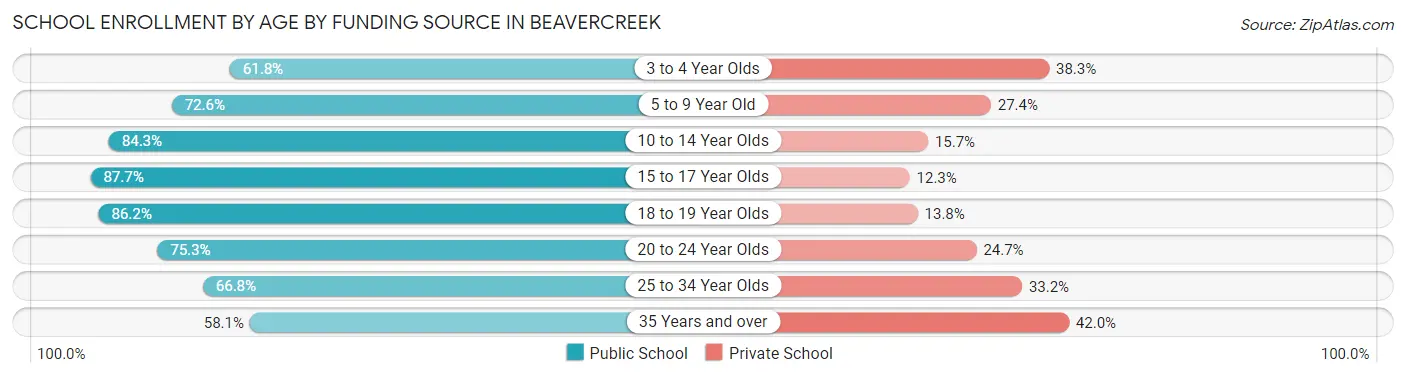
| Age Bracket | Public School | Private School |
| 3 to 4 Year Olds | 226 (61.8%) | 140 (38.3%) |
| 5 to 9 Year Old | 1,912 (72.6%) | 722 (27.4%) |
| 10 to 14 Year Olds | 2,433 (84.3%) | 453 (15.7%) |
| 15 to 17 Year Olds | 1,607 (87.7%) | 225 (12.3%) |
| 18 to 19 Year Olds | 814 (86.2%) | 130 (13.8%) |
| 20 to 24 Year Olds | 767 (75.3%) | 252 (24.7%) |
| 25 to 34 Year Olds | 708 (66.8%) | 352 (33.2%) |
| 35 Years and over | 519 (58.1%) | 375 (41.9%) |
| Total | 8,982 (77.2%) | 2,653 (22.8%) |
Educational Attainment by Field of Study in Beavercreek
Business (4,254 | 22.8%), engineering (2,971 | 15.9%), science & technology (2,128 | 11.4%), education (1,841 | 9.9%), and bio, nature & agricultural (1,061 | 5.7%) are the most common fields of study among 18,687 individuals in Beavercreek who have obtained a bachelor's degree or higher.
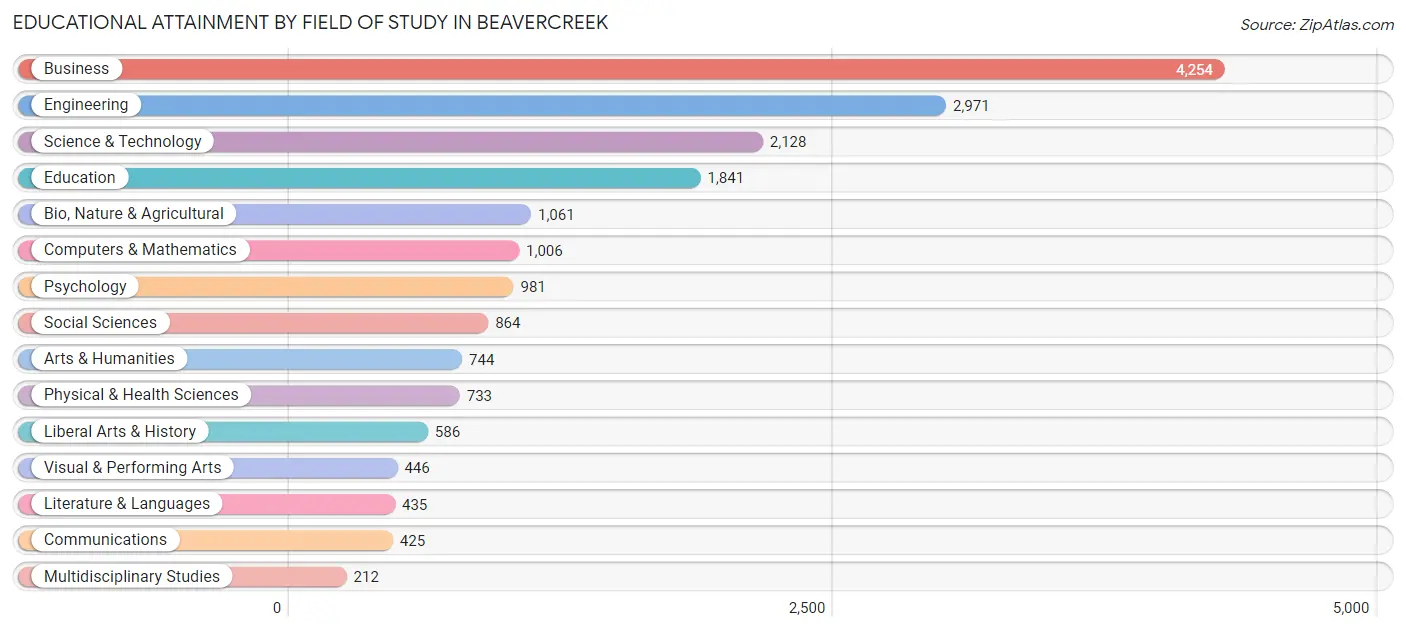
| Field of Study | # Graduates | % Graduates |
| Computers & Mathematics | 1,006 | 5.4% |
| Bio, Nature & Agricultural | 1,061 | 5.7% |
| Physical & Health Sciences | 733 | 3.9% |
| Psychology | 981 | 5.2% |
| Social Sciences | 864 | 4.6% |
| Engineering | 2,971 | 15.9% |
| Multidisciplinary Studies | 212 | 1.1% |
| Science & Technology | 2,128 | 11.4% |
| Business | 4,254 | 22.8% |
| Education | 1,841 | 9.9% |
| Literature & Languages | 435 | 2.3% |
| Liberal Arts & History | 586 | 3.1% |
| Visual & Performing Arts | 446 | 2.4% |
| Communications | 425 | 2.3% |
| Arts & Humanities | 744 | 4.0% |
| Total | 18,687 | 100.0% |
Transportation & Commute in Beavercreek
Vehicle Availability by Sex in Beavercreek
The most prevalent vehicle ownership categories in Beavercreek are males with 2 vehicles (5,560, accounting for 42.1%) and females with 2 vehicles (4,190, making up 54.6%).
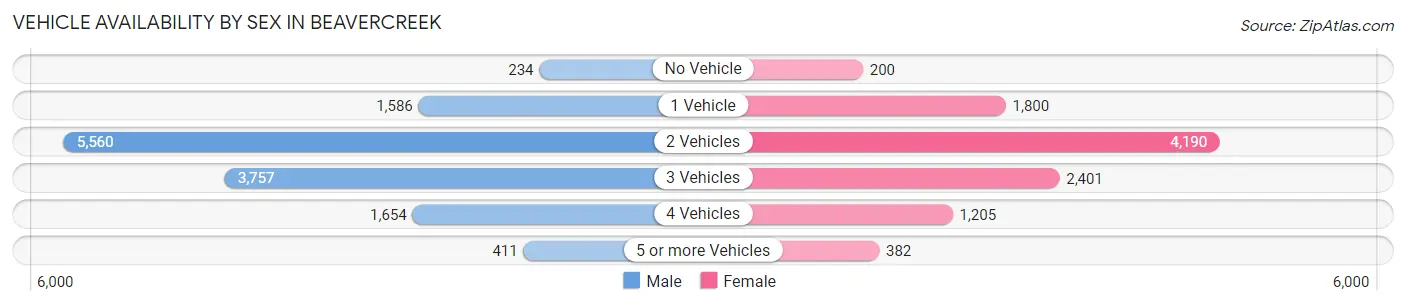
| Vehicles Available | Male | Female |
| No Vehicle | 234 (1.8%) | 200 (2.0%) |
| 1 Vehicle | 1,586 (12.0%) | 1,800 (17.7%) |
| 2 Vehicles | 5,560 (42.1%) | 4,190 (41.2%) |
| 3 Vehicles | 3,757 (28.5%) | 2,401 (23.6%) |
| 4 Vehicles | 1,654 (12.5%) | 1,205 (11.8%) |
| 5 or more Vehicles | 411 (3.1%) | 382 (3.7%) |
| Total | 13,202 (100.0%) | 10,178 (100.0%) |
Commute Time in Beavercreek
The most frequently occuring commute durations in Beavercreek are 15 to 19 minutes (5,045 commuters, 24.4%), 10 to 14 minutes (4,467 commuters, 21.6%), and 20 to 24 minutes (3,841 commuters, 18.6%).
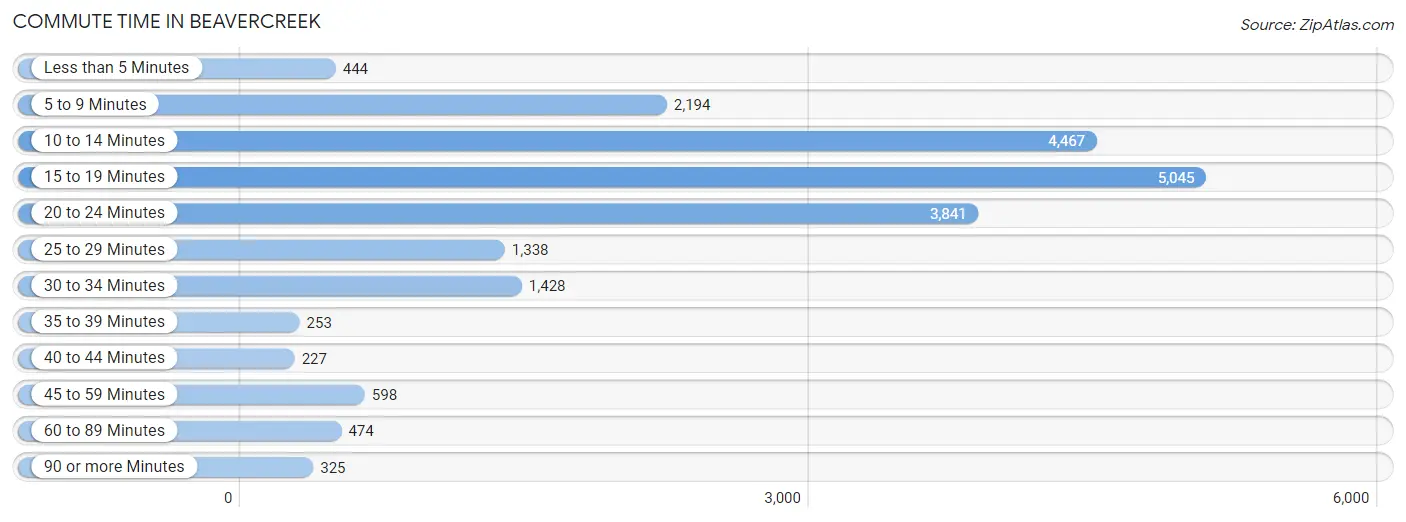
| Commute Time | # Commuters | % Commuters |
| Less than 5 Minutes | 444 | 2.1% |
| 5 to 9 Minutes | 2,194 | 10.6% |
| 10 to 14 Minutes | 4,467 | 21.6% |
| 15 to 19 Minutes | 5,045 | 24.4% |
| 20 to 24 Minutes | 3,841 | 18.6% |
| 25 to 29 Minutes | 1,338 | 6.5% |
| 30 to 34 Minutes | 1,428 | 6.9% |
| 35 to 39 Minutes | 253 | 1.2% |
| 40 to 44 Minutes | 227 | 1.1% |
| 45 to 59 Minutes | 598 | 2.9% |
| 60 to 89 Minutes | 474 | 2.3% |
| 90 or more Minutes | 325 | 1.6% |
Commute Time by Sex in Beavercreek
The most common commute times in Beavercreek are 15 to 19 minutes (2,983 commuters, 25.0%) for males and 15 to 19 minutes (2,062 commuters, 23.7%) for females.
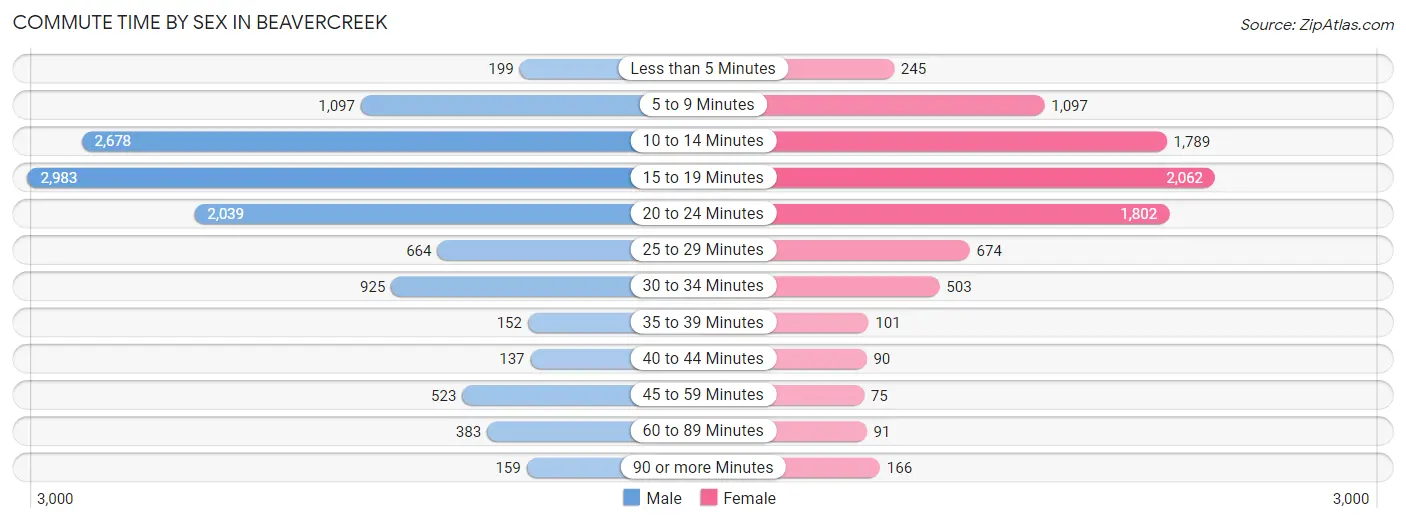
| Commute Time | Male | Female |
| Less than 5 Minutes | 199 (1.7%) | 245 (2.8%) |
| 5 to 9 Minutes | 1,097 (9.2%) | 1,097 (12.6%) |
| 10 to 14 Minutes | 2,678 (22.4%) | 1,789 (20.6%) |
| 15 to 19 Minutes | 2,983 (25.0%) | 2,062 (23.7%) |
| 20 to 24 Minutes | 2,039 (17.1%) | 1,802 (20.7%) |
| 25 to 29 Minutes | 664 (5.6%) | 674 (7.7%) |
| 30 to 34 Minutes | 925 (7.7%) | 503 (5.8%) |
| 35 to 39 Minutes | 152 (1.3%) | 101 (1.2%) |
| 40 to 44 Minutes | 137 (1.1%) | 90 (1.0%) |
| 45 to 59 Minutes | 523 (4.4%) | 75 (0.9%) |
| 60 to 89 Minutes | 383 (3.2%) | 91 (1.1%) |
| 90 or more Minutes | 159 (1.3%) | 166 (1.9%) |
Time of Departure to Work by Sex in Beavercreek
The most frequent times of departure to work in Beavercreek are 7:00 AM to 7:29 AM (2,184, 18.3%) for males and 7:30 AM to 7:59 AM (1,683, 19.4%) for females.
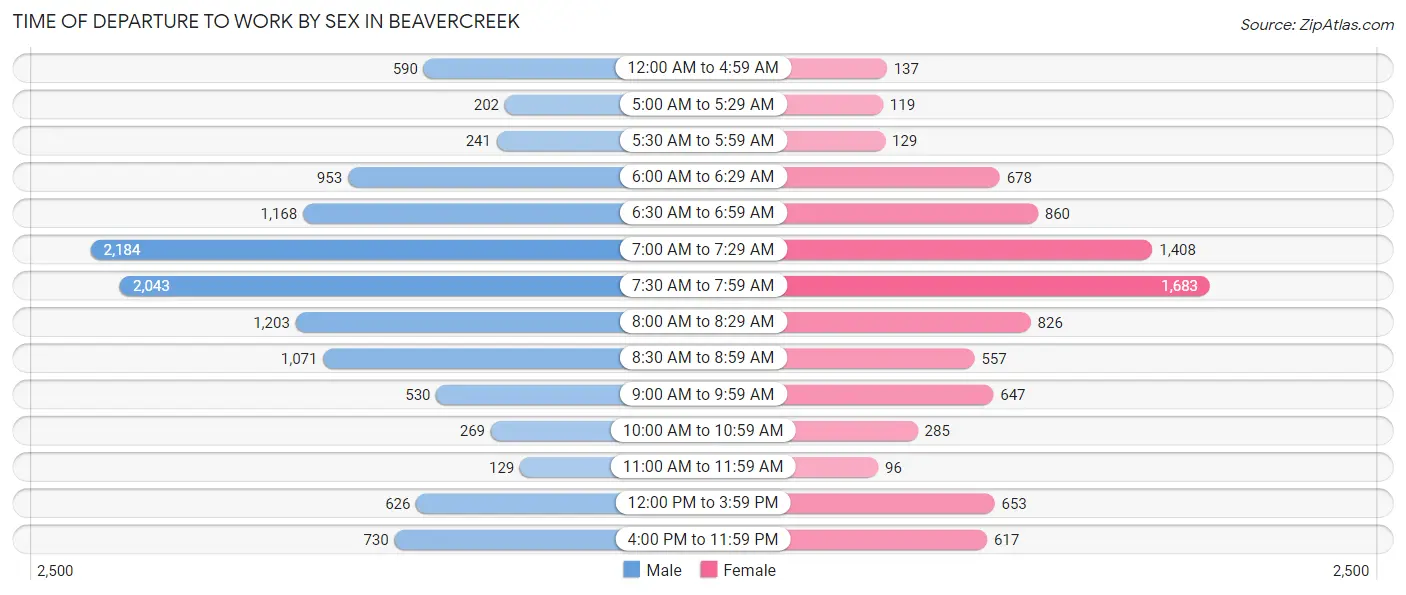
| Time of Departure | Male | Female |
| 12:00 AM to 4:59 AM | 590 (4.9%) | 137 (1.6%) |
| 5:00 AM to 5:29 AM | 202 (1.7%) | 119 (1.4%) |
| 5:30 AM to 5:59 AM | 241 (2.0%) | 129 (1.5%) |
| 6:00 AM to 6:29 AM | 953 (8.0%) | 678 (7.8%) |
| 6:30 AM to 6:59 AM | 1,168 (9.8%) | 860 (9.9%) |
| 7:00 AM to 7:29 AM | 2,184 (18.3%) | 1,408 (16.2%) |
| 7:30 AM to 7:59 AM | 2,043 (17.1%) | 1,683 (19.4%) |
| 8:00 AM to 8:29 AM | 1,203 (10.1%) | 826 (9.5%) |
| 8:30 AM to 8:59 AM | 1,071 (9.0%) | 557 (6.4%) |
| 9:00 AM to 9:59 AM | 530 (4.4%) | 647 (7.4%) |
| 10:00 AM to 10:59 AM | 269 (2.2%) | 285 (3.3%) |
| 11:00 AM to 11:59 AM | 129 (1.1%) | 96 (1.1%) |
| 12:00 PM to 3:59 PM | 626 (5.2%) | 653 (7.5%) |
| 4:00 PM to 11:59 PM | 730 (6.1%) | 617 (7.1%) |
| Total | 11,939 (100.0%) | 8,695 (100.0%) |
Housing Occupancy in Beavercreek
Occupancy by Ownership in Beavercreek
Of the total 18,891 dwellings in Beavercreek, owner-occupied units account for 13,829 (73.2%), while renter-occupied units make up 5,062 (26.8%).
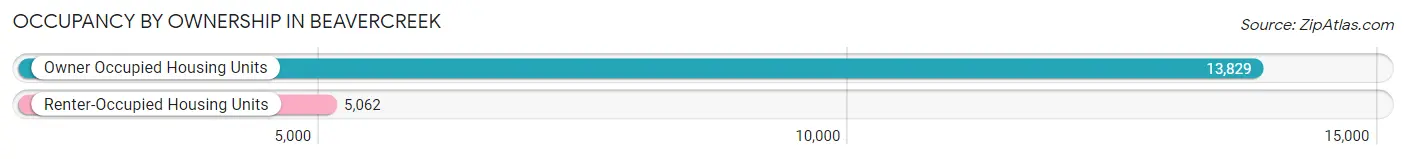
| Occupancy | # Housing Units | % Housing Units |
| Owner Occupied Housing Units | 13,829 | 73.2% |
| Renter-Occupied Housing Units | 5,062 | 26.8% |
| Total Occupied Housing Units | 18,891 | 100.0% |
Occupancy by Household Size in Beavercreek
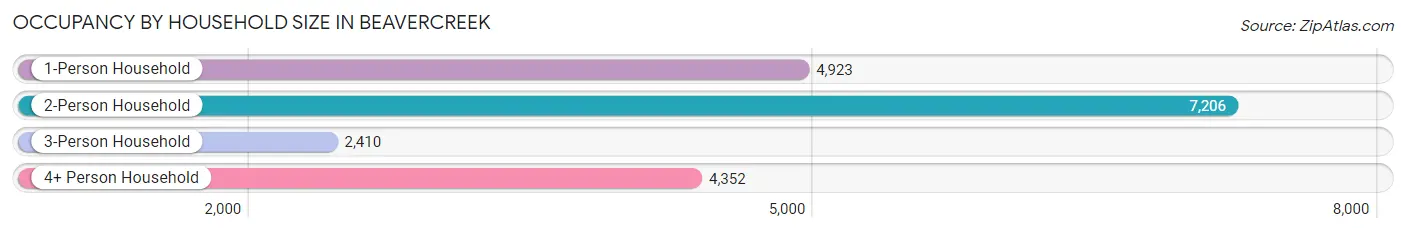
| Household Size | # Housing Units | % Housing Units |
| 1-Person Household | 4,923 | 26.1% |
| 2-Person Household | 7,206 | 38.2% |
| 3-Person Household | 2,410 | 12.8% |
| 4+ Person Household | 4,352 | 23.0% |
| Total Housing Units | 18,891 | 100.0% |
Occupancy by Ownership by Household Size in Beavercreek
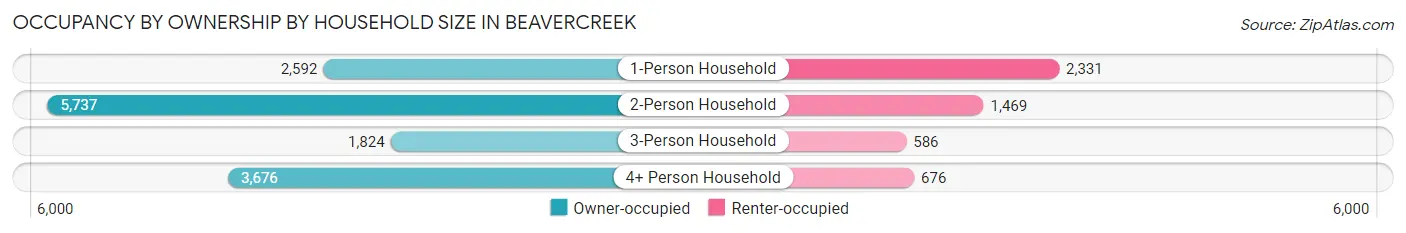
| Household Size | Owner-occupied | Renter-occupied |
| 1-Person Household | 2,592 (52.6%) | 2,331 (47.3%) |
| 2-Person Household | 5,737 (79.6%) | 1,469 (20.4%) |
| 3-Person Household | 1,824 (75.7%) | 586 (24.3%) |
| 4+ Person Household | 3,676 (84.5%) | 676 (15.5%) |
| Total Housing Units | 13,829 (73.2%) | 5,062 (26.8%) |
Occupancy by Educational Attainment in Beavercreek
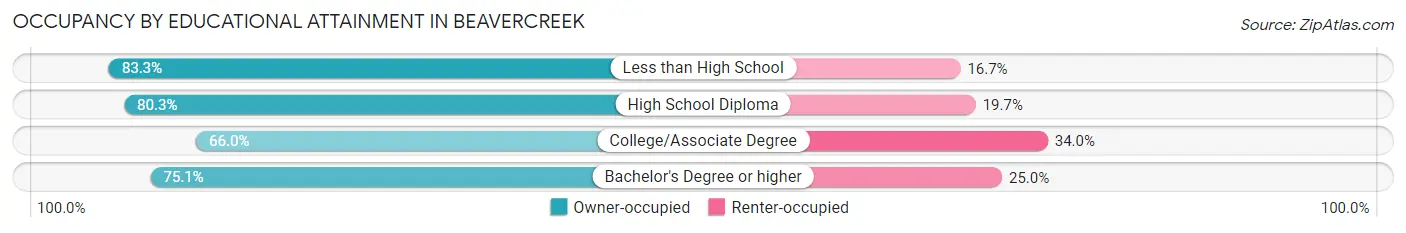
| Household Size | Owner-occupied | Renter-occupied |
| Less than High School | 304 (83.3%) | 61 (16.7%) |
| High School Diploma | 1,663 (80.3%) | 409 (19.7%) |
| College/Associate Degree | 3,542 (66.0%) | 1,826 (34.0%) |
| Bachelor's Degree or higher | 8,320 (75.0%) | 2,766 (24.9%) |
Occupancy by Age of Householder in Beavercreek
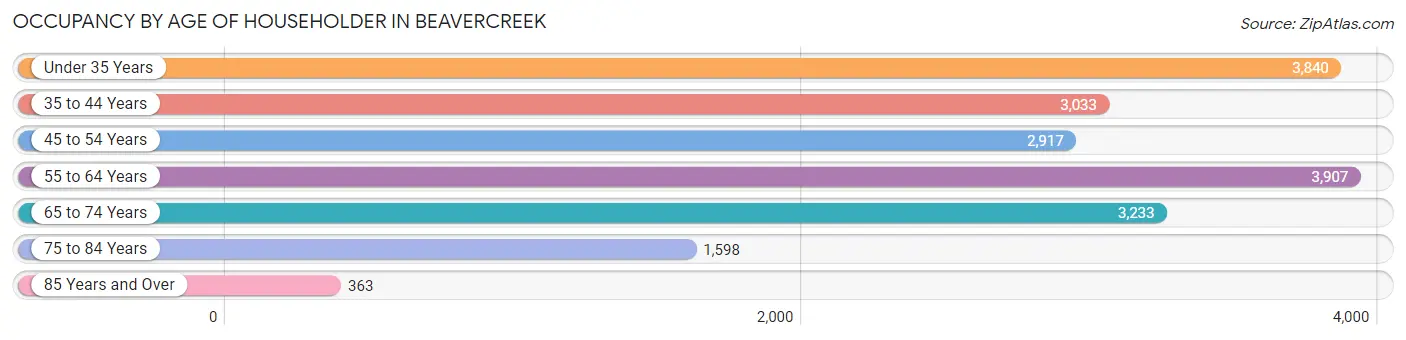
| Age Bracket | # Households | % Households |
| Under 35 Years | 3,840 | 20.3% |
| 35 to 44 Years | 3,033 | 16.1% |
| 45 to 54 Years | 2,917 | 15.4% |
| 55 to 64 Years | 3,907 | 20.7% |
| 65 to 74 Years | 3,233 | 17.1% |
| 75 to 84 Years | 1,598 | 8.5% |
| 85 Years and Over | 363 | 1.9% |
| Total | 18,891 | 100.0% |
Housing Finances in Beavercreek
Median Income by Occupancy in Beavercreek
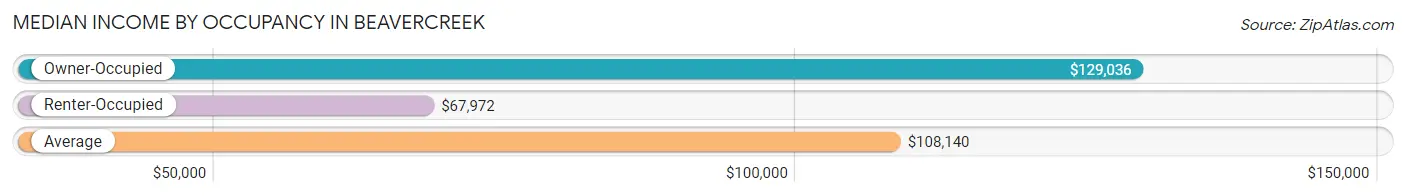
| Occupancy Type | # Households | Median Income |
| Owner-Occupied | 13,829 (73.2%) | $129,036 |
| Renter-Occupied | 5,062 (26.8%) | $67,972 |
| Average | 18,891 (100.0%) | $108,140 |
Occupancy by Householder Income Bracket in Beavercreek
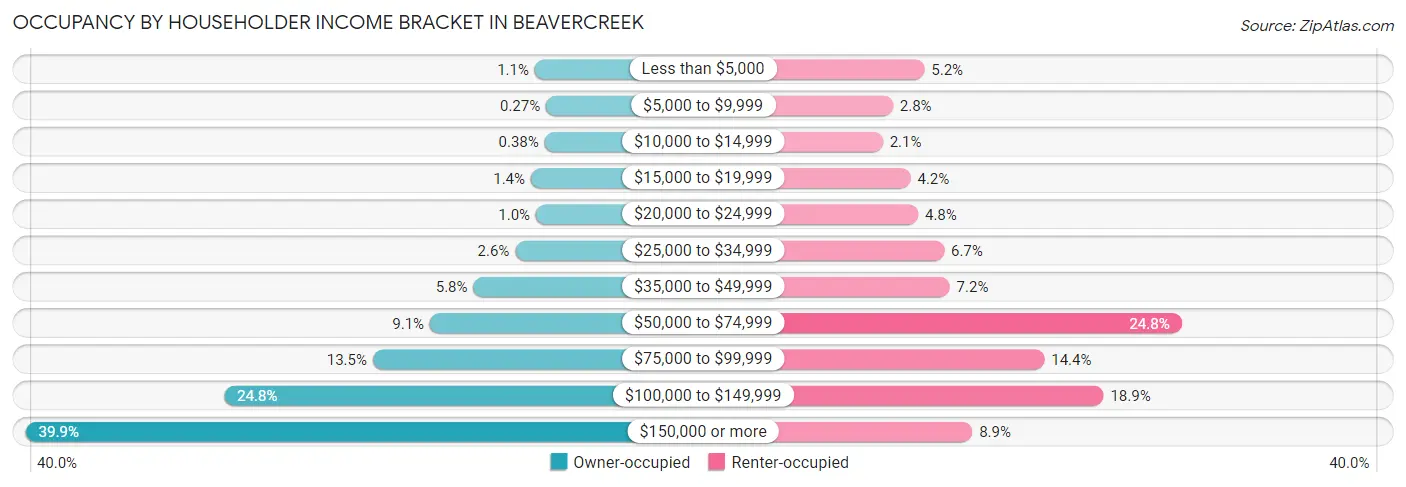
| Income Bracket | Owner-occupied | Renter-occupied |
| Less than $5,000 | 156 (1.1%) | 265 (5.2%) |
| $5,000 to $9,999 | 38 (0.3%) | 144 (2.8%) |
| $10,000 to $14,999 | 53 (0.4%) | 105 (2.1%) |
| $15,000 to $19,999 | 198 (1.4%) | 212 (4.2%) |
| $20,000 to $24,999 | 144 (1.0%) | 241 (4.8%) |
| $25,000 to $34,999 | 363 (2.6%) | 341 (6.7%) |
| $35,000 to $49,999 | 803 (5.8%) | 363 (7.2%) |
| $50,000 to $74,999 | 1,261 (9.1%) | 1,257 (24.8%) |
| $75,000 to $99,999 | 1,863 (13.5%) | 728 (14.4%) |
| $100,000 to $149,999 | 3,429 (24.8%) | 956 (18.9%) |
| $150,000 or more | 5,521 (39.9%) | 450 (8.9%) |
| Total | 13,829 (100.0%) | 5,062 (100.0%) |
Monthly Housing Cost Tiers in Beavercreek
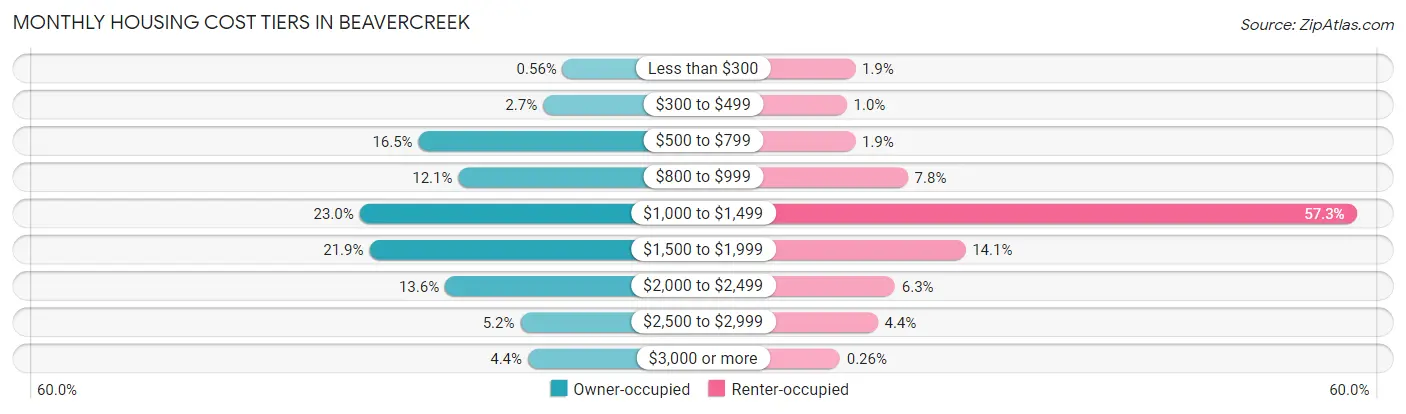
| Monthly Cost | Owner-occupied | Renter-occupied |
| Less than $300 | 78 (0.6%) | 98 (1.9%) |
| $300 to $499 | 378 (2.7%) | 51 (1.0%) |
| $500 to $799 | 2,281 (16.5%) | 98 (1.9%) |
| $800 to $999 | 1,672 (12.1%) | 393 (7.8%) |
| $1,000 to $1,499 | 3,180 (23.0%) | 2,902 (57.3%) |
| $1,500 to $1,999 | 3,032 (21.9%) | 715 (14.1%) |
| $2,000 to $2,499 | 1,875 (13.6%) | 321 (6.3%) |
| $2,500 to $2,999 | 725 (5.2%) | 224 (4.4%) |
| $3,000 or more | 608 (4.4%) | 13 (0.3%) |
| Total | 13,829 (100.0%) | 5,062 (100.0%) |
Physical Housing Characteristics in Beavercreek
Housing Structures in Beavercreek
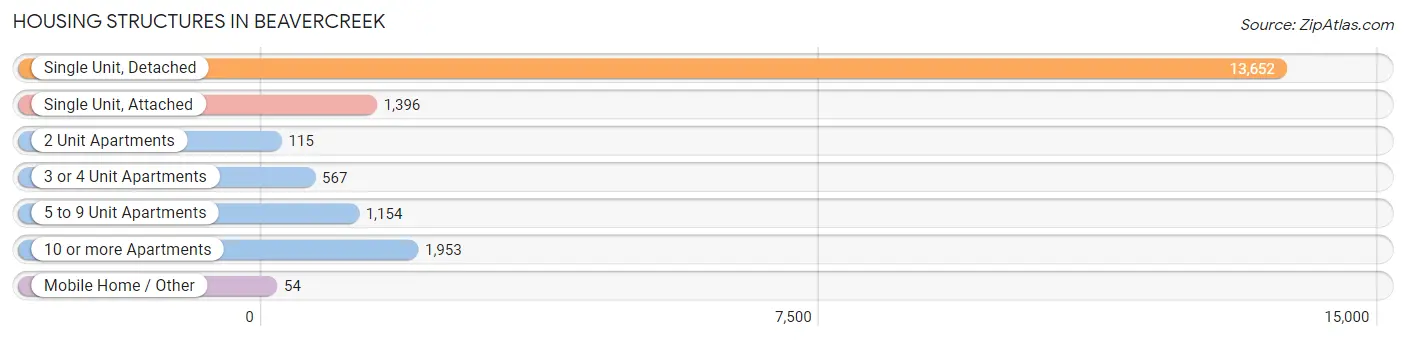
| Structure Type | # Housing Units | % Housing Units |
| Single Unit, Detached | 13,652 | 72.3% |
| Single Unit, Attached | 1,396 | 7.4% |
| 2 Unit Apartments | 115 | 0.6% |
| 3 or 4 Unit Apartments | 567 | 3.0% |
| 5 to 9 Unit Apartments | 1,154 | 6.1% |
| 10 or more Apartments | 1,953 | 10.3% |
| Mobile Home / Other | 54 | 0.3% |
| Total | 18,891 | 100.0% |
Housing Structures by Occupancy in Beavercreek
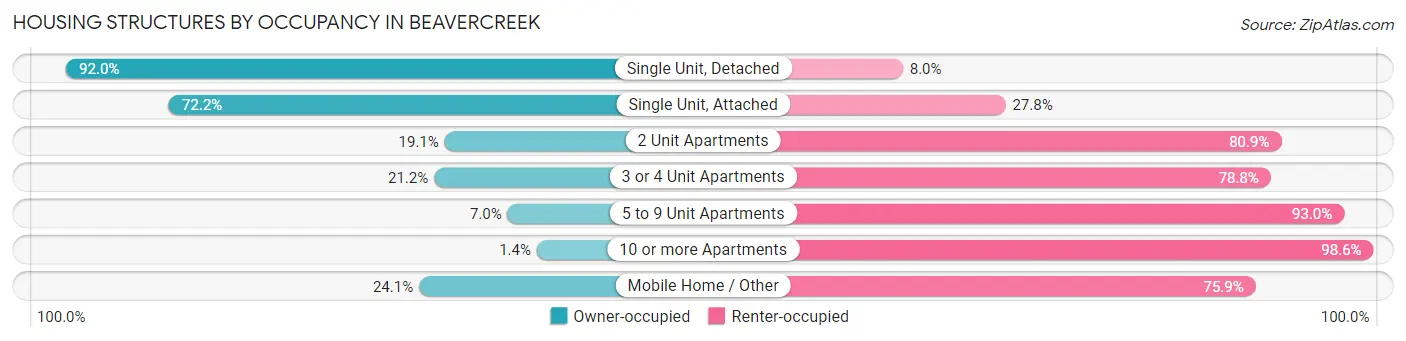
| Structure Type | Owner-occupied | Renter-occupied |
| Single Unit, Detached | 12,558 (92.0%) | 1,094 (8.0%) |
| Single Unit, Attached | 1,008 (72.2%) | 388 (27.8%) |
| 2 Unit Apartments | 22 (19.1%) | 93 (80.9%) |
| 3 or 4 Unit Apartments | 120 (21.2%) | 447 (78.8%) |
| 5 to 9 Unit Apartments | 81 (7.0%) | 1,073 (93.0%) |
| 10 or more Apartments | 27 (1.4%) | 1,926 (98.6%) |
| Mobile Home / Other | 13 (24.1%) | 41 (75.9%) |
| Total | 13,829 (73.2%) | 5,062 (26.8%) |
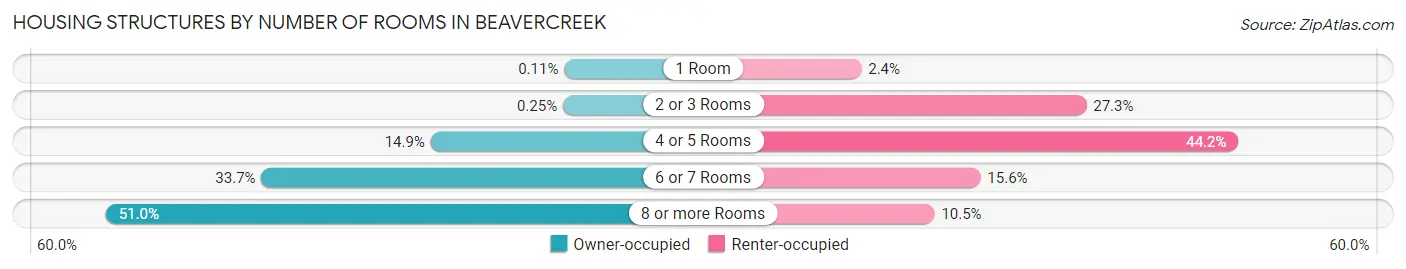
Housing Structures by Number of Rooms in Beavercreek
| Number of Rooms | Owner-occupied | Renter-occupied |
| 1 Room | 15 (0.1%) | 120 (2.4%) |
| 2 or 3 Rooms | 34 (0.3%) | 1,384 (27.3%) |
| 4 or 5 Rooms | 2,065 (14.9%) | 2,238 (44.2%) |
| 6 or 7 Rooms | 4,663 (33.7%) | 789 (15.6%) |
| 8 or more Rooms | 7,052 (51.0%) | 531 (10.5%) |
| Total | 13,829 (100.0%) | 5,062 (100.0%) |
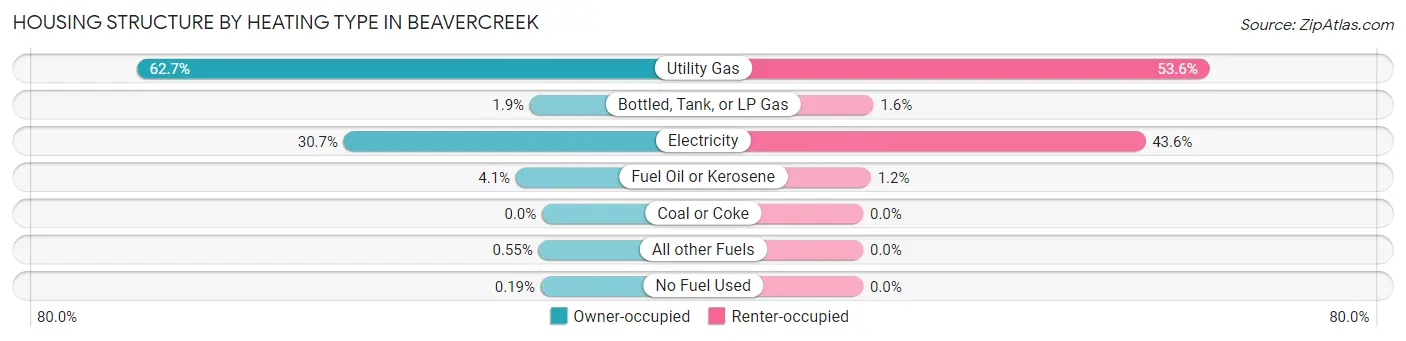
Housing Structure by Heating Type in Beavercreek
| Heating Type | Owner-occupied | Renter-occupied |
| Utility Gas | 8,668 (62.7%) | 2,712 (53.6%) |
| Bottled, Tank, or LP Gas | 260 (1.9%) | 82 (1.6%) |
| Electricity | 4,239 (30.6%) | 2,208 (43.6%) |
| Fuel Oil or Kerosene | 560 (4.1%) | 60 (1.2%) |
| Coal or Coke | 0 (0.0%) | 0 (0.0%) |
| All other Fuels | 76 (0.5%) | 0 (0.0%) |
| No Fuel Used | 26 (0.2%) | 0 (0.0%) |
| Total | 13,829 (100.0%) | 5,062 (100.0%) |
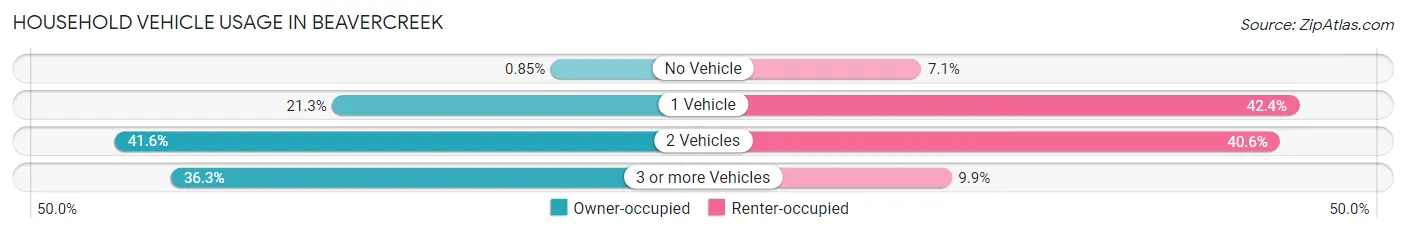
Household Vehicle Usage in Beavercreek
| Vehicles per Household | Owner-occupied | Renter-occupied |
| No Vehicle | 118 (0.9%) | 360 (7.1%) |
| 1 Vehicle | 2,938 (21.2%) | 2,145 (42.4%) |
| 2 Vehicles | 5,749 (41.6%) | 2,054 (40.6%) |
| 3 or more Vehicles | 5,024 (36.3%) | 503 (9.9%) |
| Total | 13,829 (100.0%) | 5,062 (100.0%) |
Real Estate & Mortgages in Beavercreek
Real Estate and Mortgage Overview in Beavercreek
| Characteristic | Without Mortgage | With Mortgage |
| Housing Units | 4,934 | 8,895 |
| Median Property Value | $241,000 | $247,900 |
| Median Household Income | $115,000 | $3,818 |
| Monthly Housing Costs | $787 | $608 |
| Real Estate Taxes | $4,881 | $69 |
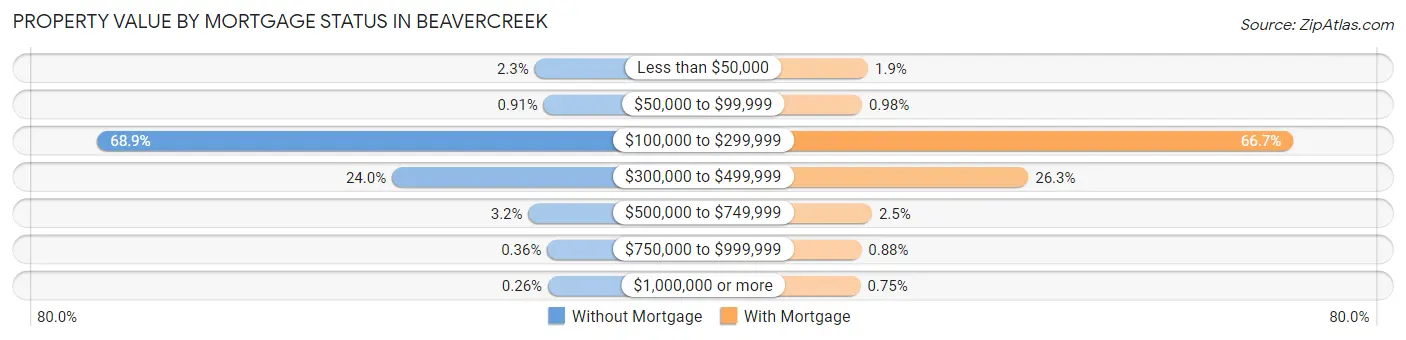
Property Value by Mortgage Status in Beavercreek
| Property Value | Without Mortgage | With Mortgage |
| Less than $50,000 | 113 (2.3%) | 170 (1.9%) |
| $50,000 to $99,999 | 45 (0.9%) | 87 (1.0%) |
| $100,000 to $299,999 | 3,400 (68.9%) | 5,930 (66.7%) |
| $300,000 to $499,999 | 1,185 (24.0%) | 2,341 (26.3%) |
| $500,000 to $749,999 | 160 (3.2%) | 222 (2.5%) |
| $750,000 to $999,999 | 18 (0.4%) | 78 (0.9%) |
| $1,000,000 or more | 13 (0.3%) | 67 (0.7%) |
| Total | 4,934 (100.0%) | 8,895 (100.0%) |
Household Income by Mortgage Status in Beavercreek
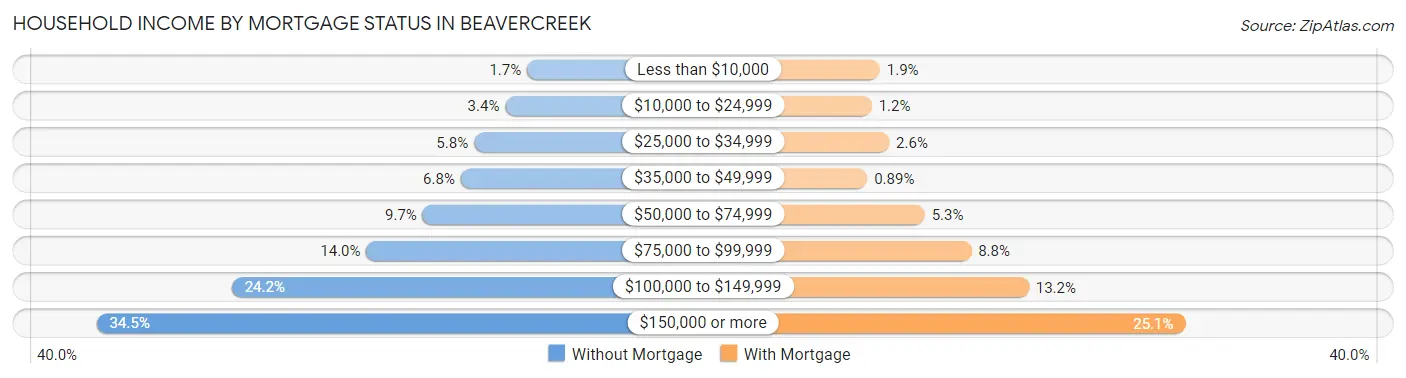
| Household Income | Without Mortgage | With Mortgage |
| Less than $10,000 | 85 (1.7%) | 165 (1.8%) |
| $10,000 to $24,999 | 167 (3.4%) | 109 (1.2%) |
| $25,000 to $34,999 | 284 (5.8%) | 228 (2.6%) |
| $35,000 to $49,999 | 334 (6.8%) | 79 (0.9%) |
| $50,000 to $74,999 | 477 (9.7%) | 469 (5.3%) |
| $75,000 to $99,999 | 689 (14.0%) | 784 (8.8%) |
| $100,000 to $149,999 | 1,195 (24.2%) | 1,174 (13.2%) |
| $150,000 or more | 1,703 (34.5%) | 2,234 (25.1%) |
| Total | 4,934 (100.0%) | 8,895 (100.0%) |
Property Value to Household Income Ratio in Beavercreek
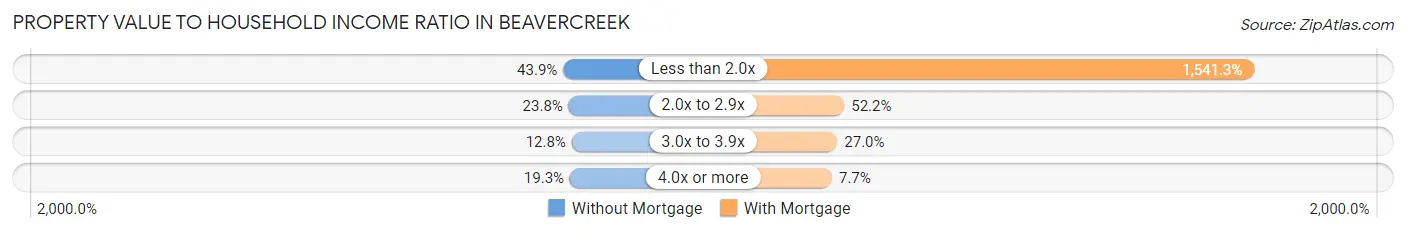
| Value-to-Income Ratio | Without Mortgage | With Mortgage |
| Less than 2.0x | 2,166 (43.9%) | 137,094 (1,541.2%) |
| 2.0x to 2.9x | 1,176 (23.8%) | 4,643 (52.2%) |
| 3.0x to 3.9x | 630 (12.8%) | 2,399 (27.0%) |
| 4.0x or more | 950 (19.3%) | 686 (7.7%) |
| Total | 4,934 (100.0%) | 8,895 (100.0%) |
Real Estate Taxes by Mortgage Status in Beavercreek
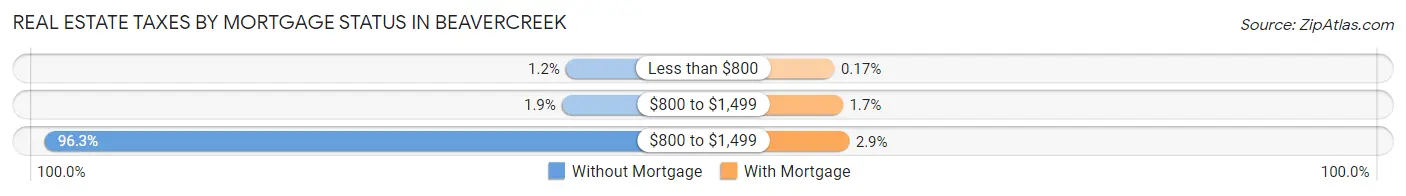
| Property Taxes | Without Mortgage | With Mortgage |
| Less than $800 | 58 (1.2%) | 15 (0.2%) |
| $800 to $1,499 | 94 (1.9%) | 153 (1.7%) |
| $800 to $1,499 | 4,751 (96.3%) | 255 (2.9%) |
| Total | 4,934 (100.0%) | 8,895 (100.0%) |
Health & Disability in Beavercreek
Health Insurance Coverage by Age in Beavercreek
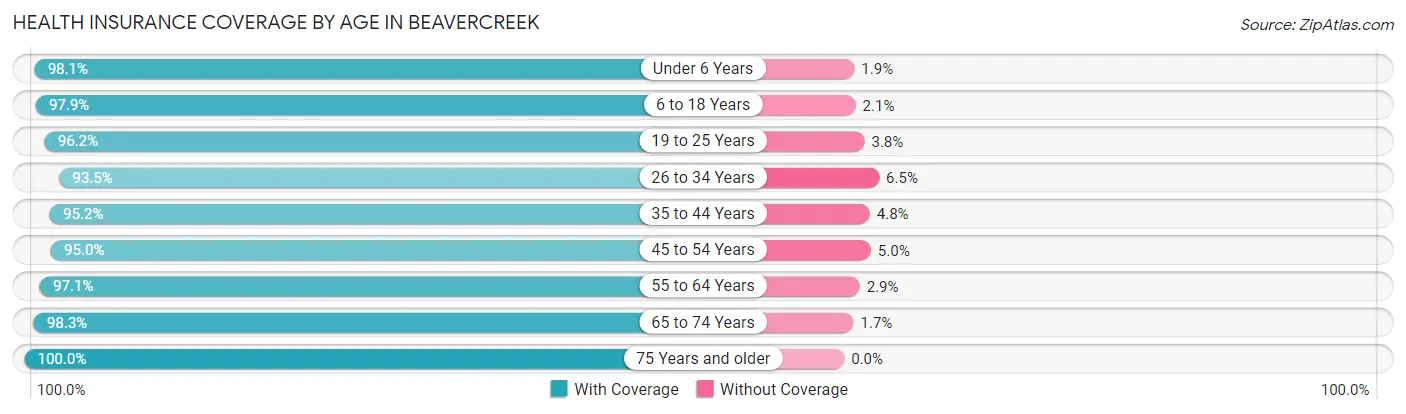
| Age Bracket | With Coverage | Without Coverage |
| Under 6 Years | 2,704 (98.1%) | 52 (1.9%) |
| 6 to 18 Years | 7,679 (97.9%) | 166 (2.1%) |
| 19 to 25 Years | 3,271 (96.2%) | 128 (3.8%) |
| 26 to 34 Years | 4,845 (93.5%) | 337 (6.5%) |
| 35 to 44 Years | 4,982 (95.2%) | 249 (4.8%) |
| 45 to 54 Years | 5,212 (95.0%) | 272 (5.0%) |
| 55 to 64 Years | 6,318 (97.1%) | 188 (2.9%) |
| 65 to 74 Years | 5,599 (98.3%) | 99 (1.7%) |
| 75 Years and older | 3,199 (100.0%) | 0 (0.0%) |
| Total | 43,809 (96.7%) | 1,491 (3.3%) |
Health Insurance Coverage by Citizenship Status in Beavercreek
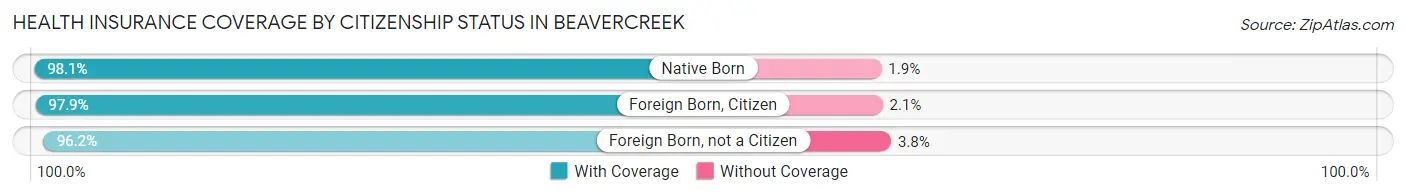
| Citizenship Status | With Coverage | Without Coverage |
| Native Born | 2,704 (98.1%) | 52 (1.9%) |
| Foreign Born, Citizen | 7,679 (97.9%) | 166 (2.1%) |
| Foreign Born, not a Citizen | 3,271 (96.2%) | 128 (3.8%) |
Health Insurance Coverage by Household Income in Beavercreek
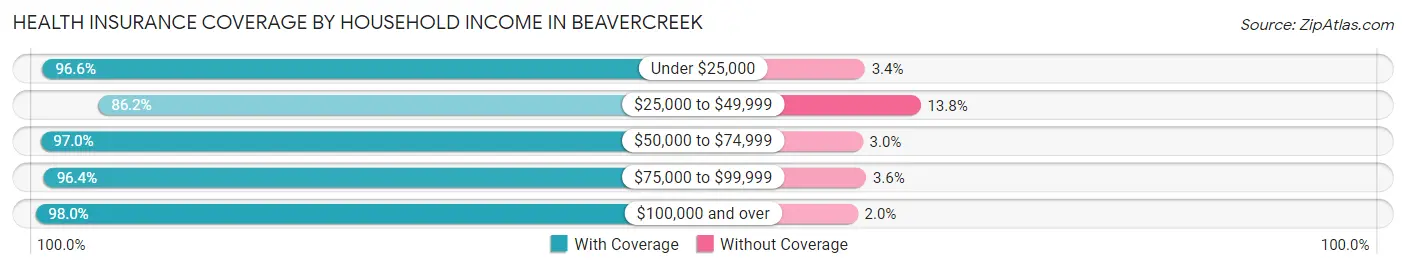
| Household Income | With Coverage | Without Coverage |
| Under $25,000 | 2,473 (96.6%) | 86 (3.4%) |
| $25,000 to $49,999 | 2,790 (86.2%) | 447 (13.8%) |
| $50,000 to $74,999 | 4,433 (97.0%) | 135 (3.0%) |
| $75,000 to $99,999 | 6,127 (96.4%) | 228 (3.6%) |
| $100,000 and over | 27,943 (98.0%) | 579 (2.0%) |
Public vs Private Health Insurance Coverage by Age in Beavercreek
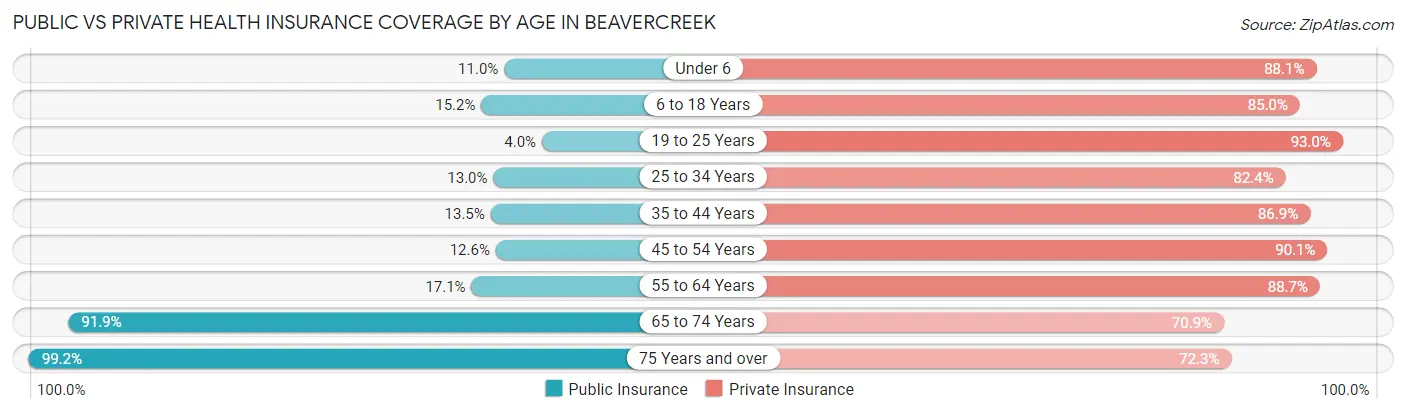
| Age Bracket | Public Insurance | Private Insurance |
| Under 6 | 303 (11.0%) | 2,427 (88.1%) |
| 6 to 18 Years | 1,195 (15.2%) | 6,670 (85.0%) |
| 19 to 25 Years | 135 (4.0%) | 3,160 (93.0%) |
| 25 to 34 Years | 673 (13.0%) | 4,268 (82.4%) |
| 35 to 44 Years | 706 (13.5%) | 4,546 (86.9%) |
| 45 to 54 Years | 688 (12.6%) | 4,942 (90.1%) |
| 55 to 64 Years | 1,110 (17.1%) | 5,772 (88.7%) |
| 65 to 74 Years | 5,235 (91.9%) | 4,041 (70.9%) |
| 75 Years and over | 3,174 (99.2%) | 2,313 (72.3%) |
| Total | 13,219 (29.2%) | 38,139 (84.2%) |
Disability Status by Sex by Age in Beavercreek
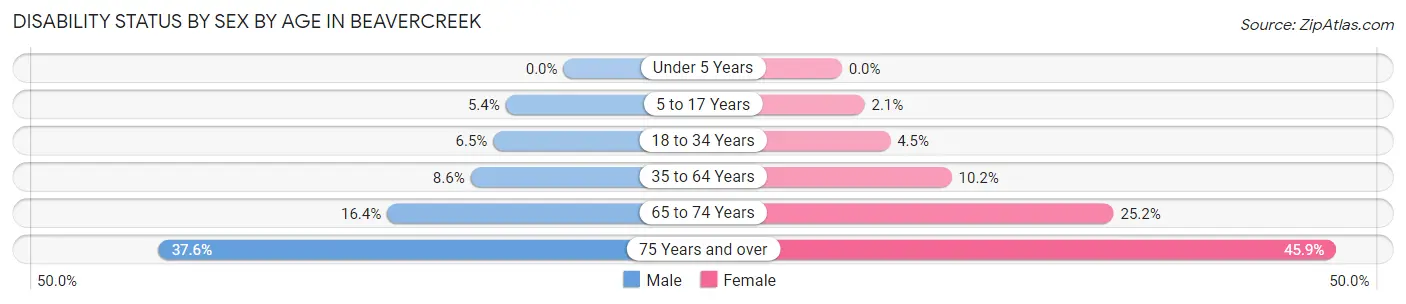
| Age Bracket | Male | Female |
| Under 5 Years | 0 (0.0%) | 0 (0.0%) |
| 5 to 17 Years | 197 (5.4%) | 82 (2.1%) |
| 18 to 34 Years | 322 (6.5%) | 197 (4.5%) |
| 35 to 64 Years | 744 (8.6%) | 875 (10.2%) |
| 65 to 74 Years | 423 (16.4%) | 785 (25.2%) |
| 75 Years and over | 517 (37.6%) | 836 (45.9%) |
Disability Class by Sex by Age in Beavercreek
Disability Class: Hearing Difficulty
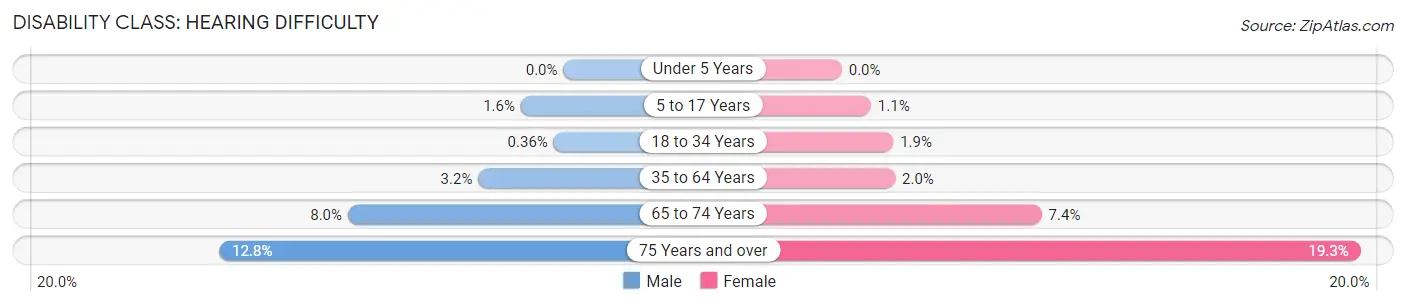
| Age Bracket | Male | Female |
| Under 5 Years | 0 (0.0%) | 0 (0.0%) |
| 5 to 17 Years | 58 (1.6%) | 42 (1.1%) |
| 18 to 34 Years | 18 (0.4%) | 84 (1.9%) |
| 35 to 64 Years | 273 (3.2%) | 170 (2.0%) |
| 65 to 74 Years | 207 (8.0%) | 231 (7.4%) |
| 75 Years and over | 176 (12.8%) | 351 (19.3%) |
Disability Class: Vision Difficulty
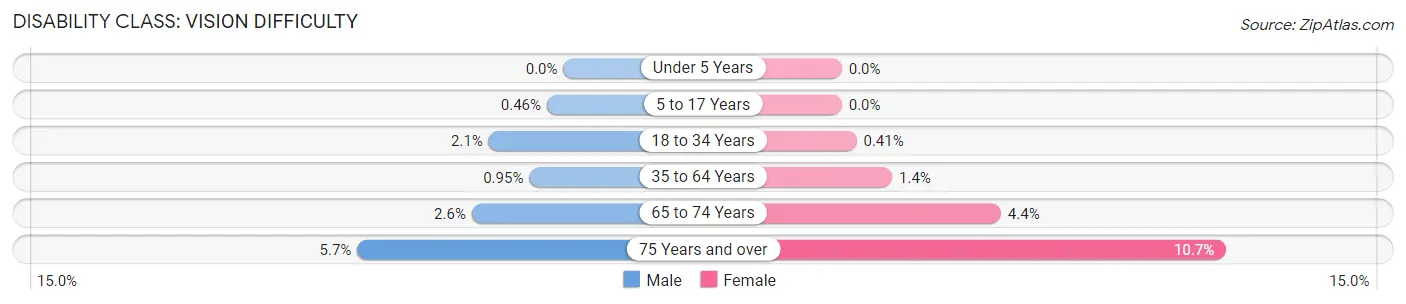
| Age Bracket | Male | Female |
| Under 5 Years | 0 (0.0%) | 0 (0.0%) |
| 5 to 17 Years | 17 (0.5%) | 0 (0.0%) |
| 18 to 34 Years | 103 (2.1%) | 18 (0.4%) |
| 35 to 64 Years | 82 (0.9%) | 120 (1.4%) |
| 65 to 74 Years | 66 (2.5%) | 138 (4.4%) |
| 75 Years and over | 79 (5.7%) | 195 (10.7%) |
Disability Class: Cognitive Difficulty
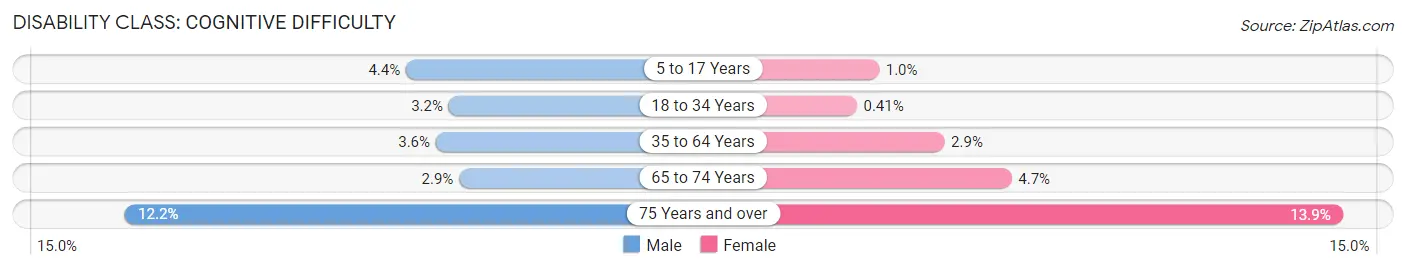
| Age Bracket | Male | Female |
| 5 to 17 Years | 161 (4.4%) | 40 (1.0%) |
| 18 to 34 Years | 158 (3.2%) | 18 (0.4%) |
| 35 to 64 Years | 306 (3.5%) | 245 (2.9%) |
| 65 to 74 Years | 75 (2.9%) | 147 (4.7%) |
| 75 Years and over | 168 (12.2%) | 254 (13.9%) |
Disability Class: Ambulatory Difficulty
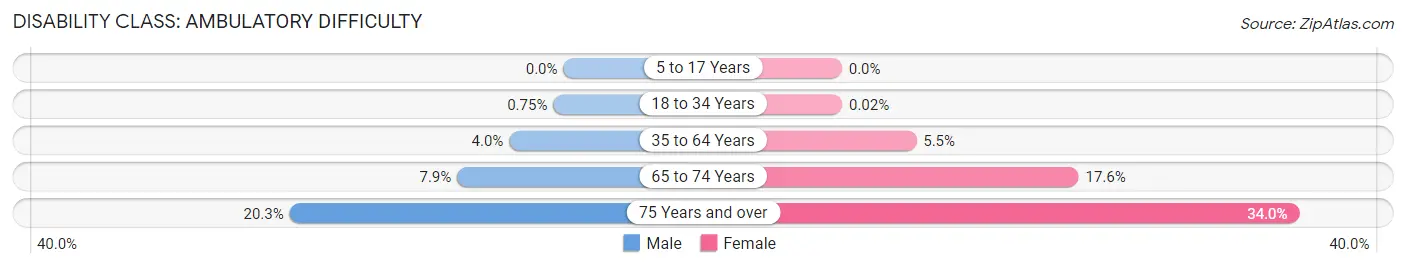
| Age Bracket | Male | Female |
| 5 to 17 Years | 0 (0.0%) | 0 (0.0%) |
| 18 to 34 Years | 37 (0.7%) | 1 (0.0%) |
| 35 to 64 Years | 347 (4.0%) | 475 (5.5%) |
| 65 to 74 Years | 204 (7.9%) | 547 (17.6%) |
| 75 Years and over | 280 (20.3%) | 619 (34.0%) |
Disability Class: Self-Care Difficulty
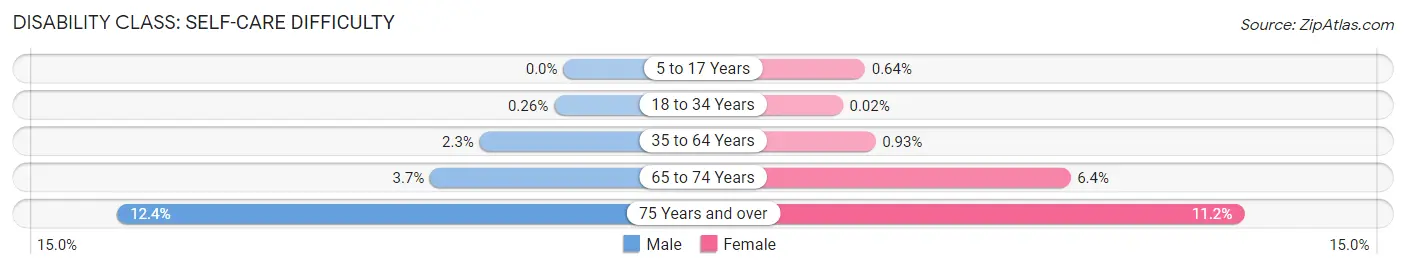
| Age Bracket | Male | Female |
| 5 to 17 Years | 0 (0.0%) | 25 (0.6%) |
| 18 to 34 Years | 13 (0.3%) | 1 (0.0%) |
| 35 to 64 Years | 201 (2.3%) | 80 (0.9%) |
| 65 to 74 Years | 96 (3.7%) | 198 (6.4%) |
| 75 Years and over | 171 (12.4%) | 204 (11.2%) |
Technology Access in Beavercreek
Computing Device Access in Beavercreek
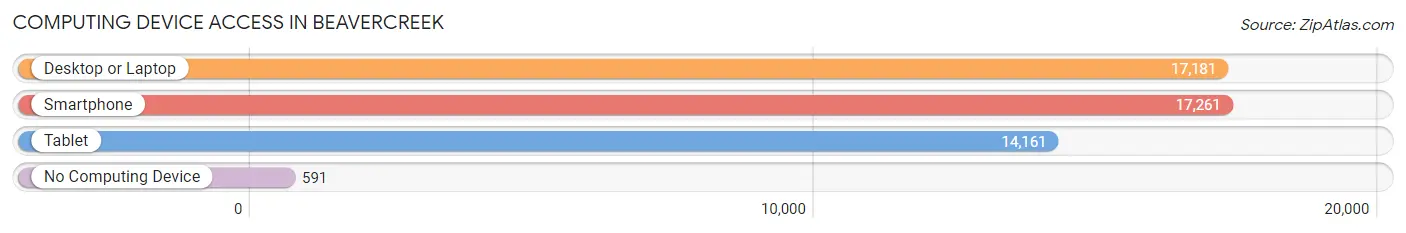
| Device Type | # Households | % Households |
| Desktop or Laptop | 17,181 | 90.9% |
| Smartphone | 17,261 | 91.4% |
| Tablet | 14,161 | 75.0% |
| No Computing Device | 591 | 3.1% |
| Total | 18,891 | 100.0% |
Internet Access in Beavercreek
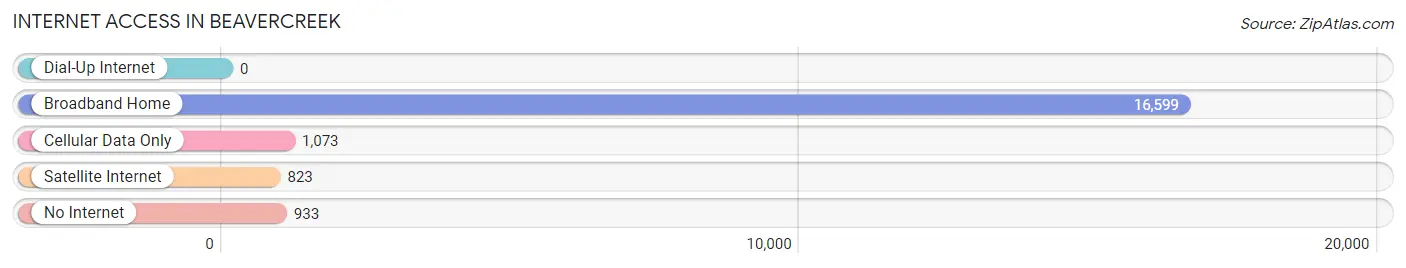
| Internet Type | # Households | % Households |
| Dial-Up Internet | 0 | 0.0% |
| Broadband Home | 16,599 | 87.9% |
| Cellular Data Only | 1,073 | 5.7% |
| Satellite Internet | 823 | 4.4% |
| No Internet | 933 | 4.9% |
| Total | 18,891 | 100.0% |
Beavercreek Summary
Beavercreek, Ohio is a city located in Greene County, Ohio, United States. It is part of the Dayton Metropolitan Statistical Area. The population was 45,193 at the 2010 census. It is the second largest city in Greene County, behind Fairborn.
History
Beavercreek was first settled in 1804 by John and Sarah Van Cleve. The Van Cleves were among the first settlers in the area, and their homestead was located near the intersection of Dayton-Xenia Road and Grange Hall Road. The Van Cleves named the area Beaver Creek, after the creek that ran through their property. The name was later changed to Beavercreek.
In 1841, the first post office was established in the area. The first school was built in 1845, and the first church was built in 1848.
In 1852, the first railroad line was built through Beavercreek, connecting it to Xenia and Dayton. This allowed for the growth of the area, as it was now connected to larger cities.
In 1856, the first newspaper was established in Beavercreek. The paper was called the Beavercreek Gazette.
In 1871, Beavercreek was officially incorporated as a village. The population at the time was around 500 people.
In the late 1800s, Beavercreek began to grow rapidly. The population increased from 500 in 1871 to 1,500 in 1900. This growth was due to the railroad and the increasing number of businesses in the area.
In the early 1900s, Beavercreek continued to grow. The population increased from 1,500 in 1900 to 4,000 in 1930. This growth was due to the increasing number of businesses in the area, as well as the increasing number of people moving to the area.
In the 1950s, Beavercreek began to experience a population boom. The population increased from 4,000 in 1930 to 10,000 in 1960. This growth was due to the increasing number of people moving to the area, as well as the increasing number of businesses in the area.
In the 1970s, Beavercreek continued to experience a population boom. The population increased from 10,000 in 1960 to 20,000 in 1980. This growth was due to the increasing number of people moving to the area, as well as the increasing number of businesses in the area.
In the 1990s, Beavercreek continued to experience a population boom. The population increased from 20,000 in 1980 to 45,193 in 2010. This growth was due to the increasing number of people moving to the area, as well as the increasing number of businesses in the area.
Geography
Beavercreek is located in Greene County, Ohio, United States. It is part of the Dayton Metropolitan Statistical Area. The city is located in the Miami Valley region of Ohio.
Beavercreek is located at 39°45'N 84°7'W (39.75, -84.12). The city has a total area of 24.3 square miles (62.8 km2), of which 24.2 square miles (62.6 km2) is land and 0.1 square miles (0.2 km2) is water.
Economy
Beavercreek is home to a variety of businesses and industries. The city is home to several large employers, including Wright-Patterson Air Force Base, the University of Dayton Research Institute, and the Dayton International Airport.
Beavercreek is also home to several retail stores, restaurants, and other businesses. The city is home to the Mall at Fairfield Commons, which is the largest shopping mall in the Dayton area.
Demographics
As of the 2010 census, there were 45,193 people, 17,945 households, and 11,945 families residing in the city. The population density was 1,867.2 people per square mile (721.7/km2). There were 18,945 housing units at an average density of 779.2 per square mile (301.2/km2). The racial makeup of the city was 87.2% White, 5.3% African American, 0.3% Native American, 3.2% Asian, 0.1% Pacific Islander, 1.3% from other races, and 2.7% from two or more races. Hispanic or Latino of any race were 3.7% of the population.
There were 17,945 households, out of which 32.2% had children under the age of 18 living with them, 54.2% were married couples living together, 9.7% had a female householder with no husband present, and 32.3% were non-families. 26.3% of all households were made up of individuals, and 8.2% had someone living alone who was 65 years of age or older. The average household size was 2.51 and the average family size was 3.06.
In the city, the population was spread out, with 25.2% under the age of 18, 8.2% from 18 to 24, 30.2% from 25 to 44, 24.2% from 45 to 64, and 12.2% who were 65 years of age or older. The median age was 36 years. For every 100 females, there were 94.2 males. For every 100 females age 18 and over, there were 91.2 males.
The median income for a household in the city was $60,945, and the median income for a family was $71,945. Males had a median income of $50,945 versus $36,945 for females. The per capita income for the city was $27,945. About 3.2% of families and 4.7% of the population were below the poverty line, including 5.3% of those under age 18 and 4.2% of those age 65 or over.
Common Questions
What is Per Capita Income in Beavercreek?
Per Capita income in Beavercreek is $52,173.
What is the Median Family Income in Beavercreek?
Median Family Income in Beavercreek is $135,420.
What is the Median Household income in Beavercreek?
Median Household Income in Beavercreek is $108,140.
What is Income or Wage Gap in Beavercreek?
Income or Wage Gap in Beavercreek is 27.4%.
Women in Beavercreek earn 72.6 cents for every dollar earned by a man.
What is Family Income Deficit in Beavercreek?
Family Income Deficit in Beavercreek is $9,393.
Families that are below poverty line in Beavercreek earn $9,393 less on average than the poverty threshold level.
What is Inequality or Gini Index in Beavercreek?
Inequality or Gini Index in Beavercreek is 0.38.
What is the Total Population of Beavercreek?
Total Population of Beavercreek is 46,576.
What is the Total Male Population of Beavercreek?
Total Male Population of Beavercreek is 23,209.
What is the Total Female Population of Beavercreek?
Total Female Population of Beavercreek is 23,367.
What is the Ratio of Males per 100 Females in Beavercreek?
There are 99.32 Males per 100 Females in Beavercreek.
What is the Ratio of Females per 100 Males in Beavercreek?
There are 100.68 Females per 100 Males in Beavercreek.
What is the Median Population Age in Beavercreek?
Median Population Age in Beavercreek is 41.1 Years.
What is the Average Family Size in Beavercreek
Average Family Size in Beavercreek is 2.9 People.
What is the Average Household Size in Beavercreek
Average Household Size in Beavercreek is 2.4 People.
How Large is the Labor Force in Beavercreek?
There are 24,661 People in the Labor Forcein in Beavercreek.
What is the Percentage of People in the Labor Force in Beavercreek?
65.0% of People are in the Labor Force in Beavercreek.
What is the Unemployment Rate in Beavercreek?
Unemployment Rate in Beavercreek is 2.8%.