Bluffton, OH Map & Demographics
Bluffton Map
Bluffton Overview
$35,929
PER CAPITA INCOME
$91,029
AVG FAMILY INCOME
$74,620
AVG HOUSEHOLD INCOME
38.2%
WAGE / INCOME GAP [ % ]
61.8¢/ $1
WAGE / INCOME GAP [ $ ]
0.42
INEQUALITY / GINI INDEX
3,540
TOTAL POPULATION
1,631
MALE POPULATION
1,909
FEMALE POPULATION
85.44
MALES / 100 FEMALES
117.04
FEMALES / 100 MALES
35.5
MEDIAN AGE
3.1
AVG FAMILY SIZE
2.4
AVG HOUSEHOLD SIZE
1,636
LABOR FORCE [ PEOPLE ]
60.4%
PERCENT IN LABOR FORCE
5.7%
UNEMPLOYMENT RATE
Bluffton Zip Codes
Income in Bluffton
Income Overview in Bluffton
Per Capita Income in Bluffton is $35,929, while median incomes of families and households are $91,029 and $74,620 respectively.
| Characteristic | Number | Measure |
| Per Capita Income | 3,540 | $35,929 |
| Median Family Income | 852 | $91,029 |
| Mean Family Income | 852 | $106,295 |
| Median Household Income | 1,352 | $74,620 |
| Mean Household Income | 1,352 | $91,872 |
| Income Deficit | 852 | $0 |
| Wage / Income Gap (%) | 3,540 | 38.19% |
| Wage / Income Gap ($) | 3,540 | 61.81¢ per $1 |
| Gini / Inequality Index | 3,540 | 0.42 |
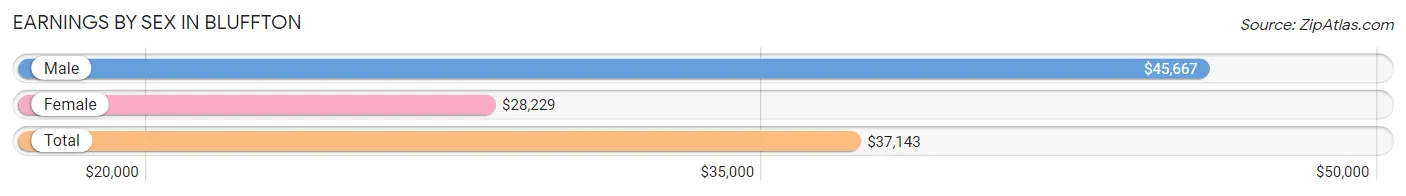
Earnings by Sex in Bluffton
Average Earnings in Bluffton are $37,143, $45,667 for men and $28,229 for women, a difference of 38.2%.
| Sex | Number | Average Earnings |
| Male | 966 (52.4%) | $45,667 |
| Female | 876 (47.6%) | $28,229 |
| Total | 1,842 (100.0%) | $37,143 |
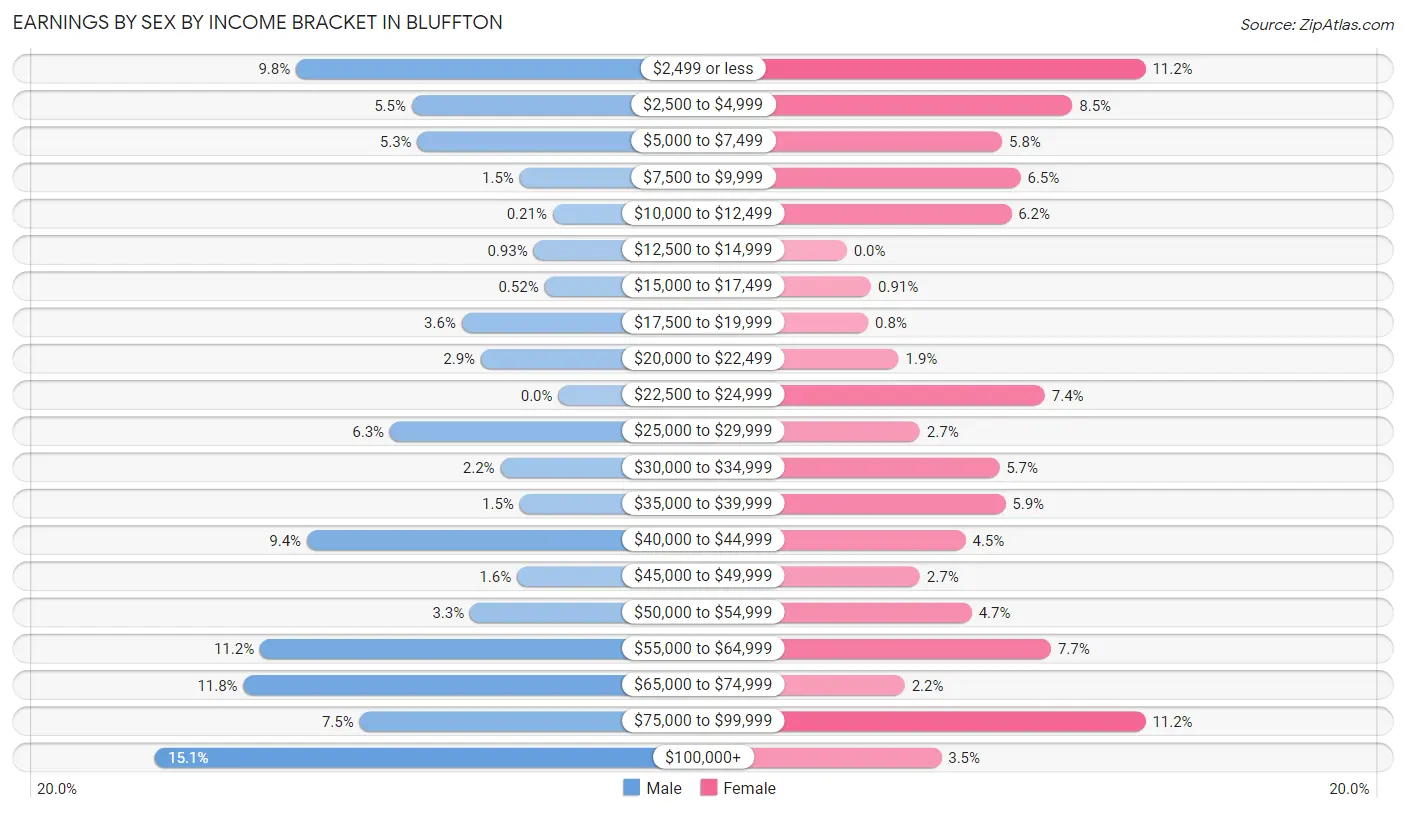
Earnings by Sex by Income Bracket in Bluffton
The most common earnings brackets in Bluffton are $100,000+ for men (146 | 15.1%) and $2,499 or less for women (98 | 11.2%).
| Income | Male | Female |
| $2,499 or less | 95 (9.8%) | 98 (11.2%) |
| $2,500 to $4,999 | 53 (5.5%) | 74 (8.5%) |
| $5,000 to $7,499 | 51 (5.3%) | 51 (5.8%) |
| $7,500 to $9,999 | 14 (1.5%) | 57 (6.5%) |
| $10,000 to $12,499 | 2 (0.2%) | 54 (6.2%) |
| $12,500 to $14,999 | 9 (0.9%) | 0 (0.0%) |
| $15,000 to $17,499 | 5 (0.5%) | 8 (0.9%) |
| $17,500 to $19,999 | 35 (3.6%) | 7 (0.8%) |
| $20,000 to $22,499 | 28 (2.9%) | 17 (1.9%) |
| $22,500 to $24,999 | 0 (0.0%) | 65 (7.4%) |
| $25,000 to $29,999 | 61 (6.3%) | 24 (2.7%) |
| $30,000 to $34,999 | 21 (2.2%) | 50 (5.7%) |
| $35,000 to $39,999 | 14 (1.5%) | 52 (5.9%) |
| $40,000 to $44,999 | 91 (9.4%) | 39 (4.4%) |
| $45,000 to $49,999 | 15 (1.5%) | 24 (2.7%) |
| $50,000 to $54,999 | 32 (3.3%) | 41 (4.7%) |
| $55,000 to $64,999 | 108 (11.2%) | 67 (7.6%) |
| $65,000 to $74,999 | 114 (11.8%) | 19 (2.2%) |
| $75,000 to $99,999 | 72 (7.4%) | 98 (11.2%) |
| $100,000+ | 146 (15.1%) | 31 (3.5%) |
| Total | 966 (100.0%) | 876 (100.0%) |
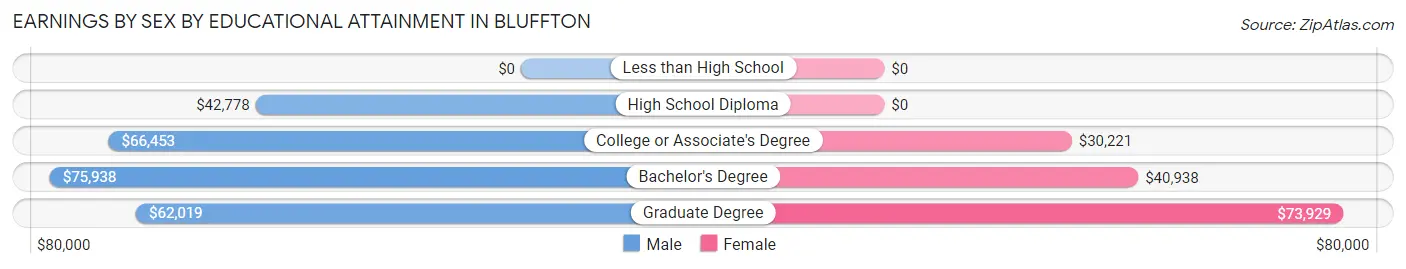
Earnings by Sex by Educational Attainment in Bluffton
Average earnings in Bluffton are $59,893 for men and $36,860 for women, a difference of 38.5%. Men with an educational attainment of bachelor's degree enjoy the highest average annual earnings of $75,938, while those with high school diploma education earn the least with $42,778. Women with an educational attainment of graduate degree earn the most with the average annual earnings of $73,929, while those with college or associate's degree education have the smallest earnings of $30,221.
| Educational Attainment | Male Income | Female Income |
| Less than High School | - | - |
| High School Diploma | $42,778 | $0 |
| College or Associate's Degree | $66,453 | $30,221 |
| Bachelor's Degree | $75,938 | $40,938 |
| Graduate Degree | $62,019 | $73,929 |
| Total | $59,893 | $36,860 |
Family Income in Bluffton
Family Income Brackets in Bluffton
According to the Bluffton family income data, there are 214 families falling into the $75,000 to $99,999 income range, which is the most common income bracket and makes up 25.1% of all families.
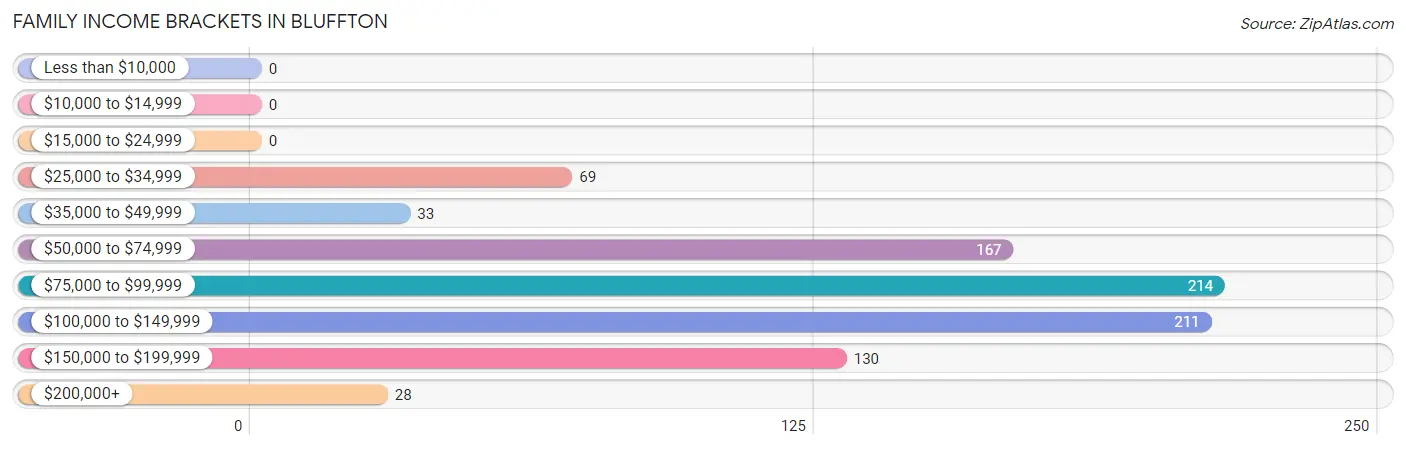
| Income Bracket | # Families | % Families |
| Less than $10,000 | 0 | 0.0% |
| $10,000 to $14,999 | 0 | 0.0% |
| $15,000 to $24,999 | 0 | 0.0% |
| $25,000 to $34,999 | 69 | 8.1% |
| $35,000 to $49,999 | 33 | 3.9% |
| $50,000 to $74,999 | 167 | 19.6% |
| $75,000 to $99,999 | 214 | 25.1% |
| $100,000 to $149,999 | 211 | 24.8% |
| $150,000 to $199,999 | 130 | 15.3% |
| $200,000+ | 28 | 3.3% |
Family Income by Famaliy Size in Bluffton
5-person families (60 | 7.0%) account for the highest median family income in Bluffton with $113,971 per family, while 2-person families (425 | 49.9%) have the highest median income of $37,946 per family member.
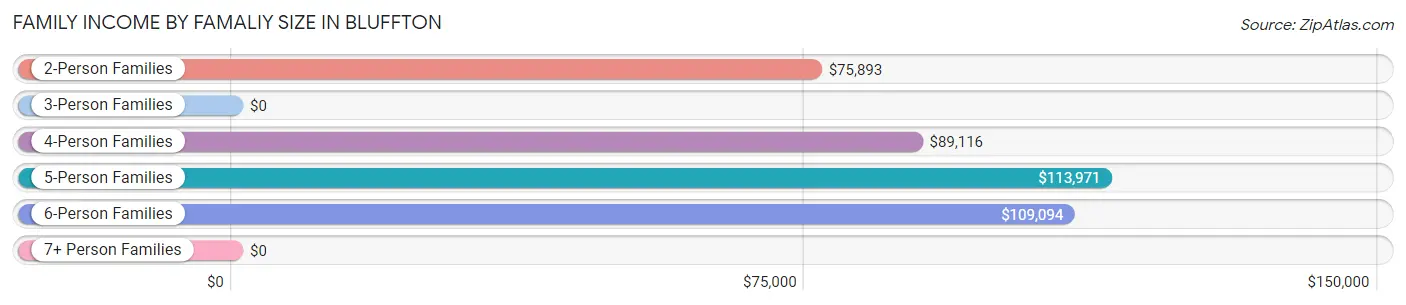
| Income Bracket | # Families | Median Income |
| 2-Person Families | 425 (49.9%) | $75,893 |
| 3-Person Families | 143 (16.8%) | $0 |
| 4-Person Families | 149 (17.5%) | $89,116 |
| 5-Person Families | 60 (7.0%) | $113,971 |
| 6-Person Families | 67 (7.9%) | $109,094 |
| 7+ Person Families | 8 (0.9%) | $0 |
| Total | 852 (100.0%) | $91,029 |
Family Income by Number of Earners in Bluffton
The median family income in Bluffton is $91,029, with families comprising 3+ earners (128) having the highest median family income of $170,139, while families with no earners (153) have the lowest median family income of $69,028, accounting for 15.0% and 18.0% of families, respectively.
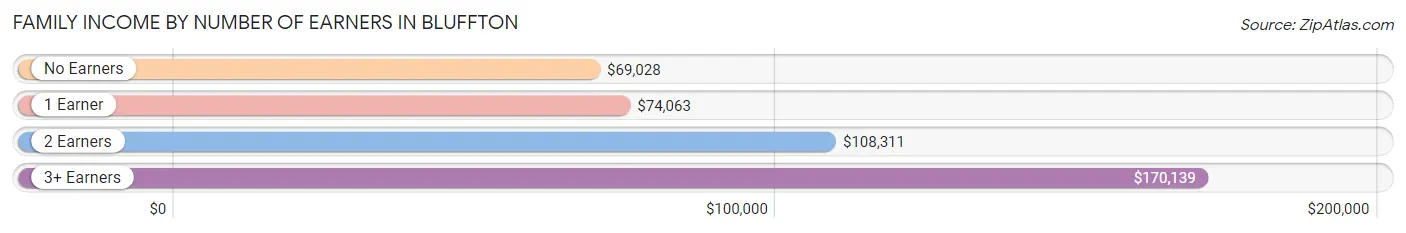
| Number of Earners | # Families | Median Income |
| No Earners | 153 (18.0%) | $69,028 |
| 1 Earner | 242 (28.4%) | $74,063 |
| 2 Earners | 329 (38.6%) | $108,311 |
| 3+ Earners | 128 (15.0%) | $170,139 |
| Total | 852 (100.0%) | $91,029 |
Household Income in Bluffton
Household Income Brackets in Bluffton
With 288 households falling in the category, the $100,000 to $149,999 income range is the most frequent in Bluffton, accounting for 21.3% of all households. In contrast, only 24 households (1.8%) fall into the $10,000 to $14,999 income bracket, making it the least populous group.
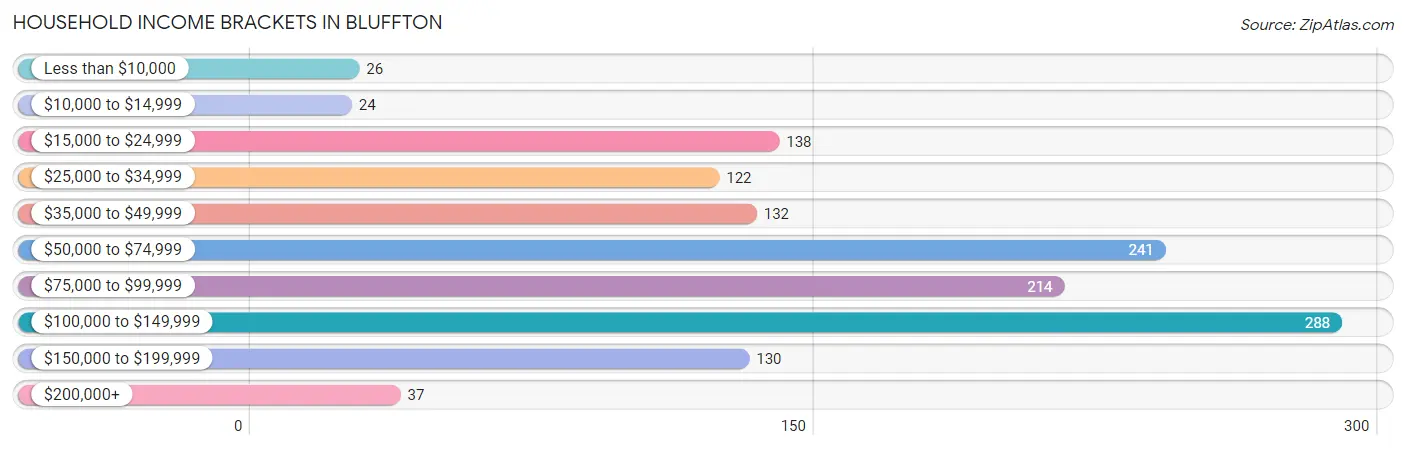
| Income Bracket | # Households | % Households |
| Less than $10,000 | 26 | 1.9% |
| $10,000 to $14,999 | 24 | 1.8% |
| $15,000 to $24,999 | 138 | 10.2% |
| $25,000 to $34,999 | 122 | 9.0% |
| $35,000 to $49,999 | 132 | 9.8% |
| $50,000 to $74,999 | 241 | 17.8% |
| $75,000 to $99,999 | 214 | 15.8% |
| $100,000 to $149,999 | 288 | 21.3% |
| $150,000 to $199,999 | 130 | 9.6% |
| $200,000+ | 37 | 2.7% |
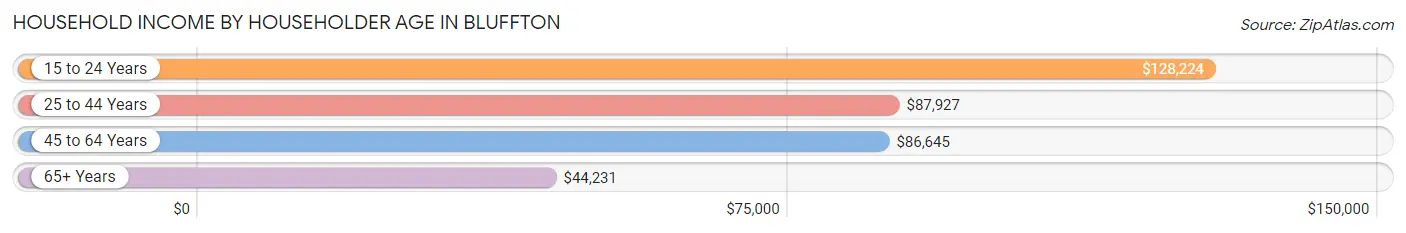
Household Income by Householder Age in Bluffton
The median household income in Bluffton is $74,620, with the highest median household income of $128,224 found in the 15 to 24 years age bracket for the primary householder. A total of 45 households (3.3%) fall into this category. Meanwhile, the 65+ years age bracket for the primary householder has the lowest median household income of $44,231, with 482 households (35.6%) in this group.
| Income Bracket | # Households | Median Income |
| 15 to 24 Years | 45 (3.3%) | $128,224 |
| 25 to 44 Years | 436 (32.3%) | $87,927 |
| 45 to 64 Years | 389 (28.8%) | $86,645 |
| 65+ Years | 482 (35.6%) | $44,231 |
| Total | 1,352 (100.0%) | $74,620 |
Poverty in Bluffton
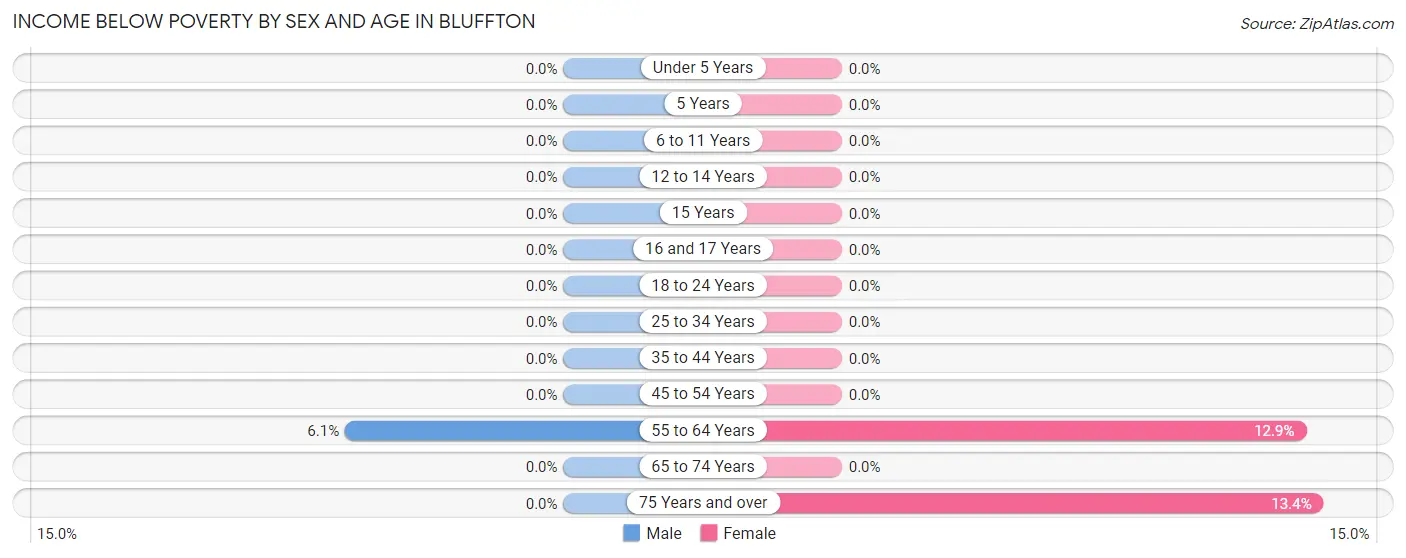
Income Below Poverty by Sex and Age in Bluffton
With 0.7% poverty level for males and 2.2% for females among the residents of Bluffton, 55 to 64 year old males and 75 year old and over females are the most vulnerable to poverty, with 11 males (6.1%) and 24 females (13.4%) in their respective age groups living below the poverty level.
| Age Bracket | Male | Female |
| Under 5 Years | 0 (0.0%) | 0 (0.0%) |
| 5 Years | 0 (0.0%) | 0 (0.0%) |
| 6 to 11 Years | 0 (0.0%) | 0 (0.0%) |
| 12 to 14 Years | 0 (0.0%) | 0 (0.0%) |
| 15 Years | 0 (0.0%) | 0 (0.0%) |
| 16 and 17 Years | 0 (0.0%) | 0 (0.0%) |
| 18 to 24 Years | 0 (0.0%) | 0 (0.0%) |
| 25 to 34 Years | 0 (0.0%) | 0 (0.0%) |
| 35 to 44 Years | 0 (0.0%) | 0 (0.0%) |
| 45 to 54 Years | 0 (0.0%) | 0 (0.0%) |
| 55 to 64 Years | 11 (6.1%) | 15 (12.9%) |
| 65 to 74 Years | 0 (0.0%) | 0 (0.0%) |
| 75 Years and over | 0 (0.0%) | 24 (13.4%) |
| Total | 11 (0.7%) | 39 (2.2%) |
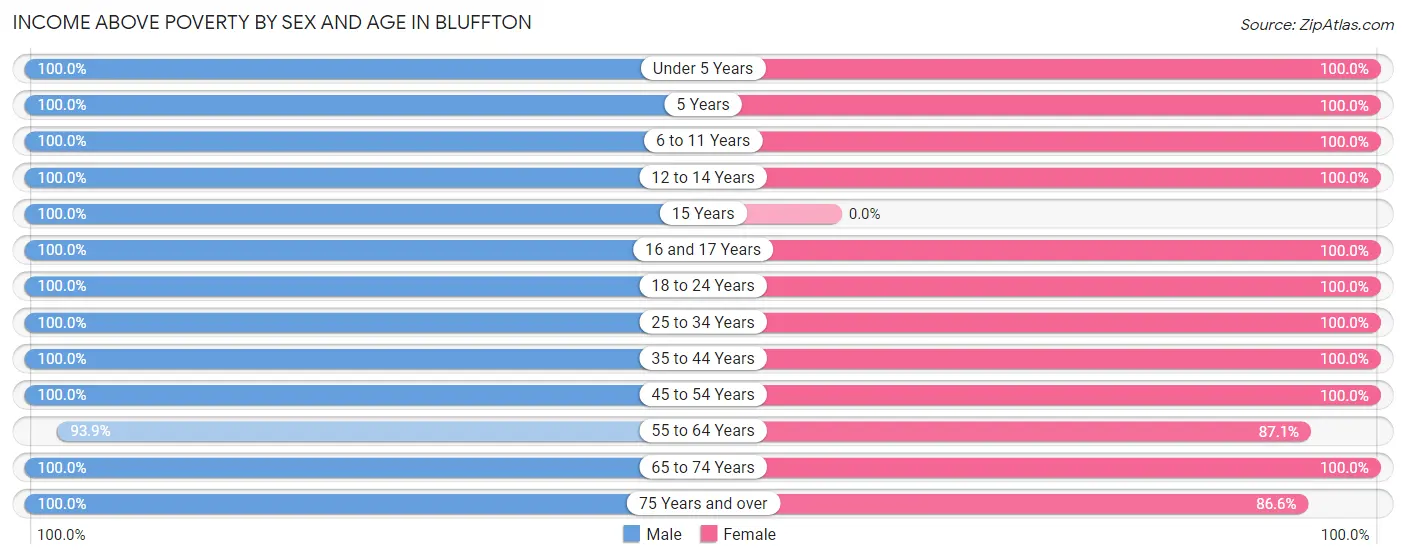
Income Above Poverty by Sex and Age in Bluffton
According to the poverty statistics in Bluffton, males aged under 5 years and females aged under 5 years are the age groups that are most secure financially, with 100.0% of males and 100.0% of females in these age groups living above the poverty line.
| Age Bracket | Male | Female |
| Under 5 Years | 117 (100.0%) | 118 (100.0%) |
| 5 Years | 22 (100.0%) | 21 (100.0%) |
| 6 to 11 Years | 125 (100.0%) | 241 (100.0%) |
| 12 to 14 Years | 57 (100.0%) | 114 (100.0%) |
| 15 Years | 16 (100.0%) | 0 (0.0%) |
| 16 and 17 Years | 20 (100.0%) | 53 (100.0%) |
| 18 to 24 Years | 143 (100.0%) | 113 (100.0%) |
| 25 to 34 Years | 123 (100.0%) | 253 (100.0%) |
| 35 to 44 Years | 228 (100.0%) | 124 (100.0%) |
| 45 to 54 Years | 157 (100.0%) | 197 (100.0%) |
| 55 to 64 Years | 170 (93.9%) | 101 (87.1%) |
| 65 to 74 Years | 195 (100.0%) | 212 (100.0%) |
| 75 Years and over | 112 (100.0%) | 155 (86.6%) |
| Total | 1,485 (99.3%) | 1,702 (97.8%) |
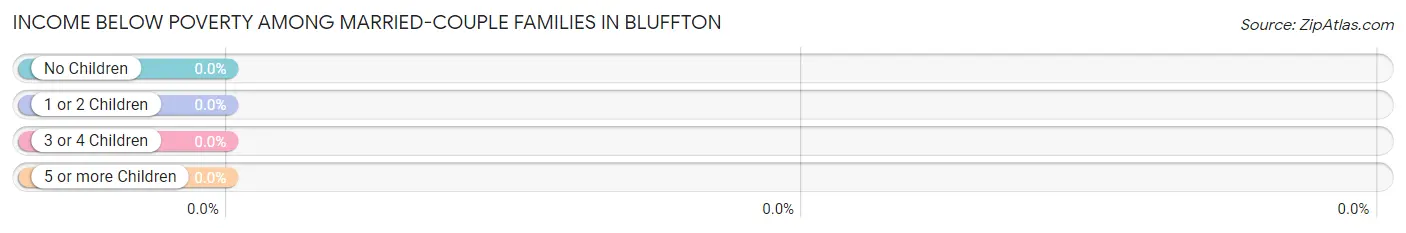
Income Below Poverty Among Married-Couple Families in Bluffton
| Children | Above Poverty | Below Poverty |
| No Children | 391 (100.0%) | 0 (0.0%) |
| 1 or 2 Children | 211 (100.0%) | 0 (0.0%) |
| 3 or 4 Children | 98 (100.0%) | 0 (0.0%) |
| 5 or more Children | 8 (100.0%) | 0 (0.0%) |
| Total | 708 (100.0%) | 0 (0.0%) |
Income Below Poverty Among Single-Parent Households in Bluffton
| Children | Single Father | Single Mother |
| No Children | 0 (0.0%) | 0 (0.0%) |
| 1 or 2 Children | 0 (0.0%) | 0 (0.0%) |
| 3 or 4 Children | 0 (0.0%) | 0 (0.0%) |
| 5 or more Children | 0 (0.0%) | 0 (0.0%) |
| Total | 0 (0.0%) | 0 (0.0%) |
Income Below Poverty Among Married-Couple vs Single-Parent Households in Bluffton
| Children | Married-Couple Families | Single-Parent Households |
| No Children | 0 (0.0%) | 0 (0.0%) |
| 1 or 2 Children | 0 (0.0%) | 0 (0.0%) |
| 3 or 4 Children | 0 (0.0%) | 0 (0.0%) |
| 5 or more Children | 0 (0.0%) | 0 (0.0%) |
| Total | 0 (0.0%) | 0 (0.0%) |
Race in Bluffton
The most populous races in Bluffton are White / Caucasian (3,184 | 89.9%), Asian (138 | 3.9%), and Two or more Races (102 | 2.9%).
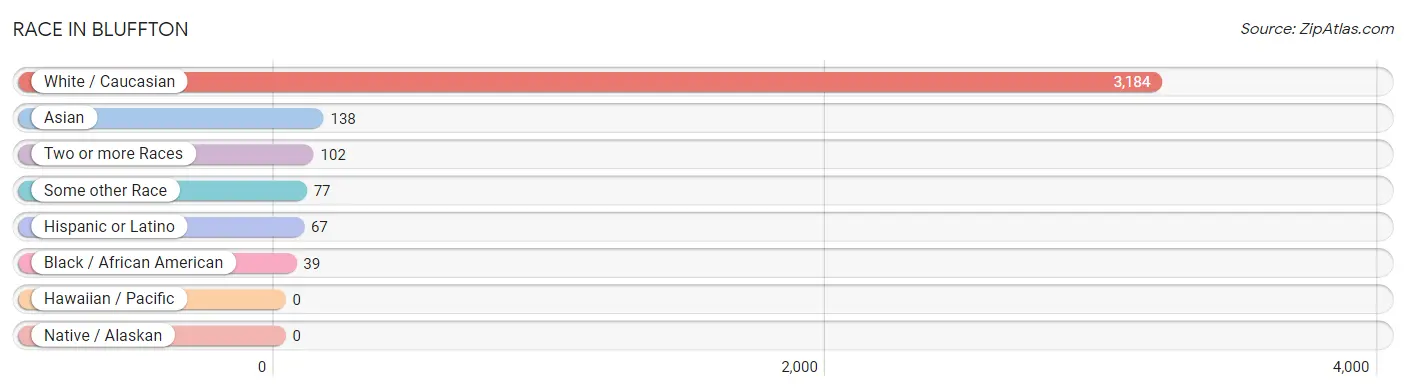
| Race | # Population | % Population |
| Asian | 138 | 3.9% |
| Black / African American | 39 | 1.1% |
| Hawaiian / Pacific | 0 | 0.0% |
| Hispanic or Latino | 67 | 1.9% |
| Native / Alaskan | 0 | 0.0% |
| White / Caucasian | 3,184 | 89.9% |
| Two or more Races | 102 | 2.9% |
| Some other Race | 77 | 2.2% |
| Total | 3,540 | 100.0% |
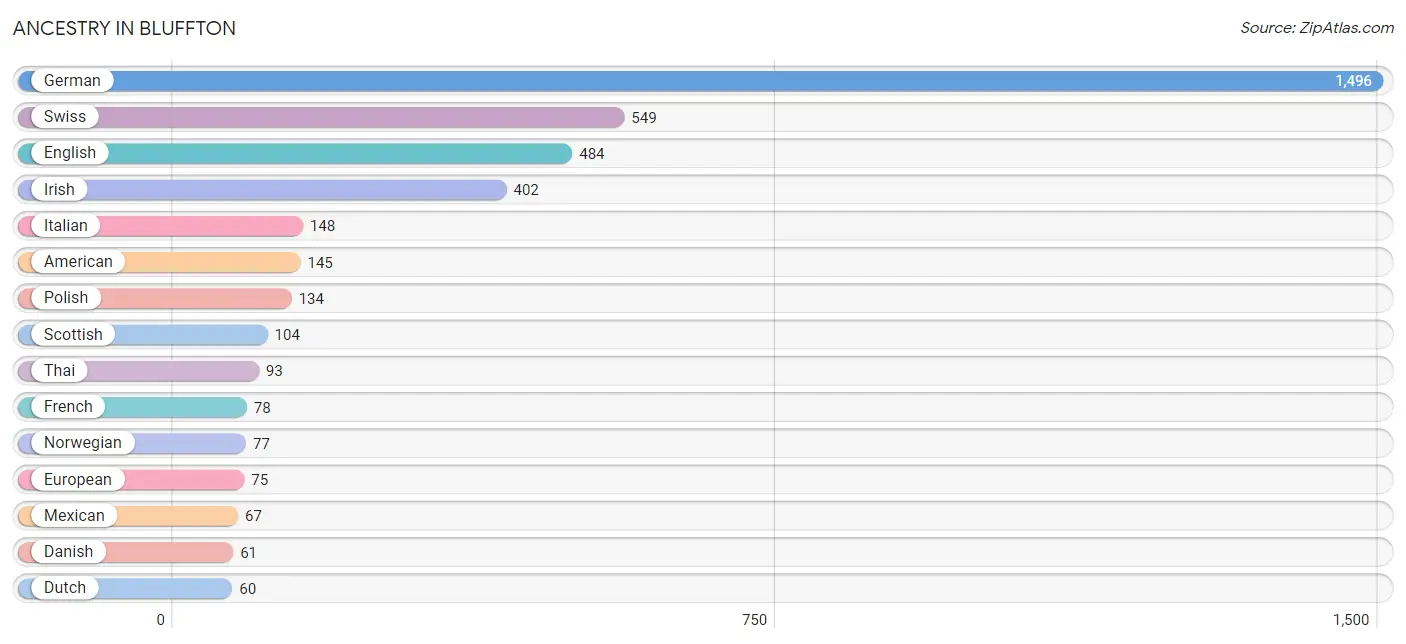
Ancestry in Bluffton
The most populous ancestries reported in Bluffton are German (1,496 | 42.3%), Swiss (549 | 15.5%), English (484 | 13.7%), Irish (402 | 11.4%), and Italian (148 | 4.2%), together accounting for 87.0% of all Bluffton residents.
| Ancestry | # Population | % Population |
| African | 8 | 0.2% |
| American | 145 | 4.1% |
| Belgian | 5 | 0.1% |
| Brazilian | 56 | 1.6% |
| British | 28 | 0.8% |
| Canadian | 2 | 0.1% |
| Czech | 8 | 0.2% |
| Danish | 61 | 1.7% |
| Dutch | 60 | 1.7% |
| English | 484 | 13.7% |
| European | 75 | 2.1% |
| French | 78 | 2.2% |
| French Canadian | 7 | 0.2% |
| German | 1,496 | 42.3% |
| Guyanese | 5 | 0.1% |
| Hungarian | 2 | 0.1% |
| Indian (Asian) | 21 | 0.6% |
| Irish | 402 | 11.4% |
| Italian | 148 | 4.2% |
| Japanese | 2 | 0.1% |
| Korean | 31 | 0.9% |
| Mexican | 67 | 1.9% |
| Norwegian | 77 | 2.2% |
| Pennsylvania German | 16 | 0.4% |
| Polish | 134 | 3.8% |
| Romanian | 8 | 0.2% |
| Russian | 17 | 0.5% |
| Scotch-Irish | 10 | 0.3% |
| Scottish | 104 | 2.9% |
| Slovak | 2 | 0.1% |
| Slovene | 7 | 0.2% |
| Sri Lankan | 2 | 0.1% |
| Subsaharan African | 8 | 0.2% |
| Swiss | 549 | 15.5% |
| Thai | 93 | 2.6% |
| Welsh | 52 | 1.5% |
| Zimbabwean | 1 | 0.0% | View All 37 Rows |
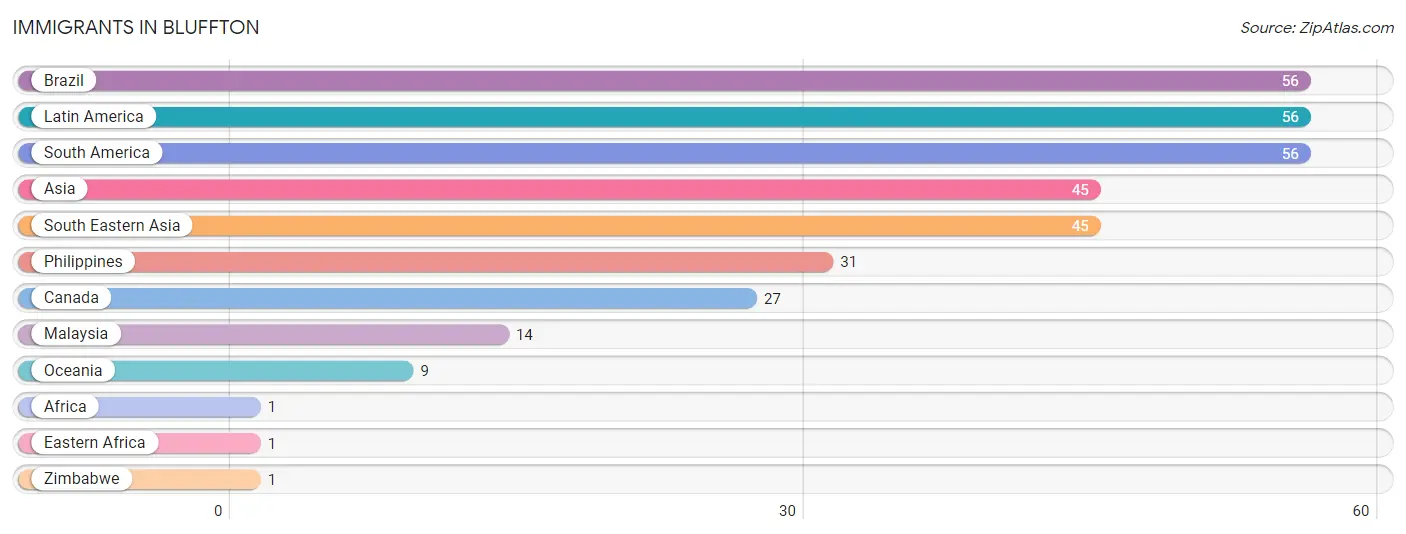
Immigrants in Bluffton
The most numerous immigrant groups reported in Bluffton came from Brazil (56 | 1.6%), Latin America (56 | 1.6%), South America (56 | 1.6%), Asia (45 | 1.3%), and South Eastern Asia (45 | 1.3%), together accounting for 7.3% of all Bluffton residents.
| Immigration Origin | # Population | % Population |
| Africa | 1 | 0.0% |
| Asia | 45 | 1.3% |
| Brazil | 56 | 1.6% |
| Canada | 27 | 0.8% |
| Eastern Africa | 1 | 0.0% |
| Latin America | 56 | 1.6% |
| Malaysia | 14 | 0.4% |
| Oceania | 9 | 0.3% |
| Philippines | 31 | 0.9% |
| South America | 56 | 1.6% |
| South Eastern Asia | 45 | 1.3% |
| Zimbabwe | 1 | 0.0% | View All 12 Rows |
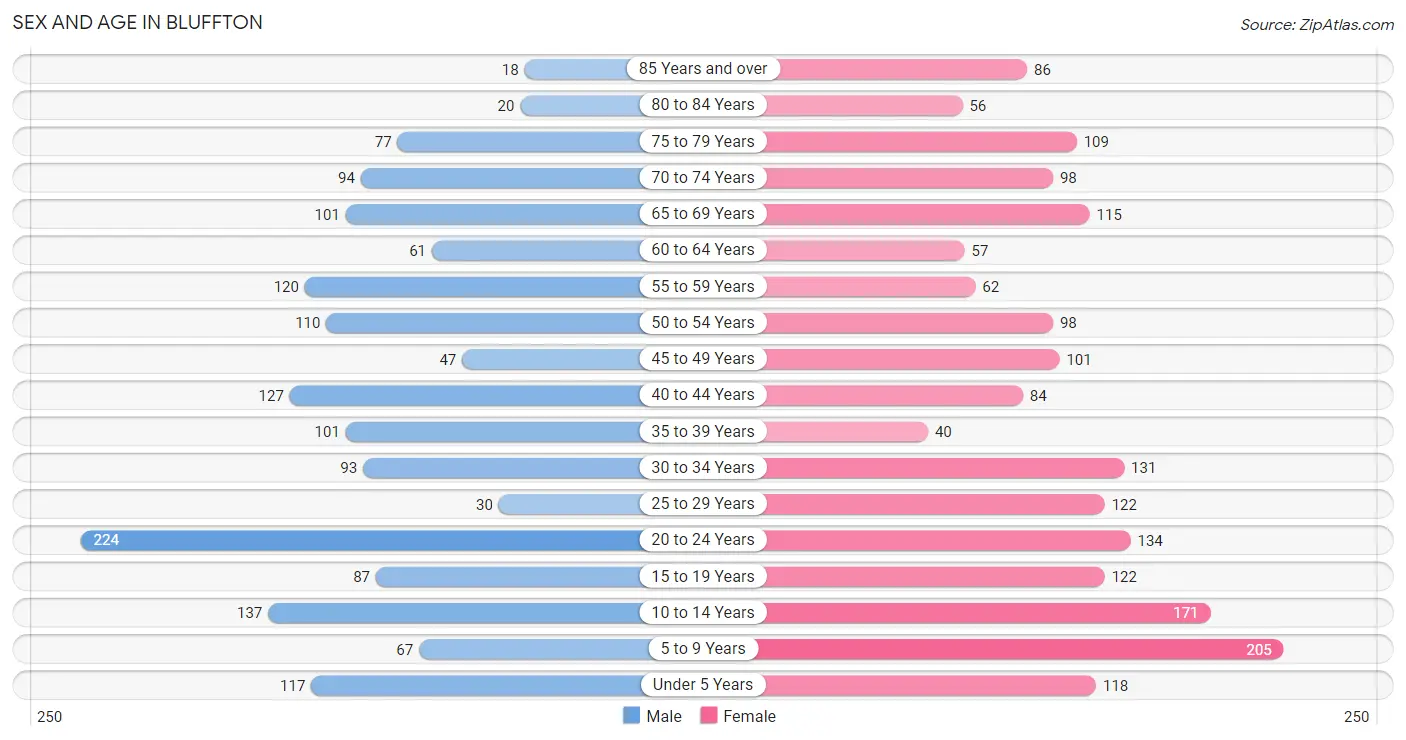
Sex and Age in Bluffton
Sex and Age in Bluffton
The most populous age groups in Bluffton are 20 to 24 Years (224 | 13.7%) for men and 5 to 9 Years (205 | 10.7%) for women.
| Age Bracket | Male | Female |
| Under 5 Years | 117 (7.2%) | 118 (6.2%) |
| 5 to 9 Years | 67 (4.1%) | 205 (10.7%) |
| 10 to 14 Years | 137 (8.4%) | 171 (9.0%) |
| 15 to 19 Years | 87 (5.3%) | 122 (6.4%) |
| 20 to 24 Years | 224 (13.7%) | 134 (7.0%) |
| 25 to 29 Years | 30 (1.8%) | 122 (6.4%) |
| 30 to 34 Years | 93 (5.7%) | 131 (6.9%) |
| 35 to 39 Years | 101 (6.2%) | 40 (2.1%) |
| 40 to 44 Years | 127 (7.8%) | 84 (4.4%) |
| 45 to 49 Years | 47 (2.9%) | 101 (5.3%) |
| 50 to 54 Years | 110 (6.7%) | 98 (5.1%) |
| 55 to 59 Years | 120 (7.4%) | 62 (3.3%) |
| 60 to 64 Years | 61 (3.7%) | 57 (3.0%) |
| 65 to 69 Years | 101 (6.2%) | 115 (6.0%) |
| 70 to 74 Years | 94 (5.8%) | 98 (5.1%) |
| 75 to 79 Years | 77 (4.7%) | 109 (5.7%) |
| 80 to 84 Years | 20 (1.2%) | 56 (2.9%) |
| 85 Years and over | 18 (1.1%) | 86 (4.5%) |
| Total | 1,631 (100.0%) | 1,909 (100.0%) |
Families and Households in Bluffton
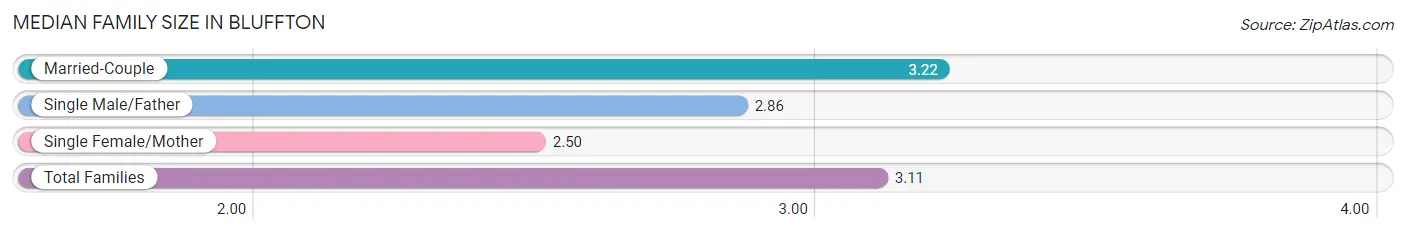
Median Family Size in Bluffton
The median family size in Bluffton is 3.11 persons per family, with married-couple families (708 | 83.1%) accounting for the largest median family size of 3.22 persons per family. On the other hand, single female/mother families (109 | 12.8%) represent the smallest median family size with 2.50 persons per family.
| Family Type | # Families | Family Size |
| Married-Couple | 708 (83.1%) | 3.22 |
| Single Male/Father | 35 (4.1%) | 2.86 |
| Single Female/Mother | 109 (12.8%) | 2.50 |
| Total Families | 852 (100.0%) | 3.11 |
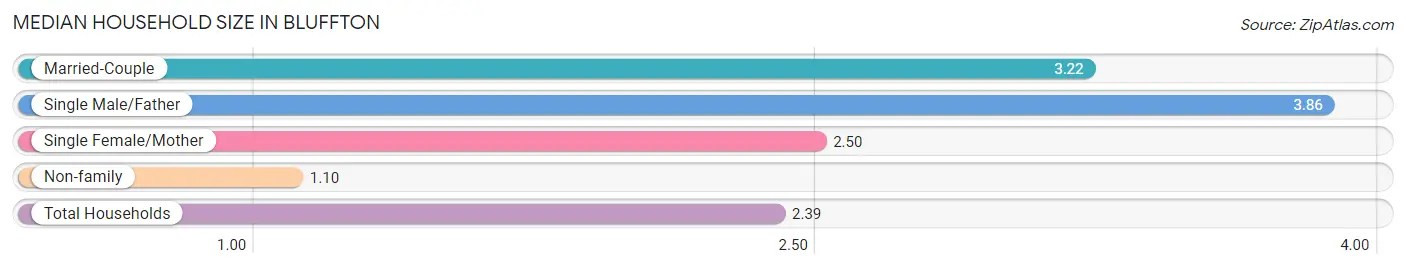
Median Household Size in Bluffton
The median household size in Bluffton is 2.39 persons per household, with single male/father households (35 | 2.6%) accounting for the largest median household size of 3.86 persons per household. non-family households (500 | 37.0%) represent the smallest median household size with 1.10 persons per household.
| Household Type | # Households | Household Size |
| Married-Couple | 708 (52.4%) | 3.22 |
| Single Male/Father | 35 (2.6%) | 3.86 |
| Single Female/Mother | 109 (8.1%) | 2.50 |
| Non-family | 500 (37.0%) | 1.10 |
| Total Households | 1,352 (100.0%) | 2.39 |
Household Size by Marriage Status in Bluffton
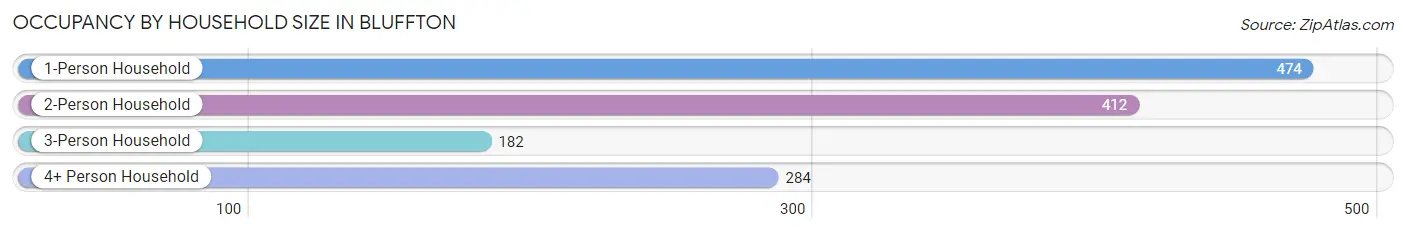
Out of a total of 1,352 households in Bluffton, 852 (63.0%) are family households, while 500 (37.0%) are nonfamily households. The most numerous type of family households are 2-person households, comprising 405, and the most common type of nonfamily households are 1-person households, comprising 474.
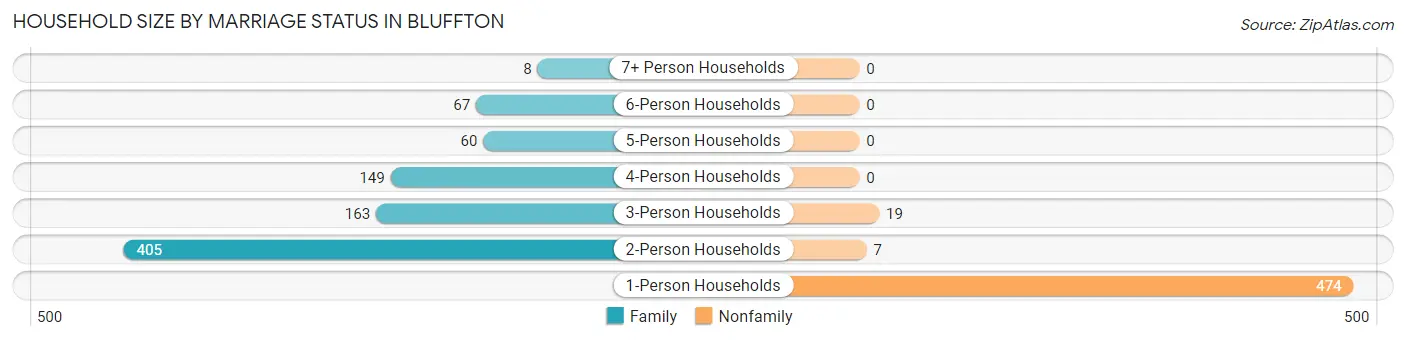
| Household Size | Family Households | Nonfamily Households |
| 1-Person Households | - | 474 (35.1%) |
| 2-Person Households | 405 (30.0%) | 7 (0.5%) |
| 3-Person Households | 163 (12.1%) | 19 (1.4%) |
| 4-Person Households | 149 (11.0%) | 0 (0.0%) |
| 5-Person Households | 60 (4.4%) | 0 (0.0%) |
| 6-Person Households | 67 (5.0%) | 0 (0.0%) |
| 7+ Person Households | 8 (0.6%) | 0 (0.0%) |
| Total | 852 (63.0%) | 500 (37.0%) |
Female Fertility in Bluffton
Fertility by Age in Bluffton
Average fertility rate in Bluffton is 62.0 births per 1,000 women. Women in the age bracket of 20 to 34 years have the highest fertility rate with 103.0 births per 1,000 women. Women in the age bracket of 20 to 34 years acount for 83.3% of all women with births.
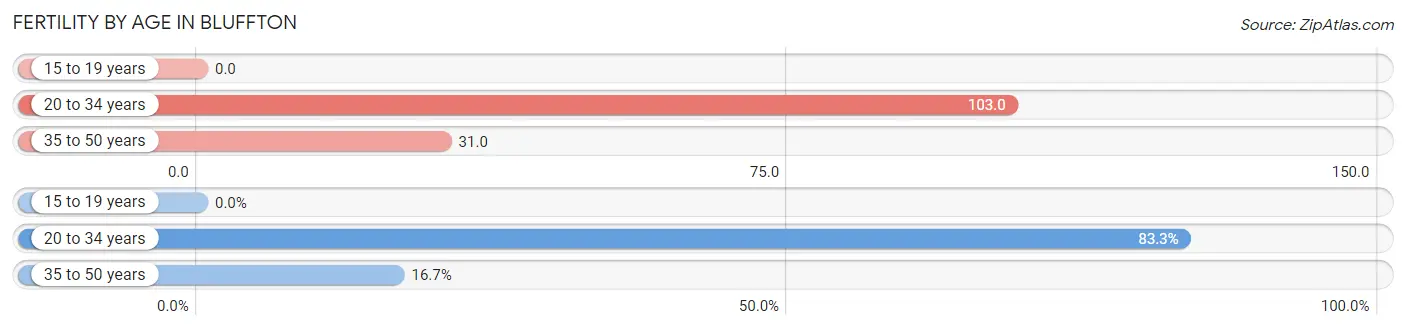
| Age Bracket | Women with Births | Births / 1,000 Women |
| 15 to 19 years | 0 (0.0%) | 0.0 |
| 20 to 34 years | 40 (83.3%) | 103.0 |
| 35 to 50 years | 8 (16.7%) | 31.0 |
| Total | 48 (100.0%) | 62.0 |
Fertility by Age by Marriage Status in Bluffton
83.3% of women with births (48) in Bluffton are married. The highest percentage of unmarried women with births falls into 35 to 50 years age bracket with 100.0% of them unmarried at the time of birth, while the lowest percentage of unmarried women with births belong to 20 to 34 years age bracket with 0.0% of them unmarried.
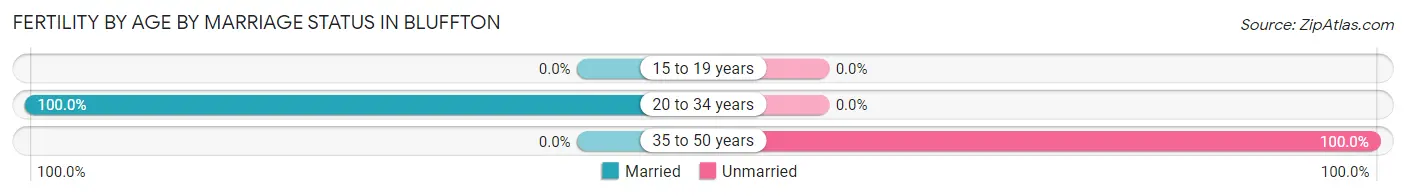
| Age Bracket | Married | Unmarried |
| 15 to 19 years | 0 (0.0%) | 0 (0.0%) |
| 20 to 34 years | 40 (100.0%) | 0 (0.0%) |
| 35 to 50 years | 0 (0.0%) | 8 (100.0%) |
| Total | 40 (83.3%) | 8 (16.7%) |
Fertility by Education in Bluffton
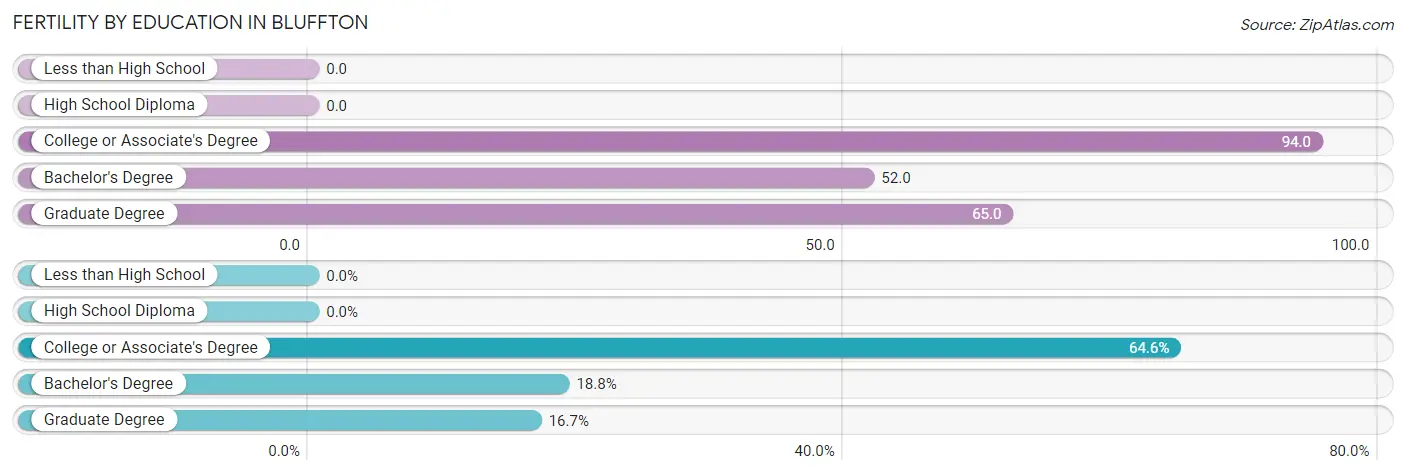
| Educational Attainment | Women with Births | Births / 1,000 Women |
| Less than High School | 0 (0.0%) | 0.0 |
| High School Diploma | 0 (0.0%) | 0.0 |
| College or Associate's Degree | 31 (64.6%) | 94.0 |
| Bachelor's Degree | 9 (18.8%) | 52.0 |
| Graduate Degree | 8 (16.7%) | 65.0 |
| Total | 48 (100.0%) | 62.0 |
Fertility by Education by Marriage Status in Bluffton
16.7% of women with births in Bluffton are unmarried. Women with the educational attainment of college or associate's degree are most likely to be married with 100.0% of them married at childbirth, while women with the educational attainment of graduate degree are least likely to be married with 100.0% of them unmarried at childbirth.
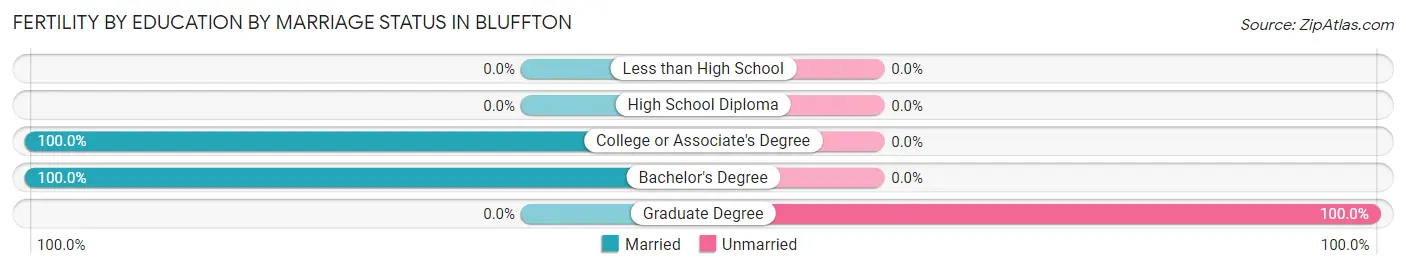
| Educational Attainment | Married | Unmarried |
| Less than High School | 0 (0.0%) | 0 (0.0%) |
| High School Diploma | 0 (0.0%) | 0 (0.0%) |
| College or Associate's Degree | 31 (100.0%) | 0 (0.0%) |
| Bachelor's Degree | 9 (100.0%) | 0 (0.0%) |
| Graduate Degree | 0 (0.0%) | 8 (100.0%) |
| Total | 40 (83.3%) | 8 (16.7%) |
Employment Characteristics in Bluffton
Employment by Class of Employer in Bluffton
Among the 1,506 employed individuals in Bluffton, private company employees (865 | 57.4%), not-for-profit organizations (369 | 24.5%), and local government employees (141 | 9.4%) make up the most common classes of employment.
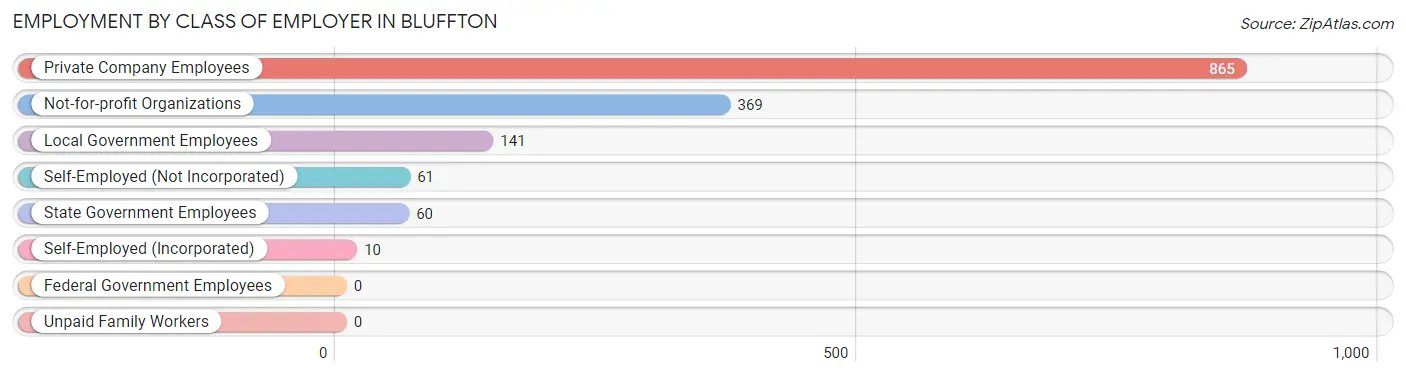
| Employer Class | # Employees | % Employees |
| Private Company Employees | 865 | 57.4% |
| Self-Employed (Incorporated) | 10 | 0.7% |
| Self-Employed (Not Incorporated) | 61 | 4.1% |
| Not-for-profit Organizations | 369 | 24.5% |
| Local Government Employees | 141 | 9.4% |
| State Government Employees | 60 | 4.0% |
| Federal Government Employees | 0 | 0.0% |
| Unpaid Family Workers | 0 | 0.0% |
| Total | 1,506 | 100.0% |
Employment Status by Age in Bluffton
According to the labor force statistics for Bluffton, out of the total population over 16 years of age (2,709), 60.4% or 1,636 individuals are in the labor force, with 5.7% or 93 of them unemployed. The age group with the highest labor force participation rate is 25 to 29 years, with 100.0% or 152 individuals in the labor force. Within the labor force, the 20 to 24 years age range has the highest percentage of unemployed individuals, with 15.2% or 42 of them being unemployed.
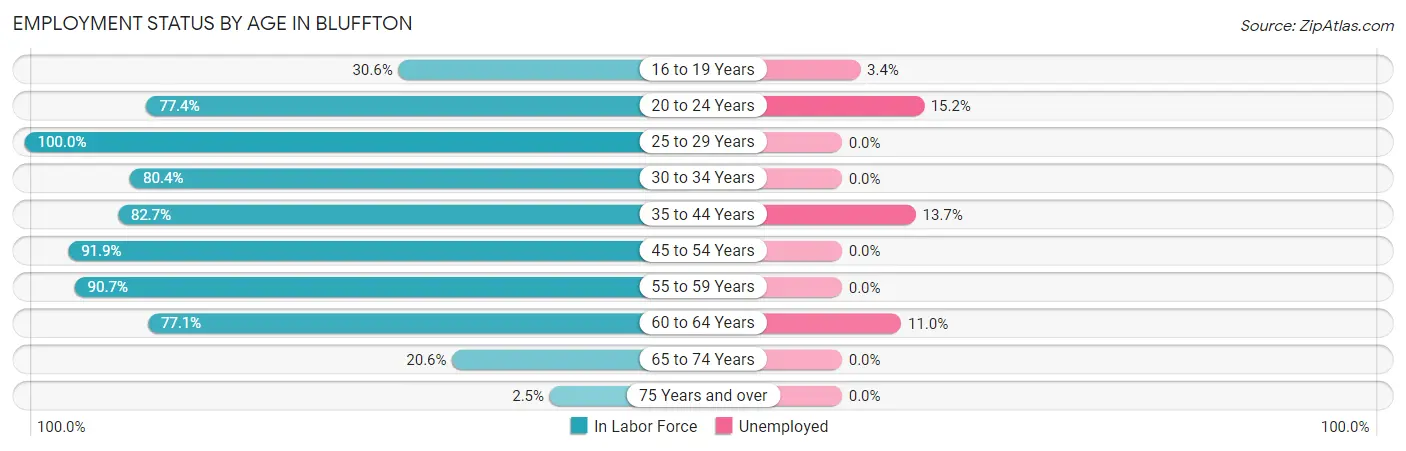
| Age Bracket | In Labor Force | Unemployed |
| 16 to 19 Years | 59 (30.6%) | 2 (3.4%) |
| 20 to 24 Years | 277 (77.4%) | 42 (15.2%) |
| 25 to 29 Years | 152 (100.0%) | 0 (0.0%) |
| 30 to 34 Years | 180 (80.4%) | 0 (0.0%) |
| 35 to 44 Years | 291 (82.7%) | 40 (13.7%) |
| 45 to 54 Years | 327 (91.9%) | 0 (0.0%) |
| 55 to 59 Years | 165 (90.7%) | 0 (0.0%) |
| 60 to 64 Years | 91 (77.1%) | 10 (11.0%) |
| 65 to 74 Years | 84 (20.6%) | 0 (0.0%) |
| 75 Years and over | 9 (2.5%) | 0 (0.0%) |
| Total | 1,636 (60.4%) | 93 (5.7%) |
Employment Status by Educational Attainment in Bluffton
According to labor force statistics for Bluffton, 87.1% of individuals (1,205) out of the total population between 25 and 64 years of age (1,384) are in the labor force, with 4.1% or 49 of them being unemployed. The group with the highest labor force participation rate are those with the educational attainment of bachelor's degree or higher, with 90.4% or 634 individuals in the labor force. Within the labor force, individuals with bachelor's degree or higher education have the highest percentage of unemployment, with 7.9% or 50 of them being unemployed.
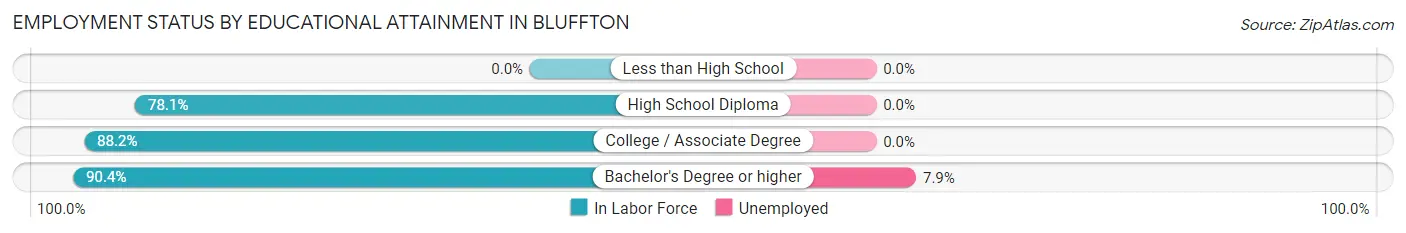
| Educational Attainment | In Labor Force | Unemployed |
| Less than High School | 0 (0.0%) | 0 (0.0%) |
| High School Diploma | 175 (78.1%) | 0 (0.0%) |
| College / Associate Degree | 397 (88.2%) | 0 (0.0%) |
| Bachelor's Degree or higher | 634 (90.4%) | 55 (7.9%) |
| Total | 1,205 (87.1%) | 57 (4.1%) |
Employment Occupations by Sex in Bluffton
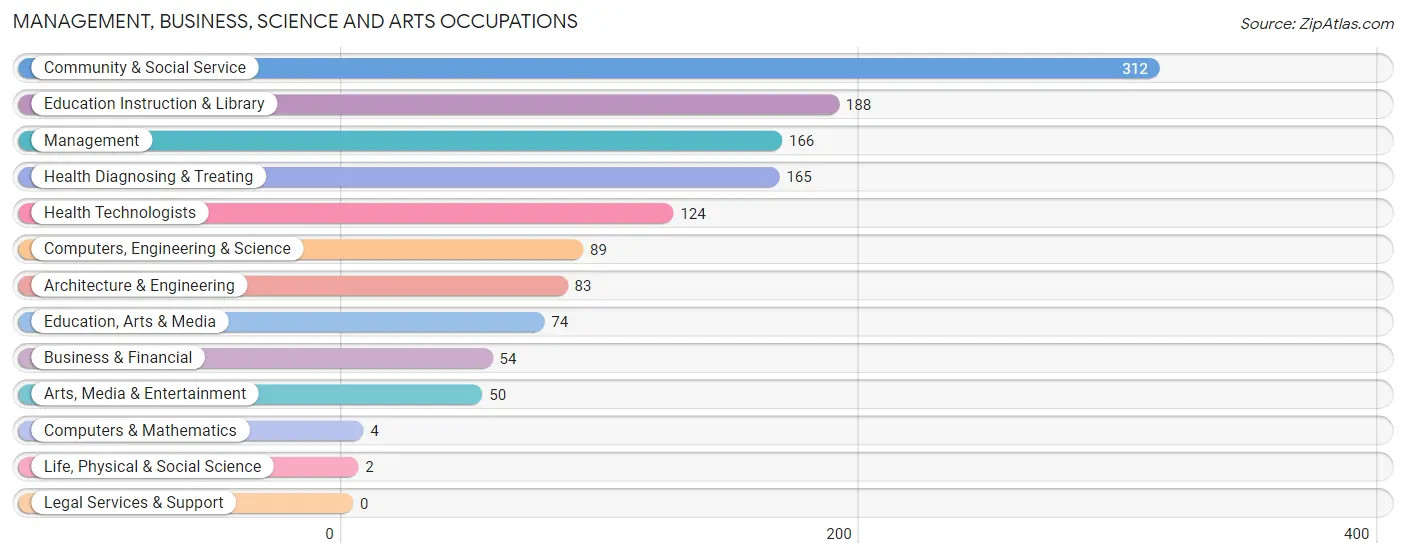
Management, Business, Science and Arts Occupations
The most common Management, Business, Science and Arts occupations in Bluffton are Community & Social Service (312 | 20.3%), Education Instruction & Library (188 | 12.2%), Management (166 | 10.8%), Health Diagnosing & Treating (165 | 10.7%), and Health Technologists (124 | 8.1%).
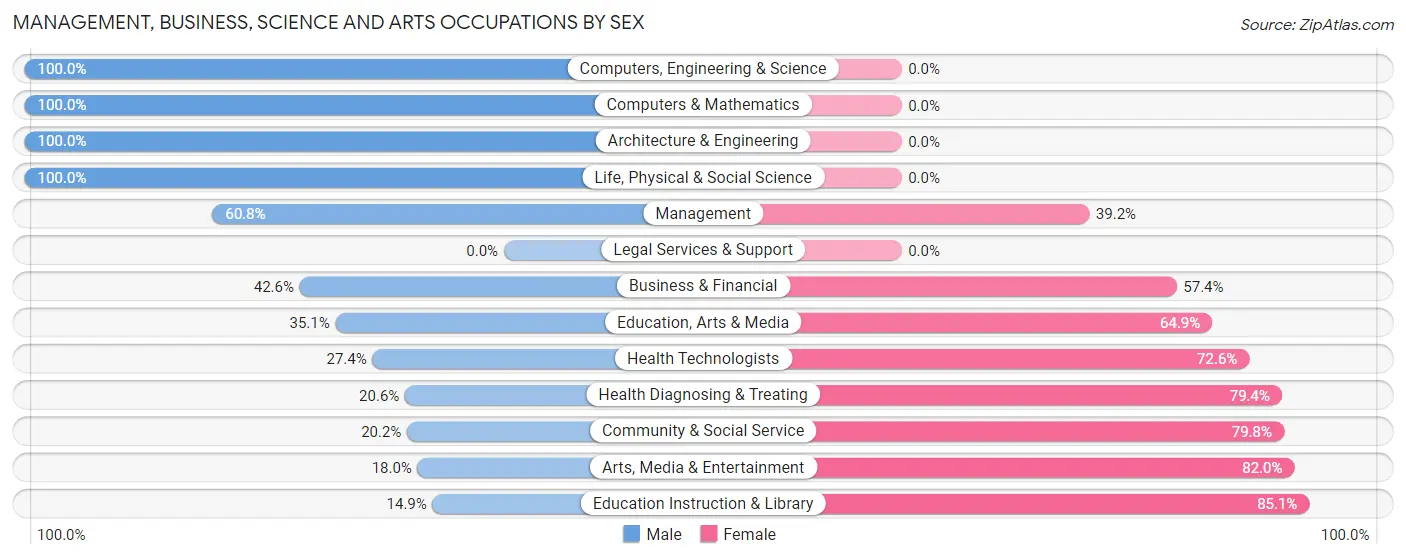
Management, Business, Science and Arts Occupations by Sex
Within the Management, Business, Science and Arts occupations in Bluffton, the most male-oriented occupations are Computers, Engineering & Science (100.0%), Computers & Mathematics (100.0%), and Architecture & Engineering (100.0%), while the most female-oriented occupations are Education Instruction & Library (85.1%), Arts, Media & Entertainment (82.0%), and Community & Social Service (79.8%).
| Occupation | Male | Female |
| Management | 101 (60.8%) | 65 (39.2%) |
| Business & Financial | 23 (42.6%) | 31 (57.4%) |
| Computers, Engineering & Science | 89 (100.0%) | 0 (0.0%) |
| Computers & Mathematics | 4 (100.0%) | 0 (0.0%) |
| Architecture & Engineering | 83 (100.0%) | 0 (0.0%) |
| Life, Physical & Social Science | 2 (100.0%) | 0 (0.0%) |
| Community & Social Service | 63 (20.2%) | 249 (79.8%) |
| Education, Arts & Media | 26 (35.1%) | 48 (64.9%) |
| Legal Services & Support | 0 (0.0%) | 0 (0.0%) |
| Education Instruction & Library | 28 (14.9%) | 160 (85.1%) |
| Arts, Media & Entertainment | 9 (18.0%) | 41 (82.0%) |
| Health Diagnosing & Treating | 34 (20.6%) | 131 (79.4%) |
| Health Technologists | 34 (27.4%) | 90 (72.6%) |
| Total (Category) | 310 (39.4%) | 476 (60.6%) |
| Total (Overall) | 787 (51.1%) | 754 (48.9%) |
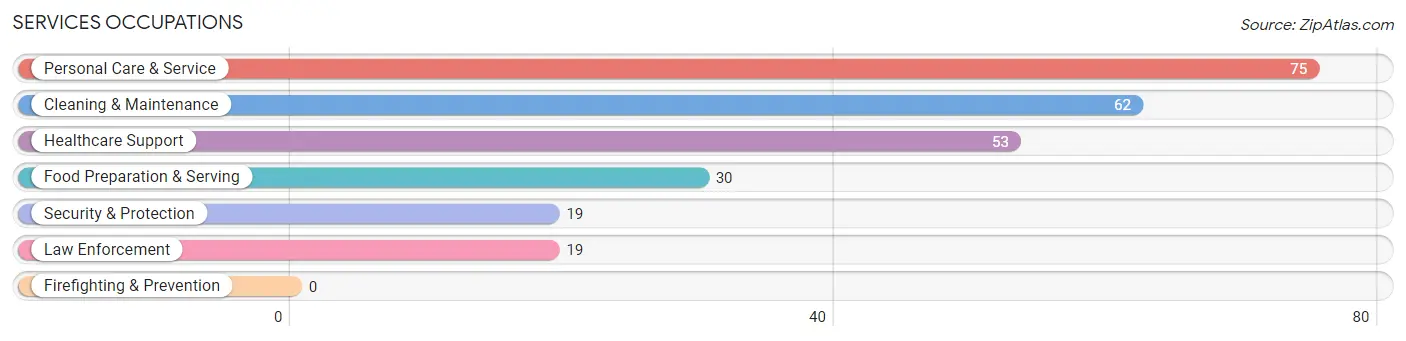
Services Occupations
The most common Services occupations in Bluffton are Personal Care & Service (75 | 4.9%), Cleaning & Maintenance (62 | 4.0%), Healthcare Support (53 | 3.4%), Food Preparation & Serving (30 | 1.9%), and Security & Protection (19 | 1.2%).
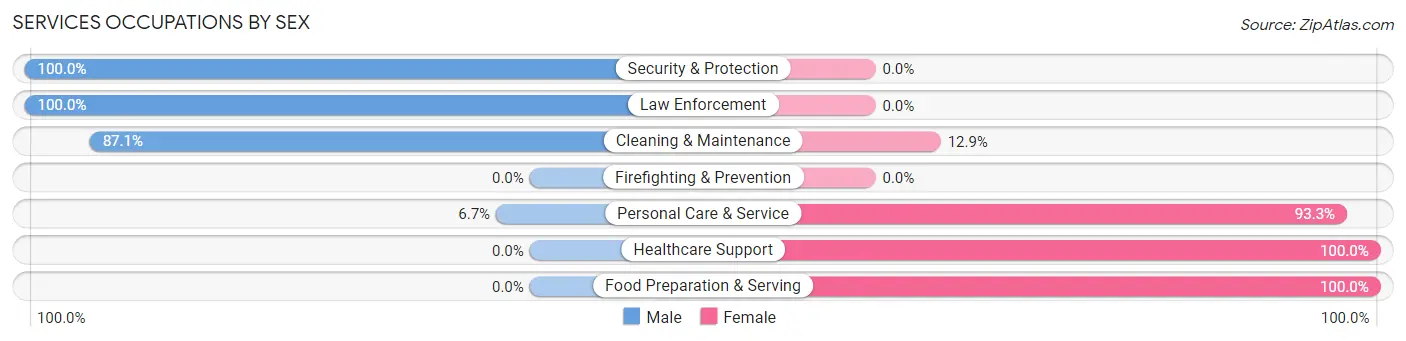
Services Occupations by Sex
Within the Services occupations in Bluffton, the most male-oriented occupations are Security & Protection (100.0%), Law Enforcement (100.0%), and Cleaning & Maintenance (87.1%), while the most female-oriented occupations are Healthcare Support (100.0%), Food Preparation & Serving (100.0%), and Personal Care & Service (93.3%).
| Occupation | Male | Female |
| Healthcare Support | 0 (0.0%) | 53 (100.0%) |
| Security & Protection | 19 (100.0%) | 0 (0.0%) |
| Firefighting & Prevention | 0 (0.0%) | 0 (0.0%) |
| Law Enforcement | 19 (100.0%) | 0 (0.0%) |
| Food Preparation & Serving | 0 (0.0%) | 30 (100.0%) |
| Cleaning & Maintenance | 54 (87.1%) | 8 (12.9%) |
| Personal Care & Service | 5 (6.7%) | 70 (93.3%) |
| Total (Category) | 78 (32.6%) | 161 (67.4%) |
| Total (Overall) | 787 (51.1%) | 754 (48.9%) |
Sales and Office Occupations
The most common Sales and Office occupations in Bluffton are Office & Administration (123 | 8.0%), and Sales & Related (71 | 4.6%).
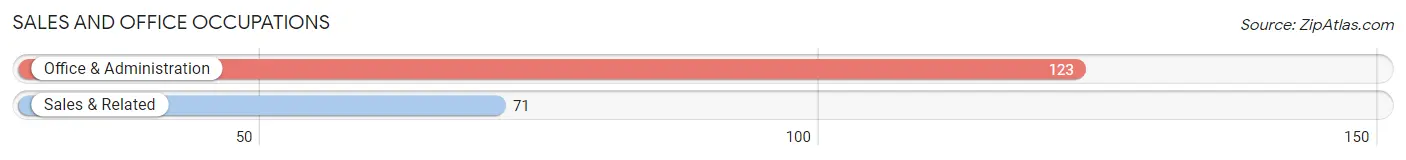
Sales and Office Occupations by Sex
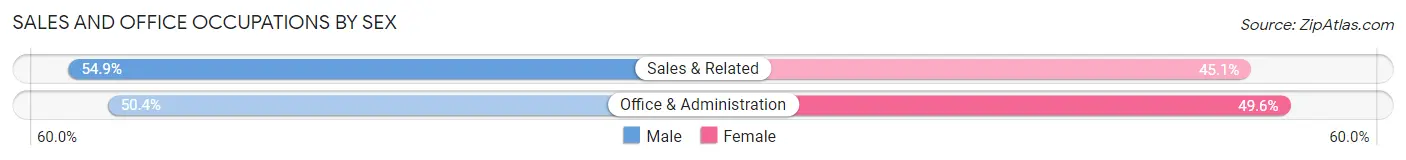
| Occupation | Male | Female |
| Sales & Related | 39 (54.9%) | 32 (45.1%) |
| Office & Administration | 62 (50.4%) | 61 (49.6%) |
| Total (Category) | 101 (52.1%) | 93 (47.9%) |
| Total (Overall) | 787 (51.1%) | 754 (48.9%) |
Natural Resources, Construction and Maintenance Occupations
The most common Natural Resources, Construction and Maintenance occupations in Bluffton are Installation, Maintenance & Repair (91 | 5.9%), and Construction & Extraction (44 | 2.9%).
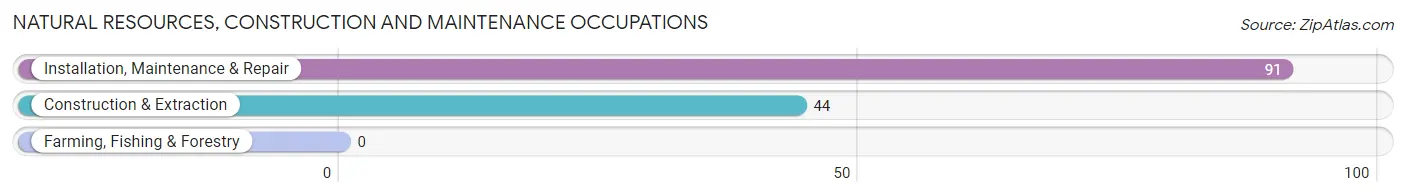
Natural Resources, Construction and Maintenance Occupations by Sex
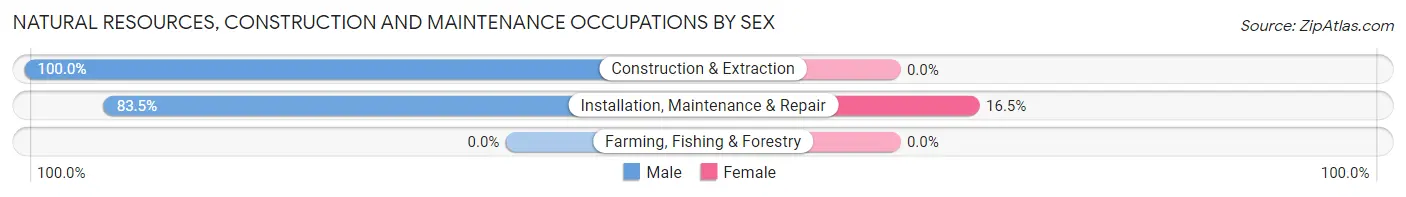
| Occupation | Male | Female |
| Farming, Fishing & Forestry | 0 (0.0%) | 0 (0.0%) |
| Construction & Extraction | 44 (100.0%) | 0 (0.0%) |
| Installation, Maintenance & Repair | 76 (83.5%) | 15 (16.5%) |
| Total (Category) | 120 (88.9%) | 15 (11.1%) |
| Total (Overall) | 787 (51.1%) | 754 (48.9%) |
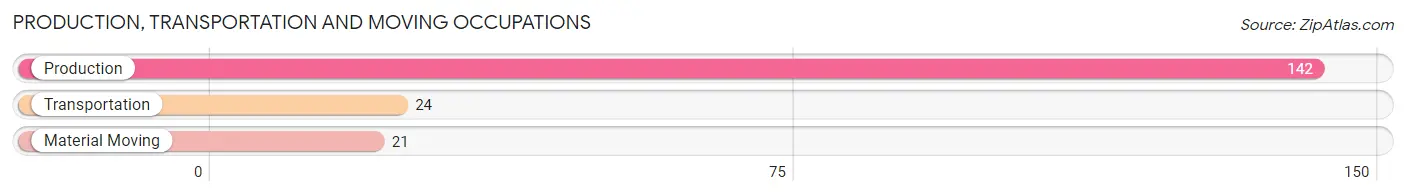
Production, Transportation and Moving Occupations
The most common Production, Transportation and Moving occupations in Bluffton are Production (142 | 9.2%), Transportation (24 | 1.6%), and Material Moving (21 | 1.4%).
Production, Transportation and Moving Occupations by Sex
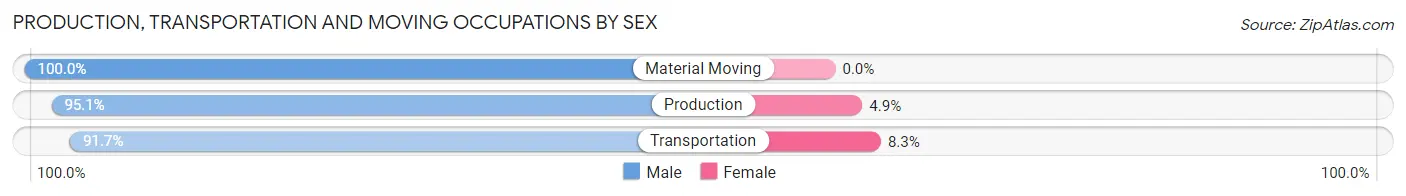
| Occupation | Male | Female |
| Production | 135 (95.1%) | 7 (4.9%) |
| Transportation | 22 (91.7%) | 2 (8.3%) |
| Material Moving | 21 (100.0%) | 0 (0.0%) |
| Total (Category) | 178 (95.2%) | 9 (4.8%) |
| Total (Overall) | 787 (51.1%) | 754 (48.9%) |
Employment Industries by Sex in Bluffton
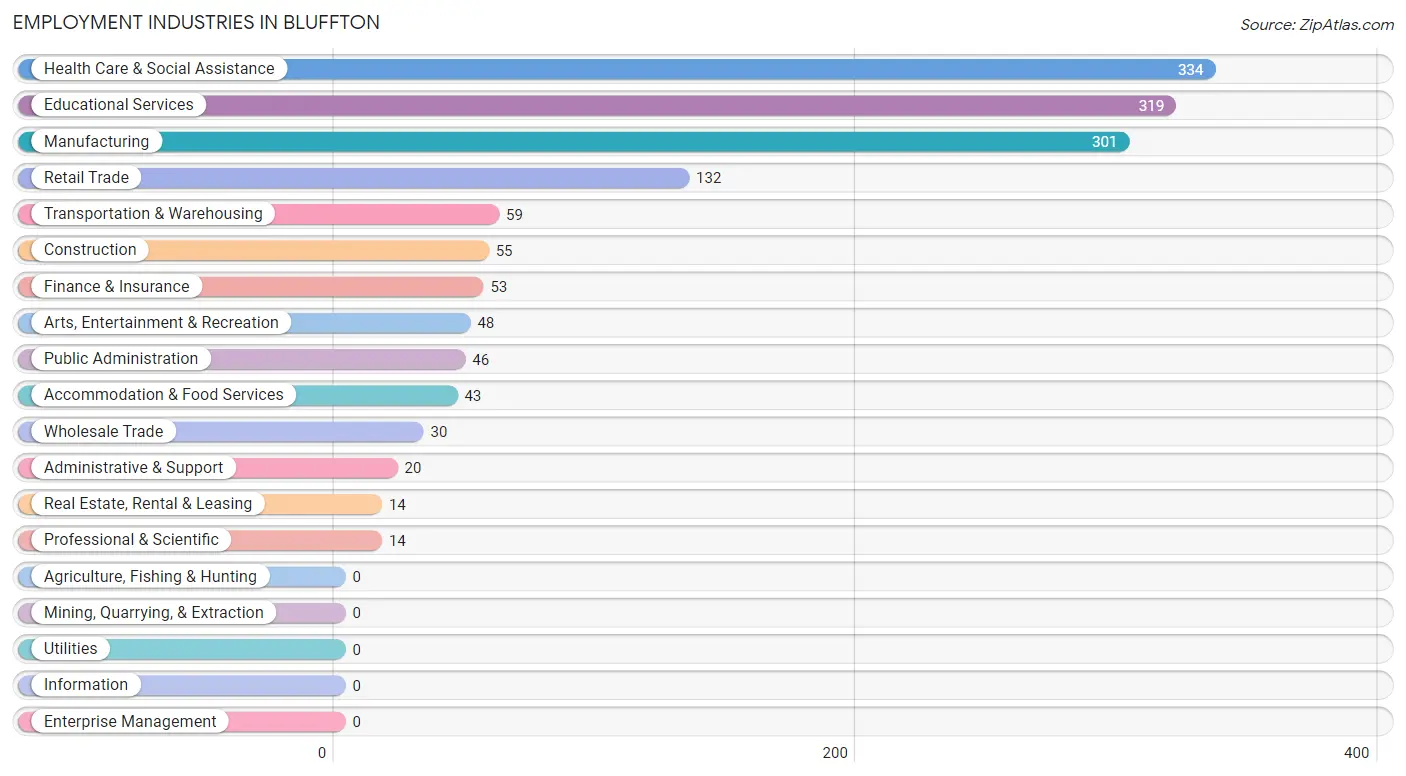
Employment Industries in Bluffton
The major employment industries in Bluffton include Health Care & Social Assistance (334 | 21.7%), Educational Services (319 | 20.7%), Manufacturing (301 | 19.5%), Retail Trade (132 | 8.6%), and Transportation & Warehousing (59 | 3.8%).
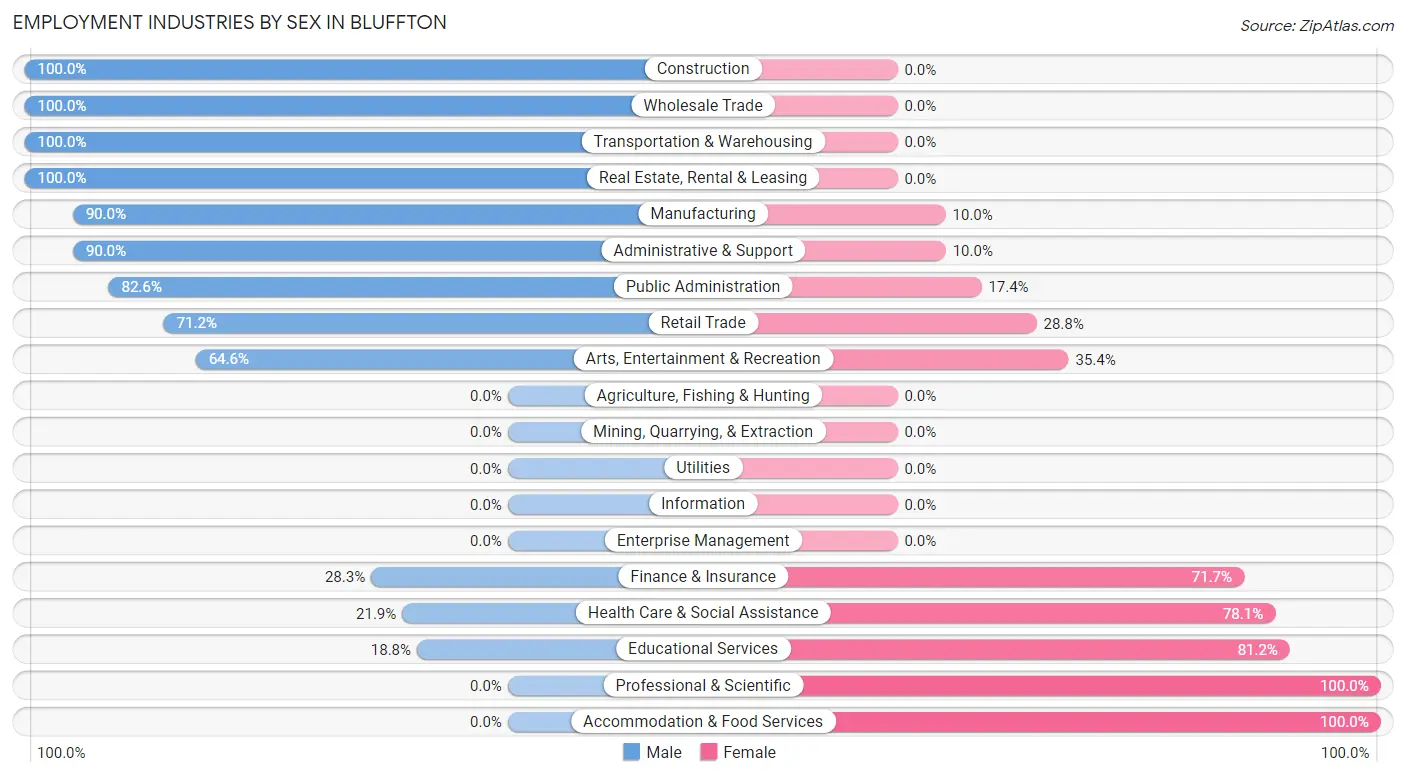
Employment Industries by Sex in Bluffton
The Bluffton industries that see more men than women are Construction (100.0%), Wholesale Trade (100.0%), and Transportation & Warehousing (100.0%), whereas the industries that tend to have a higher number of women are Professional & Scientific (100.0%), Accommodation & Food Services (100.0%), and Educational Services (81.2%).
| Industry | Male | Female |
| Agriculture, Fishing & Hunting | 0 (0.0%) | 0 (0.0%) |
| Mining, Quarrying, & Extraction | 0 (0.0%) | 0 (0.0%) |
| Construction | 55 (100.0%) | 0 (0.0%) |
| Manufacturing | 271 (90.0%) | 30 (10.0%) |
| Wholesale Trade | 30 (100.0%) | 0 (0.0%) |
| Retail Trade | 94 (71.2%) | 38 (28.8%) |
| Transportation & Warehousing | 59 (100.0%) | 0 (0.0%) |
| Utilities | 0 (0.0%) | 0 (0.0%) |
| Information | 0 (0.0%) | 0 (0.0%) |
| Finance & Insurance | 15 (28.3%) | 38 (71.7%) |
| Real Estate, Rental & Leasing | 14 (100.0%) | 0 (0.0%) |
| Professional & Scientific | 0 (0.0%) | 14 (100.0%) |
| Enterprise Management | 0 (0.0%) | 0 (0.0%) |
| Administrative & Support | 18 (90.0%) | 2 (10.0%) |
| Educational Services | 60 (18.8%) | 259 (81.2%) |
| Health Care & Social Assistance | 73 (21.9%) | 261 (78.1%) |
| Arts, Entertainment & Recreation | 31 (64.6%) | 17 (35.4%) |
| Accommodation & Food Services | 0 (0.0%) | 43 (100.0%) |
| Public Administration | 38 (82.6%) | 8 (17.4%) |
| Total | 787 (51.1%) | 754 (48.9%) |
Education in Bluffton
School Enrollment in Bluffton
The most common levels of schooling among the 1,109 students in Bluffton are college / undergraduate (380 | 34.3%), middle school (206 | 18.6%), and elementary school (181 | 16.3%).
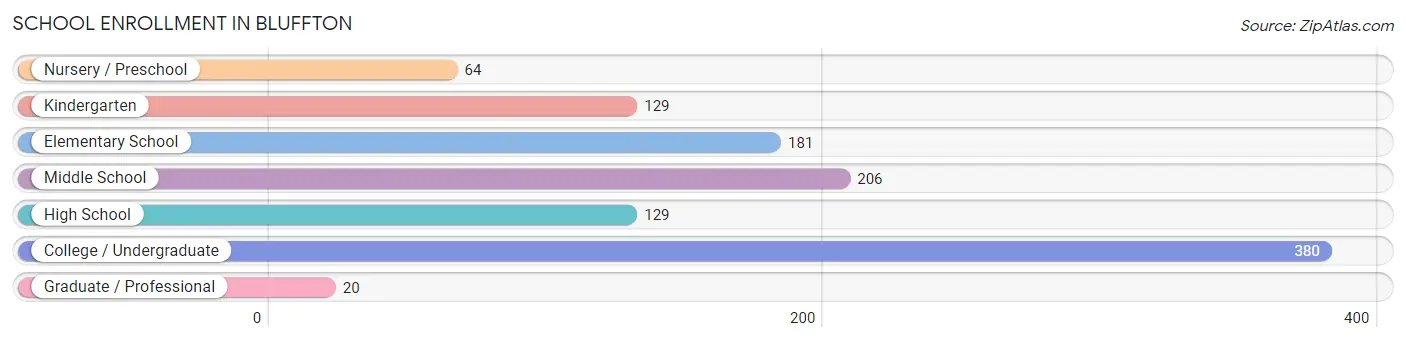
| School Level | # Students | % Students |
| Nursery / Preschool | 64 | 5.8% |
| Kindergarten | 129 | 11.6% |
| Elementary School | 181 | 16.3% |
| Middle School | 206 | 18.6% |
| High School | 129 | 11.6% |
| College / Undergraduate | 380 | 34.3% |
| Graduate / Professional | 20 | 1.8% |
| Total | 1,109 | 100.0% |
School Enrollment by Age by Funding Source in Bluffton
Out of a total of 1,109 students who are enrolled in schools in Bluffton, 216 (19.5%) attend a private institution, while the remaining 893 (80.5%) are enrolled in public schools. The age group of 20 to 24 year olds has the highest likelihood of being enrolled in private schools, with 143 (55.0% in the age bracket) enrolled. Conversely, the age group of 3 to 4 year olds has the lowest likelihood of being enrolled in a private school, with 56 (100.0% in the age bracket) attending a public institution.
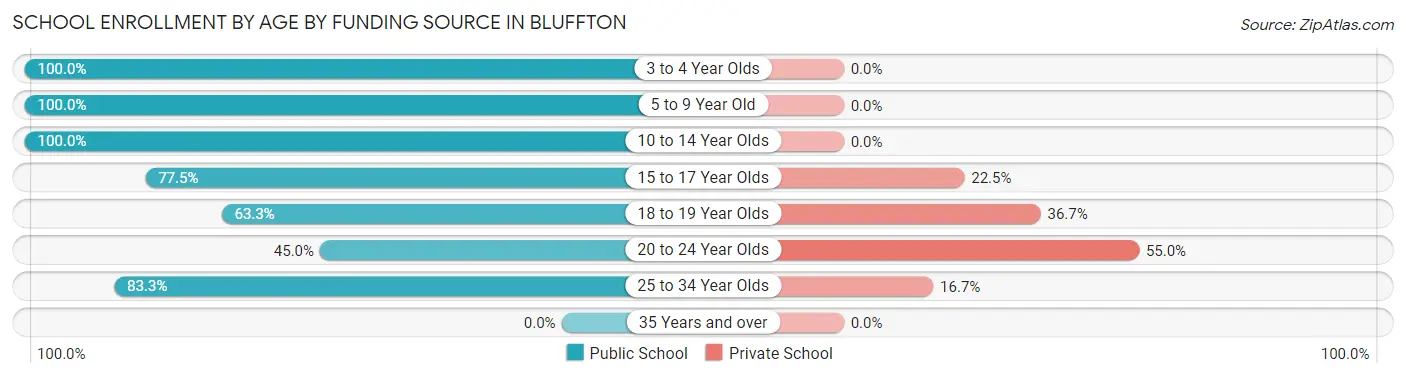
| Age Bracket | Public School | Private School |
| 3 to 4 Year Olds | 56 (100.0%) | 0 (0.0%) |
| 5 to 9 Year Old | 222 (100.0%) | 0 (0.0%) |
| 10 to 14 Year Olds | 308 (100.0%) | 0 (0.0%) |
| 15 to 17 Year Olds | 69 (77.5%) | 20 (22.5%) |
| 18 to 19 Year Olds | 76 (63.3%) | 44 (36.7%) |
| 20 to 24 Year Olds | 117 (45.0%) | 143 (55.0%) |
| 25 to 34 Year Olds | 45 (83.3%) | 9 (16.7%) |
| 35 Years and over | 0 (0.0%) | 0 (0.0%) |
| Total | 893 (80.5%) | 216 (19.5%) |
Educational Attainment by Field of Study in Bluffton
Education (252 | 25.3%), business (171 | 17.2%), science & technology (85 | 8.5%), arts & humanities (82 | 8.2%), and bio, nature & agricultural (81 | 8.1%) are the most common fields of study among 996 individuals in Bluffton who have obtained a bachelor's degree or higher.
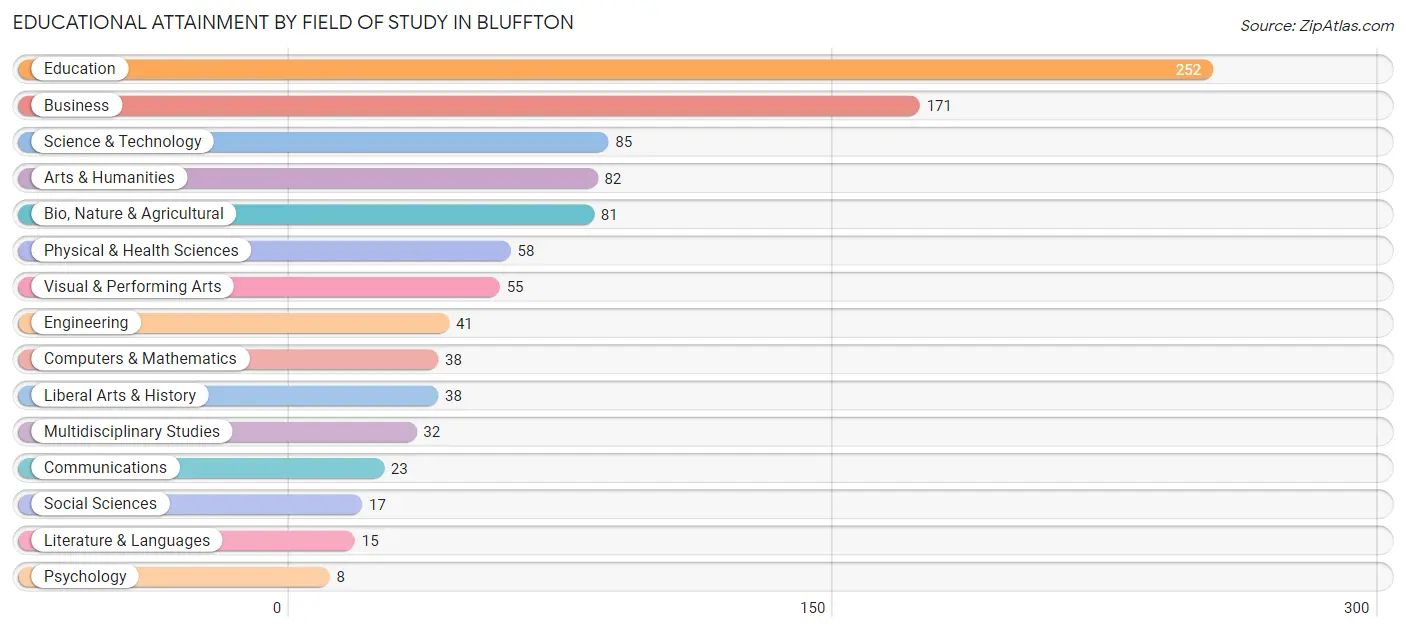
| Field of Study | # Graduates | % Graduates |
| Computers & Mathematics | 38 | 3.8% |
| Bio, Nature & Agricultural | 81 | 8.1% |
| Physical & Health Sciences | 58 | 5.8% |
| Psychology | 8 | 0.8% |
| Social Sciences | 17 | 1.7% |
| Engineering | 41 | 4.1% |
| Multidisciplinary Studies | 32 | 3.2% |
| Science & Technology | 85 | 8.5% |
| Business | 171 | 17.2% |
| Education | 252 | 25.3% |
| Literature & Languages | 15 | 1.5% |
| Liberal Arts & History | 38 | 3.8% |
| Visual & Performing Arts | 55 | 5.5% |
| Communications | 23 | 2.3% |
| Arts & Humanities | 82 | 8.2% |
| Total | 996 | 100.0% |
Transportation & Commute in Bluffton
Vehicle Availability by Sex in Bluffton
The most prevalent vehicle ownership categories in Bluffton are males with 2 vehicles (383, accounting for 56.4%) and females with 2 vehicles (226, making up 57.1%).
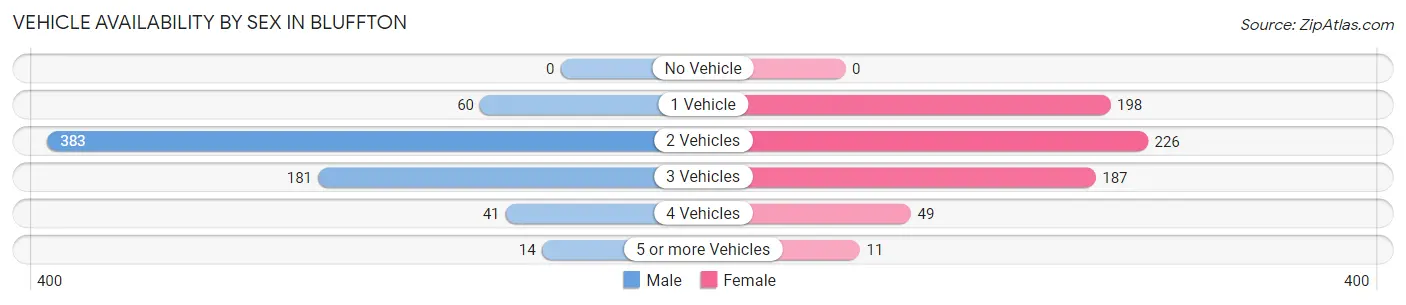
| Vehicles Available | Male | Female |
| No Vehicle | 0 (0.0%) | 0 (0.0%) |
| 1 Vehicle | 60 (8.8%) | 198 (29.5%) |
| 2 Vehicles | 383 (56.4%) | 226 (33.7%) |
| 3 Vehicles | 181 (26.7%) | 187 (27.9%) |
| 4 Vehicles | 41 (6.0%) | 49 (7.3%) |
| 5 or more Vehicles | 14 (2.1%) | 11 (1.6%) |
| Total | 679 (100.0%) | 671 (100.0%) |
Commute Time in Bluffton
The most frequently occuring commute durations in Bluffton are 5 to 9 minutes (358 commuters, 26.4%), 20 to 24 minutes (190 commuters, 14.0%), and 25 to 29 minutes (174 commuters, 12.8%).
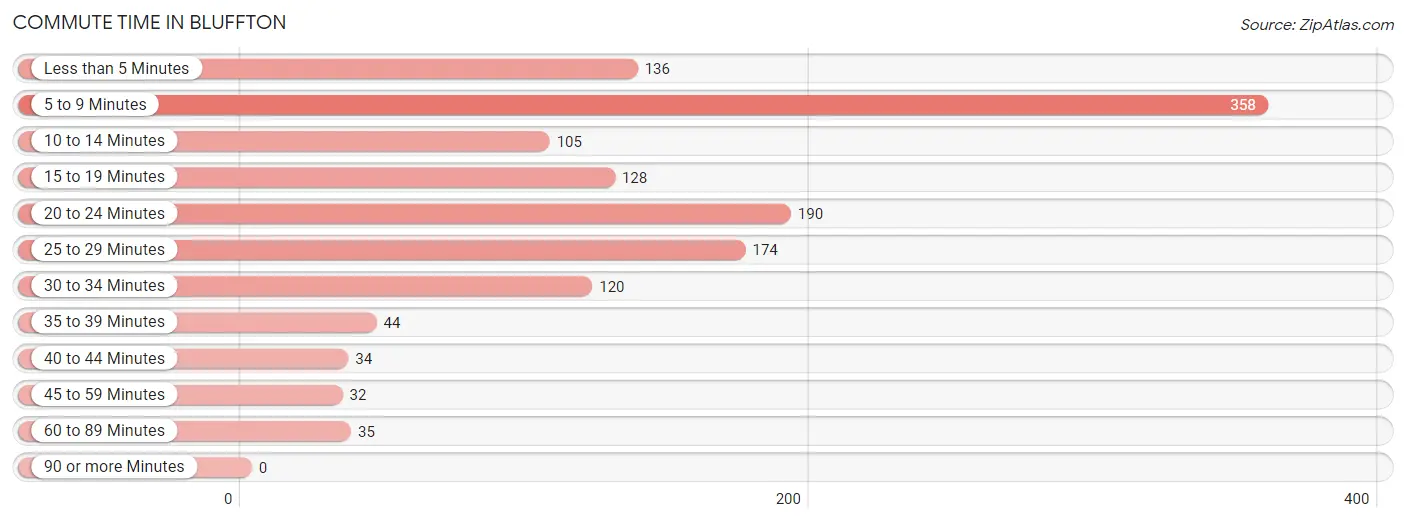
| Commute Time | # Commuters | % Commuters |
| Less than 5 Minutes | 136 | 10.0% |
| 5 to 9 Minutes | 358 | 26.4% |
| 10 to 14 Minutes | 105 | 7.7% |
| 15 to 19 Minutes | 128 | 9.4% |
| 20 to 24 Minutes | 190 | 14.0% |
| 25 to 29 Minutes | 174 | 12.8% |
| 30 to 34 Minutes | 120 | 8.8% |
| 35 to 39 Minutes | 44 | 3.2% |
| 40 to 44 Minutes | 34 | 2.5% |
| 45 to 59 Minutes | 32 | 2.4% |
| 60 to 89 Minutes | 35 | 2.6% |
| 90 or more Minutes | 0 | 0.0% |
Commute Time by Sex in Bluffton
The most common commute times in Bluffton are 5 to 9 minutes (205 commuters, 29.2%) for males and 5 to 9 minutes (153 commuters, 23.4%) for females.
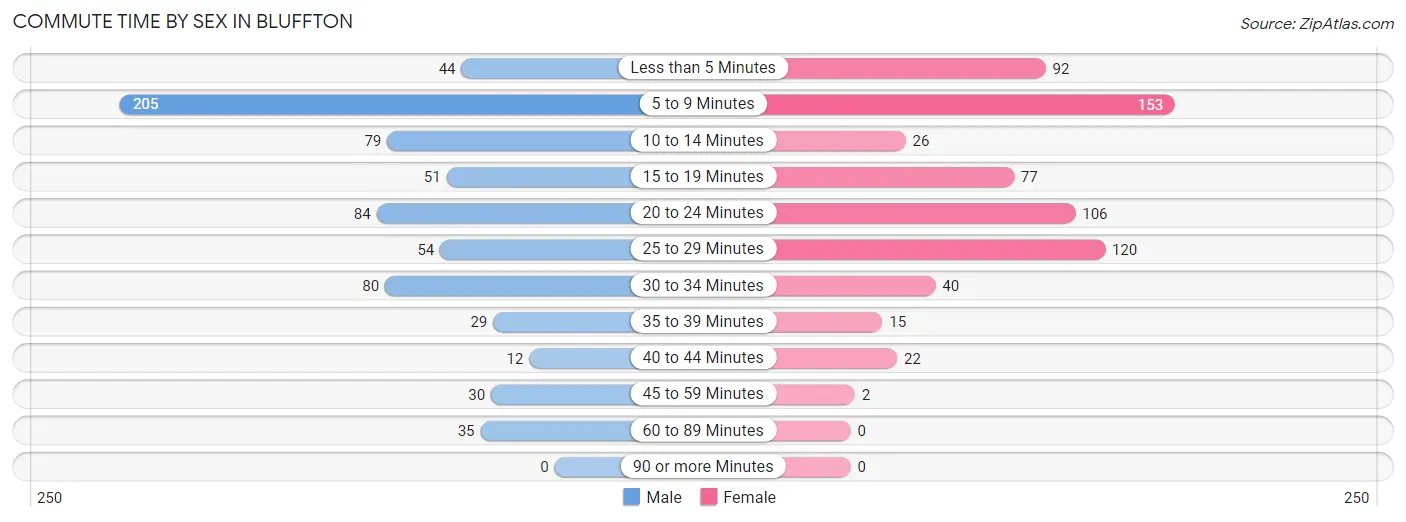
| Commute Time | Male | Female |
| Less than 5 Minutes | 44 (6.3%) | 92 (14.1%) |
| 5 to 9 Minutes | 205 (29.2%) | 153 (23.4%) |
| 10 to 14 Minutes | 79 (11.2%) | 26 (4.0%) |
| 15 to 19 Minutes | 51 (7.2%) | 77 (11.8%) |
| 20 to 24 Minutes | 84 (11.9%) | 106 (16.2%) |
| 25 to 29 Minutes | 54 (7.7%) | 120 (18.4%) |
| 30 to 34 Minutes | 80 (11.4%) | 40 (6.1%) |
| 35 to 39 Minutes | 29 (4.1%) | 15 (2.3%) |
| 40 to 44 Minutes | 12 (1.7%) | 22 (3.4%) |
| 45 to 59 Minutes | 30 (4.3%) | 2 (0.3%) |
| 60 to 89 Minutes | 35 (5.0%) | 0 (0.0%) |
| 90 or more Minutes | 0 (0.0%) | 0 (0.0%) |
Time of Departure to Work by Sex in Bluffton
The most frequent times of departure to work in Bluffton are 7:00 AM to 7:29 AM (138, 19.6%) for males and 7:30 AM to 7:59 AM (157, 24.0%) for females.
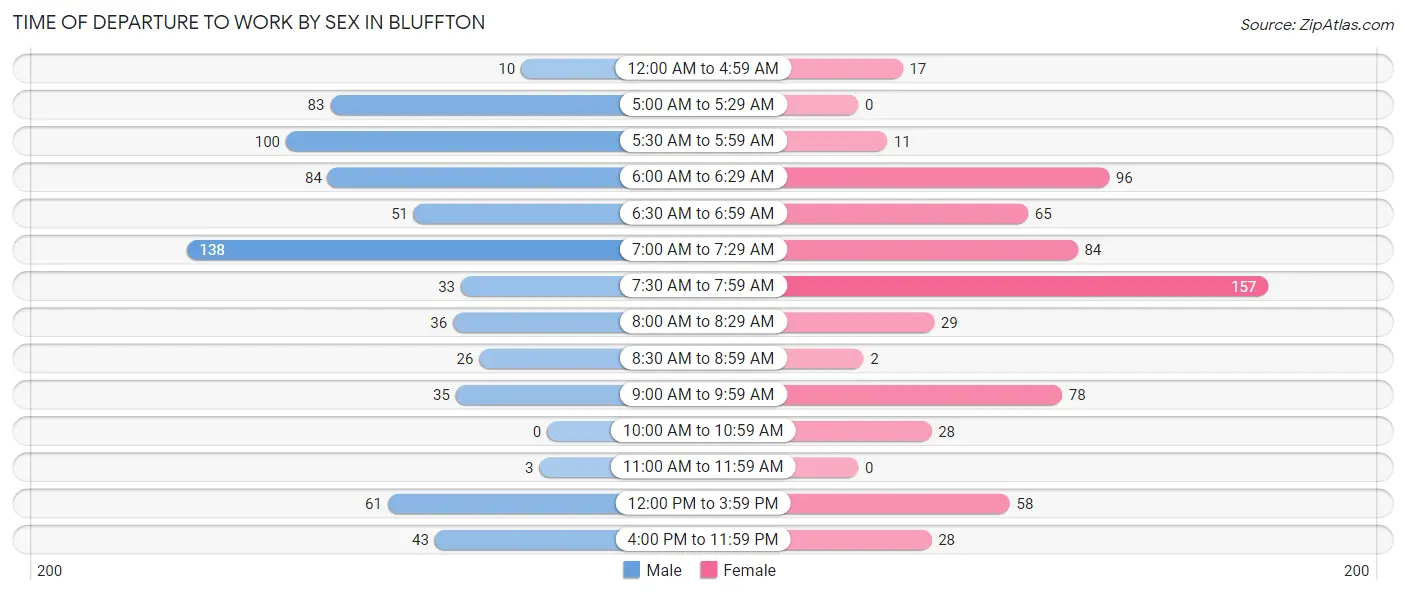
| Time of Departure | Male | Female |
| 12:00 AM to 4:59 AM | 10 (1.4%) | 17 (2.6%) |
| 5:00 AM to 5:29 AM | 83 (11.8%) | 0 (0.0%) |
| 5:30 AM to 5:59 AM | 100 (14.2%) | 11 (1.7%) |
| 6:00 AM to 6:29 AM | 84 (11.9%) | 96 (14.7%) |
| 6:30 AM to 6:59 AM | 51 (7.2%) | 65 (10.0%) |
| 7:00 AM to 7:29 AM | 138 (19.6%) | 84 (12.9%) |
| 7:30 AM to 7:59 AM | 33 (4.7%) | 157 (24.0%) |
| 8:00 AM to 8:29 AM | 36 (5.1%) | 29 (4.4%) |
| 8:30 AM to 8:59 AM | 26 (3.7%) | 2 (0.3%) |
| 9:00 AM to 9:59 AM | 35 (5.0%) | 78 (11.9%) |
| 10:00 AM to 10:59 AM | 0 (0.0%) | 28 (4.3%) |
| 11:00 AM to 11:59 AM | 3 (0.4%) | 0 (0.0%) |
| 12:00 PM to 3:59 PM | 61 (8.7%) | 58 (8.9%) |
| 4:00 PM to 11:59 PM | 43 (6.1%) | 28 (4.3%) |
| Total | 703 (100.0%) | 653 (100.0%) |
Housing Occupancy in Bluffton
Occupancy by Ownership in Bluffton
Of the total 1,352 dwellings in Bluffton, owner-occupied units account for 1,007 (74.5%), while renter-occupied units make up 345 (25.5%).
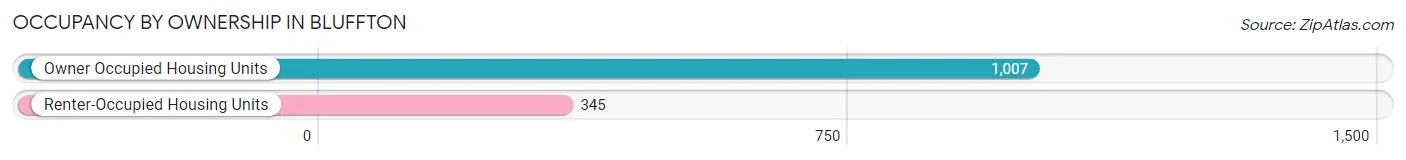
| Occupancy | # Housing Units | % Housing Units |
| Owner Occupied Housing Units | 1,007 | 74.5% |
| Renter-Occupied Housing Units | 345 | 25.5% |
| Total Occupied Housing Units | 1,352 | 100.0% |
Occupancy by Household Size in Bluffton
| Household Size | # Housing Units | % Housing Units |
| 1-Person Household | 474 | 35.1% |
| 2-Person Household | 412 | 30.5% |
| 3-Person Household | 182 | 13.5% |
| 4+ Person Household | 284 | 21.0% |
| Total Housing Units | 1,352 | 100.0% |
Occupancy by Ownership by Household Size in Bluffton
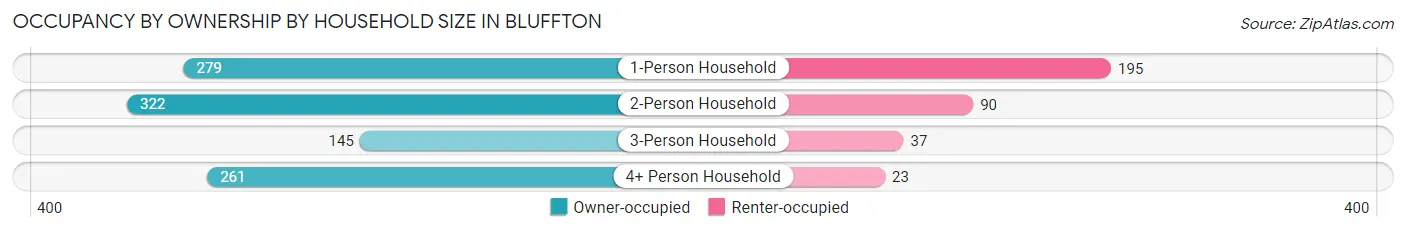
| Household Size | Owner-occupied | Renter-occupied |
| 1-Person Household | 279 (58.9%) | 195 (41.1%) |
| 2-Person Household | 322 (78.2%) | 90 (21.8%) |
| 3-Person Household | 145 (79.7%) | 37 (20.3%) |
| 4+ Person Household | 261 (91.9%) | 23 (8.1%) |
| Total Housing Units | 1,007 (74.5%) | 345 (25.5%) |
Occupancy by Educational Attainment in Bluffton
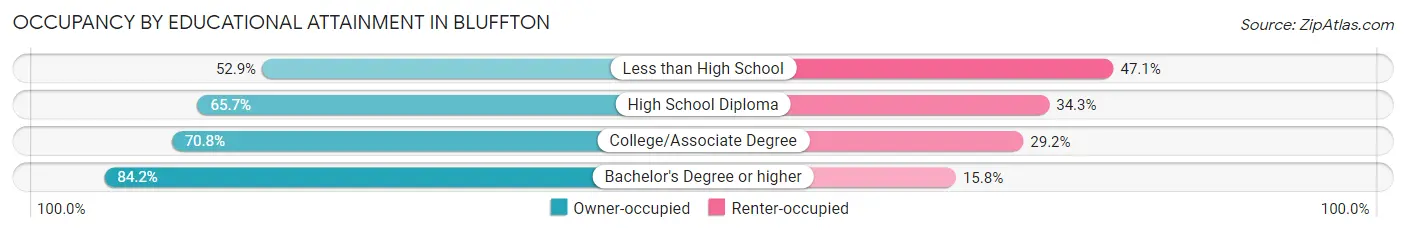
| Household Size | Owner-occupied | Renter-occupied |
| Less than High School | 9 (52.9%) | 8 (47.1%) |
| High School Diploma | 245 (65.7%) | 128 (34.3%) |
| College/Associate Degree | 301 (70.8%) | 124 (29.2%) |
| Bachelor's Degree or higher | 452 (84.2%) | 85 (15.8%) |
Occupancy by Age of Householder in Bluffton
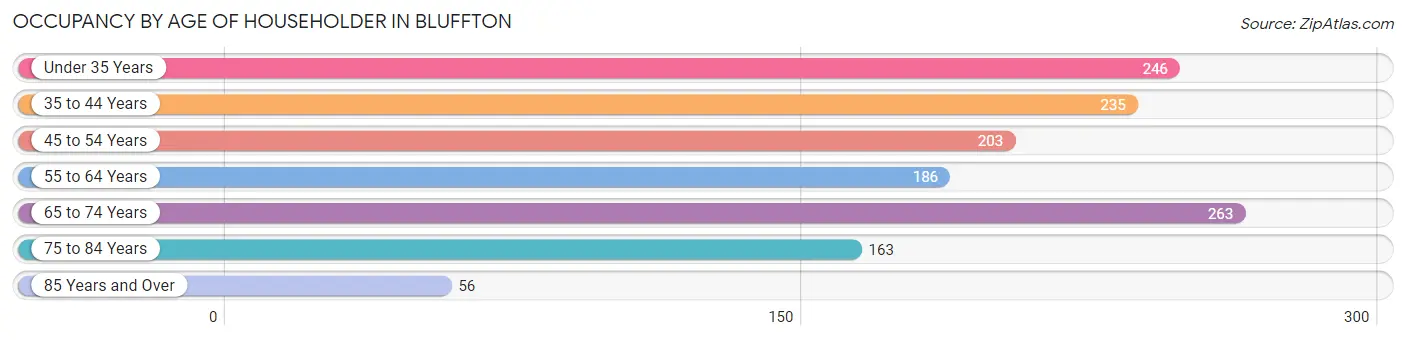
| Age Bracket | # Households | % Households |
| Under 35 Years | 246 | 18.2% |
| 35 to 44 Years | 235 | 17.4% |
| 45 to 54 Years | 203 | 15.0% |
| 55 to 64 Years | 186 | 13.8% |
| 65 to 74 Years | 263 | 19.5% |
| 75 to 84 Years | 163 | 12.1% |
| 85 Years and Over | 56 | 4.1% |
| Total | 1,352 | 100.0% |
Housing Finances in Bluffton
Median Income by Occupancy in Bluffton
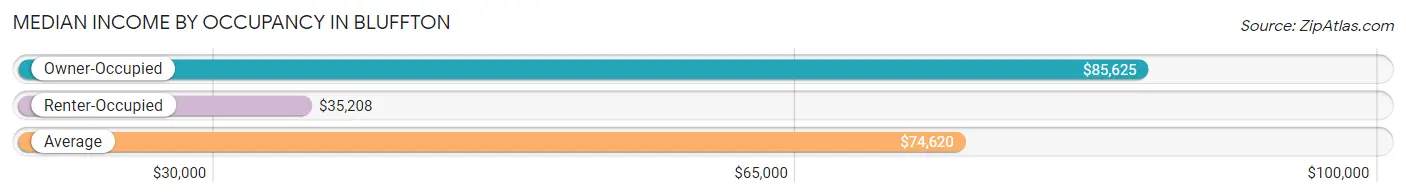
| Occupancy Type | # Households | Median Income |
| Owner-Occupied | 1,007 (74.5%) | $85,625 |
| Renter-Occupied | 345 (25.5%) | $35,208 |
| Average | 1,352 (100.0%) | $74,620 |
Occupancy by Householder Income Bracket in Bluffton
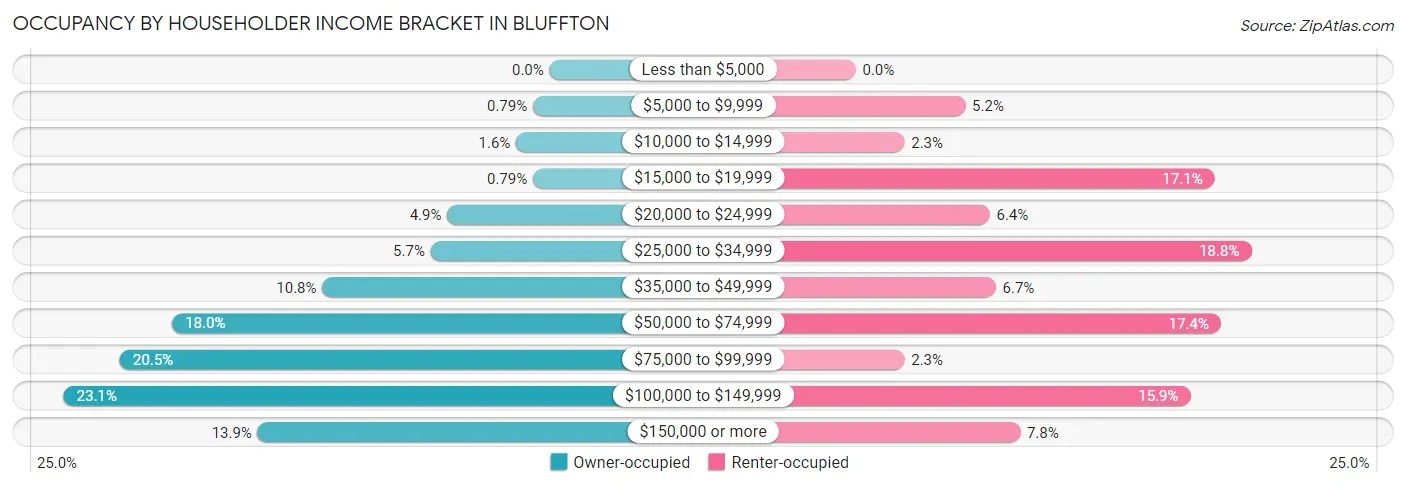
| Income Bracket | Owner-occupied | Renter-occupied |
| Less than $5,000 | 0 (0.0%) | 0 (0.0%) |
| $5,000 to $9,999 | 8 (0.8%) | 18 (5.2%) |
| $10,000 to $14,999 | 16 (1.6%) | 8 (2.3%) |
| $15,000 to $19,999 | 8 (0.8%) | 59 (17.1%) |
| $20,000 to $24,999 | 49 (4.9%) | 22 (6.4%) |
| $25,000 to $34,999 | 57 (5.7%) | 65 (18.8%) |
| $35,000 to $49,999 | 109 (10.8%) | 23 (6.7%) |
| $50,000 to $74,999 | 181 (18.0%) | 60 (17.4%) |
| $75,000 to $99,999 | 206 (20.5%) | 8 (2.3%) |
| $100,000 to $149,999 | 233 (23.1%) | 55 (15.9%) |
| $150,000 or more | 140 (13.9%) | 27 (7.8%) |
| Total | 1,007 (100.0%) | 345 (100.0%) |
Monthly Housing Cost Tiers in Bluffton
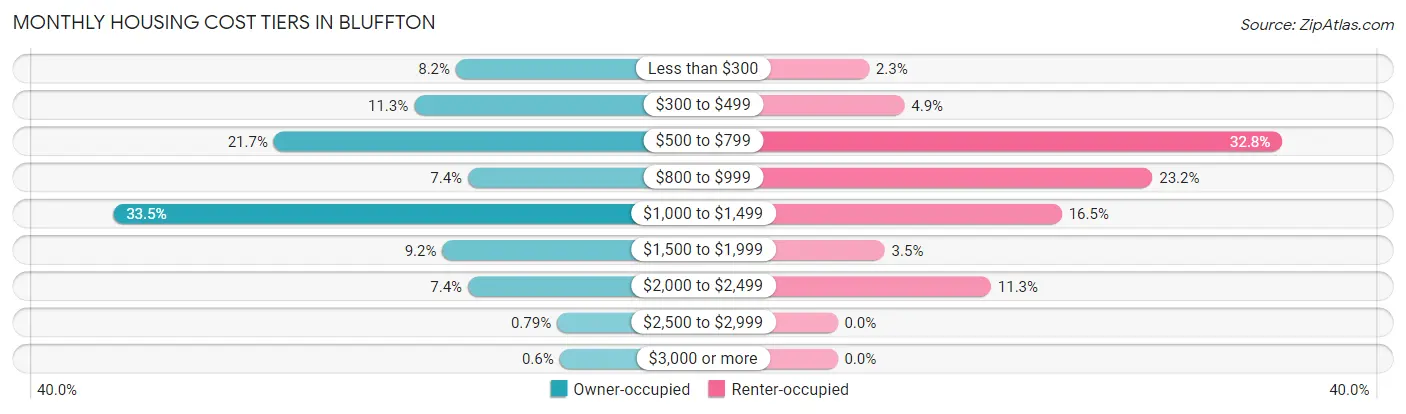
| Monthly Cost | Owner-occupied | Renter-occupied |
| Less than $300 | 83 (8.2%) | 8 (2.3%) |
| $300 to $499 | 114 (11.3%) | 17 (4.9%) |
| $500 to $799 | 218 (21.6%) | 113 (32.8%) |
| $800 to $999 | 74 (7.3%) | 80 (23.2%) |
| $1,000 to $1,499 | 337 (33.5%) | 57 (16.5%) |
| $1,500 to $1,999 | 93 (9.2%) | 12 (3.5%) |
| $2,000 to $2,499 | 74 (7.3%) | 39 (11.3%) |
| $2,500 to $2,999 | 8 (0.8%) | 0 (0.0%) |
| $3,000 or more | 6 (0.6%) | 0 (0.0%) |
| Total | 1,007 (100.0%) | 345 (100.0%) |
Physical Housing Characteristics in Bluffton
Housing Structures in Bluffton
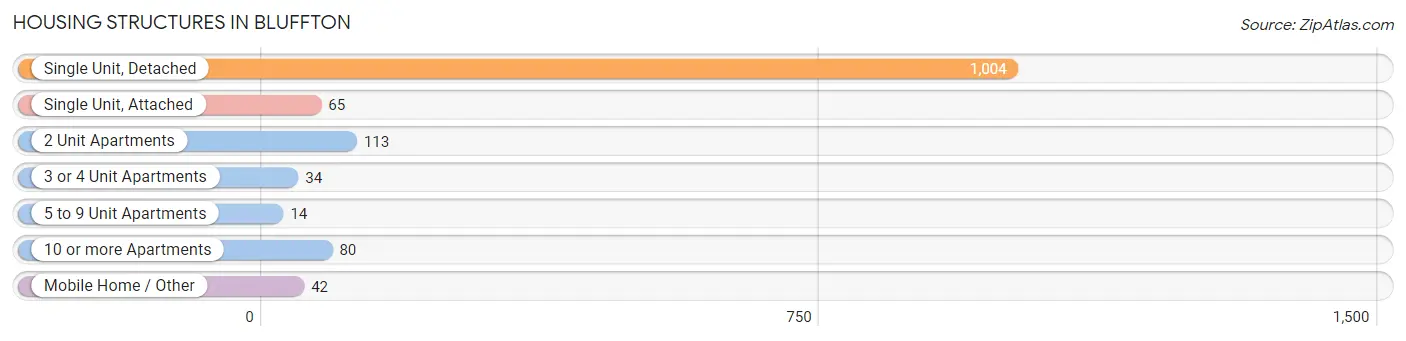
| Structure Type | # Housing Units | % Housing Units |
| Single Unit, Detached | 1,004 | 74.3% |
| Single Unit, Attached | 65 | 4.8% |
| 2 Unit Apartments | 113 | 8.4% |
| 3 or 4 Unit Apartments | 34 | 2.5% |
| 5 to 9 Unit Apartments | 14 | 1.0% |
| 10 or more Apartments | 80 | 5.9% |
| Mobile Home / Other | 42 | 3.1% |
| Total | 1,352 | 100.0% |
Housing Structures by Occupancy in Bluffton
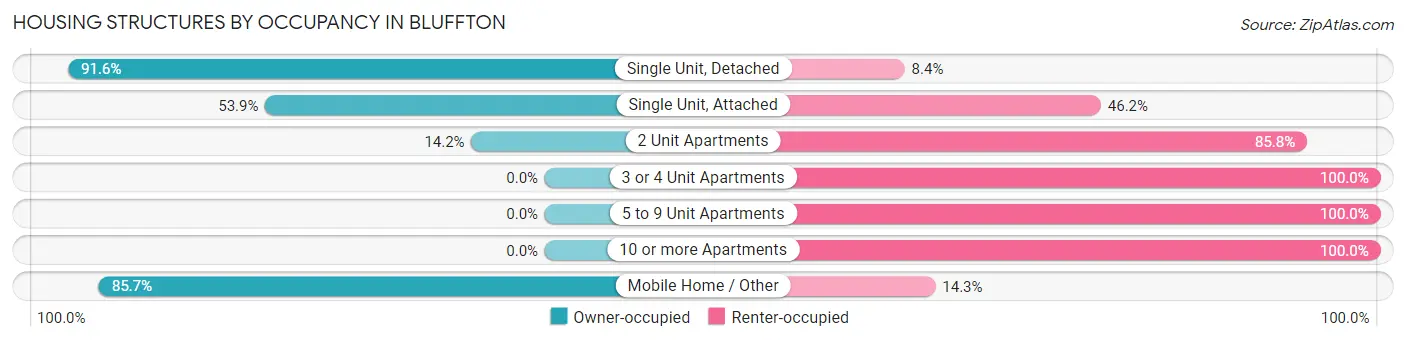
| Structure Type | Owner-occupied | Renter-occupied |
| Single Unit, Detached | 920 (91.6%) | 84 (8.4%) |
| Single Unit, Attached | 35 (53.8%) | 30 (46.2%) |
| 2 Unit Apartments | 16 (14.2%) | 97 (85.8%) |
| 3 or 4 Unit Apartments | 0 (0.0%) | 34 (100.0%) |
| 5 to 9 Unit Apartments | 0 (0.0%) | 14 (100.0%) |
| 10 or more Apartments | 0 (0.0%) | 80 (100.0%) |
| Mobile Home / Other | 36 (85.7%) | 6 (14.3%) |
| Total | 1,007 (74.5%) | 345 (25.5%) |
Housing Structures by Number of Rooms in Bluffton
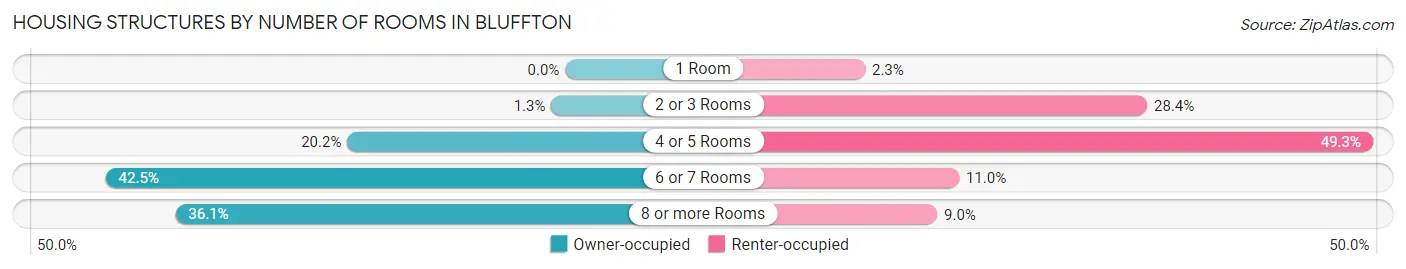
| Number of Rooms | Owner-occupied | Renter-occupied |
| 1 Room | 0 (0.0%) | 8 (2.3%) |
| 2 or 3 Rooms | 13 (1.3%) | 98 (28.4%) |
| 4 or 5 Rooms | 203 (20.2%) | 170 (49.3%) |
| 6 or 7 Rooms | 428 (42.5%) | 38 (11.0%) |
| 8 or more Rooms | 363 (36.0%) | 31 (9.0%) |
| Total | 1,007 (100.0%) | 345 (100.0%) |
Housing Structure by Heating Type in Bluffton
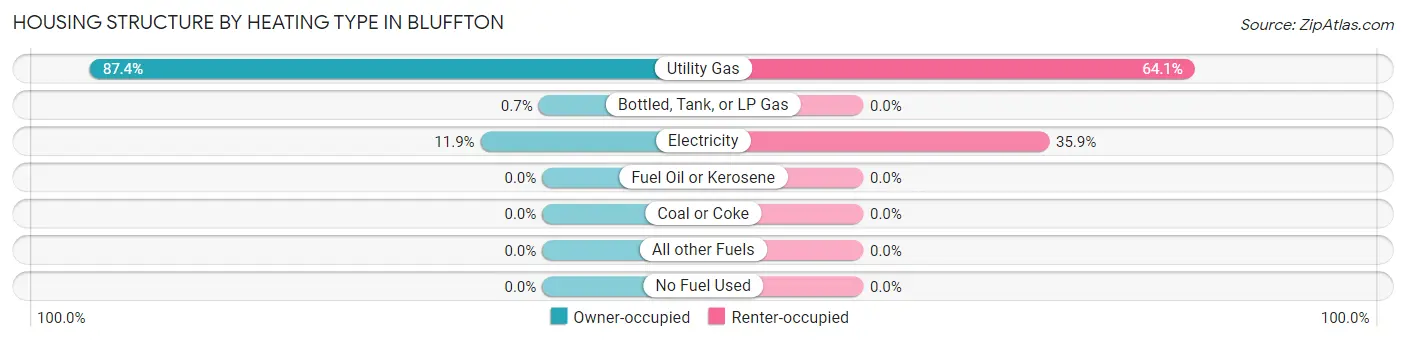
| Heating Type | Owner-occupied | Renter-occupied |
| Utility Gas | 880 (87.4%) | 221 (64.1%) |
| Bottled, Tank, or LP Gas | 7 (0.7%) | 0 (0.0%) |
| Electricity | 120 (11.9%) | 124 (35.9%) |
| Fuel Oil or Kerosene | 0 (0.0%) | 0 (0.0%) |
| Coal or Coke | 0 (0.0%) | 0 (0.0%) |
| All other Fuels | 0 (0.0%) | 0 (0.0%) |
| No Fuel Used | 0 (0.0%) | 0 (0.0%) |
| Total | 1,007 (100.0%) | 345 (100.0%) |
Household Vehicle Usage in Bluffton
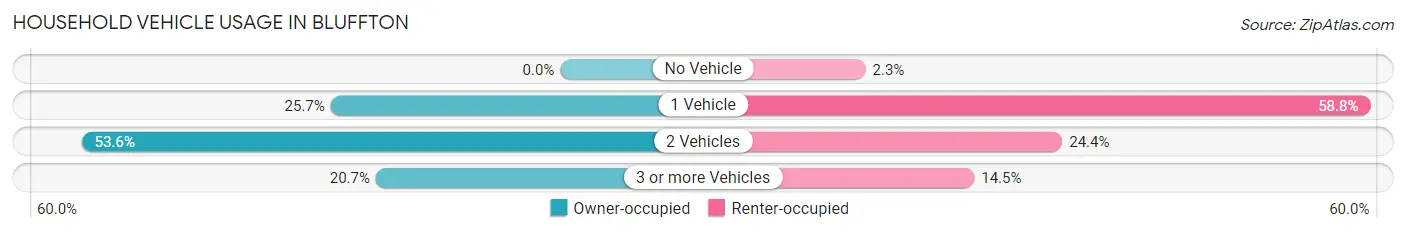
| Vehicles per Household | Owner-occupied | Renter-occupied |
| No Vehicle | 0 (0.0%) | 8 (2.3%) |
| 1 Vehicle | 259 (25.7%) | 203 (58.8%) |
| 2 Vehicles | 540 (53.6%) | 84 (24.3%) |
| 3 or more Vehicles | 208 (20.7%) | 50 (14.5%) |
| Total | 1,007 (100.0%) | 345 (100.0%) |
Real Estate & Mortgages in Bluffton
Real Estate and Mortgage Overview in Bluffton
| Characteristic | Without Mortgage | With Mortgage |
| Housing Units | 424 | 583 |
| Median Property Value | $171,700 | $194,200 |
| Median Household Income | $54,444 | $92 |
| Monthly Housing Costs | $513 | $6 |
| Real Estate Taxes | $1,750 | $0 |
Property Value by Mortgage Status in Bluffton
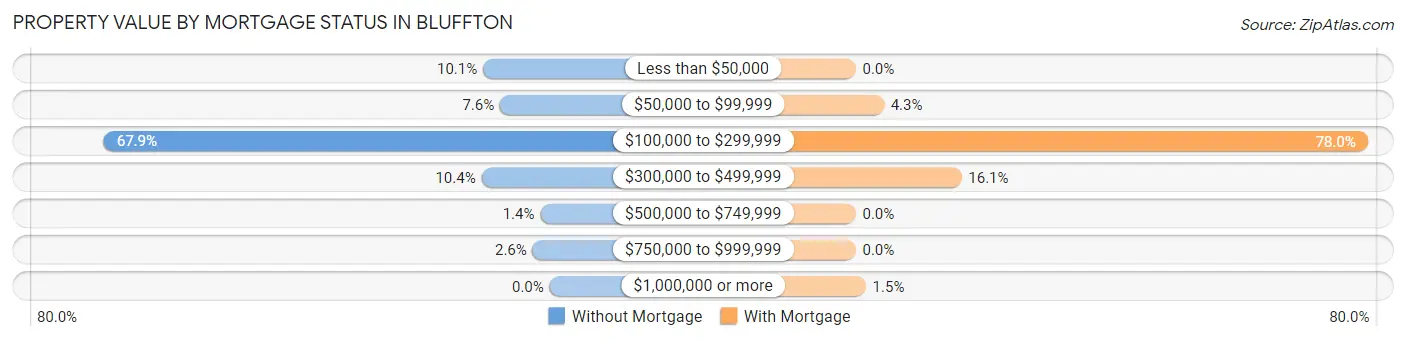
| Property Value | Without Mortgage | With Mortgage |
| Less than $50,000 | 43 (10.1%) | 0 (0.0%) |
| $50,000 to $99,999 | 32 (7.5%) | 25 (4.3%) |
| $100,000 to $299,999 | 288 (67.9%) | 455 (78.0%) |
| $300,000 to $499,999 | 44 (10.4%) | 94 (16.1%) |
| $500,000 to $749,999 | 6 (1.4%) | 0 (0.0%) |
| $750,000 to $999,999 | 11 (2.6%) | 0 (0.0%) |
| $1,000,000 or more | 0 (0.0%) | 9 (1.5%) |
| Total | 424 (100.0%) | 583 (100.0%) |
Household Income by Mortgage Status in Bluffton
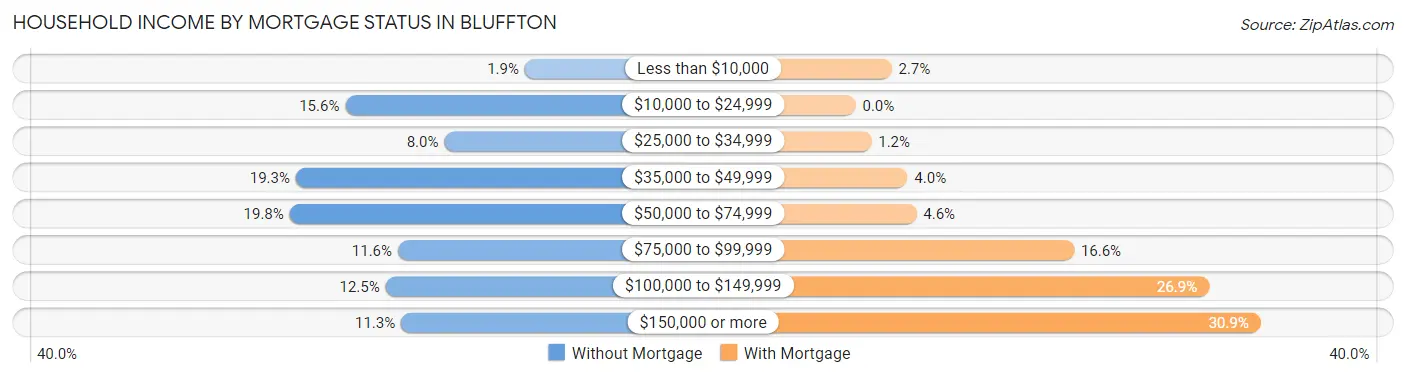
| Household Income | Without Mortgage | With Mortgage |
| Less than $10,000 | 8 (1.9%) | 16 (2.7%) |
| $10,000 to $24,999 | 66 (15.6%) | 0 (0.0%) |
| $25,000 to $34,999 | 34 (8.0%) | 7 (1.2%) |
| $35,000 to $49,999 | 82 (19.3%) | 23 (4.0%) |
| $50,000 to $74,999 | 84 (19.8%) | 27 (4.6%) |
| $75,000 to $99,999 | 49 (11.6%) | 97 (16.6%) |
| $100,000 to $149,999 | 53 (12.5%) | 157 (26.9%) |
| $150,000 or more | 48 (11.3%) | 180 (30.9%) |
| Total | 424 (100.0%) | 583 (100.0%) |
Property Value to Household Income Ratio in Bluffton
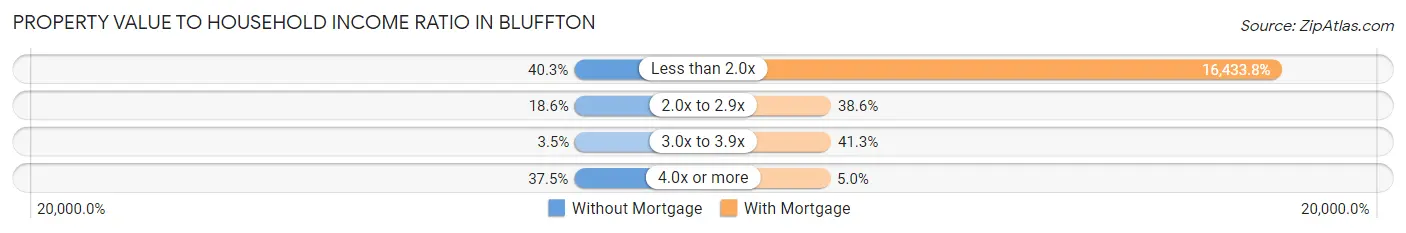
| Value-to-Income Ratio | Without Mortgage | With Mortgage |
| Less than 2.0x | 171 (40.3%) | 95,809 (16,433.8%) |
| 2.0x to 2.9x | 79 (18.6%) | 225 (38.6%) |
| 3.0x to 3.9x | 15 (3.5%) | 241 (41.3%) |
| 4.0x or more | 159 (37.5%) | 29 (5.0%) |
| Total | 424 (100.0%) | 583 (100.0%) |
Real Estate Taxes by Mortgage Status in Bluffton
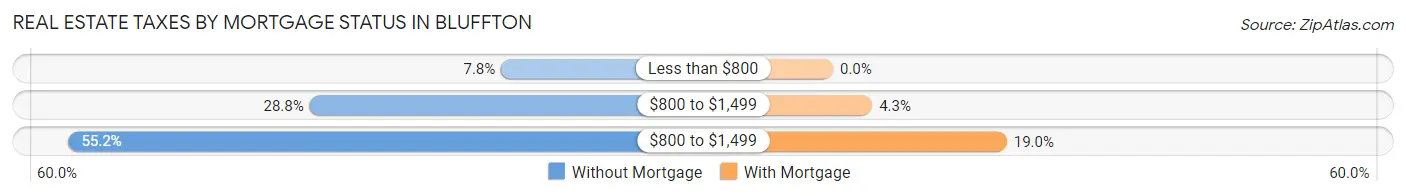
| Property Taxes | Without Mortgage | With Mortgage |
| Less than $800 | 33 (7.8%) | 0 (0.0%) |
| $800 to $1,499 | 122 (28.8%) | 25 (4.3%) |
| $800 to $1,499 | 234 (55.2%) | 111 (19.0%) |
| Total | 424 (100.0%) | 583 (100.0%) |
Health & Disability in Bluffton
Health Insurance Coverage by Age in Bluffton
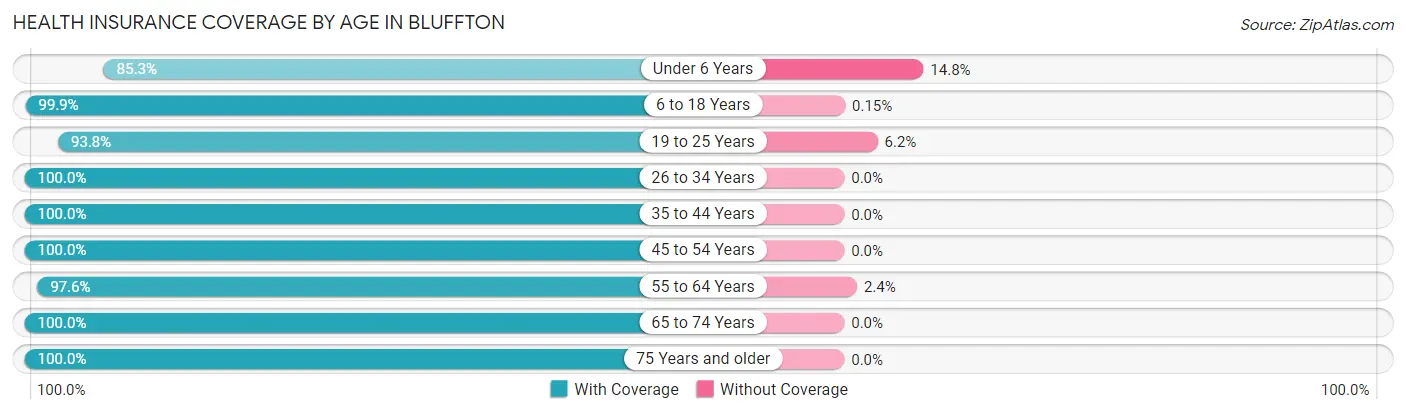
| Age Bracket | With Coverage | Without Coverage |
| Under 6 Years | 237 (85.3%) | 41 (14.7%) |
| 6 to 18 Years | 684 (99.9%) | 1 (0.2%) |
| 19 to 25 Years | 408 (93.8%) | 27 (6.2%) |
| 26 to 34 Years | 360 (100.0%) | 0 (0.0%) |
| 35 to 44 Years | 352 (100.0%) | 0 (0.0%) |
| 45 to 54 Years | 354 (100.0%) | 0 (0.0%) |
| 55 to 64 Years | 290 (97.6%) | 7 (2.4%) |
| 65 to 74 Years | 407 (100.0%) | 0 (0.0%) |
| 75 Years and older | 291 (100.0%) | 0 (0.0%) |
| Total | 3,383 (97.8%) | 76 (2.2%) |
Health Insurance Coverage by Citizenship Status in Bluffton
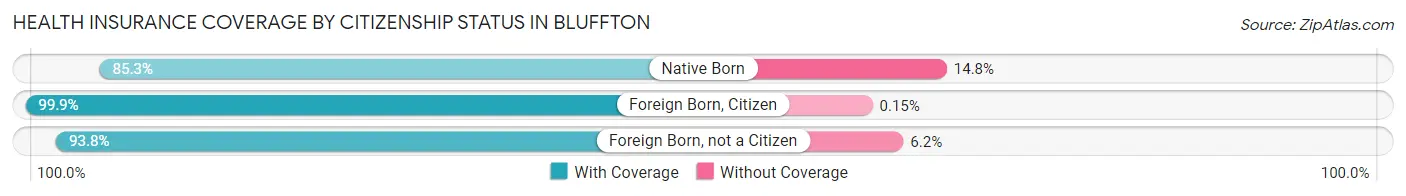
| Citizenship Status | With Coverage | Without Coverage |
| Native Born | 237 (85.3%) | 41 (14.7%) |
| Foreign Born, Citizen | 684 (99.9%) | 1 (0.2%) |
| Foreign Born, not a Citizen | 408 (93.8%) | 27 (6.2%) |
Health Insurance Coverage by Household Income in Bluffton
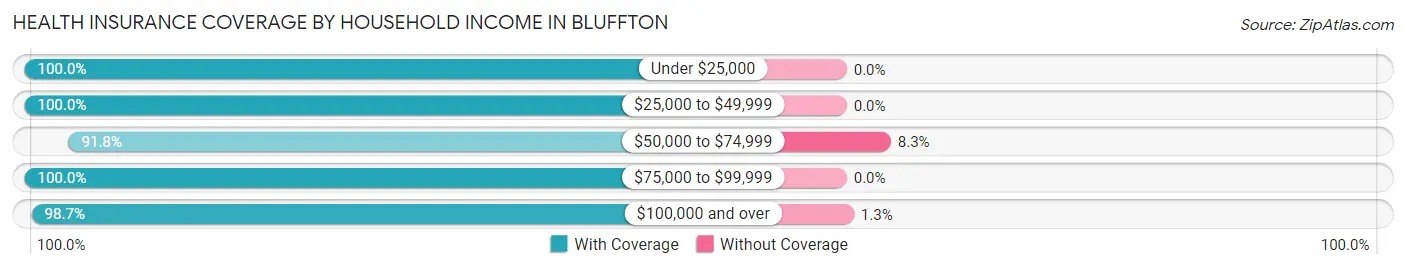
| Household Income | With Coverage | Without Coverage |
| Under $25,000 | 188 (100.0%) | 0 (0.0%) |
| $25,000 to $49,999 | 384 (100.0%) | 0 (0.0%) |
| $50,000 to $74,999 | 534 (91.7%) | 48 (8.3%) |
| $75,000 to $99,999 | 576 (100.0%) | 0 (0.0%) |
| $100,000 and over | 1,487 (98.7%) | 20 (1.3%) |
Public vs Private Health Insurance Coverage by Age in Bluffton
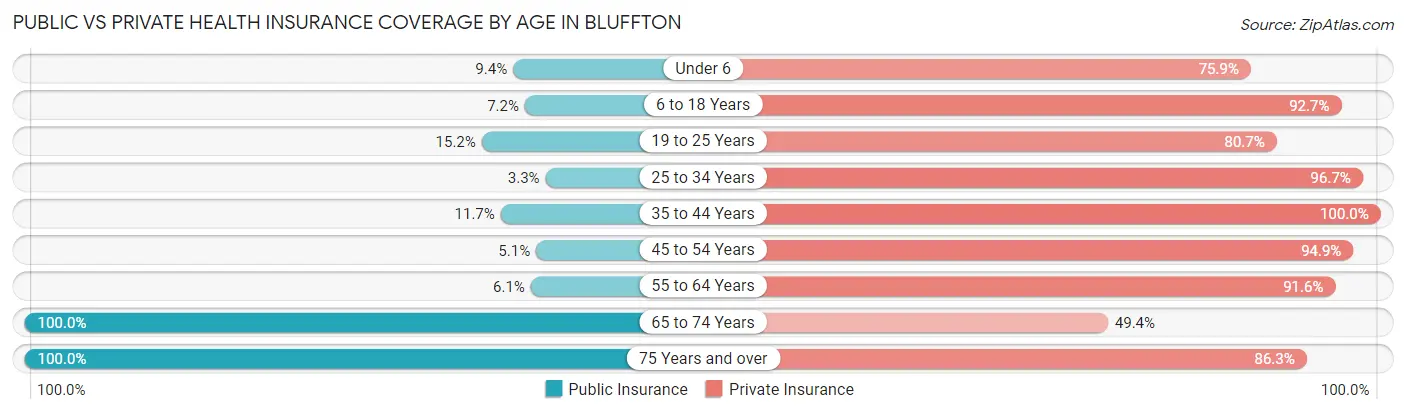
| Age Bracket | Public Insurance | Private Insurance |
| Under 6 | 26 (9.3%) | 211 (75.9%) |
| 6 to 18 Years | 49 (7.1%) | 635 (92.7%) |
| 19 to 25 Years | 66 (15.2%) | 351 (80.7%) |
| 25 to 34 Years | 12 (3.3%) | 348 (96.7%) |
| 35 to 44 Years | 41 (11.7%) | 352 (100.0%) |
| 45 to 54 Years | 18 (5.1%) | 336 (94.9%) |
| 55 to 64 Years | 18 (6.1%) | 272 (91.6%) |
| 65 to 74 Years | 407 (100.0%) | 201 (49.4%) |
| 75 Years and over | 291 (100.0%) | 251 (86.3%) |
| Total | 928 (26.8%) | 2,957 (85.5%) |
Disability Status by Sex by Age in Bluffton
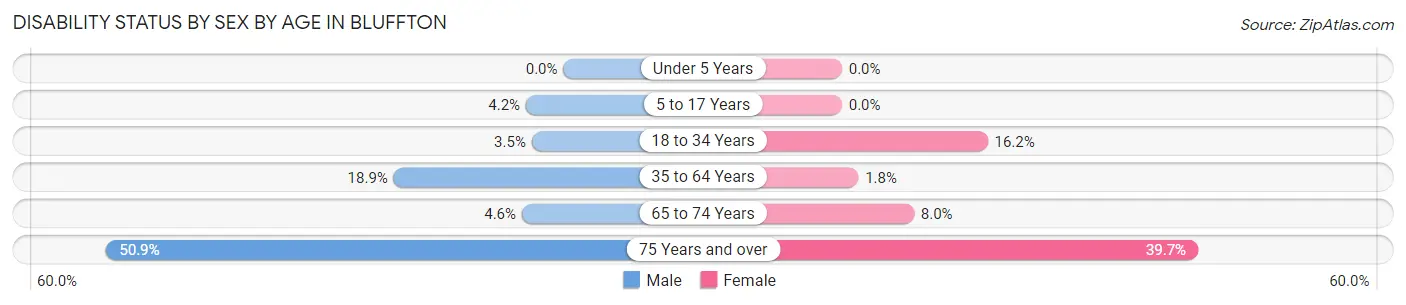
| Age Bracket | Male | Female |
| Under 5 Years | 0 (0.0%) | 0 (0.0%) |
| 5 to 17 Years | 10 (4.2%) | 0 (0.0%) |
| 18 to 34 Years | 14 (3.5%) | 74 (16.2%) |
| 35 to 64 Years | 107 (18.9%) | 8 (1.8%) |
| 65 to 74 Years | 9 (4.6%) | 17 (8.0%) |
| 75 Years and over | 57 (50.9%) | 71 (39.7%) |
Disability Class by Sex by Age in Bluffton
Disability Class: Hearing Difficulty
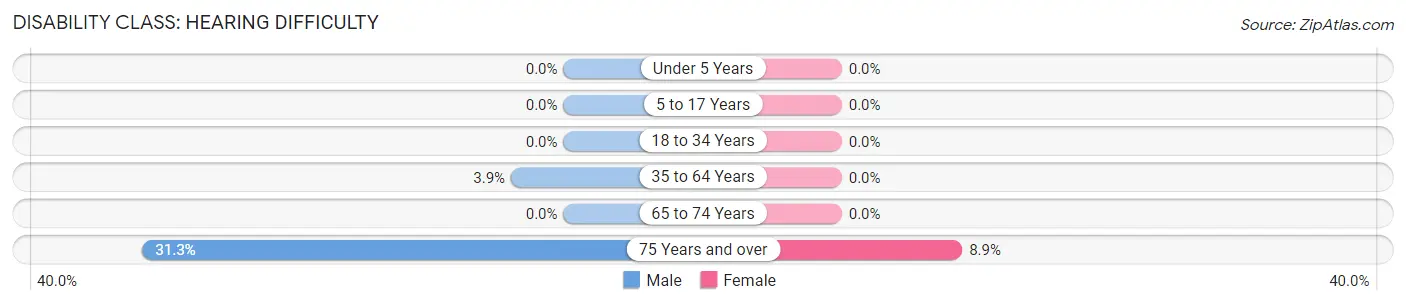
| Age Bracket | Male | Female |
| Under 5 Years | 0 (0.0%) | 0 (0.0%) |
| 5 to 17 Years | 0 (0.0%) | 0 (0.0%) |
| 18 to 34 Years | 0 (0.0%) | 0 (0.0%) |
| 35 to 64 Years | 22 (3.9%) | 0 (0.0%) |
| 65 to 74 Years | 0 (0.0%) | 0 (0.0%) |
| 75 Years and over | 35 (31.2%) | 16 (8.9%) |
Disability Class: Vision Difficulty
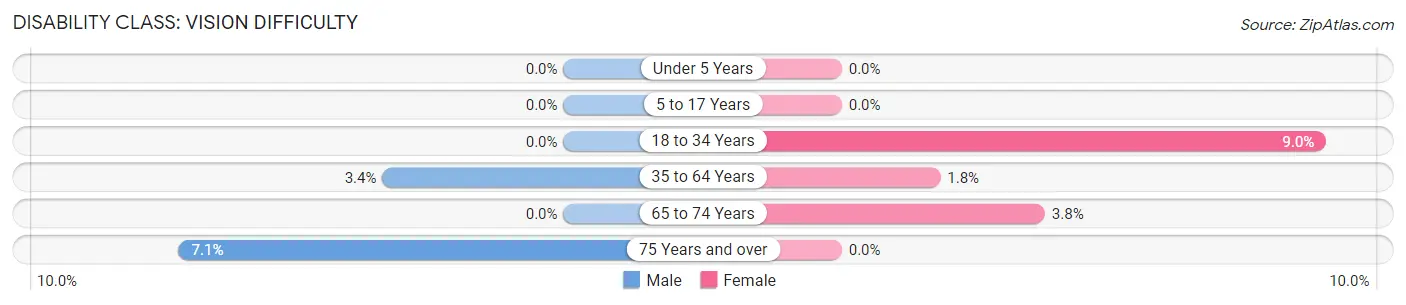
| Age Bracket | Male | Female |
| Under 5 Years | 0 (0.0%) | 0 (0.0%) |
| 5 to 17 Years | 0 (0.0%) | 0 (0.0%) |
| 18 to 34 Years | 0 (0.0%) | 41 (9.0%) |
| 35 to 64 Years | 19 (3.4%) | 8 (1.8%) |
| 65 to 74 Years | 0 (0.0%) | 8 (3.8%) |
| 75 Years and over | 8 (7.1%) | 0 (0.0%) |
Disability Class: Cognitive Difficulty
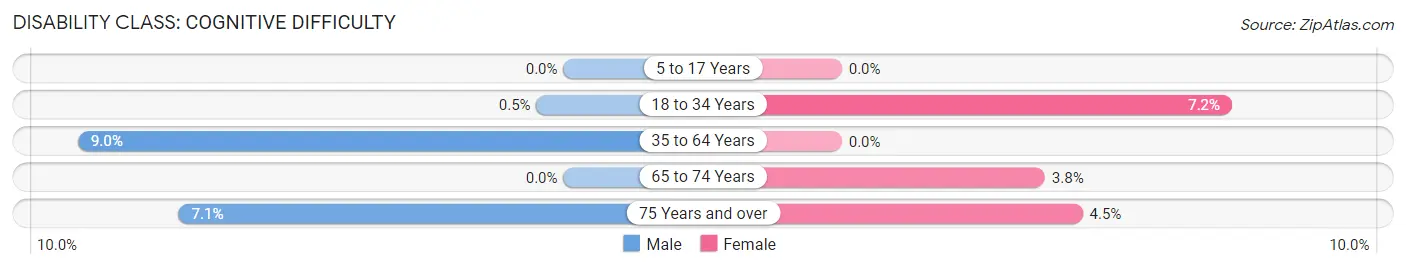
| Age Bracket | Male | Female |
| 5 to 17 Years | 0 (0.0%) | 0 (0.0%) |
| 18 to 34 Years | 2 (0.5%) | 33 (7.2%) |
| 35 to 64 Years | 51 (9.0%) | 0 (0.0%) |
| 65 to 74 Years | 0 (0.0%) | 8 (3.8%) |
| 75 Years and over | 8 (7.1%) | 8 (4.5%) |
Disability Class: Ambulatory Difficulty
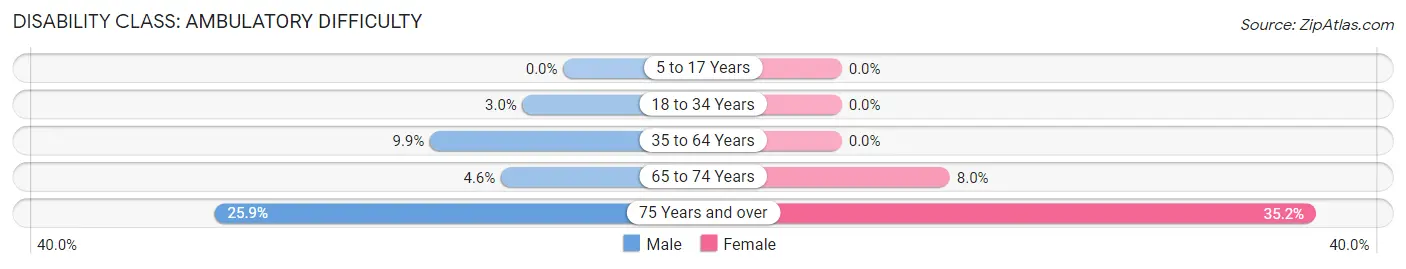
| Age Bracket | Male | Female |
| 5 to 17 Years | 0 (0.0%) | 0 (0.0%) |
| 18 to 34 Years | 12 (3.0%) | 0 (0.0%) |
| 35 to 64 Years | 56 (9.9%) | 0 (0.0%) |
| 65 to 74 Years | 9 (4.6%) | 17 (8.0%) |
| 75 Years and over | 29 (25.9%) | 63 (35.2%) |
Disability Class: Self-Care Difficulty
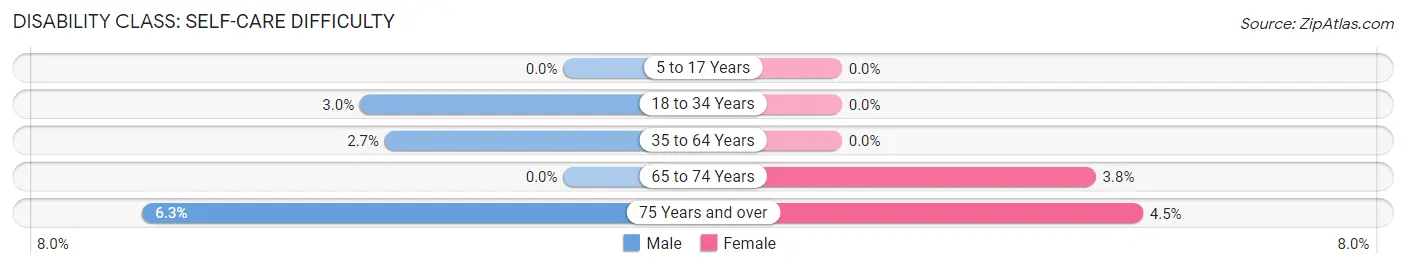
| Age Bracket | Male | Female |
| 5 to 17 Years | 0 (0.0%) | 0 (0.0%) |
| 18 to 34 Years | 12 (3.0%) | 0 (0.0%) |
| 35 to 64 Years | 15 (2.6%) | 0 (0.0%) |
| 65 to 74 Years | 0 (0.0%) | 8 (3.8%) |
| 75 Years and over | 7 (6.2%) | 8 (4.5%) |
Technology Access in Bluffton
Computing Device Access in Bluffton
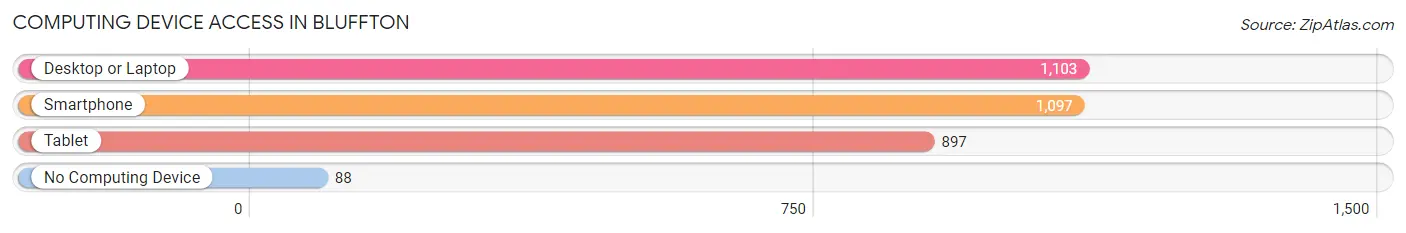
| Device Type | # Households | % Households |
| Desktop or Laptop | 1,103 | 81.6% |
| Smartphone | 1,097 | 81.1% |
| Tablet | 897 | 66.3% |
| No Computing Device | 88 | 6.5% |
| Total | 1,352 | 100.0% |
Internet Access in Bluffton
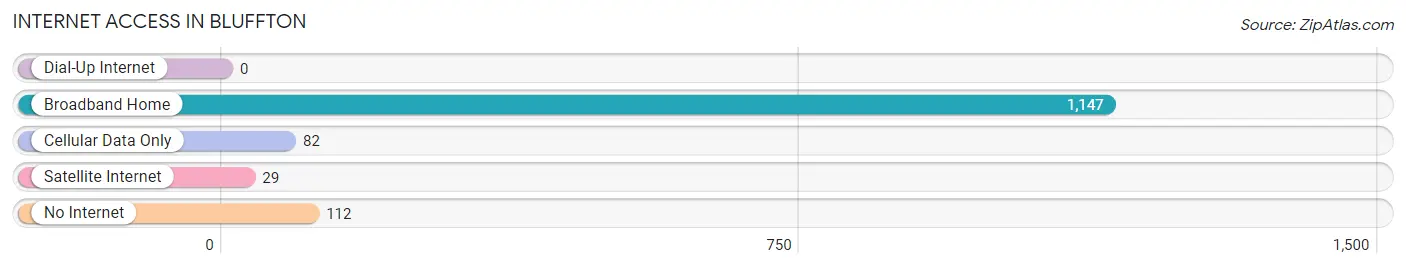
| Internet Type | # Households | % Households |
| Dial-Up Internet | 0 | 0.0% |
| Broadband Home | 1,147 | 84.8% |
| Cellular Data Only | 82 | 6.1% |
| Satellite Internet | 29 | 2.1% |
| No Internet | 112 | 8.3% |
| Total | 1,352 | 100.0% |
Bluffton Summary
Bluffton, Ohio is a small town located in Allen County, Ohio. It is situated on the banks of the Auglaize River, about 25 miles south of Lima. The town was founded in 1838 and has a population of around 4,000 people.
History
Bluffton was founded in 1838 by a group of settlers from Pennsylvania. The town was named after the bluffs along the Auglaize River. The settlers were attracted to the area due to its fertile soil and abundant natural resources. The town quickly grew and by 1845, it had a population of over 500 people.
In the late 19th century, Bluffton was a thriving agricultural community. The town was home to several mills, including a flour mill, a sawmill, and a gristmill. The town also had a number of stores, churches, and a post office.
In the early 20th century, Bluffton experienced a period of growth and prosperity. The town was home to several factories, including a furniture factory, a canning factory, and a brickyard. The town also had a number of banks, hotels, and other businesses.
Geography
Bluffton is located in Allen County, Ohio. It is situated on the banks of the Auglaize River, about 25 miles south of Lima. The town is surrounded by rolling hills and farmland. The town is located in the Great Black Swamp region of Ohio, which is known for its wetlands and wildlife.
The climate in Bluffton is humid continental, with hot summers and cold winters. The average annual temperature is around 50 degrees Fahrenheit. The average annual precipitation is around 40 inches.
Economy
Bluffton’s economy is largely based on agriculture. The town is home to several farms, which produce corn, soybeans, wheat, and other crops. The town also has a number of businesses, including restaurants, retail stores, and service providers.
The town is also home to several manufacturing companies, including a furniture factory, a canning factory, and a brickyard. The town also has a number of banks, hotels, and other businesses.
Demographics
As of the 2010 census, Bluffton had a population of 4,000 people. The racial makeup of the town was 97.2% White, 0.7% African American, 0.2% Native American, 0.2% Asian, 0.2% from other races, and 1.7% from two or more races. Hispanic or Latino of any race were 0.7% of the population.
The median income for a household in Bluffton was $41,250, and the median income for a family was $50,000. The per capita income for the town was $20,000. About 10.2% of families and 12.2% of the population were below the poverty line, including 16.2% of those under age 18 and 8.2% of those age 65 or over.
Common Questions
What is Per Capita Income in Bluffton?
Per Capita income in Bluffton is $35,929.
What is the Median Family Income in Bluffton?
Median Family Income in Bluffton is $91,029.
What is the Median Household income in Bluffton?
Median Household Income in Bluffton is $74,620.
What is Income or Wage Gap in Bluffton?
Income or Wage Gap in Bluffton is 38.2%.
Women in Bluffton earn 61.8 cents for every dollar earned by a man.
What is Inequality or Gini Index in Bluffton?
Inequality or Gini Index in Bluffton is 0.42.
What is the Total Population of Bluffton?
Total Population of Bluffton is 3,540.
What is the Total Male Population of Bluffton?
Total Male Population of Bluffton is 1,631.
What is the Total Female Population of Bluffton?
Total Female Population of Bluffton is 1,909.
What is the Ratio of Males per 100 Females in Bluffton?
There are 85.44 Males per 100 Females in Bluffton.
What is the Ratio of Females per 100 Males in Bluffton?
There are 117.04 Females per 100 Males in Bluffton.
What is the Median Population Age in Bluffton?
Median Population Age in Bluffton is 35.5 Years.
What is the Average Family Size in Bluffton
Average Family Size in Bluffton is 3.1 People.
What is the Average Household Size in Bluffton
Average Household Size in Bluffton is 2.4 People.
How Large is the Labor Force in Bluffton?
There are 1,636 People in the Labor Forcein in Bluffton.
What is the Percentage of People in the Labor Force in Bluffton?
60.4% of People are in the Labor Force in Bluffton.
What is the Unemployment Rate in Bluffton?
Unemployment Rate in Bluffton is 5.7%.