Mitiwanga, OH Map & Demographics
Mitiwanga Map
Mitiwanga Overview
$57,660
PER CAPITA INCOME
$73,777
AVG FAMILY INCOME
$73,626
AVG HOUSEHOLD INCOME
25.3%
WAGE / INCOME GAP [ % ]
74.7¢/ $1
WAGE / INCOME GAP [ $ ]
0.25
INEQUALITY / GINI INDEX
249
TOTAL POPULATION
82
MALE POPULATION
167
FEMALE POPULATION
49.10
MALES / 100 FEMALES
203.66
FEMALES / 100 MALES
57.9
MEDIAN AGE
1.4
AVG FAMILY SIZE
1.3
AVG HOUSEHOLD SIZE
180
LABOR FORCE [ PEOPLE ]
72.3%
PERCENT IN LABOR FORCE
Income in Mitiwanga
Income Overview in Mitiwanga
Per Capita Income in Mitiwanga is $57,660, while median incomes of families and households are $73,777 and $73,626 respectively.
| Characteristic | Number | Measure |
| Per Capita Income | 249 | $57,660 |
| Median Family Income | 141 | $73,777 |
| Mean Family Income | 141 | $80,152 |
| Median Household Income | 194 | $73,626 |
| Mean Household Income | 194 | $80,696 |
| Income Deficit | 141 | $0 |
| Wage / Income Gap (%) | 249 | 25.27% |
| Wage / Income Gap ($) | 249 | 74.73¢ per $1 |
| Gini / Inequality Index | 249 | 0.25 |
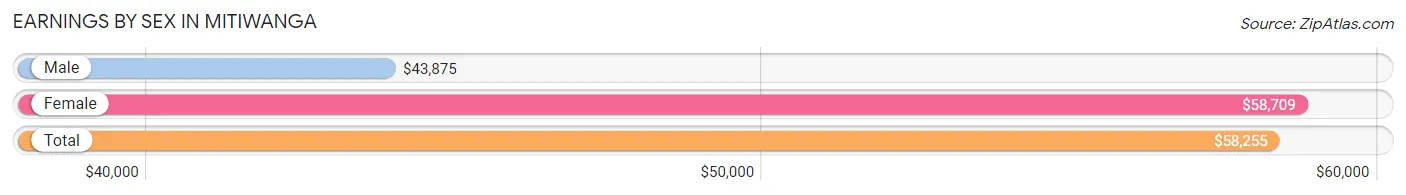
Earnings by Sex in Mitiwanga
Average Earnings in Mitiwanga are $58,255, $43,875 for men and $58,709 for women, a difference of 25.3%.
| Sex | Number | Average Earnings |
| Male | 47 (25.7%) | $43,875 |
| Female | 136 (74.3%) | $58,709 |
| Total | 183 (100.0%) | $58,255 |
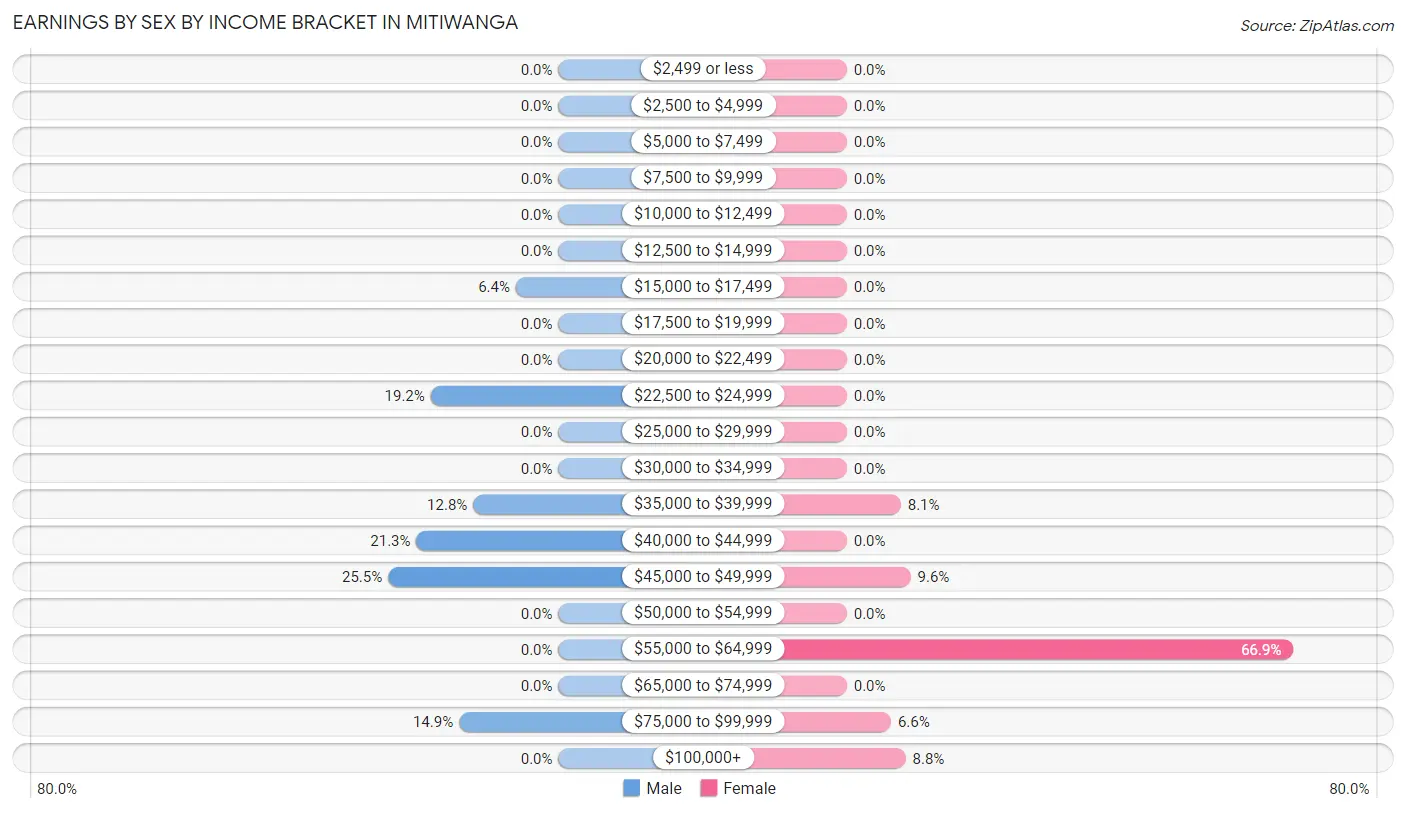
Earnings by Sex by Income Bracket in Mitiwanga
The most common earnings brackets in Mitiwanga are $45,000 to $49,999 for men (12 | 25.5%) and $55,000 to $64,999 for women (91 | 66.9%).
| Income | Male | Female |
| $2,499 or less | 0 (0.0%) | 0 (0.0%) |
| $2,500 to $4,999 | 0 (0.0%) | 0 (0.0%) |
| $5,000 to $7,499 | 0 (0.0%) | 0 (0.0%) |
| $7,500 to $9,999 | 0 (0.0%) | 0 (0.0%) |
| $10,000 to $12,499 | 0 (0.0%) | 0 (0.0%) |
| $12,500 to $14,999 | 0 (0.0%) | 0 (0.0%) |
| $15,000 to $17,499 | 3 (6.4%) | 0 (0.0%) |
| $17,500 to $19,999 | 0 (0.0%) | 0 (0.0%) |
| $20,000 to $22,499 | 0 (0.0%) | 0 (0.0%) |
| $22,500 to $24,999 | 9 (19.2%) | 0 (0.0%) |
| $25,000 to $29,999 | 0 (0.0%) | 0 (0.0%) |
| $30,000 to $34,999 | 0 (0.0%) | 0 (0.0%) |
| $35,000 to $39,999 | 6 (12.8%) | 11 (8.1%) |
| $40,000 to $44,999 | 10 (21.3%) | 0 (0.0%) |
| $45,000 to $49,999 | 12 (25.5%) | 13 (9.6%) |
| $50,000 to $54,999 | 0 (0.0%) | 0 (0.0%) |
| $55,000 to $64,999 | 0 (0.0%) | 91 (66.9%) |
| $65,000 to $74,999 | 0 (0.0%) | 0 (0.0%) |
| $75,000 to $99,999 | 7 (14.9%) | 9 (6.6%) |
| $100,000+ | 0 (0.0%) | 12 (8.8%) |
| Total | 47 (100.0%) | 136 (100.0%) |
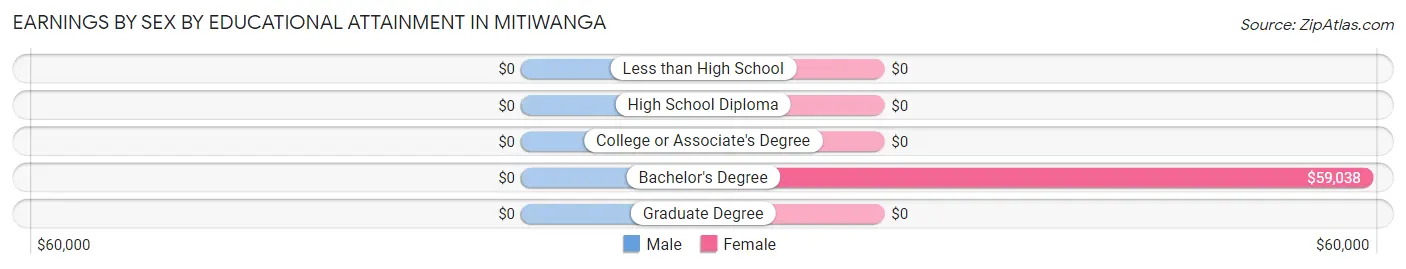
Earnings by Sex by Educational Attainment in Mitiwanga
| Educational Attainment | Male Income | Female Income |
| Less than High School | - | - |
| High School Diploma | - | - |
| College or Associate's Degree | - | - |
| Bachelor's Degree | - | - |
| Graduate Degree | - | - |
| Total | $45,000 | $58,709 |
Family Income in Mitiwanga
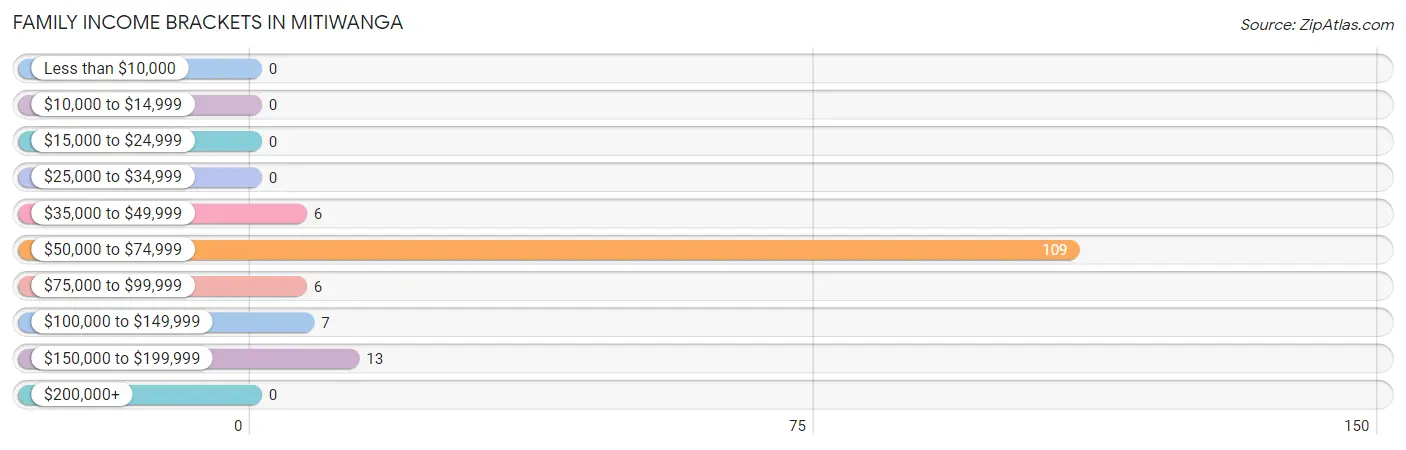
Family Income Brackets in Mitiwanga
According to the Mitiwanga family income data, there are 109 families falling into the $50,000 to $74,999 income range, which is the most common income bracket and makes up 77.3% of all families.
| Income Bracket | # Families | % Families |
| Less than $10,000 | 0 | 0.0% |
| $10,000 to $14,999 | 0 | 0.0% |
| $15,000 to $24,999 | 0 | 0.0% |
| $25,000 to $34,999 | 0 | 0.0% |
| $35,000 to $49,999 | 6 | 4.3% |
| $50,000 to $74,999 | 109 | 77.3% |
| $75,000 to $99,999 | 6 | 4.3% |
| $100,000 to $149,999 | 7 | 5.0% |
| $150,000 to $199,999 | 13 | 9.2% |
| $200,000+ | 0 | 0.0% |
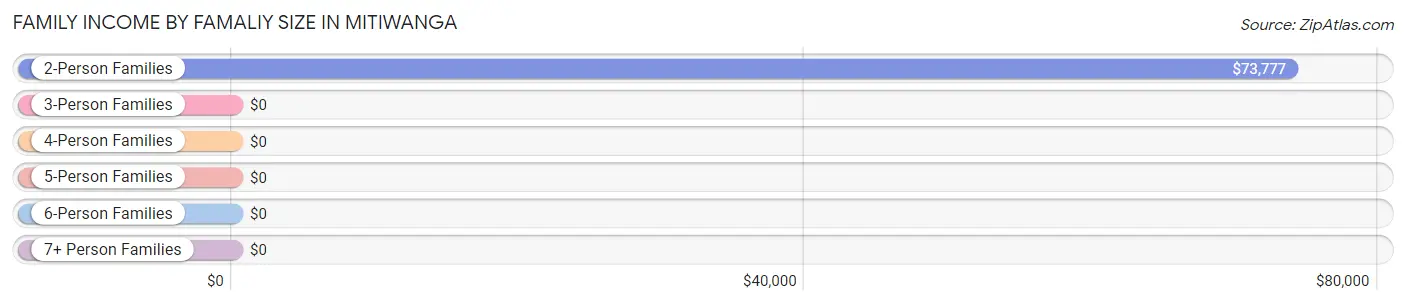
Family Income by Famaliy Size in Mitiwanga
2-person families (141 | 100.0%) account for the highest median family income in Mitiwanga with $73,777 per family, while 2-person families (141 | 100.0%) have the highest median income of $36,888 per family member.
| Income Bracket | # Families | Median Income |
| 2-Person Families | 141 (100.0%) | $73,777 |
| 3-Person Families | 0 (0.0%) | $0 |
| 4-Person Families | 0 (0.0%) | $0 |
| 5-Person Families | 0 (0.0%) | $0 |
| 6-Person Families | 0 (0.0%) | $0 |
| 7+ Person Families | 0 (0.0%) | $0 |
| Total | 141 (100.0%) | $73,777 |
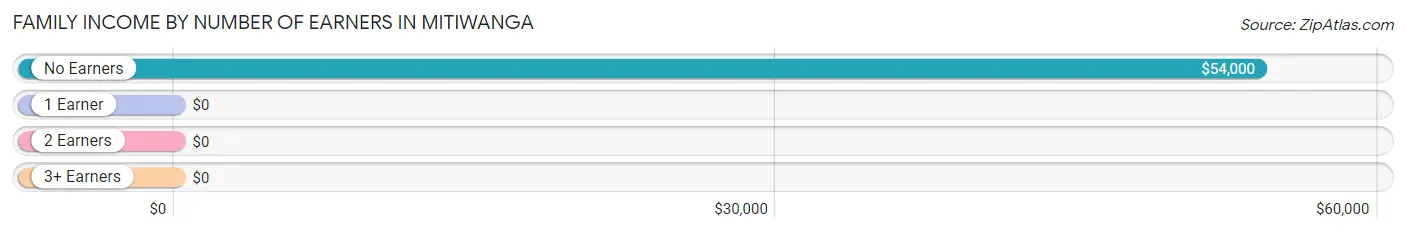
Family Income by Number of Earners in Mitiwanga
| Number of Earners | # Families | Median Income |
| No Earners | 24 (17.0%) | $54,000 |
| 1 Earner | 98 (69.5%) | $0 |
| 2 Earners | 19 (13.5%) | $0 |
| 3+ Earners | 0 (0.0%) | $0 |
| Total | 141 (100.0%) | $73,777 |
Household Income in Mitiwanga
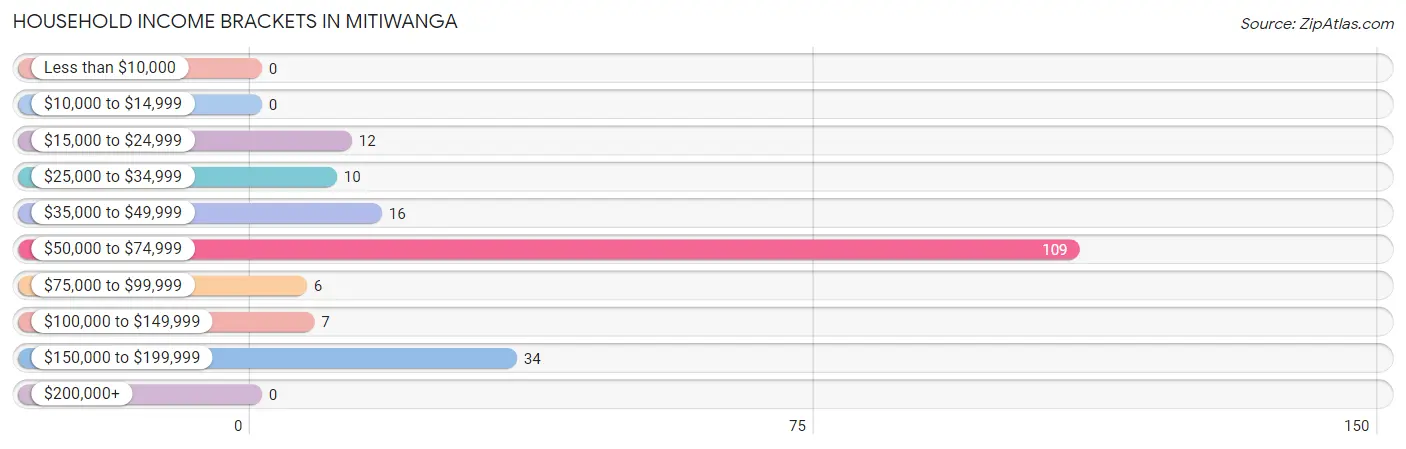
Household Income Brackets in Mitiwanga
With 109 households falling in the category, the $50,000 to $74,999 income range is the most frequent in Mitiwanga, accounting for 56.2% of all households.
| Income Bracket | # Households | % Households |
| Less than $10,000 | 0 | 0.0% |
| $10,000 to $14,999 | 0 | 0.0% |
| $15,000 to $24,999 | 12 | 6.2% |
| $25,000 to $34,999 | 10 | 5.2% |
| $35,000 to $49,999 | 16 | 8.2% |
| $50,000 to $74,999 | 109 | 56.2% |
| $75,000 to $99,999 | 6 | 3.1% |
| $100,000 to $149,999 | 7 | 3.6% |
| $150,000 to $199,999 | 34 | 17.5% |
| $200,000+ | 0 | 0.0% |
Household Income by Householder Age in Mitiwanga
The median household income in Mitiwanga is $73,626, with the highest median household income of $73,874 found in the 45 to 64 years age bracket for the primary householder. A total of 106 households (54.6%) fall into this category. Meanwhile, the 15 to 24 years age bracket for the primary householder has the lowest median household income of $0, with 9 households (4.6%) in this group.
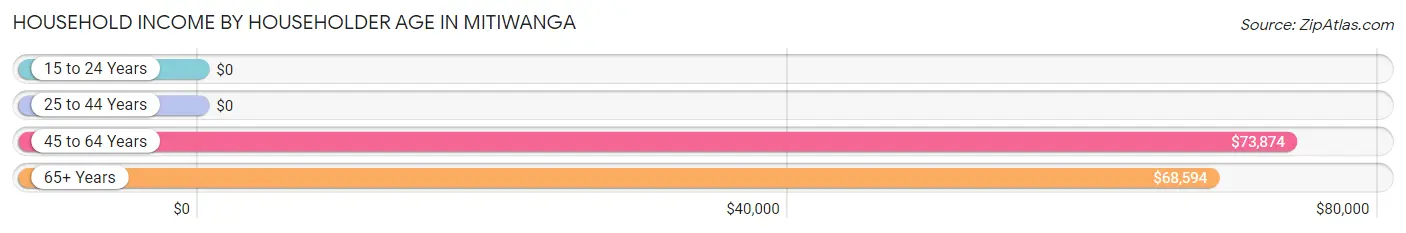
| Income Bracket | # Households | Median Income |
| 15 to 24 Years | 9 (4.6%) | $0 |
| 25 to 44 Years | 0 (0.0%) | $0 |
| 45 to 64 Years | 106 (54.6%) | $73,874 |
| 65+ Years | 79 (40.7%) | $68,594 |
| Total | 194 (100.0%) | $73,626 |
Poverty in Mitiwanga
Income Below Poverty by Sex and Age in Mitiwanga
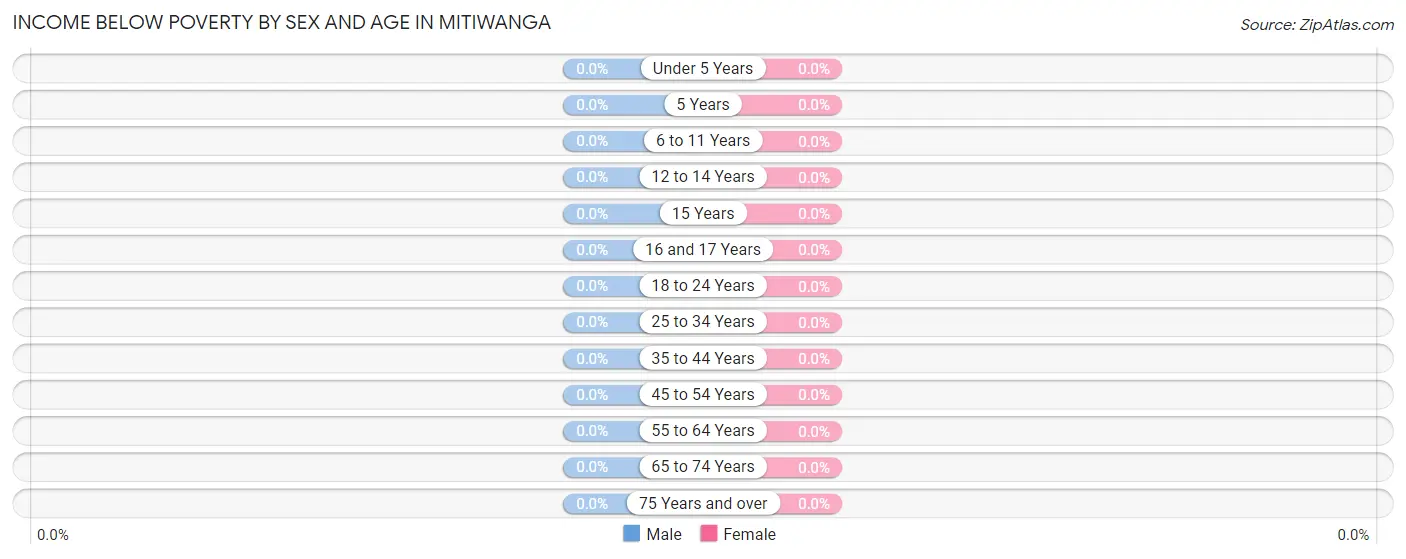
| Age Bracket | Male | Female |
| Under 5 Years | 0 (0.0%) | 0 (0.0%) |
| 5 Years | 0 (0.0%) | 0 (0.0%) |
| 6 to 11 Years | 0 (0.0%) | 0 (0.0%) |
| 12 to 14 Years | 0 (0.0%) | 0 (0.0%) |
| 15 Years | 0 (0.0%) | 0 (0.0%) |
| 16 and 17 Years | 0 (0.0%) | 0 (0.0%) |
| 18 to 24 Years | 0 (0.0%) | 0 (0.0%) |
| 25 to 34 Years | 0 (0.0%) | 0 (0.0%) |
| 35 to 44 Years | 0 (0.0%) | 0 (0.0%) |
| 45 to 54 Years | 0 (0.0%) | 0 (0.0%) |
| 55 to 64 Years | 0 (0.0%) | 0 (0.0%) |
| 65 to 74 Years | 0 (0.0%) | 0 (0.0%) |
| 75 Years and over | 0 (0.0%) | 0 (0.0%) |
| Total | 0 (0.0%) | 0 (0.0%) |
Income Above Poverty by Sex and Age in Mitiwanga
According to the poverty statistics in Mitiwanga, males aged 18 to 24 years and females aged 45 to 54 years are the age groups that are most secure financially, with 100.0% of males and 100.0% of females in these age groups living above the poverty line.
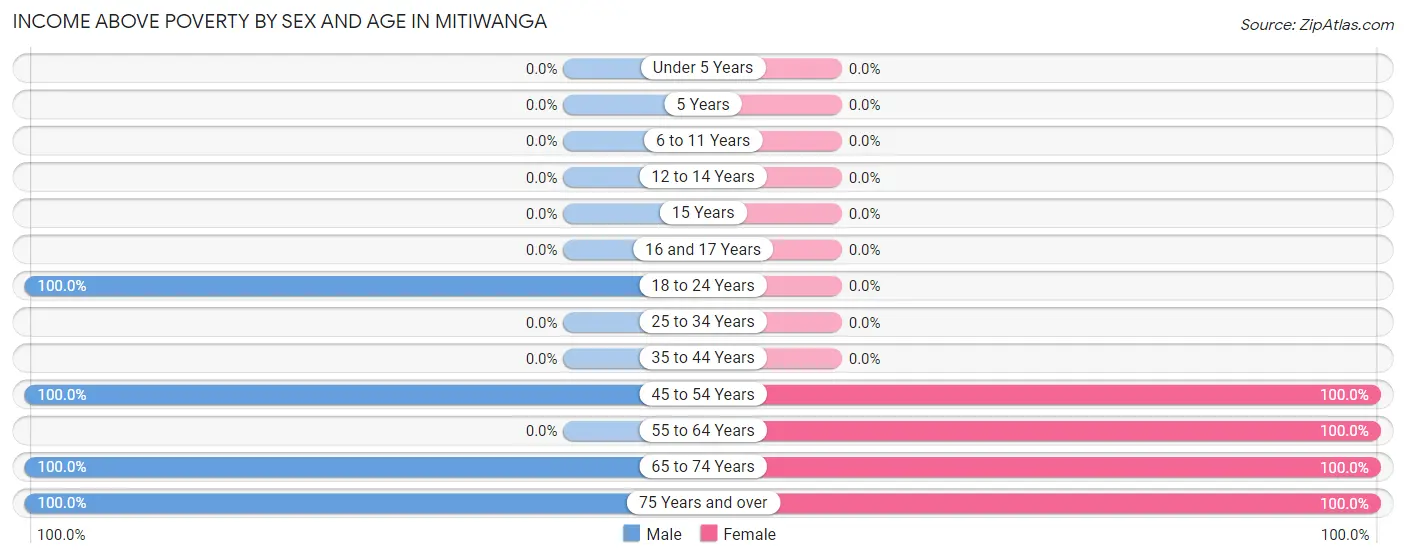
| Age Bracket | Male | Female |
| Under 5 Years | 0 (0.0%) | 0 (0.0%) |
| 5 Years | 0 (0.0%) | 0 (0.0%) |
| 6 to 11 Years | 0 (0.0%) | 0 (0.0%) |
| 12 to 14 Years | 0 (0.0%) | 0 (0.0%) |
| 15 Years | 0 (0.0%) | 0 (0.0%) |
| 16 and 17 Years | 0 (0.0%) | 0 (0.0%) |
| 18 to 24 Years | 9 (100.0%) | 0 (0.0%) |
| 25 to 34 Years | 0 (0.0%) | 0 (0.0%) |
| 35 to 44 Years | 0 (0.0%) | 0 (0.0%) |
| 45 to 54 Years | 3 (100.0%) | 102 (100.0%) |
| 55 to 64 Years | 0 (0.0%) | 12 (100.0%) |
| 65 to 74 Years | 34 (100.0%) | 29 (100.0%) |
| 75 Years and over | 36 (100.0%) | 24 (100.0%) |
| Total | 82 (100.0%) | 167 (100.0%) |
Income Below Poverty Among Married-Couple Families in Mitiwanga
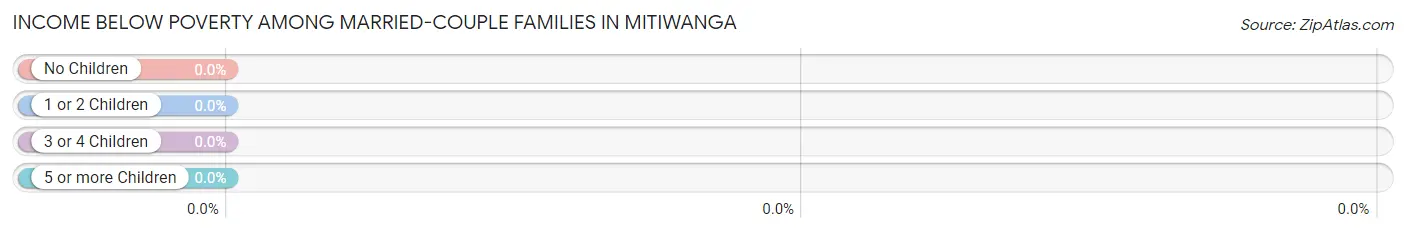
| Children | Above Poverty | Below Poverty |
| No Children | 50 (100.0%) | 0 (0.0%) |
| 1 or 2 Children | 0 (0.0%) | 0 (0.0%) |
| 3 or 4 Children | 0 (0.0%) | 0 (0.0%) |
| 5 or more Children | 0 (0.0%) | 0 (0.0%) |
| Total | 50 (100.0%) | 0 (0.0%) |
Income Below Poverty Among Single-Parent Households in Mitiwanga
| Children | Single Father | Single Mother |
| No Children | 0 (0.0%) | 0 (0.0%) |
| 1 or 2 Children | 0 (0.0%) | 0 (0.0%) |
| 3 or 4 Children | 0 (0.0%) | 0 (0.0%) |
| 5 or more Children | 0 (0.0%) | 0 (0.0%) |
| Total | 0 (0.0%) | 0 (0.0%) |
Income Below Poverty Among Married-Couple vs Single-Parent Households in Mitiwanga
| Children | Married-Couple Families | Single-Parent Households |
| No Children | 0 (0.0%) | 0 (0.0%) |
| 1 or 2 Children | 0 (0.0%) | 0 (0.0%) |
| 3 or 4 Children | 0 (0.0%) | 0 (0.0%) |
| 5 or more Children | 0 (0.0%) | 0 (0.0%) |
| Total | 0 (0.0%) | 0 (0.0%) |
Race in Mitiwanga
The most populous races in Mitiwanga are White / Caucasian (133 | 53.4%), Hispanic or Latino (116 | 46.6%), and Two or more Races (116 | 46.6%).
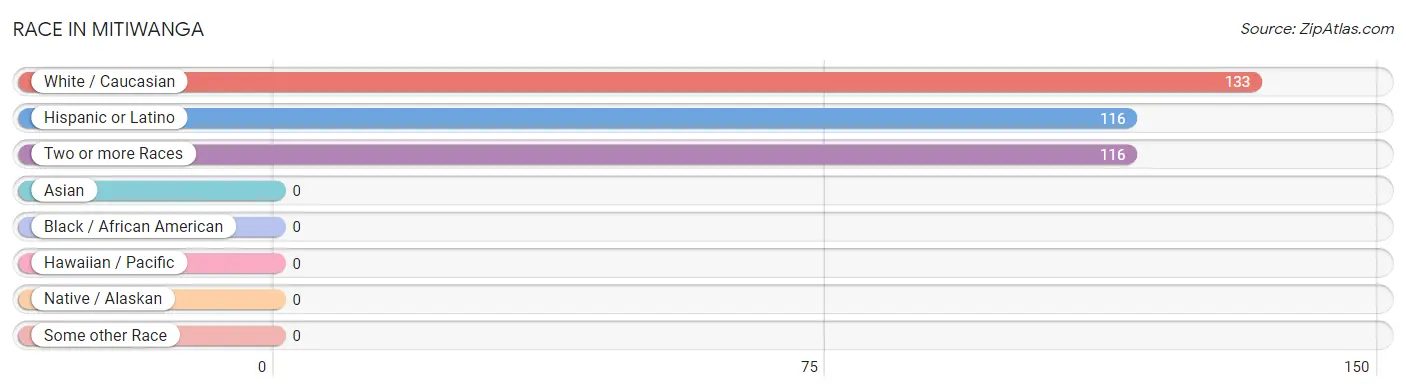
| Race | # Population | % Population |
| Asian | 0 | 0.0% |
| Black / African American | 0 | 0.0% |
| Hawaiian / Pacific | 0 | 0.0% |
| Hispanic or Latino | 116 | 46.6% |
| Native / Alaskan | 0 | 0.0% |
| White / Caucasian | 133 | 53.4% |
| Two or more Races | 116 | 46.6% |
| Some other Race | 0 | 0.0% |
| Total | 249 | 100.0% |
Ancestry in Mitiwanga
The most populous ancestries reported in Mitiwanga are South American (92 | 36.9%), Venezuelan (92 | 36.9%), German (59 | 23.7%), English (35 | 14.1%), and Irish (35 | 14.1%), together accounting for 125.7% of all Mitiwanga residents.
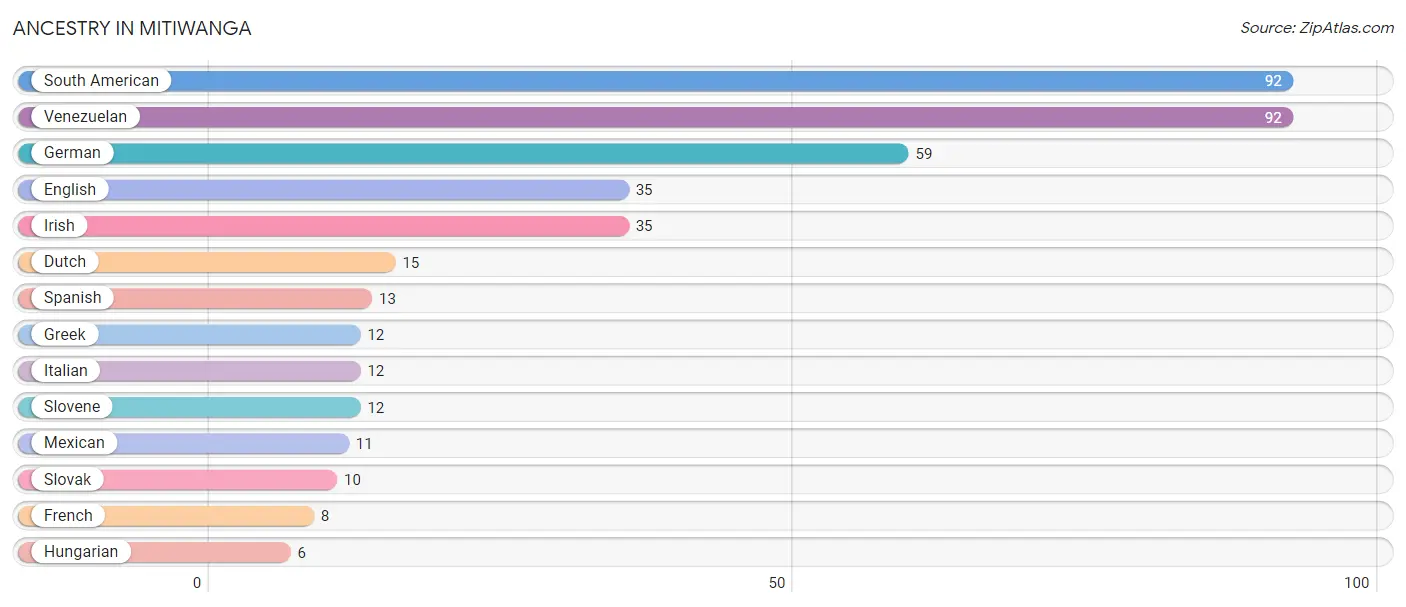
| Ancestry | # Population | % Population |
| Dutch | 15 | 6.0% |
| English | 35 | 14.1% |
| French | 8 | 3.2% |
| German | 59 | 23.7% |
| Greek | 12 | 4.8% |
| Hungarian | 6 | 2.4% |
| Irish | 35 | 14.1% |
| Italian | 12 | 4.8% |
| Mexican | 11 | 4.4% |
| Slovak | 10 | 4.0% |
| Slovene | 12 | 4.8% |
| South American | 92 | 36.9% |
| Spanish | 13 | 5.2% |
| Venezuelan | 92 | 36.9% | View All 14 Rows |
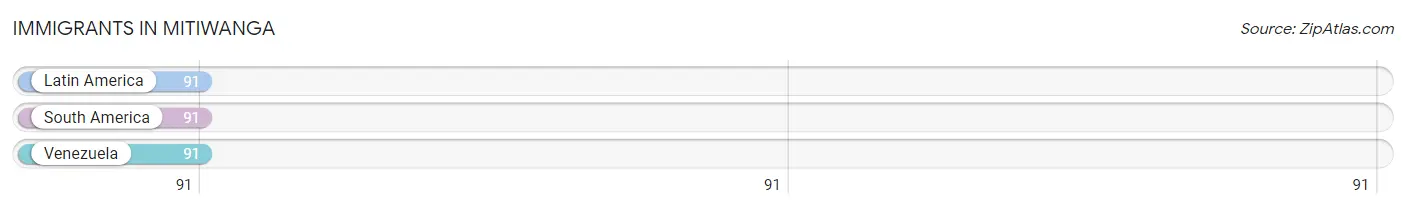
Immigrants in Mitiwanga
The most numerous immigrant groups reported in Mitiwanga came from Latin America (91 | 36.5%), South America (91 | 36.5%), and Venezuela (91 | 36.5%), together accounting for 109.7% of all Mitiwanga residents.
| Immigration Origin | # Population | % Population |
| Latin America | 91 | 36.5% |
| South America | 91 | 36.5% |
| Venezuela | 91 | 36.5% | View All 3 Rows |
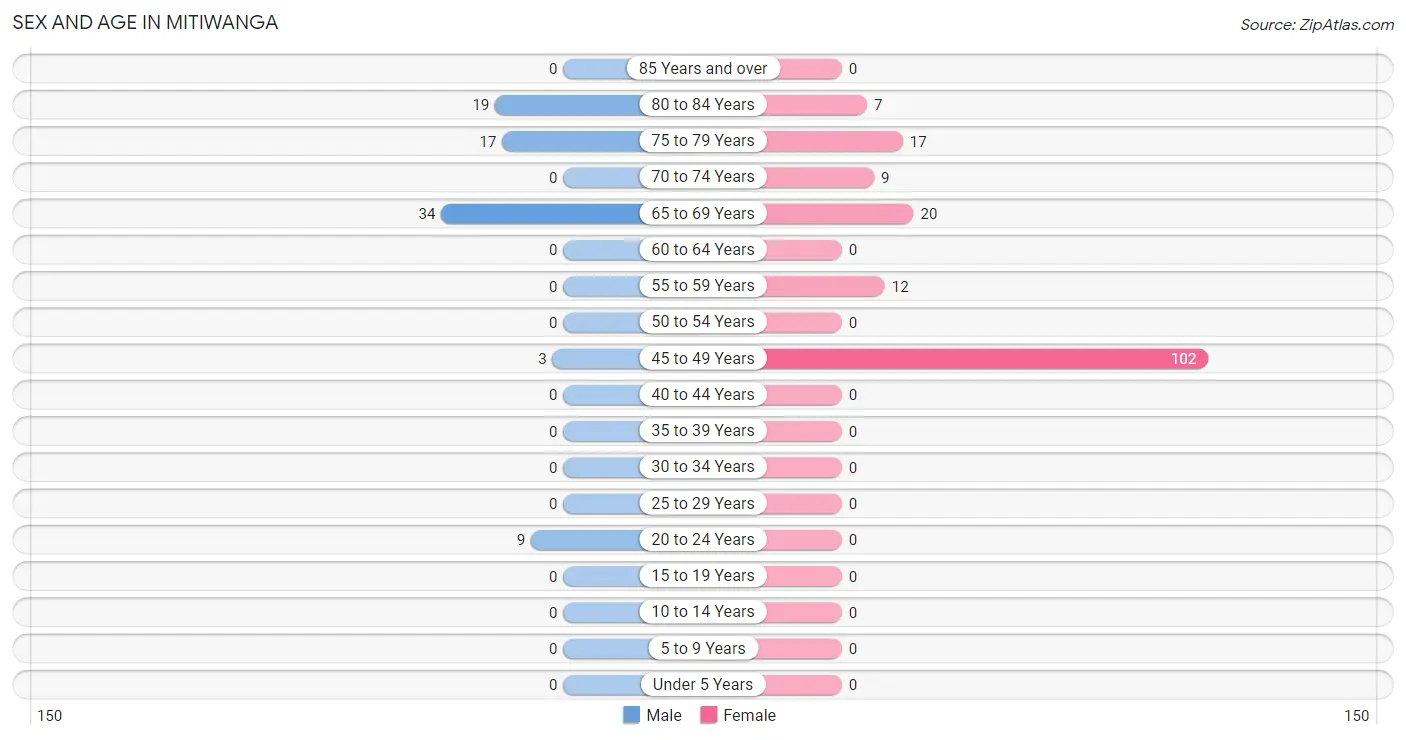
Sex and Age in Mitiwanga
Sex and Age in Mitiwanga
The most populous age groups in Mitiwanga are 65 to 69 Years (34 | 41.5%) for men and 45 to 49 Years (102 | 61.1%) for women.
| Age Bracket | Male | Female |
| Under 5 Years | 0 (0.0%) | 0 (0.0%) |
| 5 to 9 Years | 0 (0.0%) | 0 (0.0%) |
| 10 to 14 Years | 0 (0.0%) | 0 (0.0%) |
| 15 to 19 Years | 0 (0.0%) | 0 (0.0%) |
| 20 to 24 Years | 9 (11.0%) | 0 (0.0%) |
| 25 to 29 Years | 0 (0.0%) | 0 (0.0%) |
| 30 to 34 Years | 0 (0.0%) | 0 (0.0%) |
| 35 to 39 Years | 0 (0.0%) | 0 (0.0%) |
| 40 to 44 Years | 0 (0.0%) | 0 (0.0%) |
| 45 to 49 Years | 3 (3.7%) | 102 (61.1%) |
| 50 to 54 Years | 0 (0.0%) | 0 (0.0%) |
| 55 to 59 Years | 0 (0.0%) | 12 (7.2%) |
| 60 to 64 Years | 0 (0.0%) | 0 (0.0%) |
| 65 to 69 Years | 34 (41.5%) | 20 (12.0%) |
| 70 to 74 Years | 0 (0.0%) | 9 (5.4%) |
| 75 to 79 Years | 17 (20.7%) | 17 (10.2%) |
| 80 to 84 Years | 19 (23.2%) | 7 (4.2%) |
| 85 Years and over | 0 (0.0%) | 0 (0.0%) |
| Total | 82 (100.0%) | 167 (100.0%) |
Families and Households in Mitiwanga
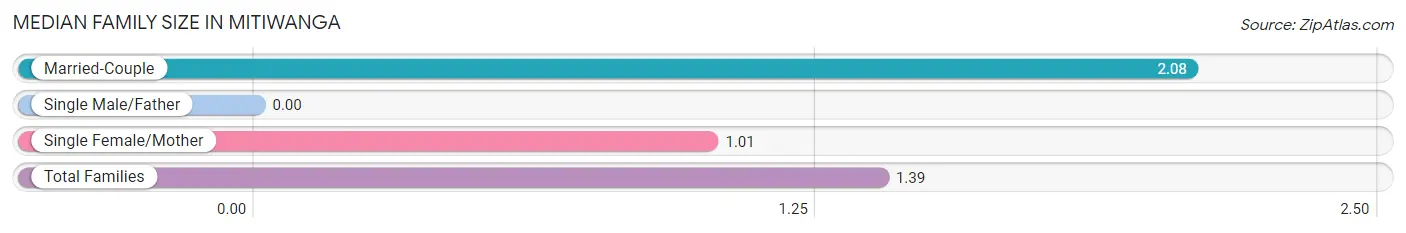
Median Family Size in Mitiwanga
| Family Type | # Families | Family Size |
| Married-Couple | 50 (35.5%) | 2.08 |
| Single Male/Father | 0 (0.0%) | - |
| Single Female/Mother | 91 (64.5%) | 1.01 |
| Total Families | 141 (100.0%) | 1.39 |
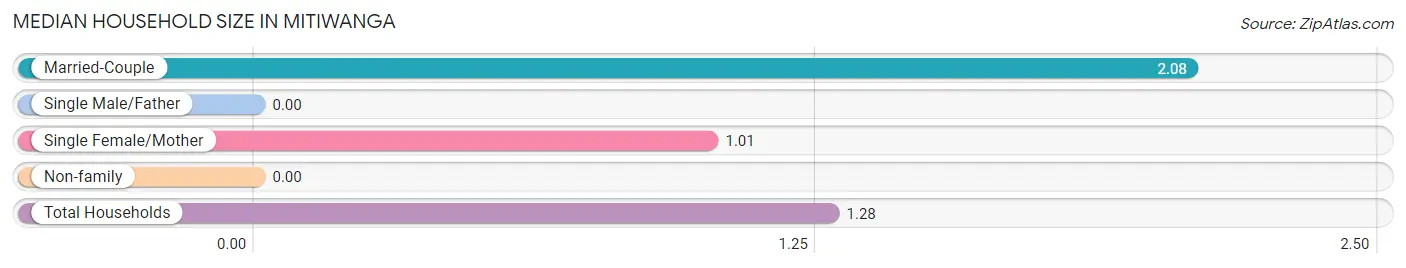
Median Household Size in Mitiwanga
| Household Type | # Households | Household Size |
| Married-Couple | 50 (25.8%) | 2.08 |
| Single Male/Father | 0 (0.0%) | - |
| Single Female/Mother | 91 (46.9%) | 1.01 |
| Non-family | 53 (27.3%) | - |
| Total Households | 194 (100.0%) | 1.28 |
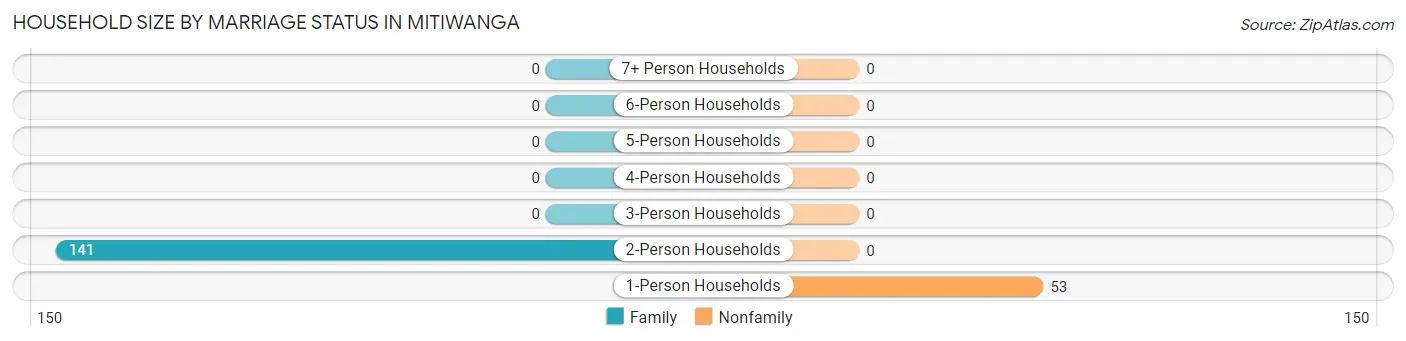
Household Size by Marriage Status in Mitiwanga
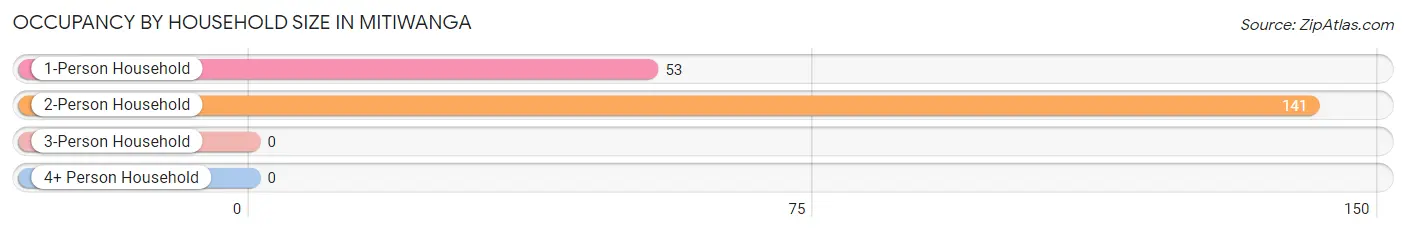
Out of a total of 194 households in Mitiwanga, 141 (72.7%) are family households, while 53 (27.3%) are nonfamily households. The most numerous type of family households are 2-person households, comprising 141, and the most common type of nonfamily households are 1-person households, comprising 53.
| Household Size | Family Households | Nonfamily Households |
| 1-Person Households | - | 53 (27.3%) |
| 2-Person Households | 141 (72.7%) | 0 (0.0%) |
| 3-Person Households | 0 (0.0%) | 0 (0.0%) |
| 4-Person Households | 0 (0.0%) | 0 (0.0%) |
| 5-Person Households | 0 (0.0%) | 0 (0.0%) |
| 6-Person Households | 0 (0.0%) | 0 (0.0%) |
| 7+ Person Households | 0 (0.0%) | 0 (0.0%) |
| Total | 141 (72.7%) | 53 (27.3%) |
Female Fertility in Mitiwanga
Fertility by Age in Mitiwanga
| Age Bracket | Women with Births | Births / 1,000 Women |
| 15 to 19 years | 0 (0.0%) | 0.0 |
| 20 to 34 years | 0 (0.0%) | 0.0 |
| 35 to 50 years | 0 (0.0%) | 0.0 |
| Total | 0 (0.0%) | 0.0 |
Fertility by Age by Marriage Status in Mitiwanga
| Age Bracket | Married | Unmarried |
| 15 to 19 years | 0 (0.0%) | 0 (0.0%) |
| 20 to 34 years | 0 (0.0%) | 0 (0.0%) |
| 35 to 50 years | 0 (0.0%) | 0 (0.0%) |
| Total | 0 (0.0%) | 0 (0.0%) |
Fertility by Education in Mitiwanga
| Educational Attainment | Women with Births | Births / 1,000 Women |
| Less than High School | 0 (0.0%) | 0.0 |
| High School Diploma | 0 (0.0%) | 0.0 |
| College or Associate's Degree | 0 (0.0%) | 0.0 |
| Bachelor's Degree | 0 (0.0%) | 0.0 |
| Graduate Degree | 0 (0.0%) | 0.0 |
| Total | 0 (0.0%) | 0.0 |
Fertility by Education by Marriage Status in Mitiwanga
| Educational Attainment | Married | Unmarried |
| Less than High School | 0 (0.0%) | 0 (0.0%) |
| High School Diploma | 0 (0.0%) | 0 (0.0%) |
| College or Associate's Degree | 0 (0.0%) | 0 (0.0%) |
| Bachelor's Degree | 0 (0.0%) | 0 (0.0%) |
| Graduate Degree | 0 (0.0%) | 0 (0.0%) |
| Total | 0 (0.0%) | 0 (0.0%) |
Employment Characteristics in Mitiwanga
Employment by Class of Employer in Mitiwanga
Among the 180 employed individuals in Mitiwanga, private company employees (119 | 66.1%), self-employed (incorporated) (34 | 18.9%), and self-employed (not incorporated) (16 | 8.9%) make up the most common classes of employment.
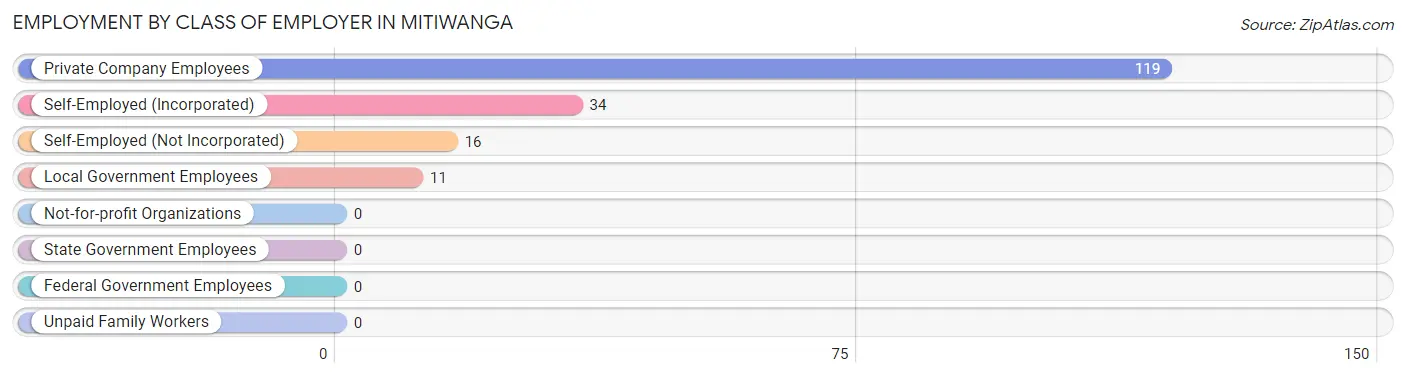
| Employer Class | # Employees | % Employees |
| Private Company Employees | 119 | 66.1% |
| Self-Employed (Incorporated) | 34 | 18.9% |
| Self-Employed (Not Incorporated) | 16 | 8.9% |
| Not-for-profit Organizations | 0 | 0.0% |
| Local Government Employees | 11 | 6.1% |
| State Government Employees | 0 | 0.0% |
| Federal Government Employees | 0 | 0.0% |
| Unpaid Family Workers | 0 | 0.0% |
| Total | 180 | 100.0% |
Employment Status by Age in Mitiwanga
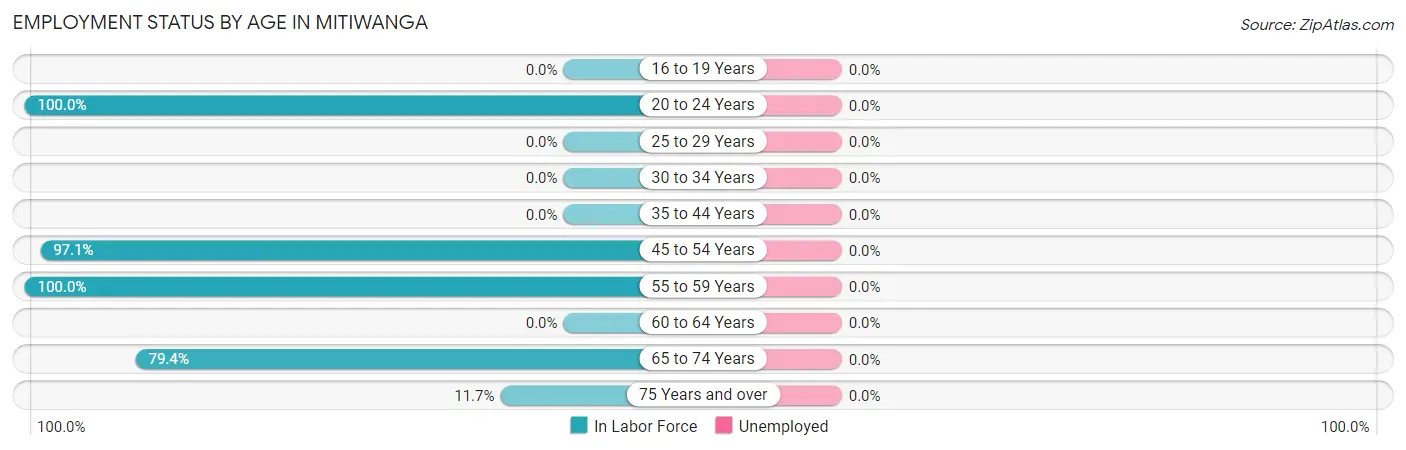
| Age Bracket | In Labor Force | Unemployed |
| 16 to 19 Years | 0 (0.0%) | 0 (0.0%) |
| 20 to 24 Years | 9 (100.0%) | 0 (0.0%) |
| 25 to 29 Years | 0 (0.0%) | 0 (0.0%) |
| 30 to 34 Years | 0 (0.0%) | 0 (0.0%) |
| 35 to 44 Years | 0 (0.0%) | 0 (0.0%) |
| 45 to 54 Years | 102 (97.1%) | 0 (0.0%) |
| 55 to 59 Years | 12 (100.0%) | 0 (0.0%) |
| 60 to 64 Years | 0 (0.0%) | 0 (0.0%) |
| 65 to 74 Years | 50 (79.4%) | 0 (0.0%) |
| 75 Years and over | 7 (11.7%) | 0 (0.0%) |
| Total | 180 (72.3%) | 0 (0.0%) |
Employment Status by Educational Attainment in Mitiwanga
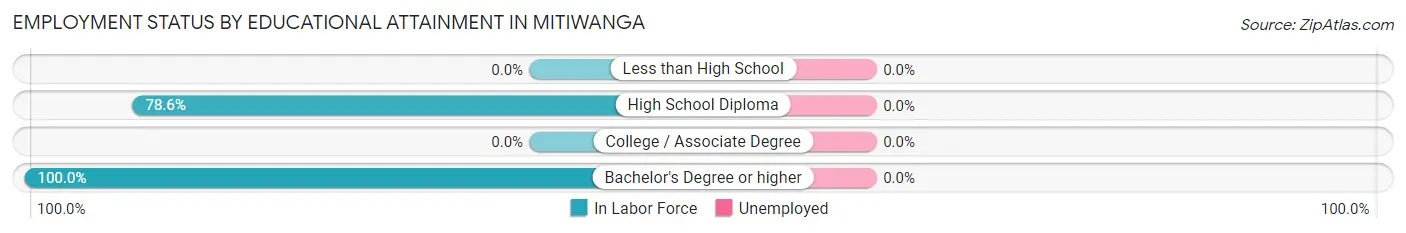
| Educational Attainment | In Labor Force | Unemployed |
| Less than High School | 0 (0.0%) | 0 (0.0%) |
| High School Diploma | 11 (78.6%) | 0 (0.0%) |
| College / Associate Degree | 0 (0.0%) | 0 (0.0%) |
| Bachelor's Degree or higher | 103 (100.0%) | 0 (0.0%) |
| Total | 114 (97.4%) | 0 (0.0%) |
Employment Occupations by Sex in Mitiwanga
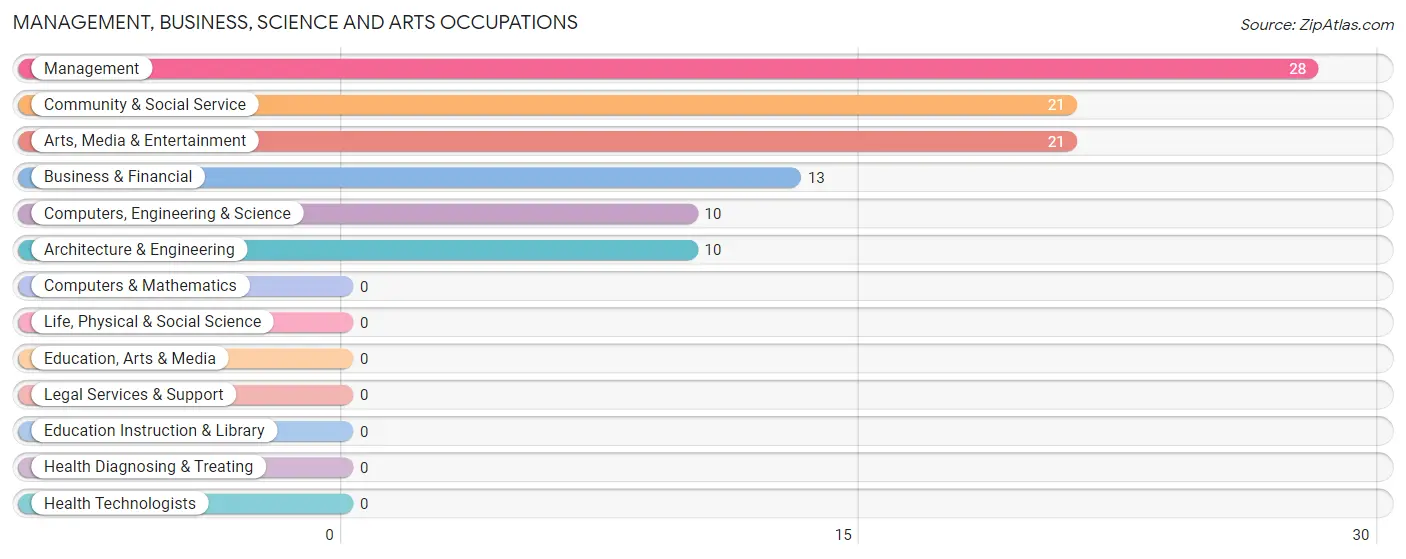
Management, Business, Science and Arts Occupations
The most common Management, Business, Science and Arts occupations in Mitiwanga are Management (28 | 15.6%), Community & Social Service (21 | 11.7%), Arts, Media & Entertainment (21 | 11.7%), Business & Financial (13 | 7.2%), and Computers, Engineering & Science (10 | 5.6%).
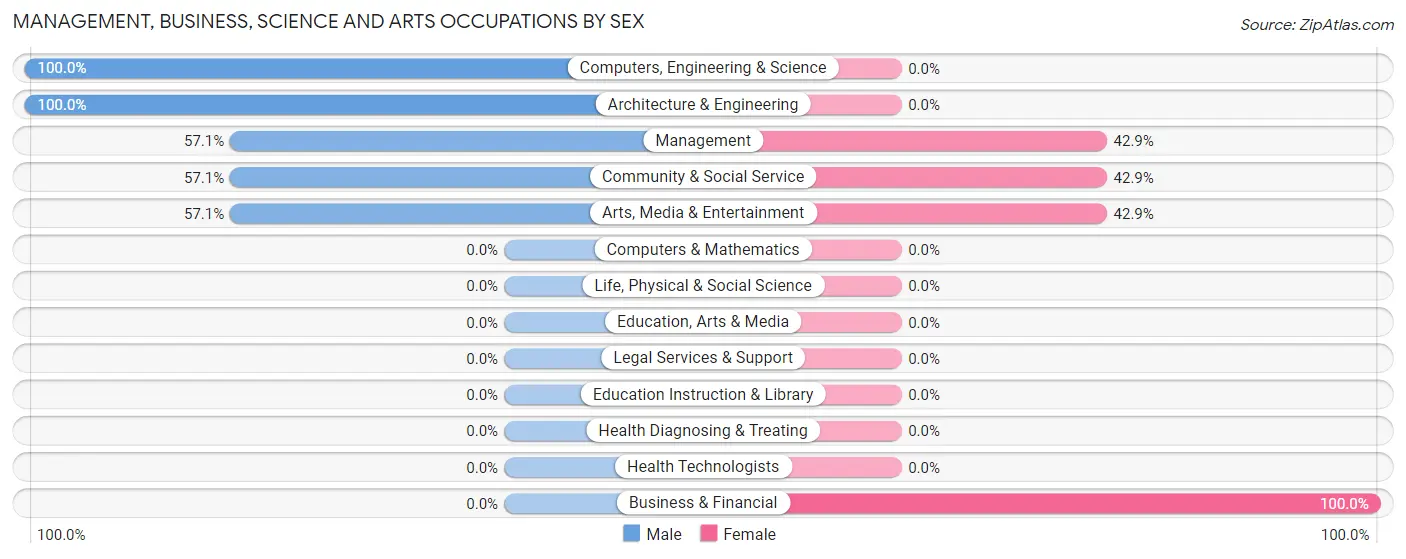
Management, Business, Science and Arts Occupations by Sex
Within the Management, Business, Science and Arts occupations in Mitiwanga, the most male-oriented occupations are Computers, Engineering & Science (100.0%), Architecture & Engineering (100.0%), and Management (57.1%), while the most female-oriented occupations are Business & Financial (100.0%), Management (42.9%), and Community & Social Service (42.9%).
| Occupation | Male | Female |
| Management | 16 (57.1%) | 12 (42.9%) |
| Business & Financial | 0 (0.0%) | 13 (100.0%) |
| Computers, Engineering & Science | 10 (100.0%) | 0 (0.0%) |
| Computers & Mathematics | 0 (0.0%) | 0 (0.0%) |
| Architecture & Engineering | 10 (100.0%) | 0 (0.0%) |
| Life, Physical & Social Science | 0 (0.0%) | 0 (0.0%) |
| Community & Social Service | 12 (57.1%) | 9 (42.9%) |
| Education, Arts & Media | 0 (0.0%) | 0 (0.0%) |
| Legal Services & Support | 0 (0.0%) | 0 (0.0%) |
| Education Instruction & Library | 0 (0.0%) | 0 (0.0%) |
| Arts, Media & Entertainment | 12 (57.1%) | 9 (42.9%) |
| Health Diagnosing & Treating | 0 (0.0%) | 0 (0.0%) |
| Health Technologists | 0 (0.0%) | 0 (0.0%) |
| Total (Category) | 38 (52.8%) | 34 (47.2%) |
| Total (Overall) | 44 (24.4%) | 136 (75.6%) |
Services Occupations
Services Occupations by Sex
| Occupation | Male | Female |
| Healthcare Support | 0 (0.0%) | 0 (0.0%) |
| Security & Protection | 0 (0.0%) | 0 (0.0%) |
| Firefighting & Prevention | 0 (0.0%) | 0 (0.0%) |
| Law Enforcement | 0 (0.0%) | 0 (0.0%) |
| Food Preparation & Serving | 0 (0.0%) | 0 (0.0%) |
| Cleaning & Maintenance | 0 (0.0%) | 0 (0.0%) |
| Personal Care & Service | 0 (0.0%) | 0 (0.0%) |
| Total (Category) | 0 (0.0%) | 0 (0.0%) |
| Total (Overall) | 44 (24.4%) | 136 (75.6%) |
Sales and Office Occupations
The most common Sales and Office occupations in Mitiwanga are , and Office & Administration (11 | 6.1%).
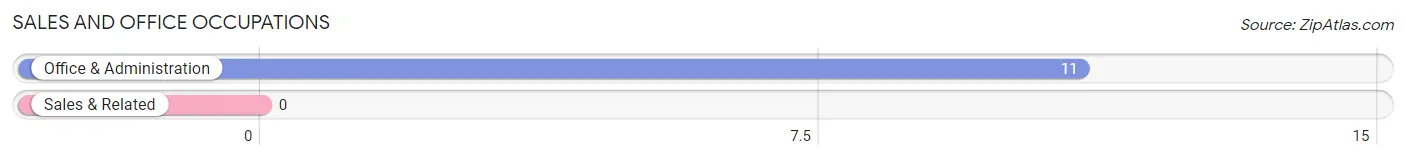
Sales and Office Occupations by Sex
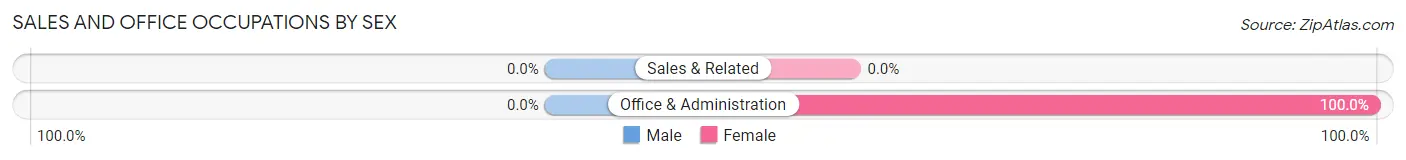
| Occupation | Male | Female |
| Sales & Related | 0 (0.0%) | 0 (0.0%) |
| Office & Administration | 0 (0.0%) | 11 (100.0%) |
| Total (Category) | 0 (0.0%) | 11 (100.0%) |
| Total (Overall) | 44 (24.4%) | 136 (75.6%) |
Natural Resources, Construction and Maintenance Occupations
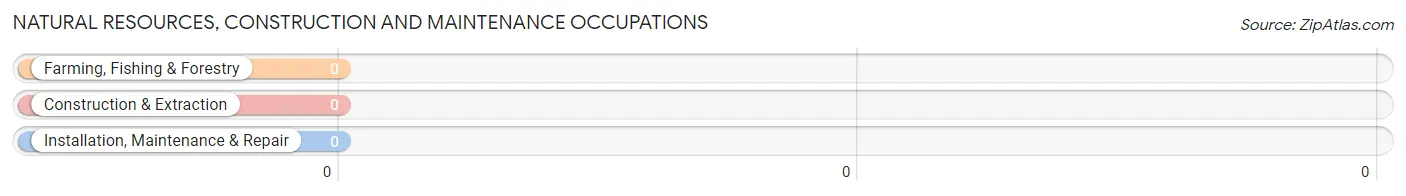
Natural Resources, Construction and Maintenance Occupations by Sex
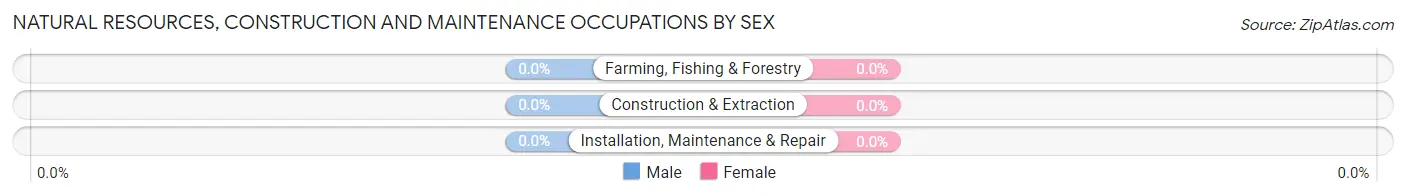
| Occupation | Male | Female |
| Farming, Fishing & Forestry | 0 (0.0%) | 0 (0.0%) |
| Construction & Extraction | 0 (0.0%) | 0 (0.0%) |
| Installation, Maintenance & Repair | 0 (0.0%) | 0 (0.0%) |
| Total (Category) | 0 (0.0%) | 0 (0.0%) |
| Total (Overall) | 44 (24.4%) | 136 (75.6%) |
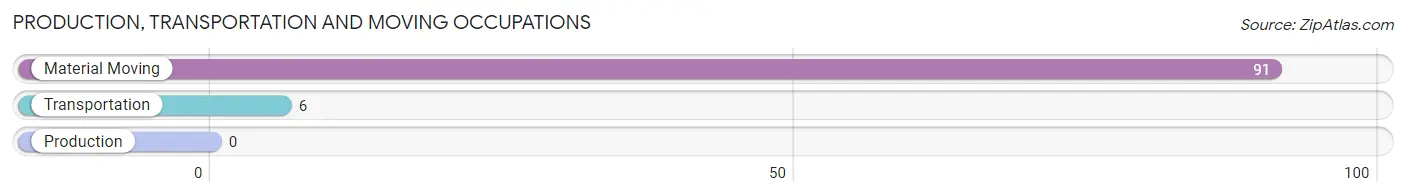
Production, Transportation and Moving Occupations
The most common Production, Transportation and Moving occupations in Mitiwanga are Material Moving (91 | 50.6%), and Transportation (6 | 3.3%).
Production, Transportation and Moving Occupations by Sex
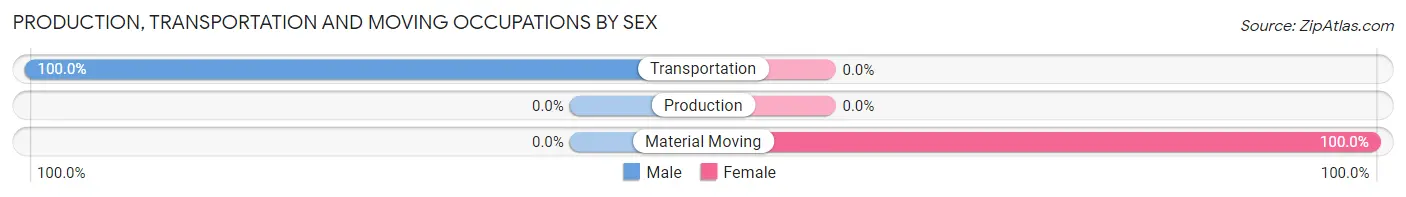
| Occupation | Male | Female |
| Production | 0 (0.0%) | 0 (0.0%) |
| Transportation | 6 (100.0%) | 0 (0.0%) |
| Material Moving | 0 (0.0%) | 91 (100.0%) |
| Total (Category) | 6 (6.2%) | 91 (93.8%) |
| Total (Overall) | 44 (24.4%) | 136 (75.6%) |
Employment Industries by Sex in Mitiwanga
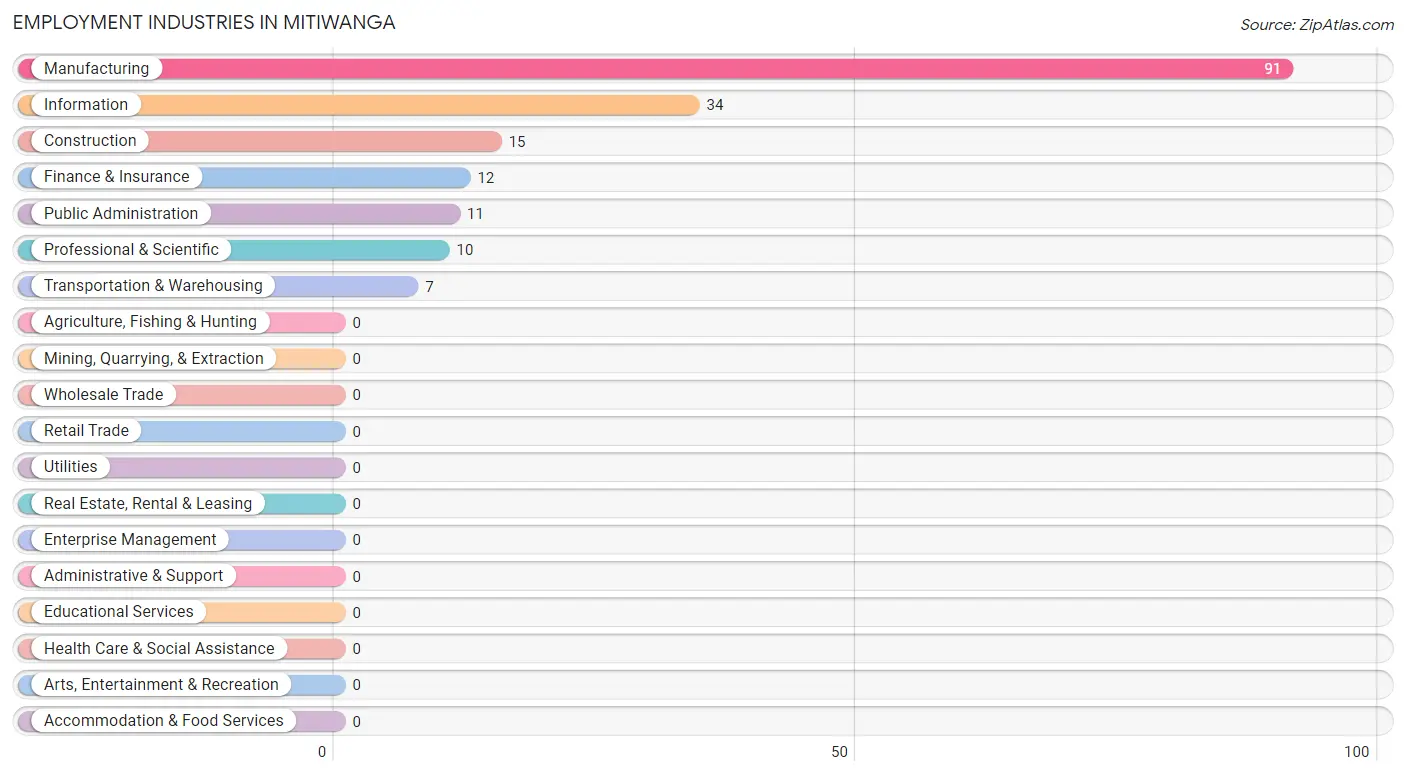
Employment Industries in Mitiwanga
The major employment industries in Mitiwanga include Manufacturing (91 | 50.6%), Information (34 | 18.9%), Construction (15 | 8.3%), Finance & Insurance (12 | 6.7%), and Public Administration (11 | 6.1%).
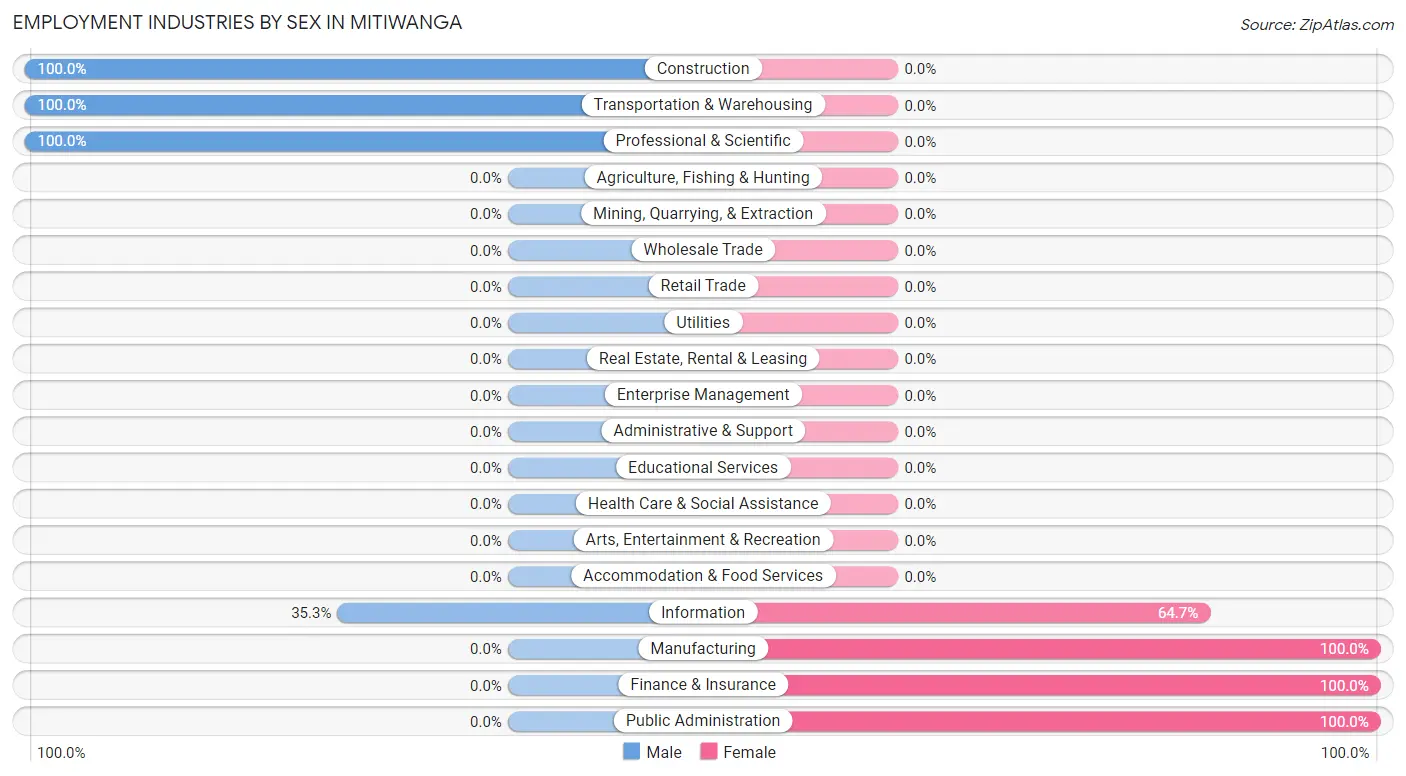
Employment Industries by Sex in Mitiwanga
The Mitiwanga industries that see more men than women are Construction (100.0%), Transportation & Warehousing (100.0%), and Professional & Scientific (100.0%), whereas the industries that tend to have a higher number of women are Manufacturing (100.0%), Finance & Insurance (100.0%), and Public Administration (100.0%).
| Industry | Male | Female |
| Agriculture, Fishing & Hunting | 0 (0.0%) | 0 (0.0%) |
| Mining, Quarrying, & Extraction | 0 (0.0%) | 0 (0.0%) |
| Construction | 15 (100.0%) | 0 (0.0%) |
| Manufacturing | 0 (0.0%) | 91 (100.0%) |
| Wholesale Trade | 0 (0.0%) | 0 (0.0%) |
| Retail Trade | 0 (0.0%) | 0 (0.0%) |
| Transportation & Warehousing | 7 (100.0%) | 0 (0.0%) |
| Utilities | 0 (0.0%) | 0 (0.0%) |
| Information | 12 (35.3%) | 22 (64.7%) |
| Finance & Insurance | 0 (0.0%) | 12 (100.0%) |
| Real Estate, Rental & Leasing | 0 (0.0%) | 0 (0.0%) |
| Professional & Scientific | 10 (100.0%) | 0 (0.0%) |
| Enterprise Management | 0 (0.0%) | 0 (0.0%) |
| Administrative & Support | 0 (0.0%) | 0 (0.0%) |
| Educational Services | 0 (0.0%) | 0 (0.0%) |
| Health Care & Social Assistance | 0 (0.0%) | 0 (0.0%) |
| Arts, Entertainment & Recreation | 0 (0.0%) | 0 (0.0%) |
| Accommodation & Food Services | 0 (0.0%) | 0 (0.0%) |
| Public Administration | 0 (0.0%) | 11 (100.0%) |
| Total | 44 (24.4%) | 136 (75.6%) |
Education in Mitiwanga
School Enrollment in Mitiwanga
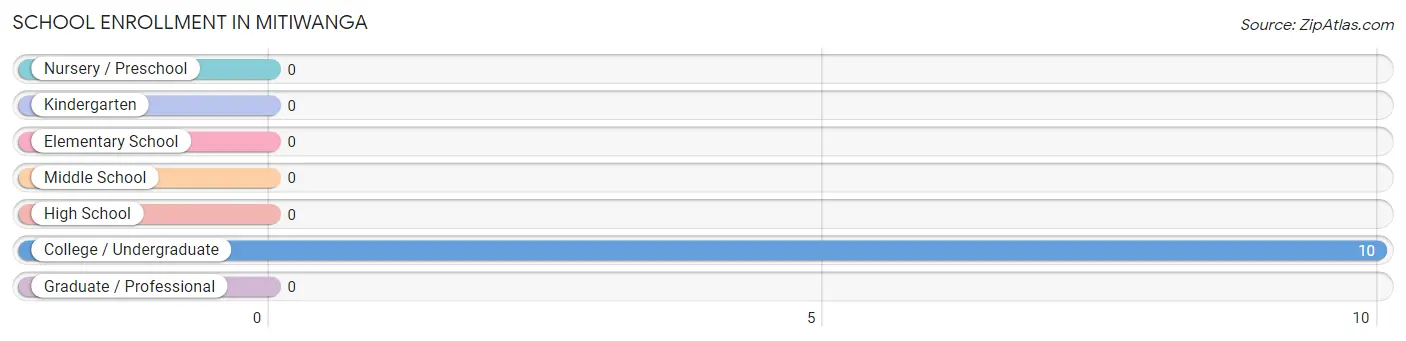
| School Level | # Students | % Students |
| Nursery / Preschool | 0 | 0.0% |
| Kindergarten | 0 | 0.0% |
| Elementary School | 0 | 0.0% |
| Middle School | 0 | 0.0% |
| High School | 0 | 0.0% |
| College / Undergraduate | 10 | 100.0% |
| Graduate / Professional | 0 | 0.0% |
| Total | 10 | 100.0% |
School Enrollment by Age by Funding Source in Mitiwanga
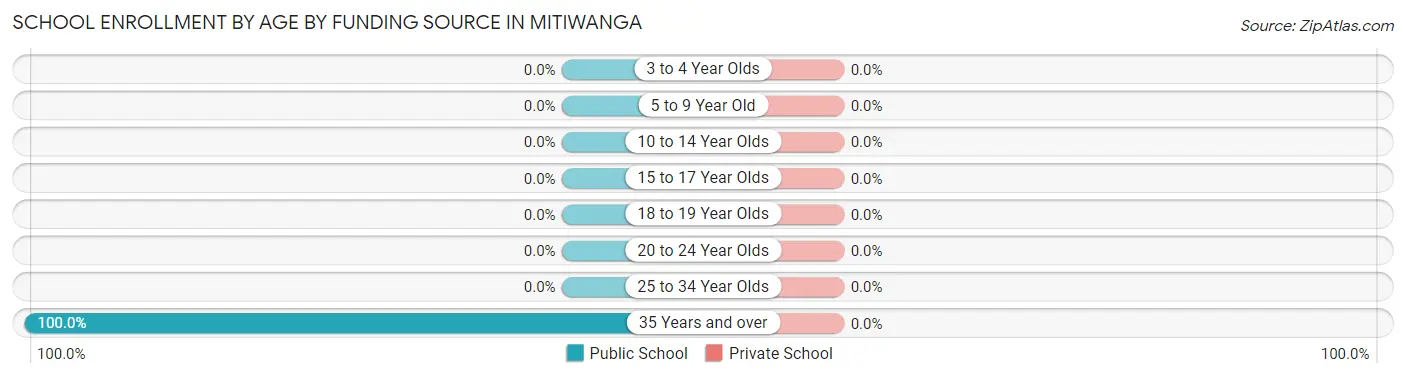
| Age Bracket | Public School | Private School |
| 3 to 4 Year Olds | 0 (0.0%) | 0 (0.0%) |
| 5 to 9 Year Old | 0 (0.0%) | 0 (0.0%) |
| 10 to 14 Year Olds | 0 (0.0%) | 0 (0.0%) |
| 15 to 17 Year Olds | 0 (0.0%) | 0 (0.0%) |
| 18 to 19 Year Olds | 0 (0.0%) | 0 (0.0%) |
| 20 to 24 Year Olds | 0 (0.0%) | 0 (0.0%) |
| 25 to 34 Year Olds | 0 (0.0%) | 0 (0.0%) |
| 35 Years and over | 10 (100.0%) | 0 (0.0%) |
| Total | 10 (100.0%) | 0 (0.0%) |
Educational Attainment by Field of Study in Mitiwanga
Business (103 | 64.8%), literature & languages (21 | 13.2%), science & technology (16 | 10.1%), liberal arts & history (13 | 8.2%), and education (6 | 3.8%) are the most common fields of study among 159 individuals in Mitiwanga who have obtained a bachelor's degree or higher.
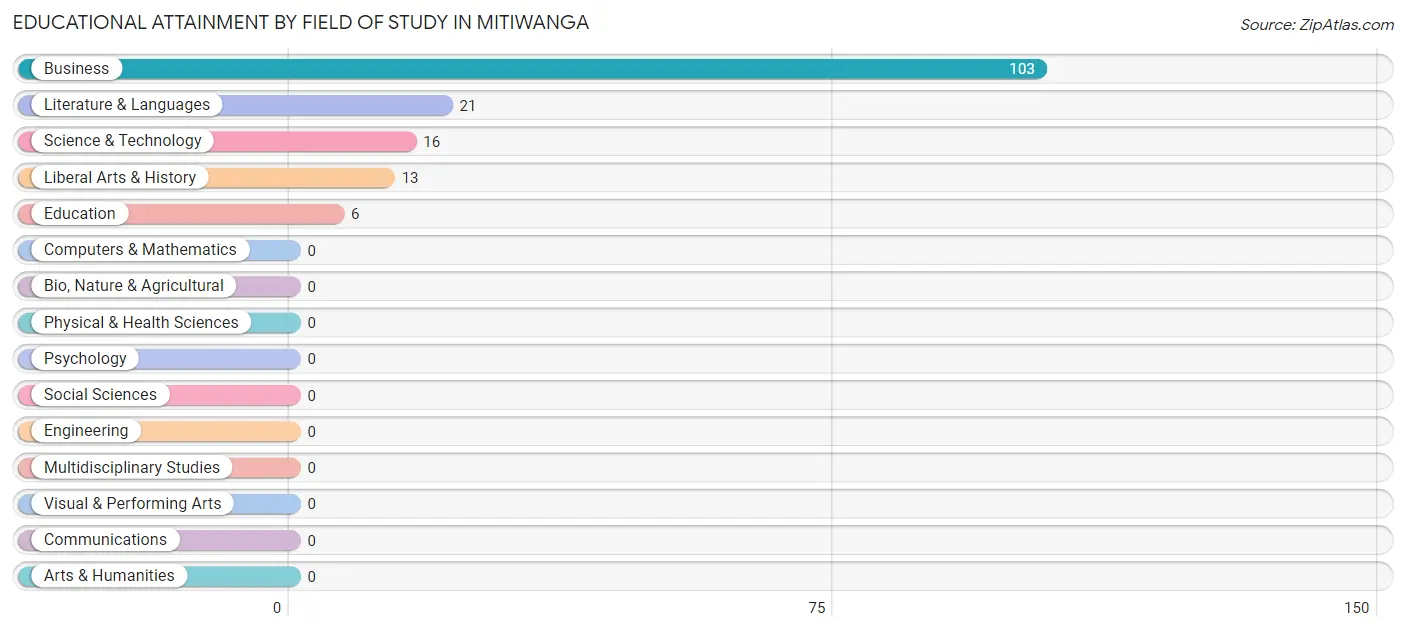
| Field of Study | # Graduates | % Graduates |
| Computers & Mathematics | 0 | 0.0% |
| Bio, Nature & Agricultural | 0 | 0.0% |
| Physical & Health Sciences | 0 | 0.0% |
| Psychology | 0 | 0.0% |
| Social Sciences | 0 | 0.0% |
| Engineering | 0 | 0.0% |
| Multidisciplinary Studies | 0 | 0.0% |
| Science & Technology | 16 | 10.1% |
| Business | 103 | 64.8% |
| Education | 6 | 3.8% |
| Literature & Languages | 21 | 13.2% |
| Liberal Arts & History | 13 | 8.2% |
| Visual & Performing Arts | 0 | 0.0% |
| Communications | 0 | 0.0% |
| Arts & Humanities | 0 | 0.0% |
| Total | 159 | 100.0% |
Transportation & Commute in Mitiwanga
Vehicle Availability by Sex in Mitiwanga
The most prevalent vehicle ownership categories in Mitiwanga are males with 1 vehicle (19, accounting for 43.2%) and females with 1 vehicle (103, making up 14.0%).
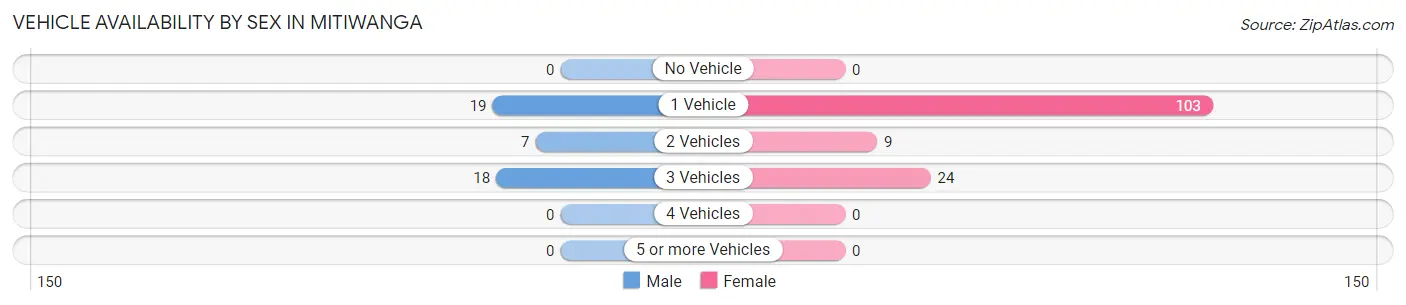
| Vehicles Available | Male | Female |
| No Vehicle | 0 (0.0%) | 0 (0.0%) |
| 1 Vehicle | 19 (43.2%) | 103 (75.7%) |
| 2 Vehicles | 7 (15.9%) | 9 (6.6%) |
| 3 Vehicles | 18 (40.9%) | 24 (17.6%) |
| 4 Vehicles | 0 (0.0%) | 0 (0.0%) |
| 5 or more Vehicles | 0 (0.0%) | 0 (0.0%) |
| Total | 44 (100.0%) | 136 (100.0%) |
Commute Time in Mitiwanga
The most frequently occuring commute durations in Mitiwanga are 10 to 14 minutes (100 commuters, 73.5%), 30 to 34 minutes (24 commuters, 17.6%), and 25 to 29 minutes (12 commuters, 8.8%).
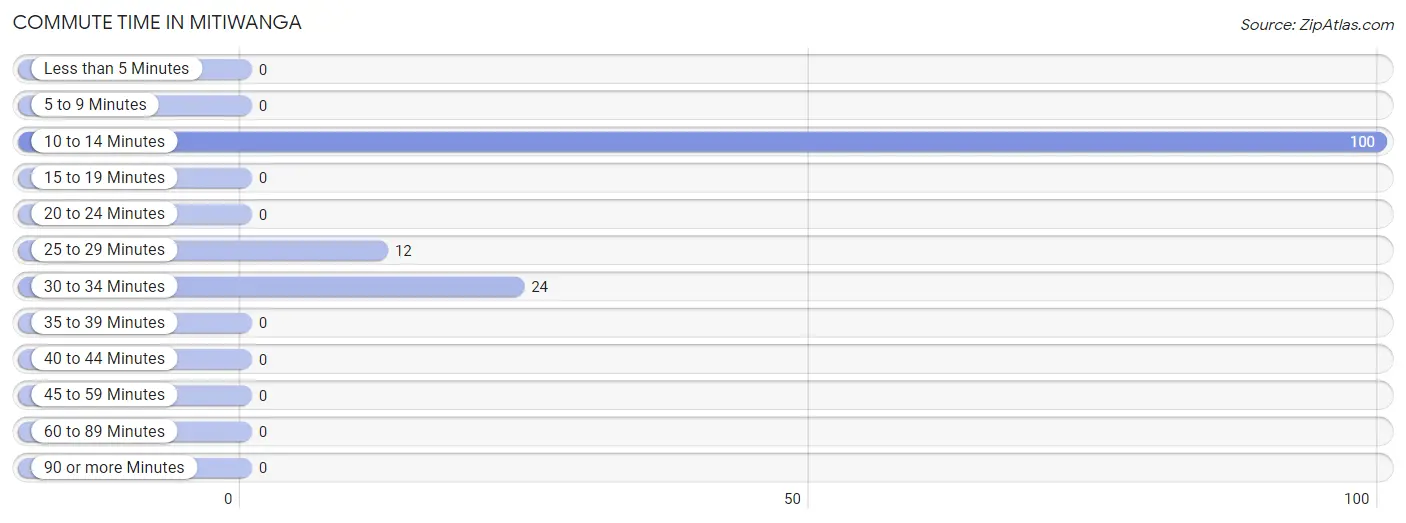
| Commute Time | # Commuters | % Commuters |
| Less than 5 Minutes | 0 | 0.0% |
| 5 to 9 Minutes | 0 | 0.0% |
| 10 to 14 Minutes | 100 | 73.5% |
| 15 to 19 Minutes | 0 | 0.0% |
| 20 to 24 Minutes | 0 | 0.0% |
| 25 to 29 Minutes | 12 | 8.8% |
| 30 to 34 Minutes | 24 | 17.6% |
| 35 to 39 Minutes | 0 | 0.0% |
| 40 to 44 Minutes | 0 | 0.0% |
| 45 to 59 Minutes | 0 | 0.0% |
| 60 to 89 Minutes | 0 | 0.0% |
| 90 or more Minutes | 0 | 0.0% |
Commute Time by Sex in Mitiwanga
The most common commute times in Mitiwanga are 30 to 34 minutes (13 commuters, 59.1%) for males and 10 to 14 minutes (91 commuters, 79.8%) for females.
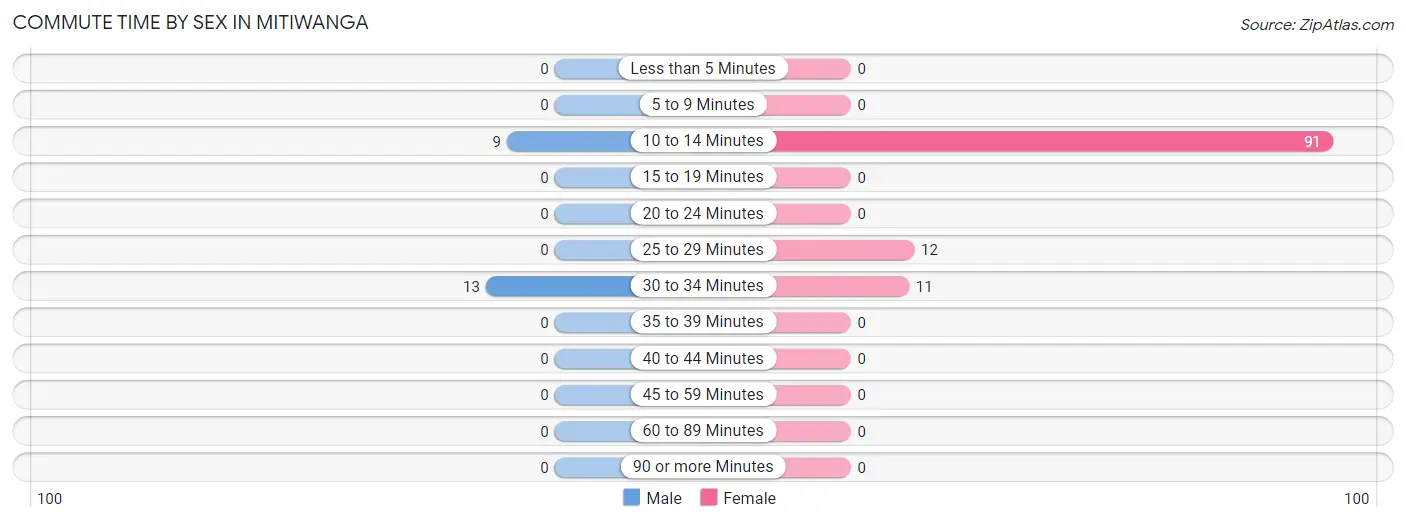
| Commute Time | Male | Female |
| Less than 5 Minutes | 0 (0.0%) | 0 (0.0%) |
| 5 to 9 Minutes | 0 (0.0%) | 0 (0.0%) |
| 10 to 14 Minutes | 9 (40.9%) | 91 (79.8%) |
| 15 to 19 Minutes | 0 (0.0%) | 0 (0.0%) |
| 20 to 24 Minutes | 0 (0.0%) | 0 (0.0%) |
| 25 to 29 Minutes | 0 (0.0%) | 12 (10.5%) |
| 30 to 34 Minutes | 13 (59.1%) | 11 (9.7%) |
| 35 to 39 Minutes | 0 (0.0%) | 0 (0.0%) |
| 40 to 44 Minutes | 0 (0.0%) | 0 (0.0%) |
| 45 to 59 Minutes | 0 (0.0%) | 0 (0.0%) |
| 60 to 89 Minutes | 0 (0.0%) | 0 (0.0%) |
| 90 or more Minutes | 0 (0.0%) | 0 (0.0%) |
Time of Departure to Work by Sex in Mitiwanga
The most frequent times of departure to work in Mitiwanga are 8:30 AM to 8:59 AM (9, 40.9%) for males and 7:30 AM to 7:59 AM (103, 90.3%) for females.
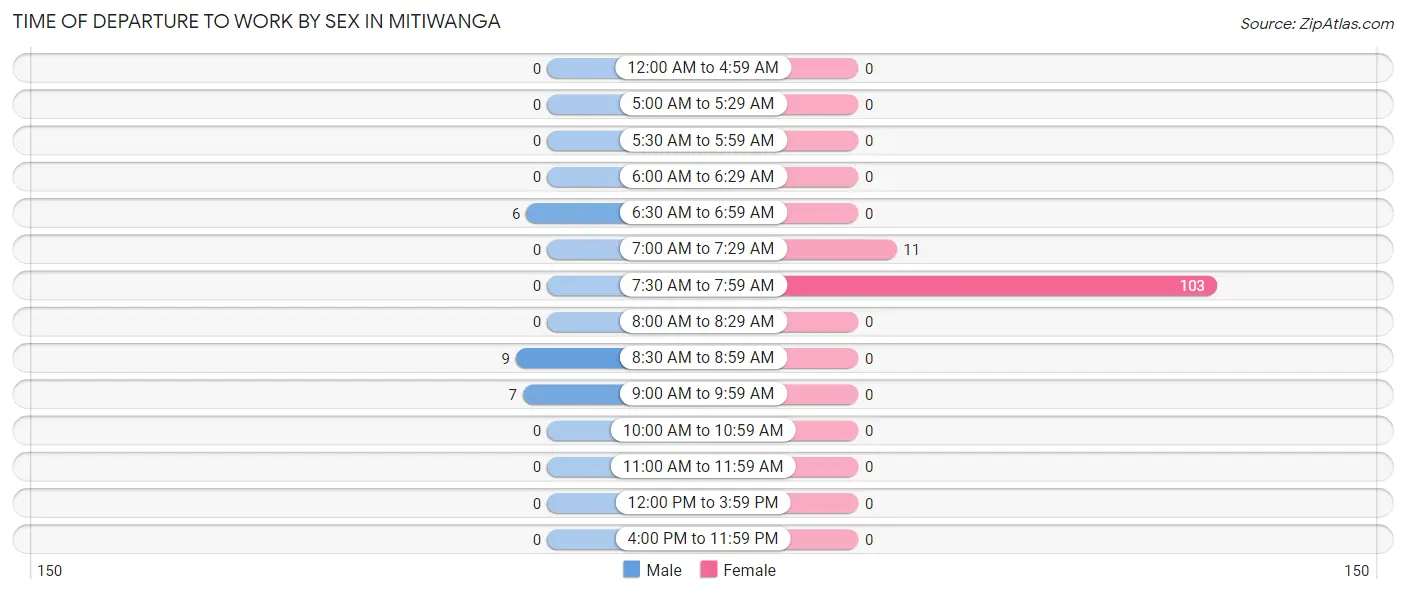
| Time of Departure | Male | Female |
| 12:00 AM to 4:59 AM | 0 (0.0%) | 0 (0.0%) |
| 5:00 AM to 5:29 AM | 0 (0.0%) | 0 (0.0%) |
| 5:30 AM to 5:59 AM | 0 (0.0%) | 0 (0.0%) |
| 6:00 AM to 6:29 AM | 0 (0.0%) | 0 (0.0%) |
| 6:30 AM to 6:59 AM | 6 (27.3%) | 0 (0.0%) |
| 7:00 AM to 7:29 AM | 0 (0.0%) | 11 (9.7%) |
| 7:30 AM to 7:59 AM | 0 (0.0%) | 103 (90.3%) |
| 8:00 AM to 8:29 AM | 0 (0.0%) | 0 (0.0%) |
| 8:30 AM to 8:59 AM | 9 (40.9%) | 0 (0.0%) |
| 9:00 AM to 9:59 AM | 7 (31.8%) | 0 (0.0%) |
| 10:00 AM to 10:59 AM | 0 (0.0%) | 0 (0.0%) |
| 11:00 AM to 11:59 AM | 0 (0.0%) | 0 (0.0%) |
| 12:00 PM to 3:59 PM | 0 (0.0%) | 0 (0.0%) |
| 4:00 PM to 11:59 PM | 0 (0.0%) | 0 (0.0%) |
| Total | 22 (100.0%) | 114 (100.0%) |
Housing Occupancy in Mitiwanga
Occupancy by Ownership in Mitiwanga
Of the total 194 dwellings in Mitiwanga, owner-occupied units account for 74 (38.1%), while renter-occupied units make up 120 (61.9%).
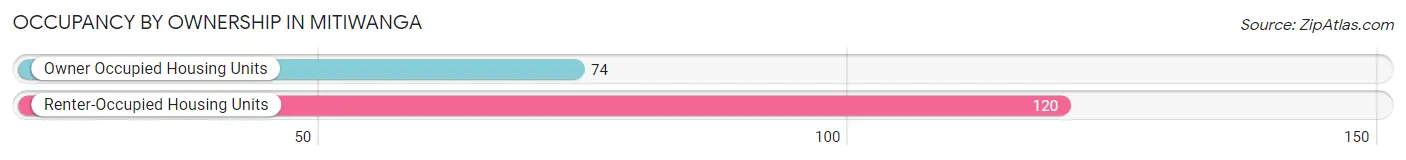
| Occupancy | # Housing Units | % Housing Units |
| Owner Occupied Housing Units | 74 | 38.1% |
| Renter-Occupied Housing Units | 120 | 61.9% |
| Total Occupied Housing Units | 194 | 100.0% |
Occupancy by Household Size in Mitiwanga
| Household Size | # Housing Units | % Housing Units |
| 1-Person Household | 53 | 27.3% |
| 2-Person Household | 141 | 72.7% |
| 3-Person Household | 0 | 0.0% |
| 4+ Person Household | 0 | 0.0% |
| Total Housing Units | 194 | 100.0% |
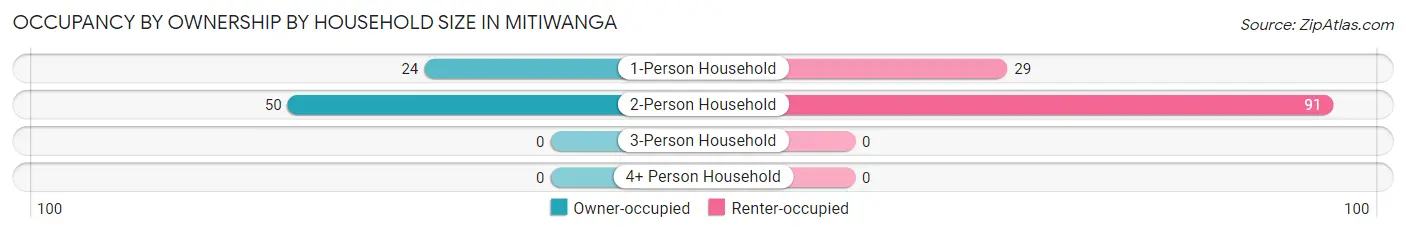
Occupancy by Ownership by Household Size in Mitiwanga
| Household Size | Owner-occupied | Renter-occupied |
| 1-Person Household | 24 (45.3%) | 29 (54.7%) |
| 2-Person Household | 50 (35.5%) | 91 (64.5%) |
| 3-Person Household | 0 (0.0%) | 0 (0.0%) |
| 4+ Person Household | 0 (0.0%) | 0 (0.0%) |
| Total Housing Units | 74 (38.1%) | 120 (61.9%) |
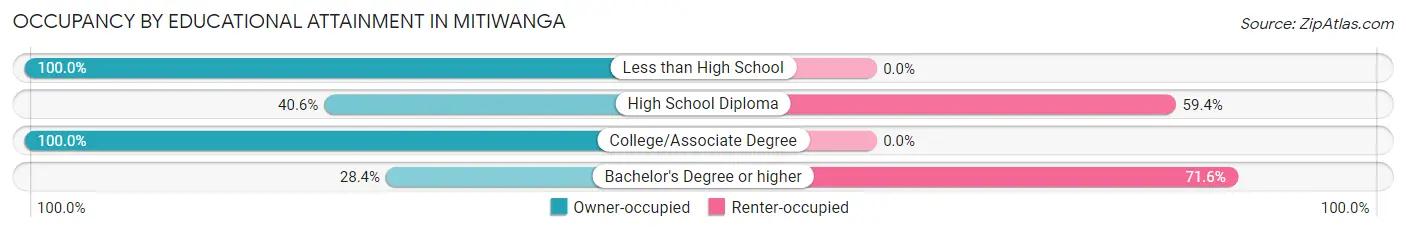
Occupancy by Educational Attainment in Mitiwanga
| Household Size | Owner-occupied | Renter-occupied |
| Less than High School | 6 (100.0%) | 0 (0.0%) |
| High School Diploma | 13 (40.6%) | 19 (59.4%) |
| College/Associate Degree | 15 (100.0%) | 0 (0.0%) |
| Bachelor's Degree or higher | 40 (28.4%) | 101 (71.6%) |
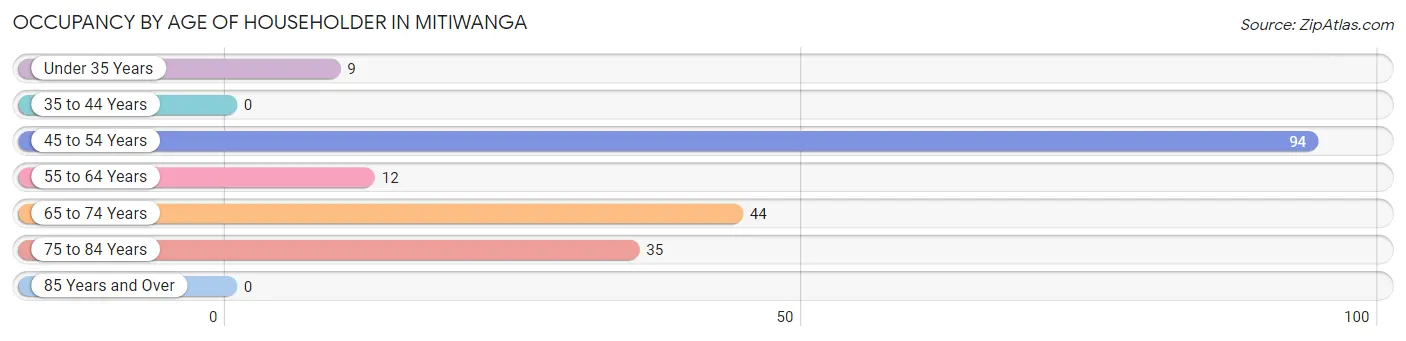
Occupancy by Age of Householder in Mitiwanga
| Age Bracket | # Households | % Households |
| Under 35 Years | 9 | 4.6% |
| 35 to 44 Years | 0 | 0.0% |
| 45 to 54 Years | 94 | 48.4% |
| 55 to 64 Years | 12 | 6.2% |
| 65 to 74 Years | 44 | 22.7% |
| 75 to 84 Years | 35 | 18.0% |
| 85 Years and Over | 0 | 0.0% |
| Total | 194 | 100.0% |
Housing Finances in Mitiwanga
Median Income by Occupancy in Mitiwanga
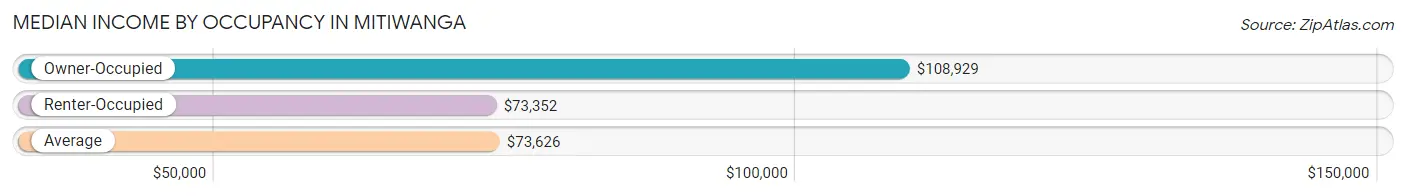
| Occupancy Type | # Households | Median Income |
| Owner-Occupied | 74 (38.1%) | $108,929 |
| Renter-Occupied | 120 (61.9%) | $73,352 |
| Average | 194 (100.0%) | $73,626 |
Occupancy by Householder Income Bracket in Mitiwanga
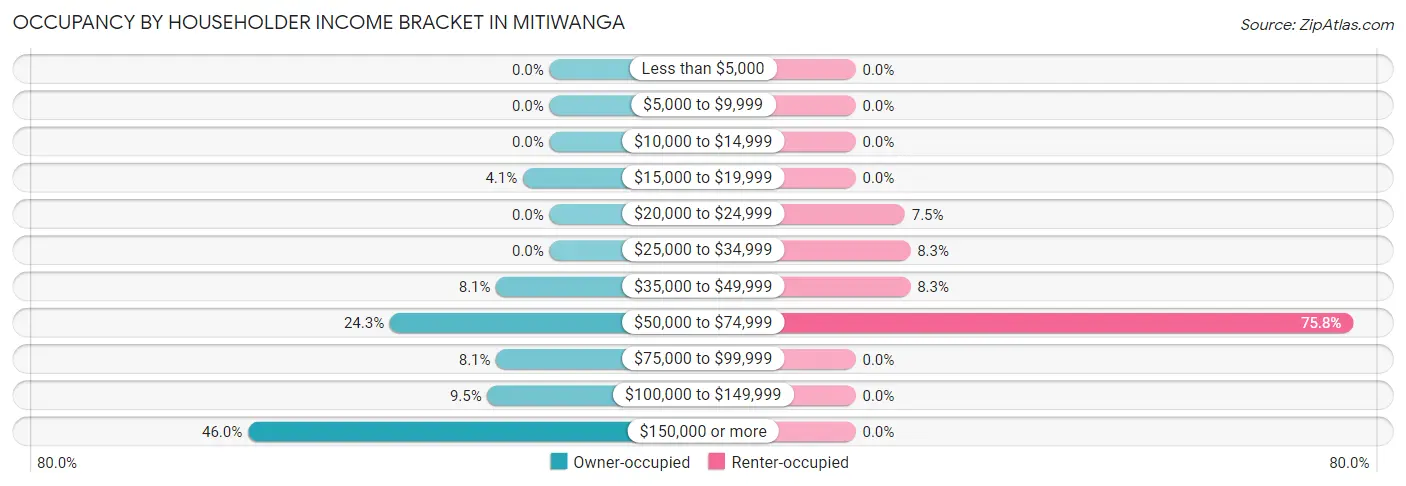
| Income Bracket | Owner-occupied | Renter-occupied |
| Less than $5,000 | 0 (0.0%) | 0 (0.0%) |
| $5,000 to $9,999 | 0 (0.0%) | 0 (0.0%) |
| $10,000 to $14,999 | 0 (0.0%) | 0 (0.0%) |
| $15,000 to $19,999 | 3 (4.1%) | 0 (0.0%) |
| $20,000 to $24,999 | 0 (0.0%) | 9 (7.5%) |
| $25,000 to $34,999 | 0 (0.0%) | 10 (8.3%) |
| $35,000 to $49,999 | 6 (8.1%) | 10 (8.3%) |
| $50,000 to $74,999 | 18 (24.3%) | 91 (75.8%) |
| $75,000 to $99,999 | 6 (8.1%) | 0 (0.0%) |
| $100,000 to $149,999 | 7 (9.5%) | 0 (0.0%) |
| $150,000 or more | 34 (46.0%) | 0 (0.0%) |
| Total | 74 (100.0%) | 120 (100.0%) |
Monthly Housing Cost Tiers in Mitiwanga
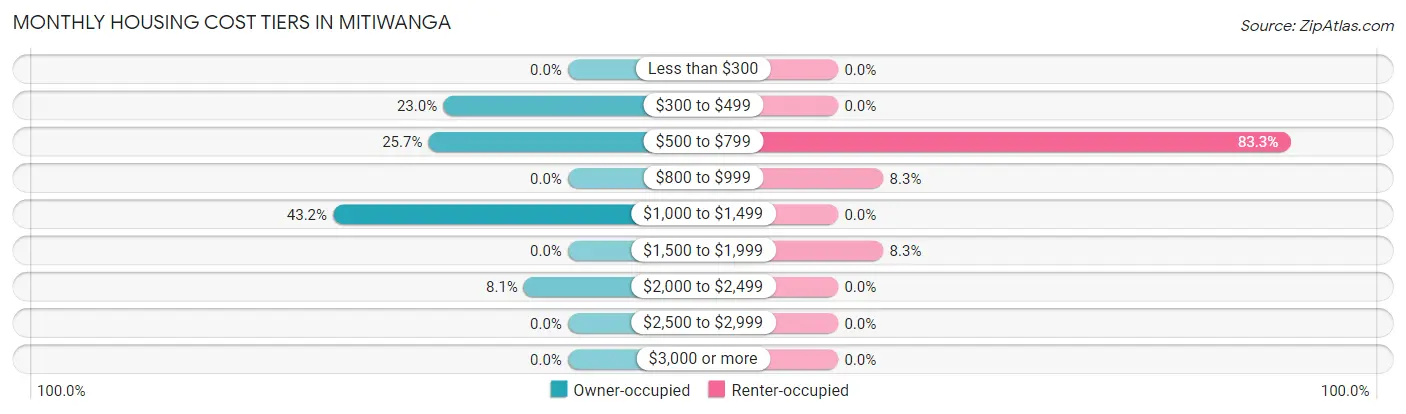
| Monthly Cost | Owner-occupied | Renter-occupied |
| Less than $300 | 0 (0.0%) | 0 (0.0%) |
| $300 to $499 | 17 (23.0%) | 0 (0.0%) |
| $500 to $799 | 19 (25.7%) | 100 (83.3%) |
| $800 to $999 | 0 (0.0%) | 10 (8.3%) |
| $1,000 to $1,499 | 32 (43.2%) | 0 (0.0%) |
| $1,500 to $1,999 | 0 (0.0%) | 10 (8.3%) |
| $2,000 to $2,499 | 6 (8.1%) | 0 (0.0%) |
| $2,500 to $2,999 | 0 (0.0%) | 0 (0.0%) |
| $3,000 or more | 0 (0.0%) | 0 (0.0%) |
| Total | 74 (100.0%) | 120 (100.0%) |
Physical Housing Characteristics in Mitiwanga
Housing Structures in Mitiwanga
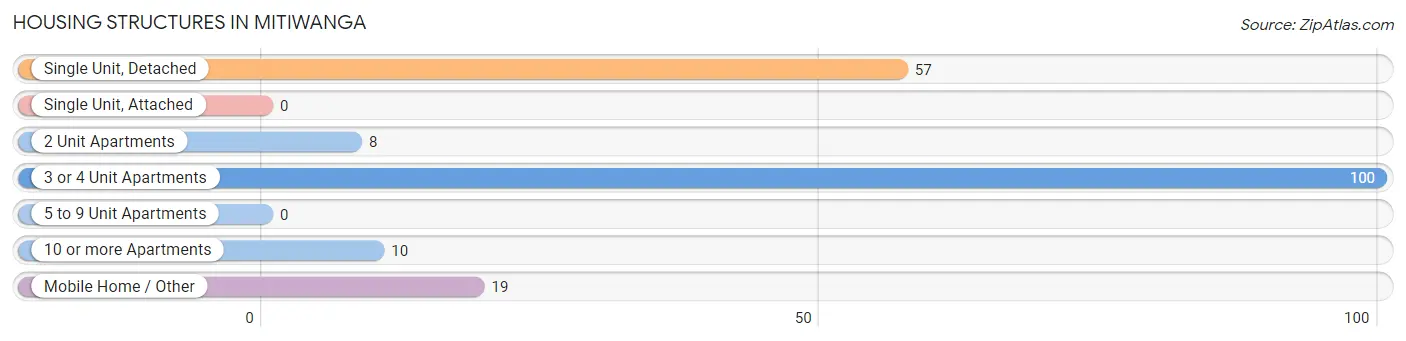
| Structure Type | # Housing Units | % Housing Units |
| Single Unit, Detached | 57 | 29.4% |
| Single Unit, Attached | 0 | 0.0% |
| 2 Unit Apartments | 8 | 4.1% |
| 3 or 4 Unit Apartments | 100 | 51.5% |
| 5 to 9 Unit Apartments | 0 | 0.0% |
| 10 or more Apartments | 10 | 5.1% |
| Mobile Home / Other | 19 | 9.8% |
| Total | 194 | 100.0% |
Housing Structures by Occupancy in Mitiwanga
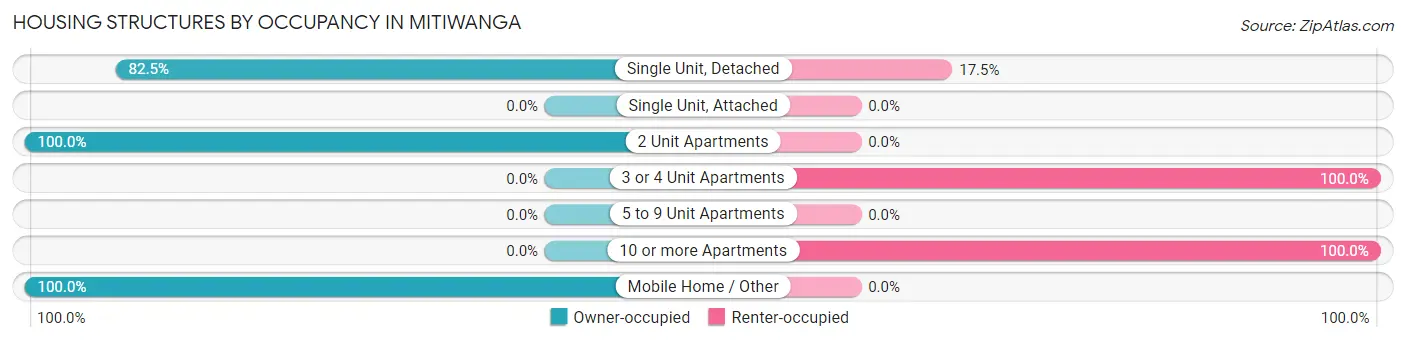
| Structure Type | Owner-occupied | Renter-occupied |
| Single Unit, Detached | 47 (82.5%) | 10 (17.5%) |
| Single Unit, Attached | 0 (0.0%) | 0 (0.0%) |
| 2 Unit Apartments | 8 (100.0%) | 0 (0.0%) |
| 3 or 4 Unit Apartments | 0 (0.0%) | 100 (100.0%) |
| 5 to 9 Unit Apartments | 0 (0.0%) | 0 (0.0%) |
| 10 or more Apartments | 0 (0.0%) | 10 (100.0%) |
| Mobile Home / Other | 19 (100.0%) | 0 (0.0%) |
| Total | 74 (38.1%) | 120 (61.9%) |
Housing Structures by Number of Rooms in Mitiwanga
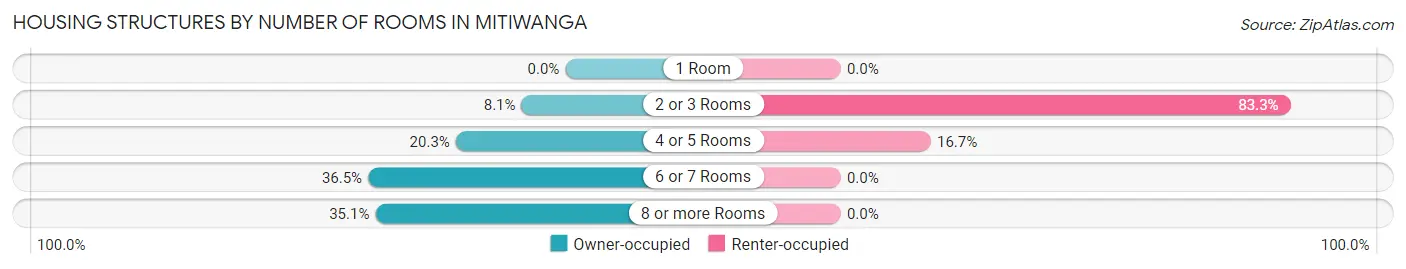
| Number of Rooms | Owner-occupied | Renter-occupied |
| 1 Room | 0 (0.0%) | 0 (0.0%) |
| 2 or 3 Rooms | 6 (8.1%) | 100 (83.3%) |
| 4 or 5 Rooms | 15 (20.3%) | 20 (16.7%) |
| 6 or 7 Rooms | 27 (36.5%) | 0 (0.0%) |
| 8 or more Rooms | 26 (35.1%) | 0 (0.0%) |
| Total | 74 (100.0%) | 120 (100.0%) |
Housing Structure by Heating Type in Mitiwanga
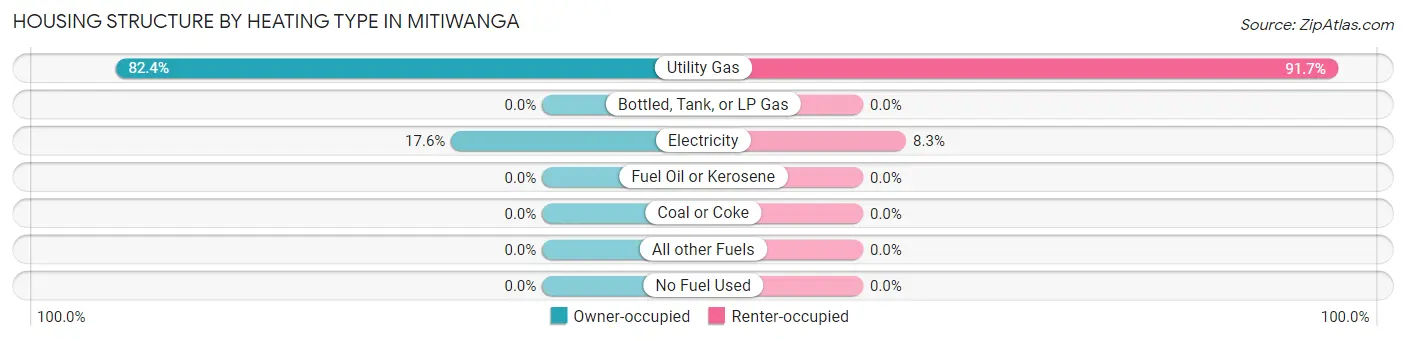
| Heating Type | Owner-occupied | Renter-occupied |
| Utility Gas | 61 (82.4%) | 110 (91.7%) |
| Bottled, Tank, or LP Gas | 0 (0.0%) | 0 (0.0%) |
| Electricity | 13 (17.6%) | 10 (8.3%) |
| Fuel Oil or Kerosene | 0 (0.0%) | 0 (0.0%) |
| Coal or Coke | 0 (0.0%) | 0 (0.0%) |
| All other Fuels | 0 (0.0%) | 0 (0.0%) |
| No Fuel Used | 0 (0.0%) | 0 (0.0%) |
| Total | 74 (100.0%) | 120 (100.0%) |
Household Vehicle Usage in Mitiwanga
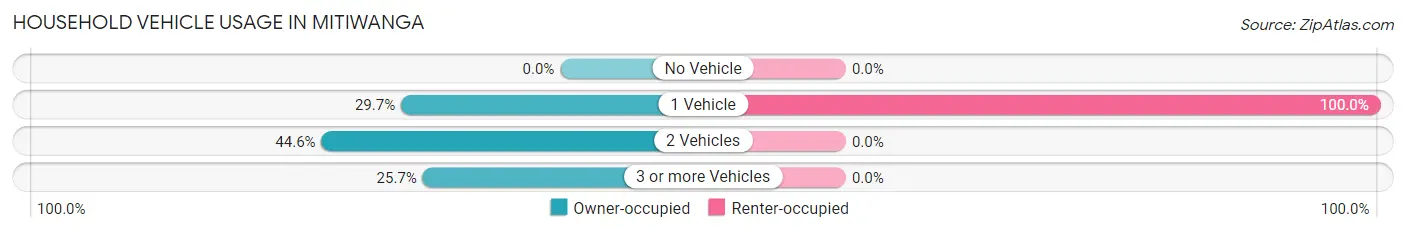
| Vehicles per Household | Owner-occupied | Renter-occupied |
| No Vehicle | 0 (0.0%) | 0 (0.0%) |
| 1 Vehicle | 22 (29.7%) | 120 (100.0%) |
| 2 Vehicles | 33 (44.6%) | 0 (0.0%) |
| 3 or more Vehicles | 19 (25.7%) | 0 (0.0%) |
| Total | 74 (100.0%) | 120 (100.0%) |
Real Estate & Mortgages in Mitiwanga
Real Estate and Mortgage Overview in Mitiwanga
| Characteristic | Without Mortgage | With Mortgage |
| Housing Units | 56 | 18 |
| Median Property Value | $311,100 | $0 |
| Median Household Income | $107,857 | $12 |
| Monthly Housing Costs | $711 | $0 |
| Real Estate Taxes | - | - |
Property Value by Mortgage Status in Mitiwanga
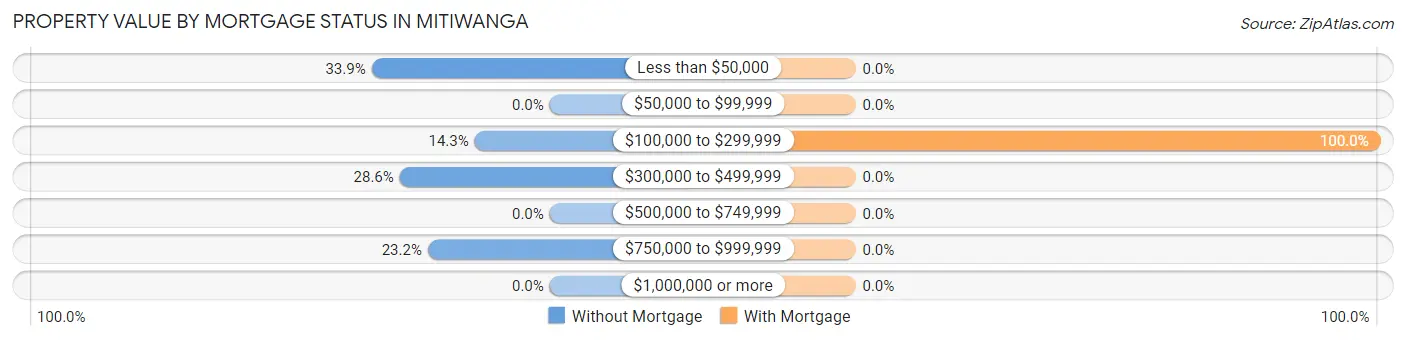
| Property Value | Without Mortgage | With Mortgage |
| Less than $50,000 | 19 (33.9%) | 0 (0.0%) |
| $50,000 to $99,999 | 0 (0.0%) | 0 (0.0%) |
| $100,000 to $299,999 | 8 (14.3%) | 18 (100.0%) |
| $300,000 to $499,999 | 16 (28.6%) | 0 (0.0%) |
| $500,000 to $749,999 | 0 (0.0%) | 0 (0.0%) |
| $750,000 to $999,999 | 13 (23.2%) | 0 (0.0%) |
| $1,000,000 or more | 0 (0.0%) | 0 (0.0%) |
| Total | 56 (100.0%) | 18 (100.0%) |
Household Income by Mortgage Status in Mitiwanga
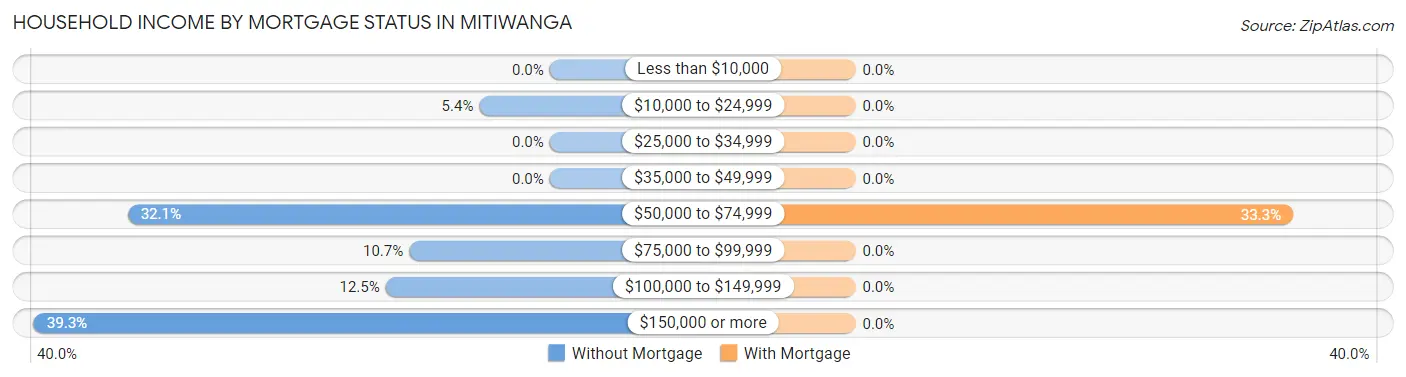
| Household Income | Without Mortgage | With Mortgage |
| Less than $10,000 | 0 (0.0%) | 0 (0.0%) |
| $10,000 to $24,999 | 3 (5.4%) | 0 (0.0%) |
| $25,000 to $34,999 | 0 (0.0%) | 0 (0.0%) |
| $35,000 to $49,999 | 0 (0.0%) | 0 (0.0%) |
| $50,000 to $74,999 | 18 (32.1%) | 6 (33.3%) |
| $75,000 to $99,999 | 6 (10.7%) | 0 (0.0%) |
| $100,000 to $149,999 | 7 (12.5%) | 0 (0.0%) |
| $150,000 or more | 22 (39.3%) | 0 (0.0%) |
| Total | 56 (100.0%) | 18 (100.0%) |
Property Value to Household Income Ratio in Mitiwanga
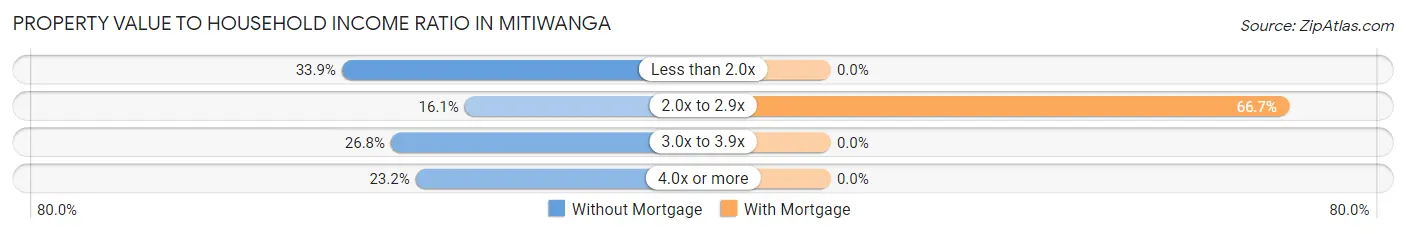
| Value-to-Income Ratio | Without Mortgage | With Mortgage |
| Less than 2.0x | 19 (33.9%) | 0 (0.0%) |
| 2.0x to 2.9x | 9 (16.1%) | 12 (66.7%) |
| 3.0x to 3.9x | 15 (26.8%) | 0 (0.0%) |
| 4.0x or more | 13 (23.2%) | 0 (0.0%) |
| Total | 56 (100.0%) | 18 (100.0%) |
Real Estate Taxes by Mortgage Status in Mitiwanga
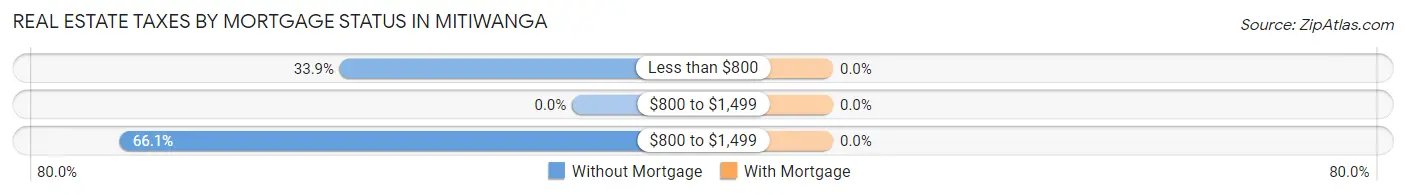
| Property Taxes | Without Mortgage | With Mortgage |
| Less than $800 | 19 (33.9%) | 0 (0.0%) |
| $800 to $1,499 | 0 (0.0%) | 0 (0.0%) |
| $800 to $1,499 | 37 (66.1%) | 0 (0.0%) |
| Total | 56 (100.0%) | 18 (100.0%) |
Health & Disability in Mitiwanga
Health Insurance Coverage by Age in Mitiwanga
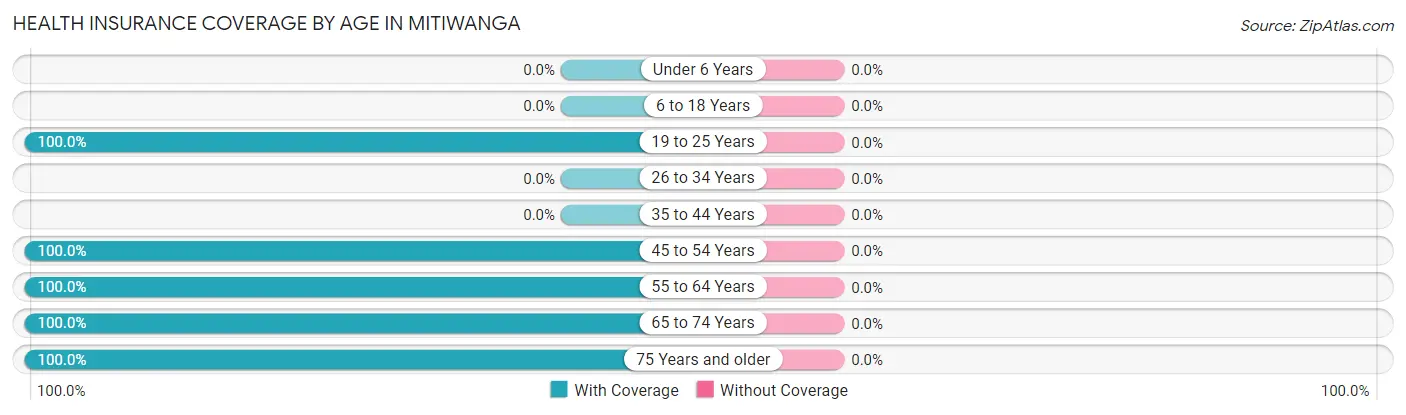
| Age Bracket | With Coverage | Without Coverage |
| Under 6 Years | 0 (0.0%) | 0 (0.0%) |
| 6 to 18 Years | 0 (0.0%) | 0 (0.0%) |
| 19 to 25 Years | 9 (100.0%) | 0 (0.0%) |
| 26 to 34 Years | 0 (0.0%) | 0 (0.0%) |
| 35 to 44 Years | 0 (0.0%) | 0 (0.0%) |
| 45 to 54 Years | 105 (100.0%) | 0 (0.0%) |
| 55 to 64 Years | 12 (100.0%) | 0 (0.0%) |
| 65 to 74 Years | 63 (100.0%) | 0 (0.0%) |
| 75 Years and older | 60 (100.0%) | 0 (0.0%) |
| Total | 249 (100.0%) | 0 (0.0%) |
Health Insurance Coverage by Citizenship Status in Mitiwanga
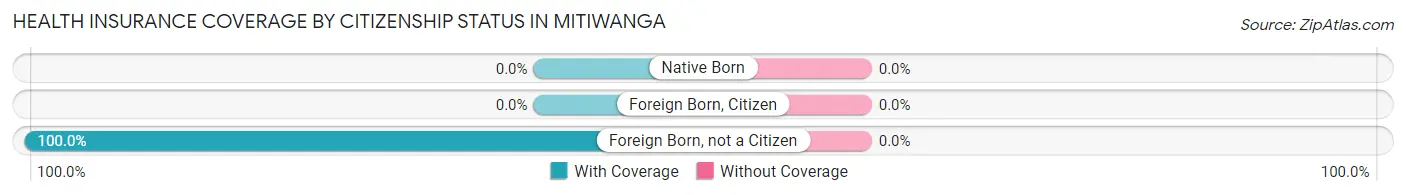
| Citizenship Status | With Coverage | Without Coverage |
| Native Born | 0 (0.0%) | 0 (0.0%) |
| Foreign Born, Citizen | 0 (0.0%) | 0 (0.0%) |
| Foreign Born, not a Citizen | 9 (100.0%) | 0 (0.0%) |
Health Insurance Coverage by Household Income in Mitiwanga
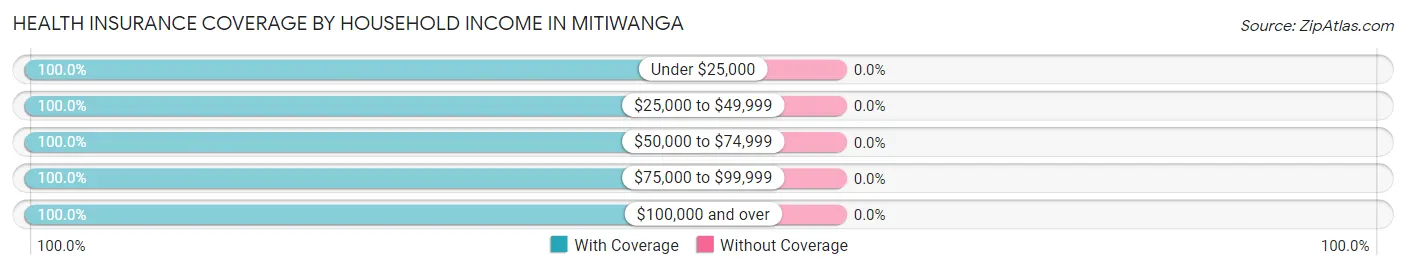
| Household Income | With Coverage | Without Coverage |
| Under $25,000 | 12 (100.0%) | 0 (0.0%) |
| $25,000 to $49,999 | 32 (100.0%) | 0 (0.0%) |
| $50,000 to $74,999 | 128 (100.0%) | 0 (0.0%) |
| $75,000 to $99,999 | 17 (100.0%) | 0 (0.0%) |
| $100,000 and over | 60 (100.0%) | 0 (0.0%) |
Public vs Private Health Insurance Coverage by Age in Mitiwanga
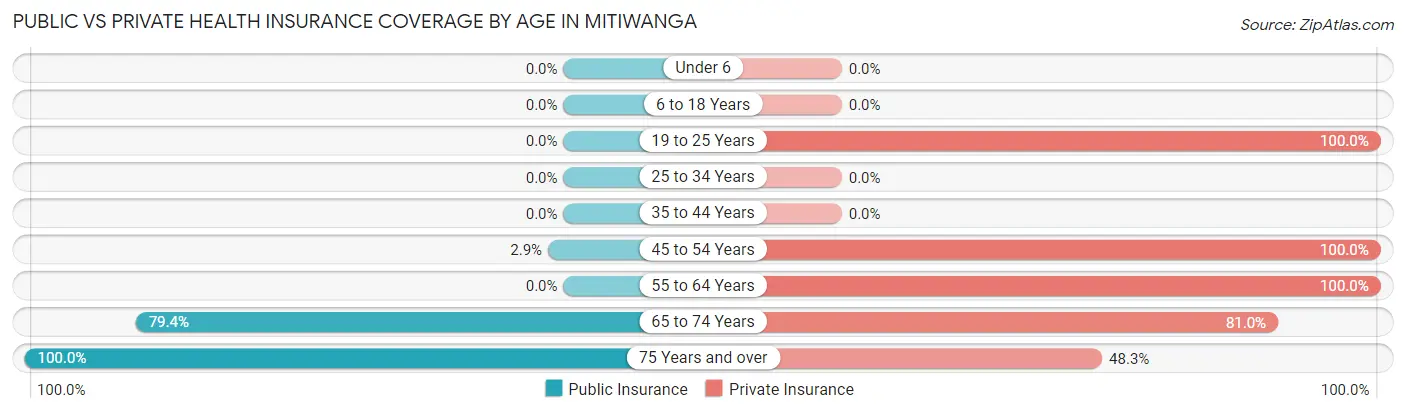
| Age Bracket | Public Insurance | Private Insurance |
| Under 6 | 0 (0.0%) | 0 (0.0%) |
| 6 to 18 Years | 0 (0.0%) | 0 (0.0%) |
| 19 to 25 Years | 0 (0.0%) | 9 (100.0%) |
| 25 to 34 Years | 0 (0.0%) | 0 (0.0%) |
| 35 to 44 Years | 0 (0.0%) | 0 (0.0%) |
| 45 to 54 Years | 3 (2.9%) | 105 (100.0%) |
| 55 to 64 Years | 0 (0.0%) | 12 (100.0%) |
| 65 to 74 Years | 50 (79.4%) | 51 (80.9%) |
| 75 Years and over | 60 (100.0%) | 29 (48.3%) |
| Total | 113 (45.4%) | 206 (82.7%) |
Disability Status by Sex by Age in Mitiwanga
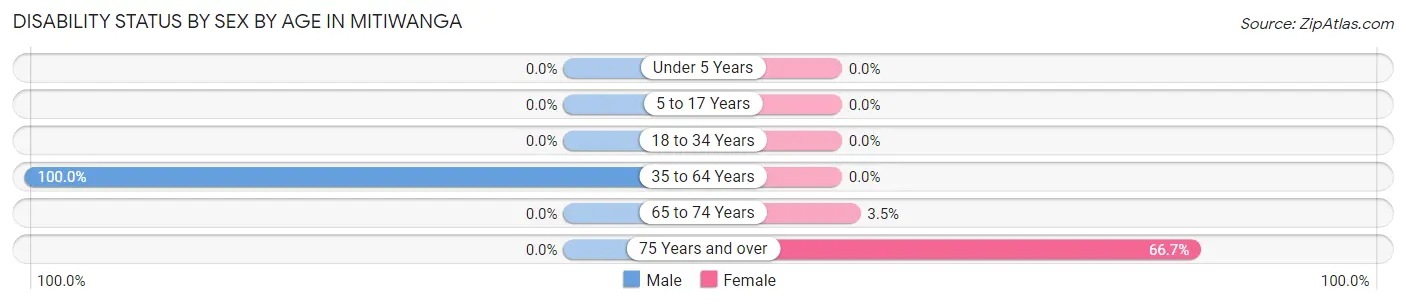
| Age Bracket | Male | Female |
| Under 5 Years | 0 (0.0%) | 0 (0.0%) |
| 5 to 17 Years | 0 (0.0%) | 0 (0.0%) |
| 18 to 34 Years | 0 (0.0%) | 0 (0.0%) |
| 35 to 64 Years | 3 (100.0%) | 0 (0.0%) |
| 65 to 74 Years | 0 (0.0%) | 1 (3.5%) |
| 75 Years and over | 0 (0.0%) | 16 (66.7%) |
Disability Class by Sex by Age in Mitiwanga
Disability Class: Hearing Difficulty
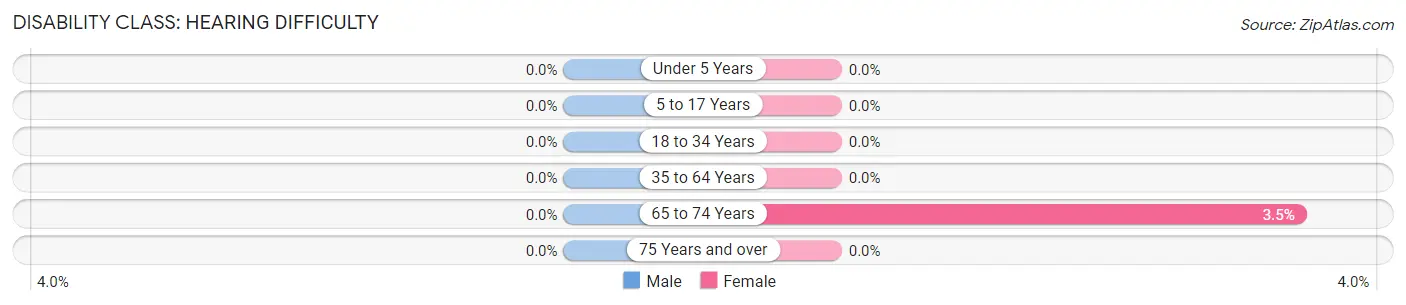
| Age Bracket | Male | Female |
| Under 5 Years | 0 (0.0%) | 0 (0.0%) |
| 5 to 17 Years | 0 (0.0%) | 0 (0.0%) |
| 18 to 34 Years | 0 (0.0%) | 0 (0.0%) |
| 35 to 64 Years | 0 (0.0%) | 0 (0.0%) |
| 65 to 74 Years | 0 (0.0%) | 1 (3.5%) |
| 75 Years and over | 0 (0.0%) | 0 (0.0%) |
Disability Class: Vision Difficulty
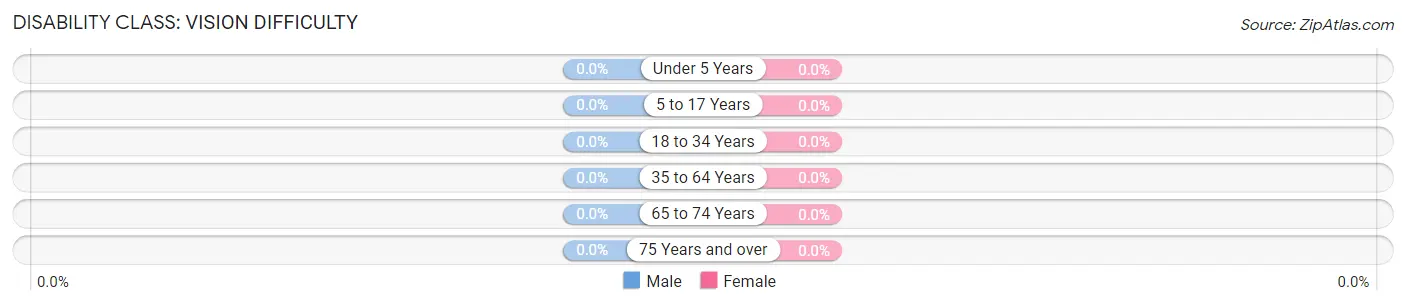
| Age Bracket | Male | Female |
| Under 5 Years | 0 (0.0%) | 0 (0.0%) |
| 5 to 17 Years | 0 (0.0%) | 0 (0.0%) |
| 18 to 34 Years | 0 (0.0%) | 0 (0.0%) |
| 35 to 64 Years | 0 (0.0%) | 0 (0.0%) |
| 65 to 74 Years | 0 (0.0%) | 0 (0.0%) |
| 75 Years and over | 0 (0.0%) | 0 (0.0%) |
Disability Class: Cognitive Difficulty

| Age Bracket | Male | Female |
| 5 to 17 Years | 0 (0.0%) | 0 (0.0%) |
| 18 to 34 Years | 0 (0.0%) | 0 (0.0%) |
| 35 to 64 Years | 3 (100.0%) | 0 (0.0%) |
| 65 to 74 Years | 0 (0.0%) | 0 (0.0%) |
| 75 Years and over | 0 (0.0%) | 0 (0.0%) |
Disability Class: Ambulatory Difficulty
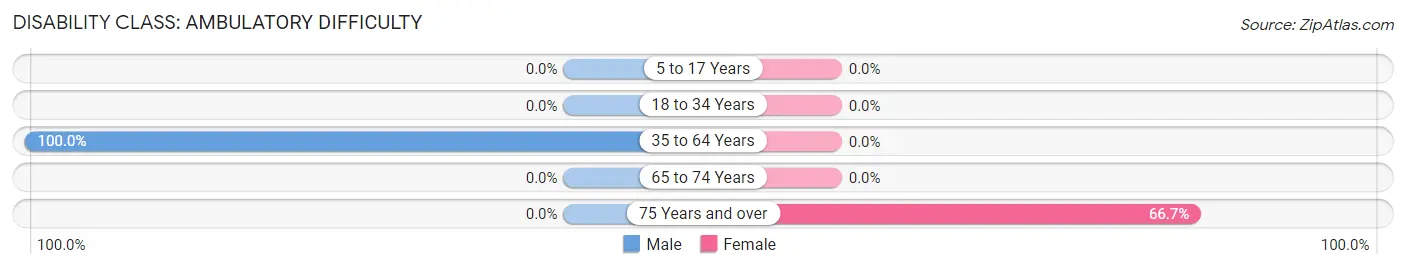
| Age Bracket | Male | Female |
| 5 to 17 Years | 0 (0.0%) | 0 (0.0%) |
| 18 to 34 Years | 0 (0.0%) | 0 (0.0%) |
| 35 to 64 Years | 3 (100.0%) | 0 (0.0%) |
| 65 to 74 Years | 0 (0.0%) | 0 (0.0%) |
| 75 Years and over | 0 (0.0%) | 16 (66.7%) |
Disability Class: Self-Care Difficulty
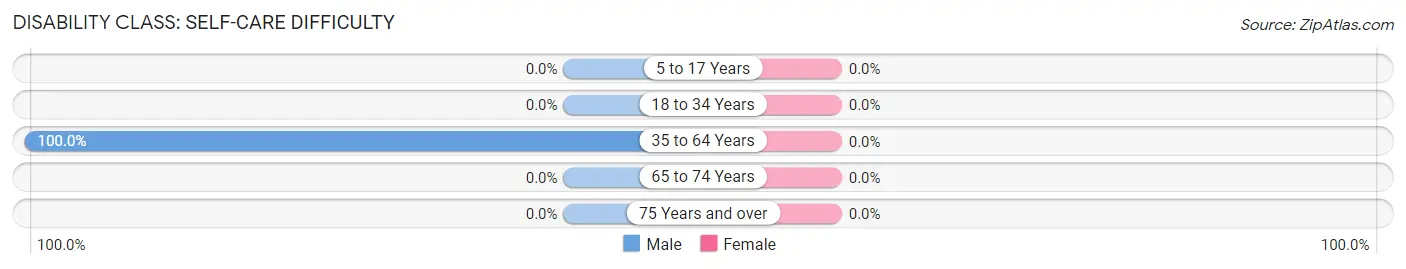
| Age Bracket | Male | Female |
| 5 to 17 Years | 0 (0.0%) | 0 (0.0%) |
| 18 to 34 Years | 0 (0.0%) | 0 (0.0%) |
| 35 to 64 Years | 3 (100.0%) | 0 (0.0%) |
| 65 to 74 Years | 0 (0.0%) | 0 (0.0%) |
| 75 Years and over | 0 (0.0%) | 0 (0.0%) |
Technology Access in Mitiwanga
Computing Device Access in Mitiwanga
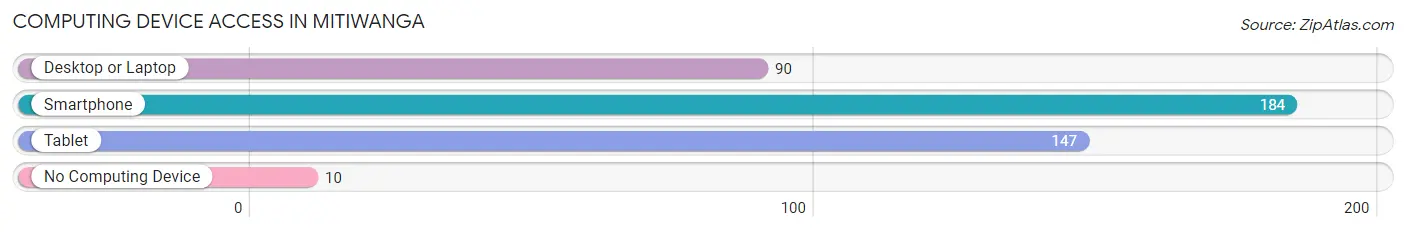
| Device Type | # Households | % Households |
| Desktop or Laptop | 90 | 46.4% |
| Smartphone | 184 | 94.9% |
| Tablet | 147 | 75.8% |
| No Computing Device | 10 | 5.1% |
| Total | 194 | 100.0% |
Internet Access in Mitiwanga
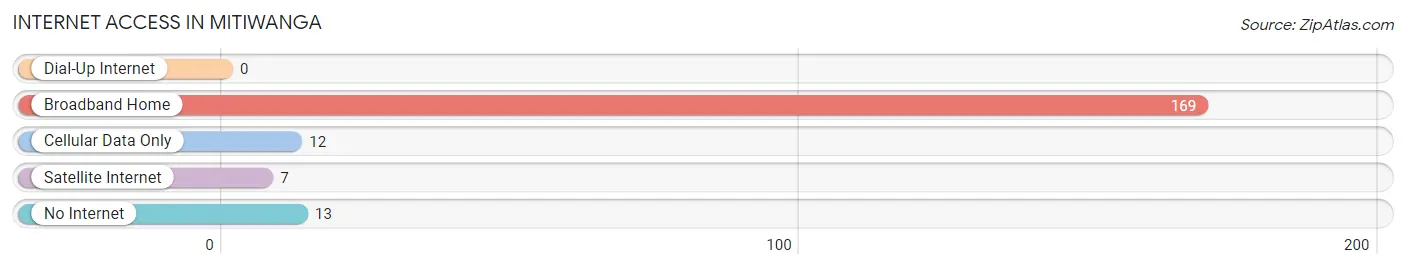
| Internet Type | # Households | % Households |
| Dial-Up Internet | 0 | 0.0% |
| Broadband Home | 169 | 87.1% |
| Cellular Data Only | 12 | 6.2% |
| Satellite Internet | 7 | 3.6% |
| No Internet | 13 | 6.7% |
| Total | 194 | 100.0% |
Mitiwanga Summary
Mitiwanga is a small village located in the state of Ohio, United States. It is situated in the northwest corner of the state, near the border of Michigan. The village is located in Ottawa County, and is part of the Port Clinton Micropolitan Statistical Area. The population of Mitiwanga was estimated to be around 1,000 people in 2020.
Geography
Mitiwanga is located in the northwest corner of Ohio, near the border of Michigan. The village is situated on the shores of Lake Erie, and is part of the Port Clinton Micropolitan Statistical Area. The village is located in Ottawa County, and is bordered by the towns of Marblehead, Port Clinton, and Oak Harbor. The village is located on the western side of the lake, and is surrounded by a number of small islands. The village is located in a rural area, and is surrounded by farmland and forests.
The climate in Mitiwanga is classified as humid continental, with hot summers and cold winters. The average temperature in the summer is around 75 degrees Fahrenheit, and the average temperature in the winter is around 25 degrees Fahrenheit. The average annual precipitation is around 40 inches.
Economy
Mitiwanga is a small village, and the economy is largely based on tourism and fishing. The village is home to a number of small businesses, including restaurants, bars, and shops. The village is also home to a number of marinas, which provide access to Lake Erie for fishing and recreational activities. The village is also home to a number of small farms, which produce a variety of crops, including corn, soybeans, and wheat.
Demographics
The population of Mitiwanga was estimated to be around 1,000 people in 2020. The population is largely white, with a small percentage of African Americans and Native Americans. The median household income in the village is around $45,000, and the median home value is around $150,000. The village is served by the Port Clinton City School District.
Conclusion
Mitiwanga is a small village located in the northwest corner of Ohio, near the border of Michigan. The village is situated on the shores of Lake Erie, and is part of the Port Clinton Micropolitan Statistical Area. The population of Mitiwanga was estimated to be around 1,000 people in 2020. The economy of the village is largely based on tourism and fishing, and the village is home to a number of small businesses. The population is largely white, with a small percentage of African Americans and Native Americans. The median household income in the village is around $45,000, and the median home value is around $150,000. The village is served by the Port Clinton City School District.
Common Questions
What is Per Capita Income in Mitiwanga?
Per Capita income in Mitiwanga is $57,660.
What is the Median Family Income in Mitiwanga?
Median Family Income in Mitiwanga is $73,777.
What is the Median Household income in Mitiwanga?
Median Household Income in Mitiwanga is $73,626.
What is Income or Wage Gap in Mitiwanga?
Income or Wage Gap in Mitiwanga is 25.3%.
Women in Mitiwanga earn 74.7 cents for every dollar earned by a man.
What is Inequality or Gini Index in Mitiwanga?
Inequality or Gini Index in Mitiwanga is 0.25.
What is the Total Population of Mitiwanga?
Total Population of Mitiwanga is 249.
What is the Total Male Population of Mitiwanga?
Total Male Population of Mitiwanga is 82.
What is the Total Female Population of Mitiwanga?
Total Female Population of Mitiwanga is 167.
What is the Ratio of Males per 100 Females in Mitiwanga?
There are 49.10 Males per 100 Females in Mitiwanga.
What is the Ratio of Females per 100 Males in Mitiwanga?
There are 203.66 Females per 100 Males in Mitiwanga.
What is the Median Population Age in Mitiwanga?
Median Population Age in Mitiwanga is 57.9 Years.
What is the Average Family Size in Mitiwanga
Average Family Size in Mitiwanga is 1.4 People.
What is the Average Household Size in Mitiwanga
Average Household Size in Mitiwanga is 1.3 People.
How Large is the Labor Force in Mitiwanga?
There are 180 People in the Labor Forcein in Mitiwanga.
What is the Percentage of People in the Labor Force in Mitiwanga?
72.3% of People are in the Labor Force in Mitiwanga.