Mason, OH Map & Demographics
Mason Map
Mason Overview
$58,876
PER CAPITA INCOME
$140,991
AVG FAMILY INCOME
$121,082
AVG HOUSEHOLD INCOME
51.2%
WAGE / INCOME GAP [ % ]
48.8¢/ $1
WAGE / INCOME GAP [ $ ]
0.42
INEQUALITY / GINI INDEX
34,768
TOTAL POPULATION
17,414
MALE POPULATION
17,354
FEMALE POPULATION
100.35
MALES / 100 FEMALES
99.66
FEMALES / 100 MALES
41.7
MEDIAN AGE
3.1
AVG FAMILY SIZE
2.7
AVG HOUSEHOLD SIZE
18,331
LABOR FORCE [ PEOPLE ]
67.4%
PERCENT IN LABOR FORCE
1.8%
UNEMPLOYMENT RATE
Mason Zip Codes
Mason Area Codes
Income in Mason
Income Overview in Mason
Per Capita Income in Mason is $58,876, while median incomes of families and households are $140,991 and $121,082 respectively.
| Characteristic | Number | Measure |
| Per Capita Income | 34,768 | $58,876 |
| Median Family Income | 9,782 | $140,991 |
| Mean Family Income | 9,782 | $176,146 |
| Median Household Income | 12,670 | $121,082 |
| Mean Household Income | 12,670 | $158,269 |
| Income Deficit | 9,782 | $0 |
| Wage / Income Gap (%) | 34,768 | 51.24% |
| Wage / Income Gap ($) | 34,768 | 48.76¢ per $1 |
| Gini / Inequality Index | 34,768 | 0.42 |
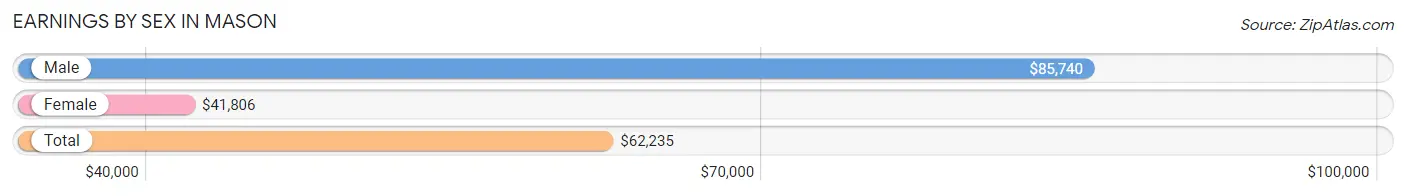
Earnings by Sex in Mason
Average Earnings in Mason are $62,235, $85,740 for men and $41,806 for women, a difference of 51.2%.
| Sex | Number | Average Earnings |
| Male | 9,875 (50.7%) | $85,740 |
| Female | 9,590 (49.3%) | $41,806 |
| Total | 19,465 (100.0%) | $62,235 |
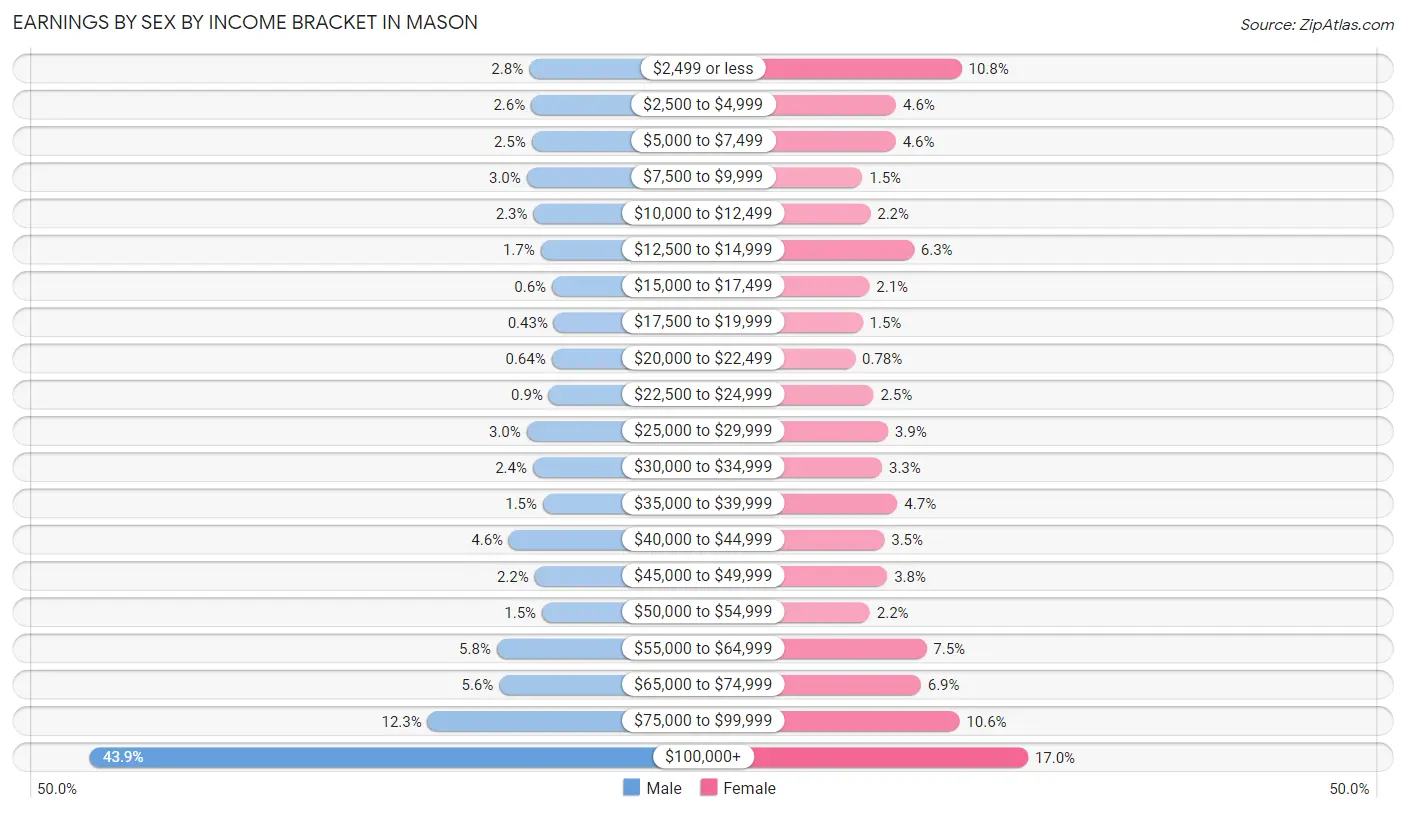
Earnings by Sex by Income Bracket in Mason
The most common earnings brackets in Mason are $100,000+ for men (4,331 | 43.9%) and $100,000+ for women (1,627 | 17.0%).
| Income | Male | Female |
| $2,499 or less | 272 (2.8%) | 1,031 (10.7%) |
| $2,500 to $4,999 | 253 (2.6%) | 443 (4.6%) |
| $5,000 to $7,499 | 248 (2.5%) | 439 (4.6%) |
| $7,500 to $9,999 | 293 (3.0%) | 140 (1.5%) |
| $10,000 to $12,499 | 231 (2.3%) | 211 (2.2%) |
| $12,500 to $14,999 | 165 (1.7%) | 602 (6.3%) |
| $15,000 to $17,499 | 59 (0.6%) | 202 (2.1%) |
| $17,500 to $19,999 | 42 (0.4%) | 142 (1.5%) |
| $20,000 to $22,499 | 63 (0.6%) | 75 (0.8%) |
| $22,500 to $24,999 | 89 (0.9%) | 240 (2.5%) |
| $25,000 to $29,999 | 293 (3.0%) | 369 (3.8%) |
| $30,000 to $34,999 | 236 (2.4%) | 316 (3.3%) |
| $35,000 to $39,999 | 143 (1.5%) | 455 (4.7%) |
| $40,000 to $44,999 | 457 (4.6%) | 337 (3.5%) |
| $45,000 to $49,999 | 220 (2.2%) | 363 (3.8%) |
| $50,000 to $54,999 | 152 (1.5%) | 207 (2.2%) |
| $55,000 to $64,999 | 570 (5.8%) | 714 (7.4%) |
| $65,000 to $74,999 | 548 (5.6%) | 665 (6.9%) |
| $75,000 to $99,999 | 1,210 (12.2%) | 1,012 (10.5%) |
| $100,000+ | 4,331 (43.9%) | 1,627 (17.0%) |
| Total | 9,875 (100.0%) | 9,590 (100.0%) |
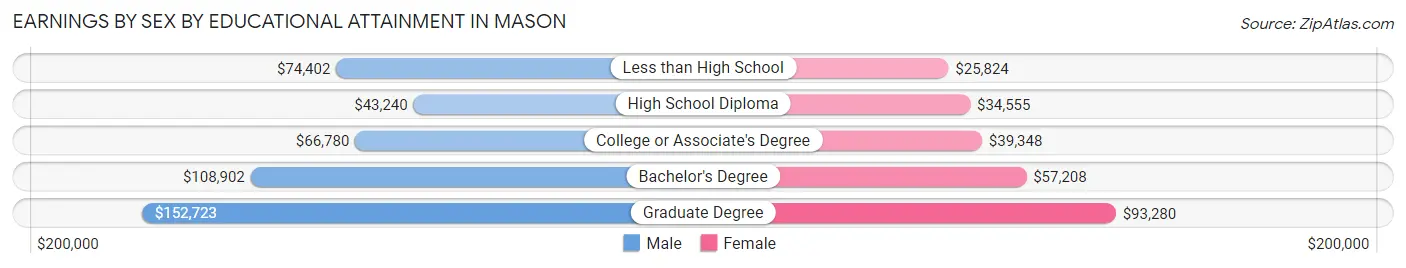
Earnings by Sex by Educational Attainment in Mason
Average earnings in Mason are $98,316 for men and $54,720 for women, a difference of 44.3%. Men with an educational attainment of graduate degree enjoy the highest average annual earnings of $152,723, while those with high school diploma education earn the least with $43,240. Women with an educational attainment of graduate degree earn the most with the average annual earnings of $93,280, while those with less than high school education have the smallest earnings of $25,824.
| Educational Attainment | Male Income | Female Income |
| Less than High School | $74,402 | $25,824 |
| High School Diploma | $43,240 | $34,555 |
| College or Associate's Degree | $66,780 | $39,348 |
| Bachelor's Degree | $108,902 | $57,208 |
| Graduate Degree | $152,723 | $93,280 |
| Total | $98,316 | $54,720 |
Family Income in Mason
Family Income Brackets in Mason
According to the Mason family income data, there are 3,512 families falling into the $200,000+ income range, which is the most common income bracket and makes up 35.9% of all families. Conversely, the $10,000 to $14,999 income bracket is the least frequent group with only 59 families (0.6%) belonging to this category.
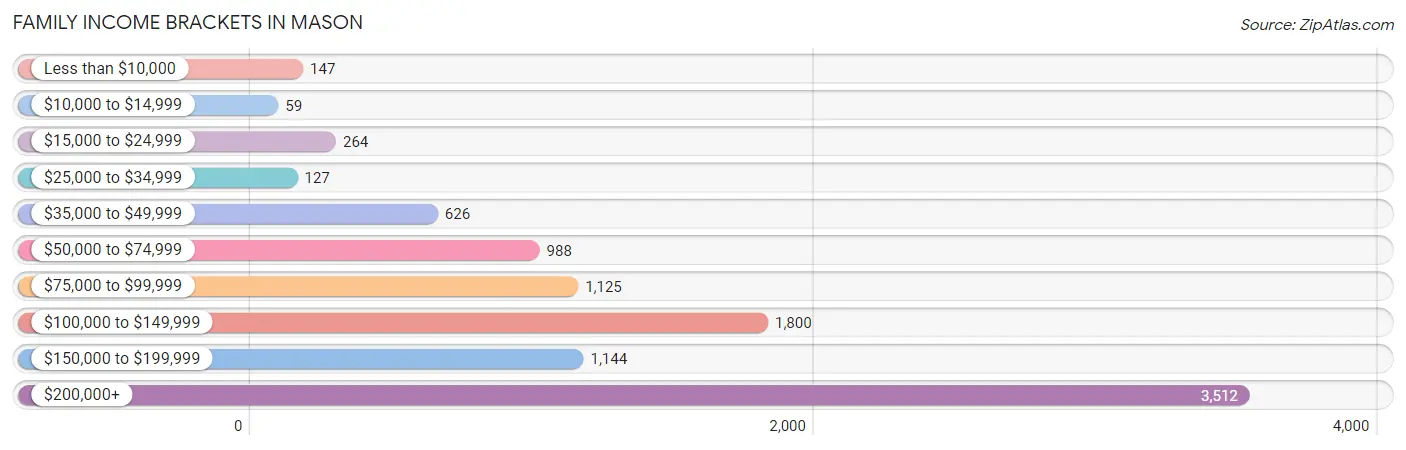
| Income Bracket | # Families | % Families |
| Less than $10,000 | 147 | 1.5% |
| $10,000 to $14,999 | 59 | 0.6% |
| $15,000 to $24,999 | 264 | 2.7% |
| $25,000 to $34,999 | 127 | 1.3% |
| $35,000 to $49,999 | 626 | 6.4% |
| $50,000 to $74,999 | 988 | 10.1% |
| $75,000 to $99,999 | 1,125 | 11.5% |
| $100,000 to $149,999 | 1,800 | 18.4% |
| $150,000 to $199,999 | 1,144 | 11.7% |
| $200,000+ | 3,512 | 35.9% |
Family Income by Famaliy Size in Mason
4-person families (2,359 | 24.1%) account for the highest median family income in Mason with $185,329 per family, while 2-person families (4,293 | 43.9%) have the highest median income of $52,408 per family member.
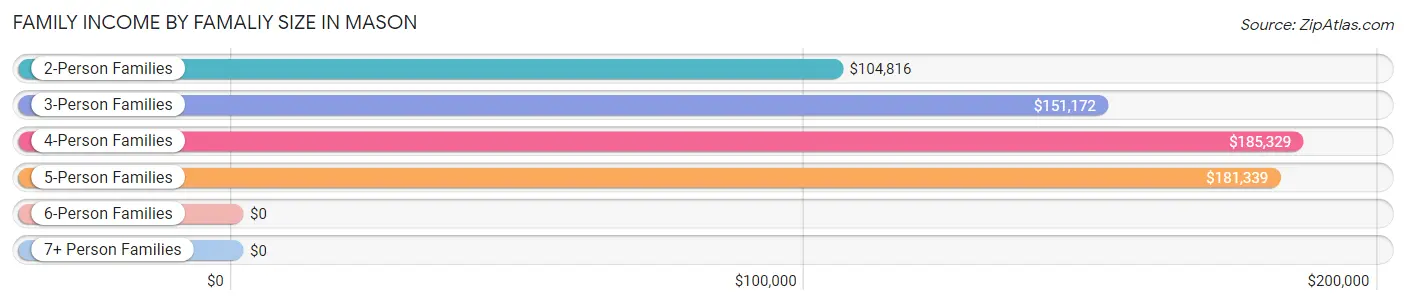
| Income Bracket | # Families | Median Income |
| 2-Person Families | 4,293 (43.9%) | $104,816 |
| 3-Person Families | 1,845 (18.9%) | $151,172 |
| 4-Person Families | 2,359 (24.1%) | $185,329 |
| 5-Person Families | 821 (8.4%) | $181,339 |
| 6-Person Families | 453 (4.6%) | $0 |
| 7+ Person Families | 11 (0.1%) | $0 |
| Total | 9,782 (100.0%) | $140,991 |
Family Income by Number of Earners in Mason
The median family income in Mason is $140,991, with families comprising 3+ earners (1,298) having the highest median family income of $223,167, while families with no earners (1,021) have the lowest median family income of $54,087, accounting for 13.3% and 10.4% of families, respectively.
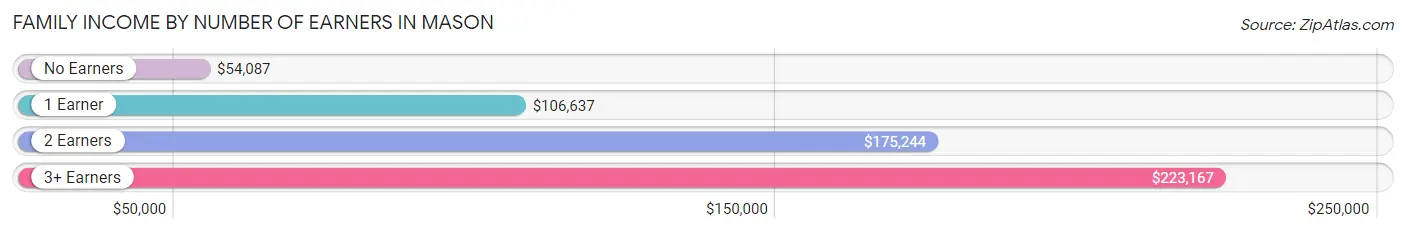
| Number of Earners | # Families | Median Income |
| No Earners | 1,021 (10.4%) | $54,087 |
| 1 Earner | 2,485 (25.4%) | $106,637 |
| 2 Earners | 4,978 (50.9%) | $175,244 |
| 3+ Earners | 1,298 (13.3%) | $223,167 |
| Total | 9,782 (100.0%) | $140,991 |
Household Income in Mason
Household Income Brackets in Mason
With 3,826 households falling in the category, the $200,000+ income range is the most frequent in Mason, accounting for 30.2% of all households. In contrast, only 165 households (1.3%) fall into the $10,000 to $14,999 income bracket, making it the least populous group.
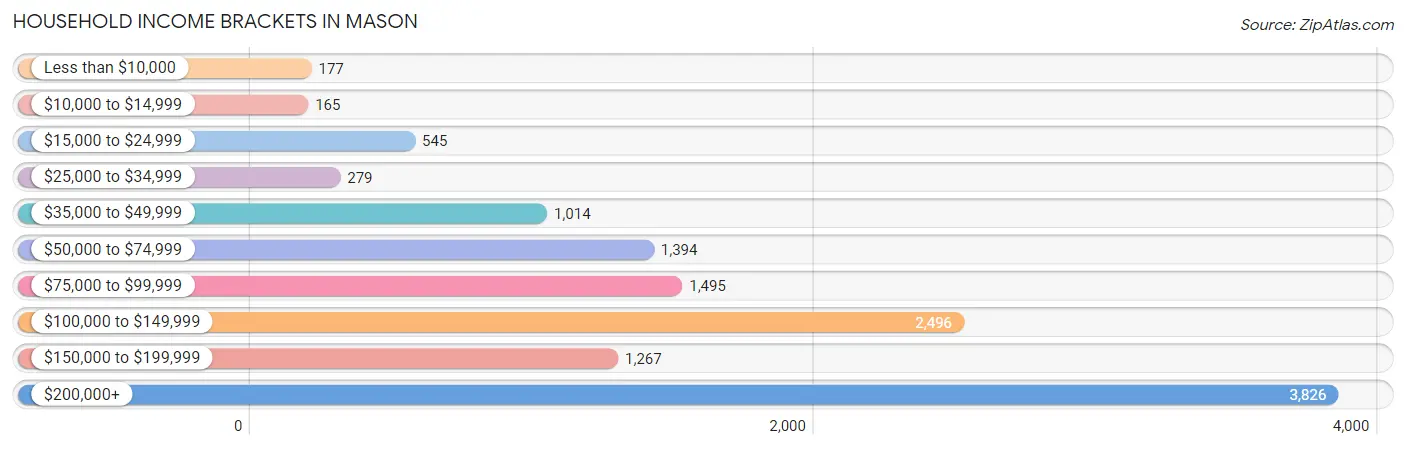
| Income Bracket | # Households | % Households |
| Less than $10,000 | 177 | 1.4% |
| $10,000 to $14,999 | 165 | 1.3% |
| $15,000 to $24,999 | 545 | 4.3% |
| $25,000 to $34,999 | 279 | 2.2% |
| $35,000 to $49,999 | 1,014 | 8.0% |
| $50,000 to $74,999 | 1,394 | 11.0% |
| $75,000 to $99,999 | 1,495 | 11.8% |
| $100,000 to $149,999 | 2,496 | 19.7% |
| $150,000 to $199,999 | 1,267 | 10.0% |
| $200,000+ | 3,826 | 30.2% |
Household Income by Householder Age in Mason
The median household income in Mason is $121,082, with the highest median household income of $161,122 found in the 45 to 64 years age bracket for the primary householder. A total of 6,080 households (48.0%) fall into this category. Meanwhile, the 15 to 24 years age bracket for the primary householder has the lowest median household income of $0, with 19 households (0.2%) in this group.
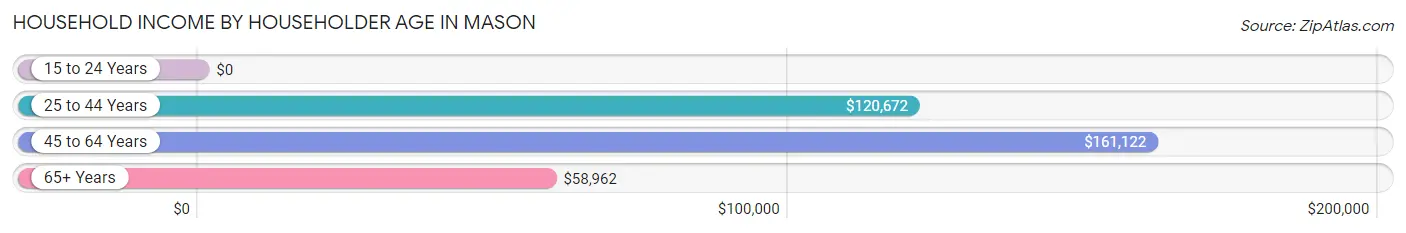
| Income Bracket | # Households | Median Income |
| 15 to 24 Years | 19 (0.2%) | $0 |
| 25 to 44 Years | 3,868 (30.5%) | $120,672 |
| 45 to 64 Years | 6,080 (48.0%) | $161,122 |
| 65+ Years | 2,703 (21.3%) | $58,962 |
| Total | 12,670 (100.0%) | $121,082 |
Poverty in Mason
Income Below Poverty by Sex and Age in Mason
With 2.6% poverty level for males and 5.0% for females among the residents of Mason, 15 year old males and 16 and 17 year old females are the most vulnerable to poverty, with 55 males (15.0%) and 55 females (8.4%) in their respective age groups living below the poverty level.
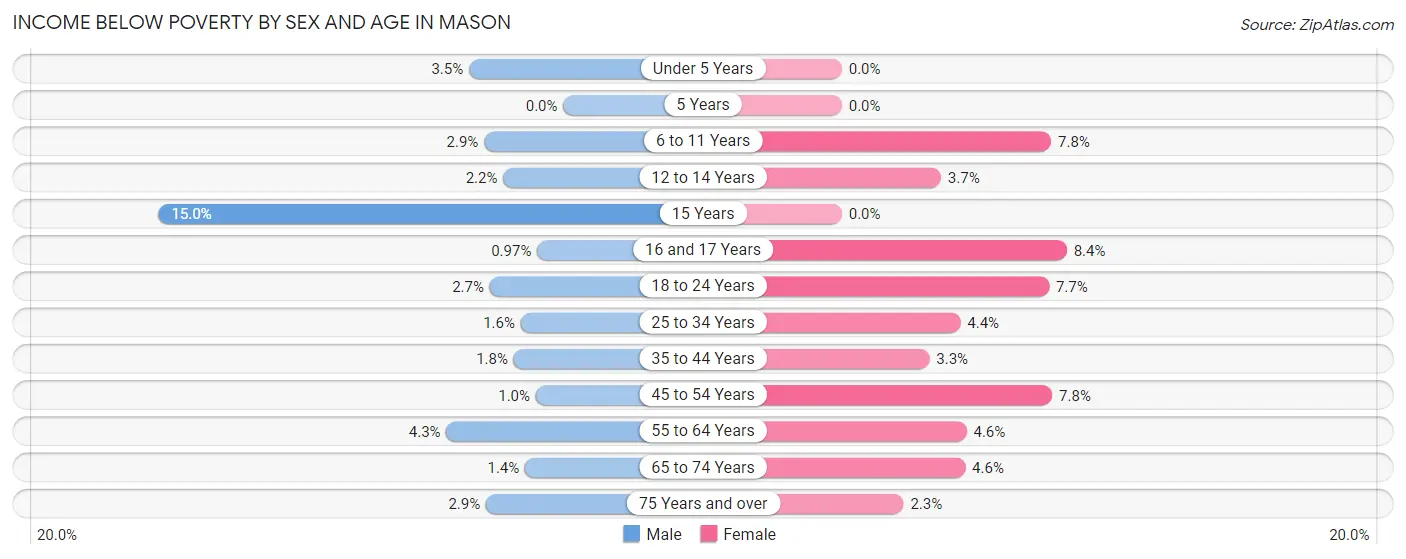
| Age Bracket | Male | Female |
| Under 5 Years | 38 (3.5%) | 0 (0.0%) |
| 5 Years | 0 (0.0%) | 0 (0.0%) |
| 6 to 11 Years | 54 (2.9%) | 101 (7.8%) |
| 12 to 14 Years | 25 (2.2%) | 30 (3.7%) |
| 15 Years | 55 (15.0%) | 0 (0.0%) |
| 16 and 17 Years | 7 (1.0%) | 55 (8.4%) |
| 18 to 24 Years | 30 (2.7%) | 101 (7.7%) |
| 25 to 34 Years | 17 (1.6%) | 77 (4.4%) |
| 35 to 44 Years | 49 (1.8%) | 87 (3.3%) |
| 45 to 54 Years | 26 (1.0%) | 209 (7.8%) |
| 55 to 64 Years | 111 (4.3%) | 121 (4.6%) |
| 65 to 74 Years | 14 (1.4%) | 50 (4.6%) |
| 75 Years and over | 31 (2.9%) | 32 (2.3%) |
| Total | 457 (2.6%) | 863 (5.0%) |
Income Above Poverty by Sex and Age in Mason
According to the poverty statistics in Mason, males aged 5 years and females aged under 5 years are the age groups that are most secure financially, with 100.0% of males and 100.0% of females in these age groups living above the poverty line.
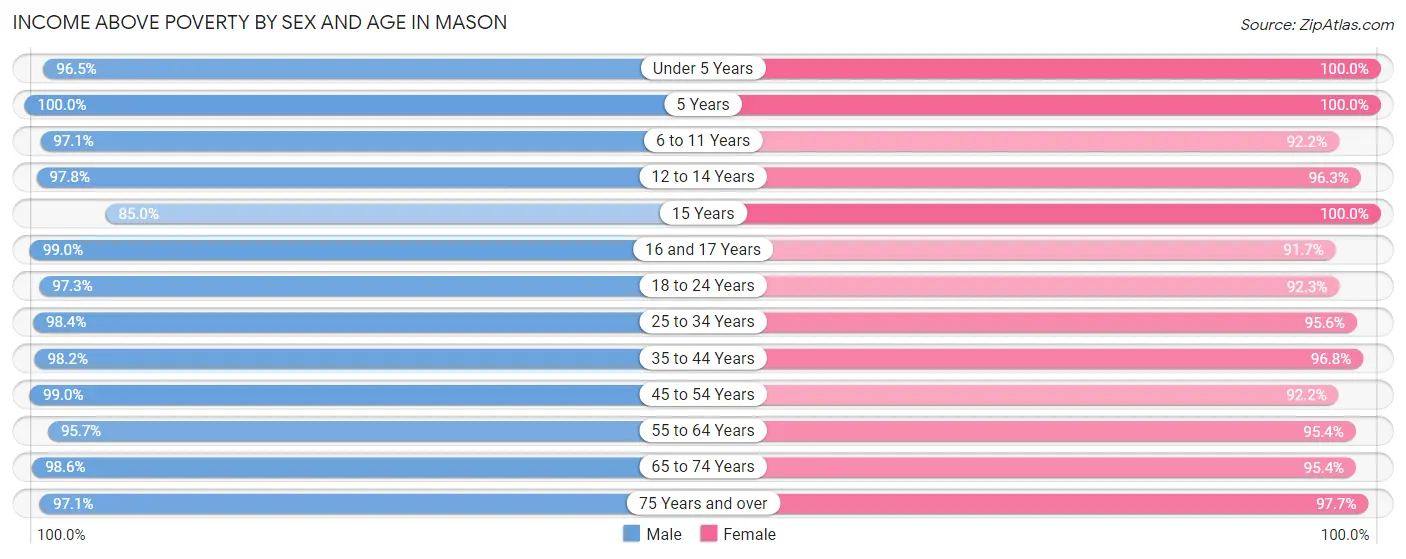
| Age Bracket | Male | Female |
| Under 5 Years | 1,047 (96.5%) | 552 (100.0%) |
| 5 Years | 145 (100.0%) | 85 (100.0%) |
| 6 to 11 Years | 1,783 (97.1%) | 1,199 (92.2%) |
| 12 to 14 Years | 1,094 (97.8%) | 785 (96.3%) |
| 15 Years | 311 (85.0%) | 254 (100.0%) |
| 16 and 17 Years | 714 (99.0%) | 604 (91.6%) |
| 18 to 24 Years | 1,069 (97.3%) | 1,212 (92.3%) |
| 25 to 34 Years | 1,060 (98.4%) | 1,674 (95.6%) |
| 35 to 44 Years | 2,618 (98.2%) | 2,594 (96.8%) |
| 45 to 54 Years | 2,511 (99.0%) | 2,466 (92.2%) |
| 55 to 64 Years | 2,448 (95.7%) | 2,490 (95.4%) |
| 65 to 74 Years | 973 (98.6%) | 1,042 (95.4%) |
| 75 Years and over | 1,051 (97.1%) | 1,366 (97.7%) |
| Total | 16,824 (97.4%) | 16,323 (95.0%) |
Income Below Poverty Among Married-Couple Families in Mason
The poverty statistics for married-couple families in Mason show that 2.1% or 169 of the total 8,234 families live below the poverty line. Families with 1 or 2 children have the highest poverty rate of 2.6%, comprising of 80 families. On the other hand, families with 5 or more children have the lowest poverty rate of 0.0%, which includes 0 families.
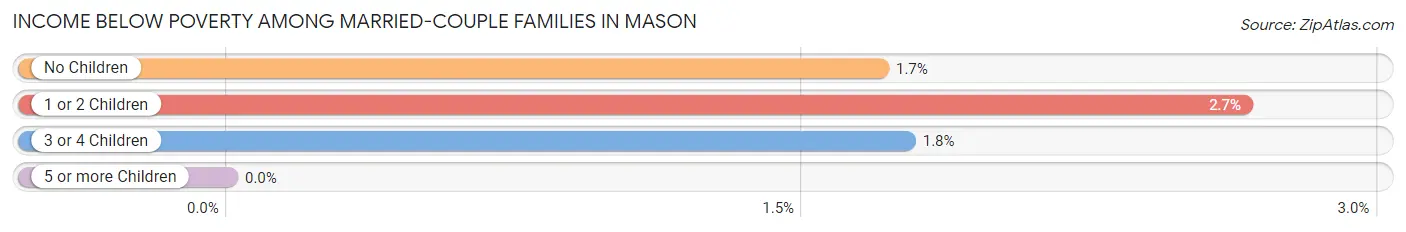
| Children | Above Poverty | Below Poverty |
| No Children | 4,223 (98.3%) | 73 (1.7%) |
| 1 or 2 Children | 2,943 (97.4%) | 80 (2.6%) |
| 3 or 4 Children | 888 (98.2%) | 16 (1.8%) |
| 5 or more Children | 11 (100.0%) | 0 (0.0%) |
| Total | 8,065 (98.0%) | 169 (2.1%) |
Income Below Poverty Among Single-Parent Households in Mason
According to the poverty data in Mason, 1.7% or 8 single-father households and 17.5% or 186 single-mother households are living below the poverty line. Among single-father households, those with no children have the highest poverty rate, with 8 households (4.2%) experiencing poverty. Likewise, among single-mother households, those with 1 or 2 children have the highest poverty rate, with 147 households (22.6%) falling below the poverty line.
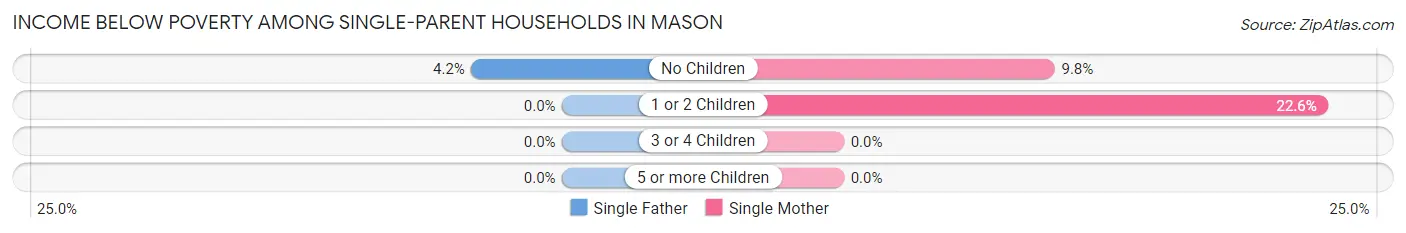
| Children | Single Father | Single Mother |
| No Children | 8 (4.2%) | 39 (9.8%) |
| 1 or 2 Children | 0 (0.0%) | 147 (22.6%) |
| 3 or 4 Children | 0 (0.0%) | 0 (0.0%) |
| 5 or more Children | 0 (0.0%) | 0 (0.0%) |
| Total | 8 (1.7%) | 186 (17.5%) |
Income Below Poverty Among Married-Couple vs Single-Parent Households in Mason
The poverty data for Mason shows that 169 of the married-couple family households (2.1%) and 194 of the single-parent households (12.5%) are living below the poverty level. Within the married-couple family households, those with 1 or 2 children have the highest poverty rate, with 80 households (2.6%) falling below the poverty line. Among the single-parent households, those with 1 or 2 children have the highest poverty rate, with 147 household (16.7%) living below poverty.
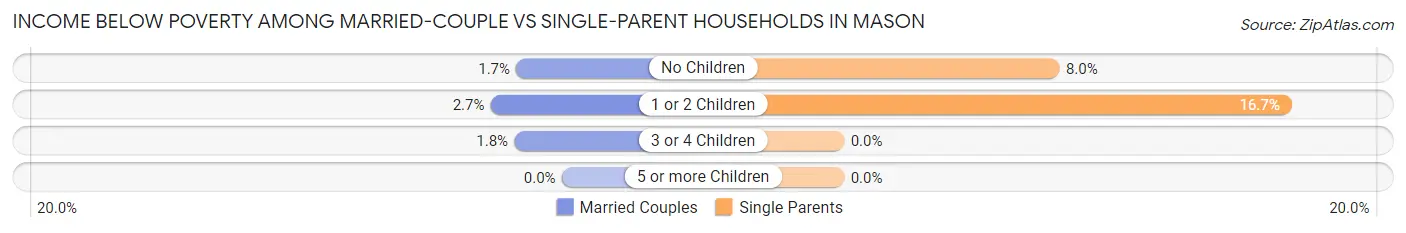
| Children | Married-Couple Families | Single-Parent Households |
| No Children | 73 (1.7%) | 47 (8.0%) |
| 1 or 2 Children | 80 (2.6%) | 147 (16.7%) |
| 3 or 4 Children | 16 (1.8%) | 0 (0.0%) |
| 5 or more Children | 0 (0.0%) | 0 (0.0%) |
| Total | 169 (2.1%) | 194 (12.5%) |
Race in Mason
The most populous races in Mason are White / Caucasian (26,232 | 75.4%), Asian (5,137 | 14.8%), and Black / African American (1,765 | 5.1%).
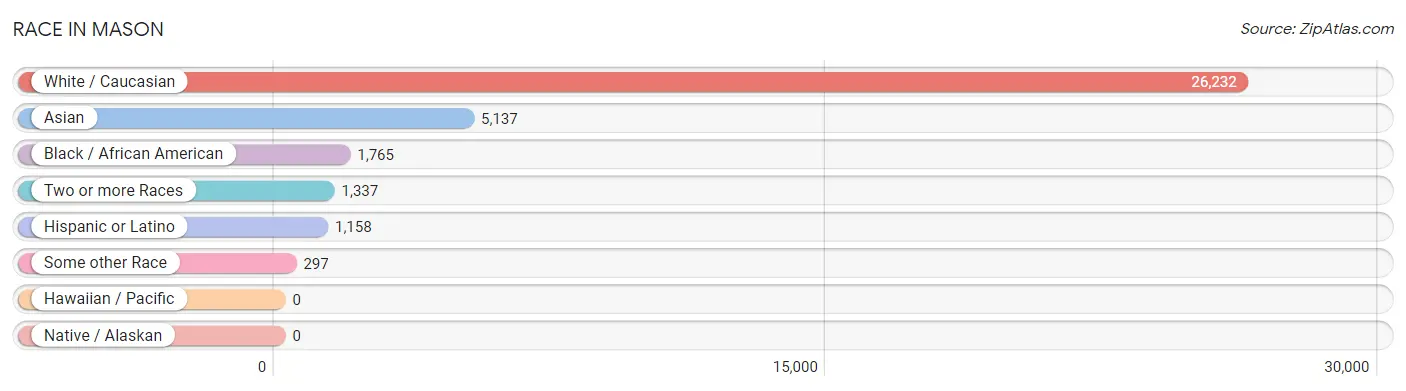
| Race | # Population | % Population |
| Asian | 5,137 | 14.8% |
| Black / African American | 1,765 | 5.1% |
| Hawaiian / Pacific | 0 | 0.0% |
| Hispanic or Latino | 1,158 | 3.3% |
| Native / Alaskan | 0 | 0.0% |
| White / Caucasian | 26,232 | 75.4% |
| Two or more Races | 1,337 | 3.8% |
| Some other Race | 297 | 0.9% |
| Total | 34,768 | 100.0% |
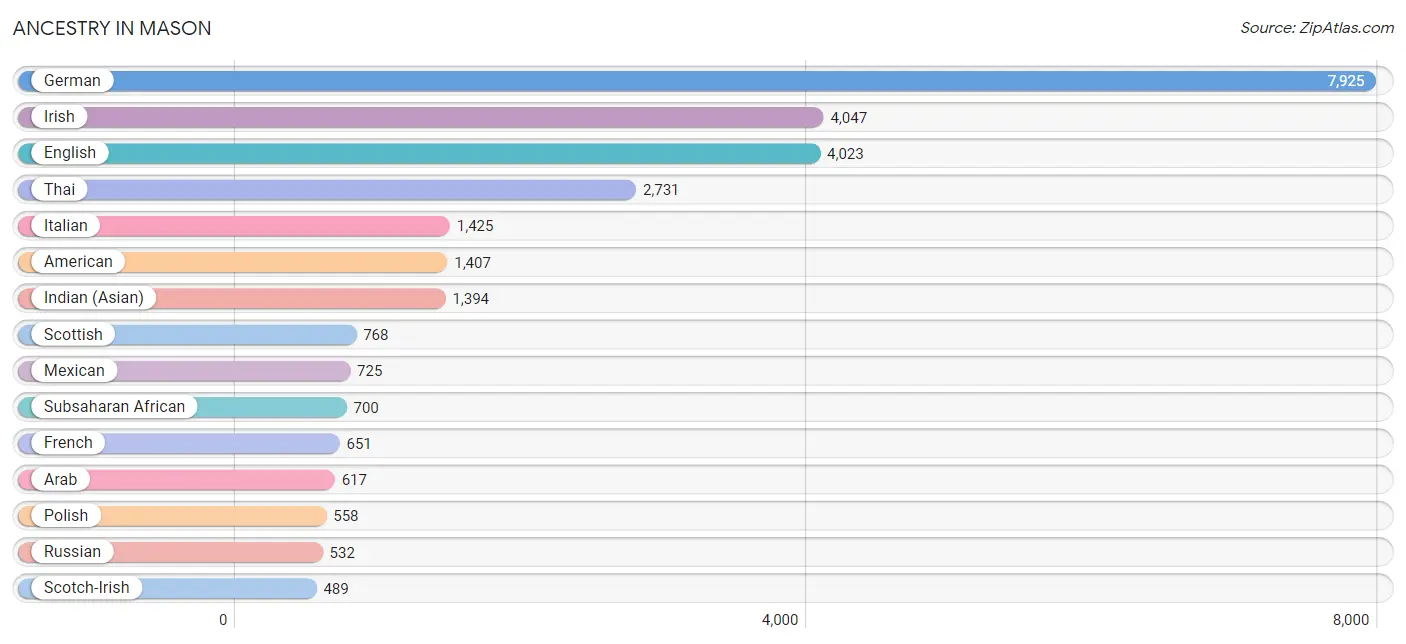
Ancestry in Mason
The most populous ancestries reported in Mason are German (7,925 | 22.8%), Irish (4,047 | 11.6%), English (4,023 | 11.6%), Thai (2,731 | 7.9%), and Italian (1,425 | 4.1%), together accounting for 58.0% of all Mason residents.
| Ancestry | # Population | % Population |
| African | 395 | 1.1% |
| American | 1,407 | 4.1% |
| Arab | 617 | 1.8% |
| Armenian | 27 | 0.1% |
| Belgian | 92 | 0.3% |
| Bhutanese | 190 | 0.5% |
| Blackfeet | 26 | 0.1% |
| Brazilian | 48 | 0.1% |
| British | 171 | 0.5% |
| Burmese | 356 | 1.0% |
| Cambodian | 32 | 0.1% |
| Canadian | 59 | 0.2% |
| Central American | 55 | 0.2% |
| Cherokee | 14 | 0.0% |
| Chilean | 141 | 0.4% |
| Colombian | 36 | 0.1% |
| Croatian | 61 | 0.2% |
| Czech | 52 | 0.2% |
| Czechoslovakian | 6 | 0.0% |
| Danish | 68 | 0.2% |
| Dominican | 21 | 0.1% |
| Dutch | 303 | 0.9% |
| Eastern European | 72 | 0.2% |
| Egyptian | 29 | 0.1% |
| English | 4,023 | 11.6% |
| European | 346 | 1.0% |
| Filipino | 22 | 0.1% |
| French | 651 | 1.9% |
| French Canadian | 105 | 0.3% |
| German | 7,925 | 22.8% |
| Ghanaian | 32 | 0.1% |
| Greek | 111 | 0.3% |
| Hungarian | 275 | 0.8% |
| Indian (Asian) | 1,394 | 4.0% |
| Iranian | 72 | 0.2% |
| Irish | 4,047 | 11.6% |
| Italian | 1,425 | 4.1% |
| Jordanian | 128 | 0.4% |
| Korean | 189 | 0.5% |
| Laotian | 28 | 0.1% |
| Lebanese | 62 | 0.2% |
| Lithuanian | 44 | 0.1% |
| Mexican | 725 | 2.1% |
| Moroccan | 18 | 0.1% |
| Nigerian | 165 | 0.5% |
| Northern European | 272 | 0.8% |
| Norwegian | 38 | 0.1% |
| Pakistani | 17 | 0.1% |
| Palestinian | 38 | 0.1% |
| Panamanian | 11 | 0.0% |
| Polish | 558 | 1.6% |
| Portuguese | 16 | 0.1% |
| Puerto Rican | 180 | 0.5% |
| Romanian | 12 | 0.0% |
| Russian | 532 | 1.5% |
| Salvadoran | 44 | 0.1% |
| Scandinavian | 64 | 0.2% |
| Scotch-Irish | 489 | 1.4% |
| Scottish | 768 | 2.2% |
| Sioux | 15 | 0.0% |
| Slavic | 12 | 0.0% |
| Slovak | 59 | 0.2% |
| Slovene | 113 | 0.3% |
| South African | 108 | 0.3% |
| South American | 177 | 0.5% |
| Sri Lankan | 124 | 0.4% |
| Subsaharan African | 700 | 2.0% |
| Swedish | 294 | 0.9% |
| Swiss | 139 | 0.4% |
| Syrian | 11 | 0.0% |
| Thai | 2,731 | 7.9% |
| Turkish | 40 | 0.1% |
| Ukrainian | 258 | 0.7% |
| Welsh | 458 | 1.3% |
| Yugoslavian | 22 | 0.1% | View All 75 Rows |
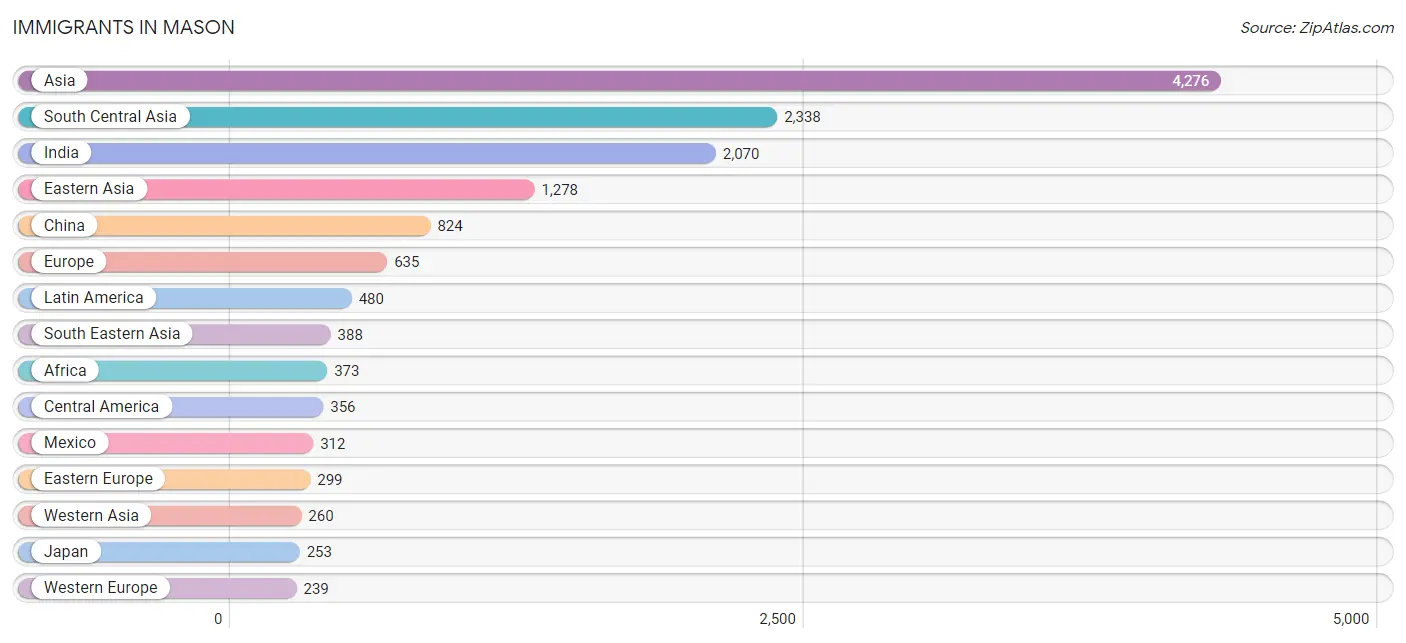
Immigrants in Mason
The most numerous immigrant groups reported in Mason came from Asia (4,276 | 12.3%), South Central Asia (2,338 | 6.7%), India (2,070 | 5.9%), Eastern Asia (1,278 | 3.7%), and China (824 | 2.4%), together accounting for 31.0% of all Mason residents.
| Immigration Origin | # Population | % Population |
| Africa | 373 | 1.1% |
| Asia | 4,276 | 12.3% |
| Belgium | 105 | 0.3% |
| Brazil | 16 | 0.1% |
| Canada | 43 | 0.1% |
| Caribbean | 21 | 0.1% |
| Central America | 356 | 1.0% |
| China | 824 | 2.4% |
| Colombia | 36 | 0.1% |
| Dominican Republic | 21 | 0.1% |
| Eastern Africa | 50 | 0.1% |
| Eastern Asia | 1,278 | 3.7% |
| Eastern Europe | 299 | 0.9% |
| Egypt | 53 | 0.2% |
| El Salvador | 44 | 0.1% |
| England | 35 | 0.1% |
| Europe | 635 | 1.8% |
| Germany | 56 | 0.2% |
| Ghana | 16 | 0.1% |
| Greece | 27 | 0.1% |
| Hong Kong | 21 | 0.1% |
| India | 2,070 | 5.9% |
| Indonesia | 39 | 0.1% |
| Iran | 91 | 0.3% |
| Japan | 253 | 0.7% |
| Jordan | 160 | 0.5% |
| Korea | 184 | 0.5% |
| Kuwait | 45 | 0.1% |
| Latin America | 480 | 1.4% |
| Lebanon | 13 | 0.0% |
| Malaysia | 111 | 0.3% |
| Mexico | 312 | 0.9% |
| Morocco | 18 | 0.1% |
| Nepal | 20 | 0.1% |
| Netherlands | 78 | 0.2% |
| Nigeria | 104 | 0.3% |
| Northern Africa | 109 | 0.3% |
| Northern Europe | 70 | 0.2% |
| Pakistan | 102 | 0.3% |
| Peru | 51 | 0.2% |
| Philippines | 140 | 0.4% |
| Russia | 209 | 0.6% |
| Saudi Arabia | 17 | 0.1% |
| South Africa | 72 | 0.2% |
| South America | 103 | 0.3% |
| South Central Asia | 2,338 | 6.7% |
| South Eastern Asia | 388 | 1.1% |
| Southern Europe | 27 | 0.1% |
| Sudan | 38 | 0.1% |
| Syria | 25 | 0.1% |
| Taiwan | 22 | 0.1% |
| Thailand | 17 | 0.1% |
| Ukraine | 90 | 0.3% |
| Vietnam | 81 | 0.2% |
| Western Africa | 120 | 0.4% |
| Western Asia | 260 | 0.7% |
| Western Europe | 239 | 0.7% | View All 57 Rows |
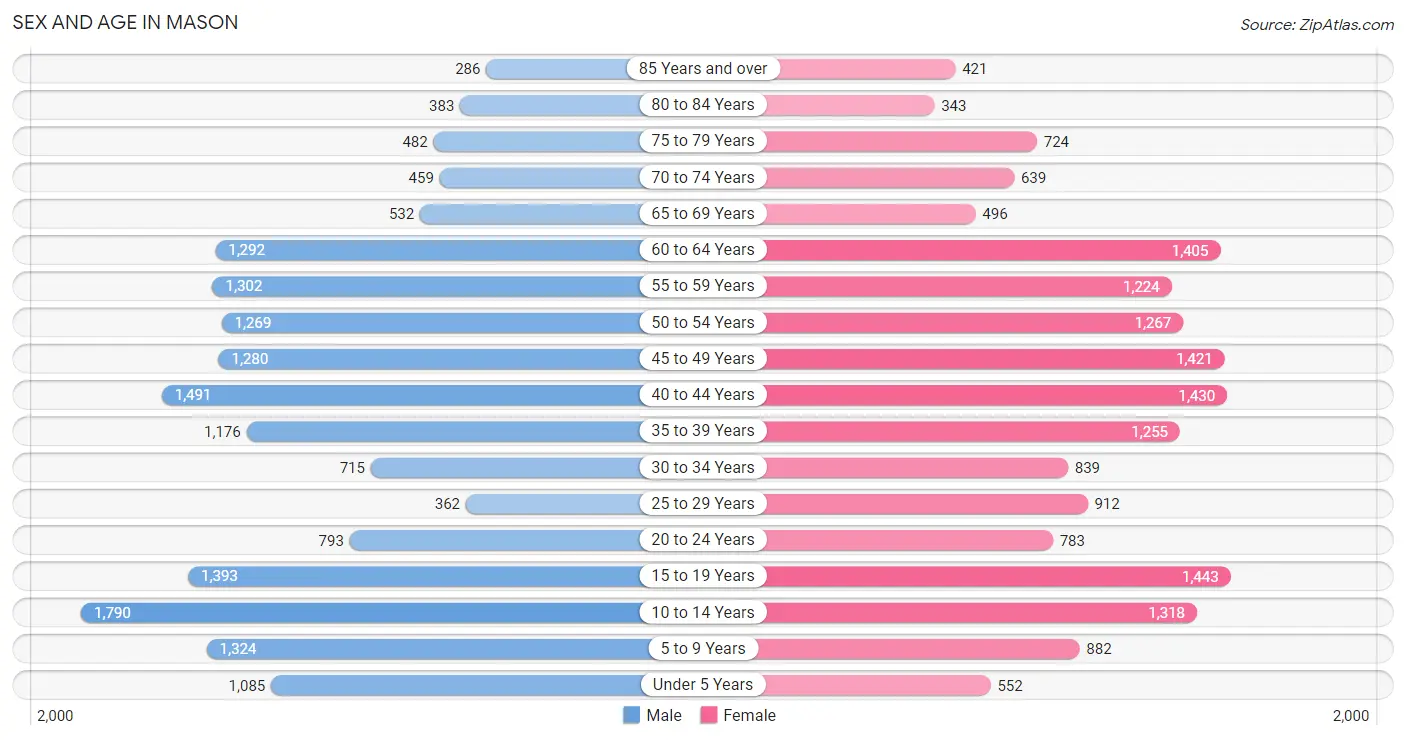
Sex and Age in Mason
Sex and Age in Mason
The most populous age groups in Mason are 10 to 14 Years (1,790 | 10.3%) for men and 15 to 19 Years (1,443 | 8.3%) for women.
| Age Bracket | Male | Female |
| Under 5 Years | 1,085 (6.2%) | 552 (3.2%) |
| 5 to 9 Years | 1,324 (7.6%) | 882 (5.1%) |
| 10 to 14 Years | 1,790 (10.3%) | 1,318 (7.6%) |
| 15 to 19 Years | 1,393 (8.0%) | 1,443 (8.3%) |
| 20 to 24 Years | 793 (4.5%) | 783 (4.5%) |
| 25 to 29 Years | 362 (2.1%) | 912 (5.3%) |
| 30 to 34 Years | 715 (4.1%) | 839 (4.8%) |
| 35 to 39 Years | 1,176 (6.8%) | 1,255 (7.2%) |
| 40 to 44 Years | 1,491 (8.6%) | 1,430 (8.2%) |
| 45 to 49 Years | 1,280 (7.3%) | 1,421 (8.2%) |
| 50 to 54 Years | 1,269 (7.3%) | 1,267 (7.3%) |
| 55 to 59 Years | 1,302 (7.5%) | 1,224 (7.0%) |
| 60 to 64 Years | 1,292 (7.4%) | 1,405 (8.1%) |
| 65 to 69 Years | 532 (3.1%) | 496 (2.9%) |
| 70 to 74 Years | 459 (2.6%) | 639 (3.7%) |
| 75 to 79 Years | 482 (2.8%) | 724 (4.2%) |
| 80 to 84 Years | 383 (2.2%) | 343 (2.0%) |
| 85 Years and over | 286 (1.6%) | 421 (2.4%) |
| Total | 17,414 (100.0%) | 17,354 (100.0%) |
Families and Households in Mason
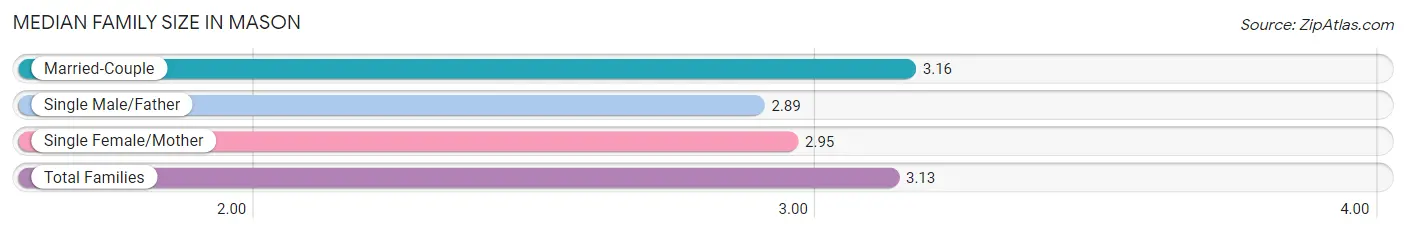
Median Family Size in Mason
The median family size in Mason is 3.13 persons per family, with married-couple families (8,234 | 84.2%) accounting for the largest median family size of 3.16 persons per family. On the other hand, single male/father families (484 | 5.0%) represent the smallest median family size with 2.89 persons per family.
| Family Type | # Families | Family Size |
| Married-Couple | 8,234 (84.2%) | 3.16 |
| Single Male/Father | 484 (5.0%) | 2.89 |
| Single Female/Mother | 1,064 (10.9%) | 2.95 |
| Total Families | 9,782 (100.0%) | 3.13 |
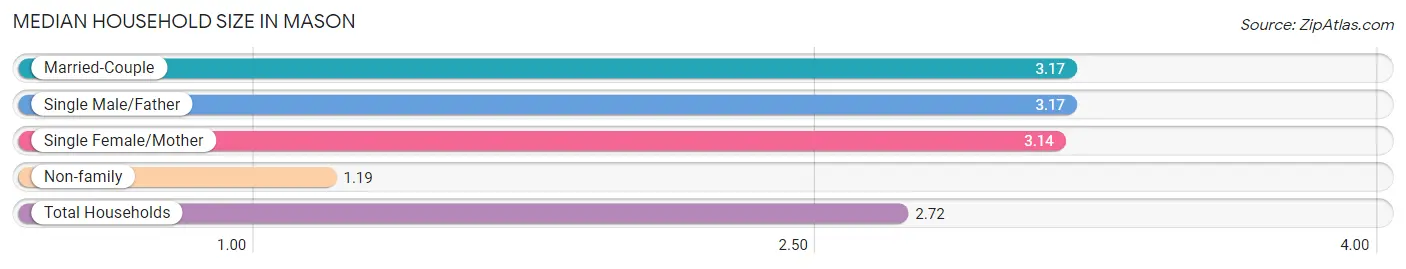
Median Household Size in Mason
The median household size in Mason is 2.72 persons per household, with married-couple households (8,234 | 65.0%) accounting for the largest median household size of 3.17 persons per household. non-family households (2,888 | 22.8%) represent the smallest median household size with 1.19 persons per household.
| Household Type | # Households | Household Size |
| Married-Couple | 8,234 (65.0%) | 3.17 |
| Single Male/Father | 484 (3.8%) | 3.17 |
| Single Female/Mother | 1,064 (8.4%) | 3.14 |
| Non-family | 2,888 (22.8%) | 1.19 |
| Total Households | 12,670 (100.0%) | 2.72 |
Household Size by Marriage Status in Mason
Out of a total of 12,670 households in Mason, 9,782 (77.2%) are family households, while 2,888 (22.8%) are nonfamily households. The most numerous type of family households are 2-person households, comprising 4,145, and the most common type of nonfamily households are 1-person households, comprising 2,425.
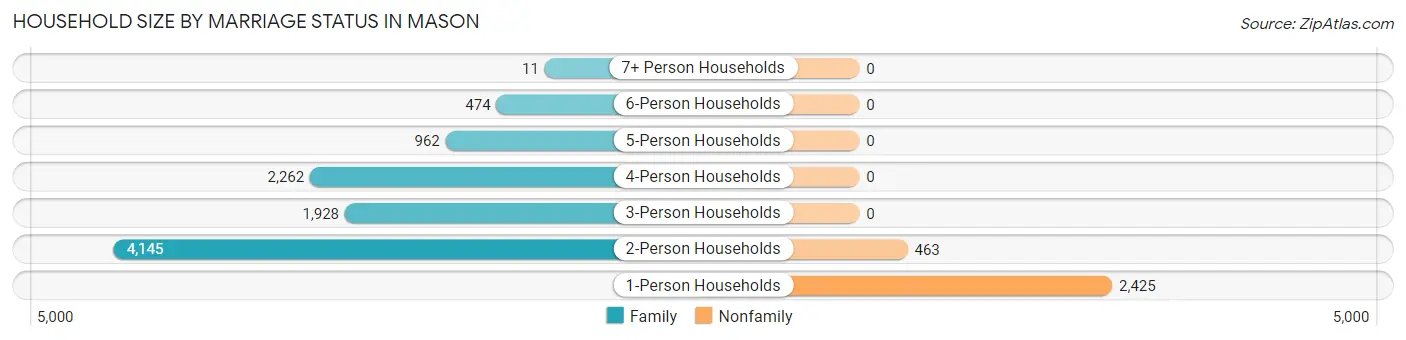
| Household Size | Family Households | Nonfamily Households |
| 1-Person Households | - | 2,425 (19.1%) |
| 2-Person Households | 4,145 (32.7%) | 463 (3.6%) |
| 3-Person Households | 1,928 (15.2%) | 0 (0.0%) |
| 4-Person Households | 2,262 (17.8%) | 0 (0.0%) |
| 5-Person Households | 962 (7.6%) | 0 (0.0%) |
| 6-Person Households | 474 (3.7%) | 0 (0.0%) |
| 7+ Person Households | 11 (0.1%) | 0 (0.0%) |
| Total | 9,782 (77.2%) | 2,888 (22.8%) |
Female Fertility in Mason
Fertility by Age in Mason
Average fertility rate in Mason is 55.0 births per 1,000 women. Women in the age bracket of 20 to 34 years have the highest fertility rate with 128.0 births per 1,000 women. Women in the age bracket of 20 to 34 years acount for 71.2% of all women with births.
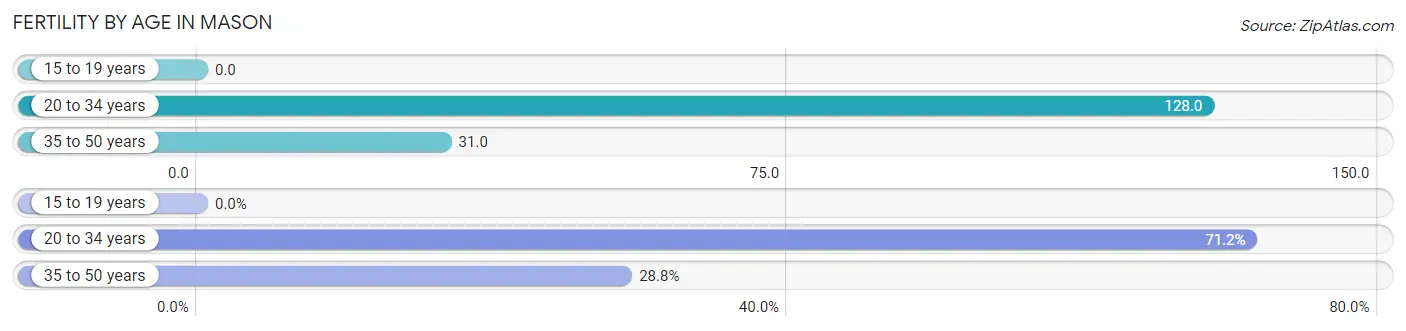
| Age Bracket | Women with Births | Births / 1,000 Women |
| 15 to 19 years | 0 (0.0%) | 0.0 |
| 20 to 34 years | 324 (71.2%) | 128.0 |
| 35 to 50 years | 131 (28.8%) | 31.0 |
| Total | 455 (100.0%) | 55.0 |
Fertility by Age by Marriage Status in Mason
76.5% of women with births (455) in Mason are married. The highest percentage of unmarried women with births falls into 20 to 34 years age bracket with 33.0% of them unmarried at the time of birth, while the lowest percentage of unmarried women with births belong to 35 to 50 years age bracket with 0.0% of them unmarried.
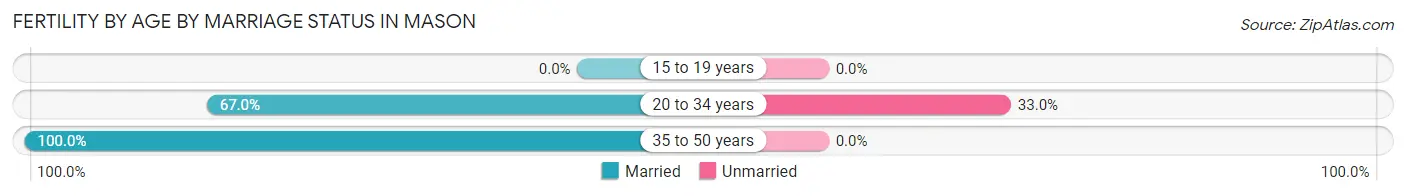
| Age Bracket | Married | Unmarried |
| 15 to 19 years | 0 (0.0%) | 0 (0.0%) |
| 20 to 34 years | 217 (67.0%) | 107 (33.0%) |
| 35 to 50 years | 131 (100.0%) | 0 (0.0%) |
| Total | 348 (76.5%) | 107 (23.5%) |
Fertility by Education in Mason
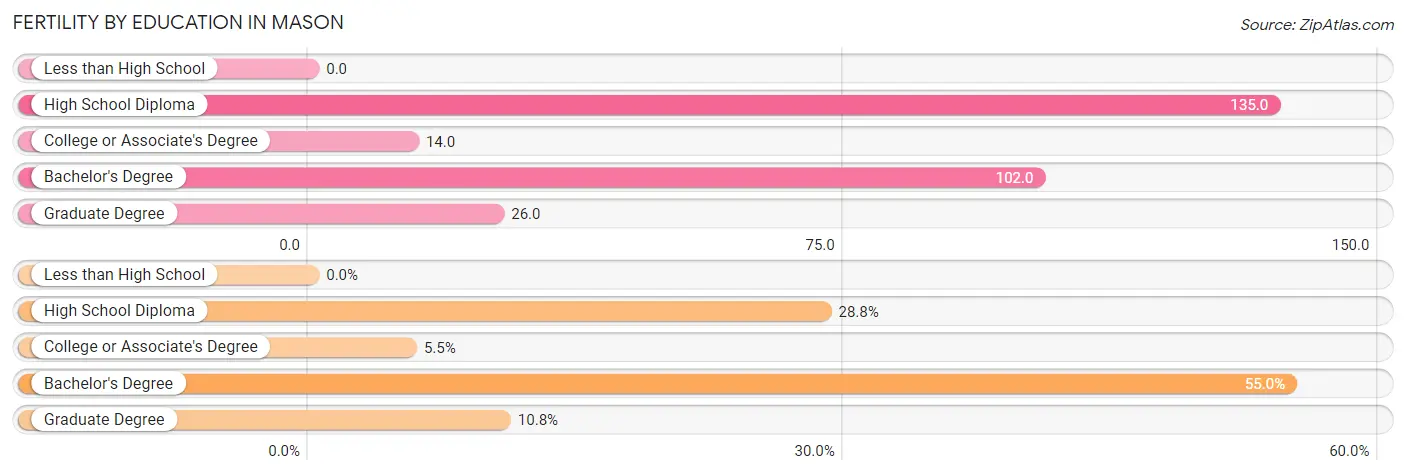
| Educational Attainment | Women with Births | Births / 1,000 Women |
| Less than High School | 0 (0.0%) | 0.0 |
| High School Diploma | 131 (28.8%) | 135.0 |
| College or Associate's Degree | 25 (5.5%) | 14.0 |
| Bachelor's Degree | 250 (54.9%) | 102.0 |
| Graduate Degree | 49 (10.8%) | 26.0 |
| Total | 455 (100.0%) | 55.0 |
Fertility by Education by Marriage Status in Mason
23.5% of women with births in Mason are unmarried. Women with the educational attainment of college or associate's degree are most likely to be married with 100.0% of them married at childbirth, while women with the educational attainment of high school diploma are least likely to be married with 81.7% of them unmarried at childbirth.
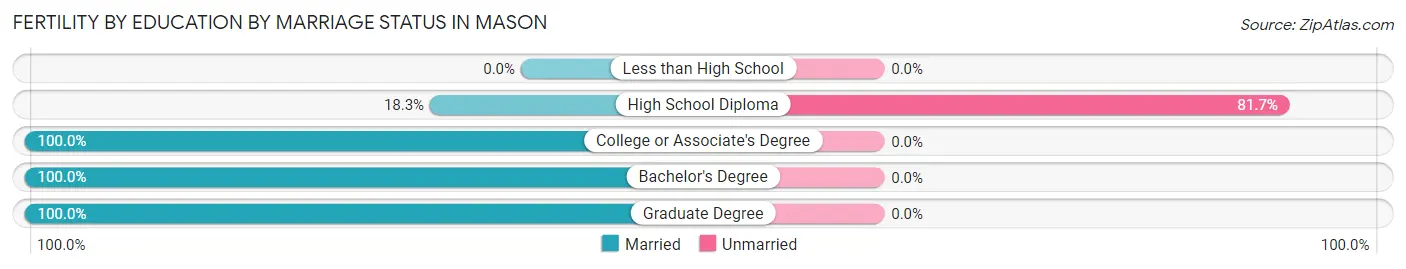
| Educational Attainment | Married | Unmarried |
| Less than High School | 0 (0.0%) | 0 (0.0%) |
| High School Diploma | 24 (18.3%) | 107 (81.7%) |
| College or Associate's Degree | 25 (100.0%) | 0 (0.0%) |
| Bachelor's Degree | 250 (100.0%) | 0 (0.0%) |
| Graduate Degree | 49 (100.0%) | 0 (0.0%) |
| Total | 348 (76.5%) | 107 (23.5%) |
Employment Characteristics in Mason
Employment by Class of Employer in Mason
Among the 17,803 employed individuals in Mason, private company employees (12,155 | 68.3%), not-for-profit organizations (1,775 | 10.0%), and local government employees (1,090 | 6.1%) make up the most common classes of employment.
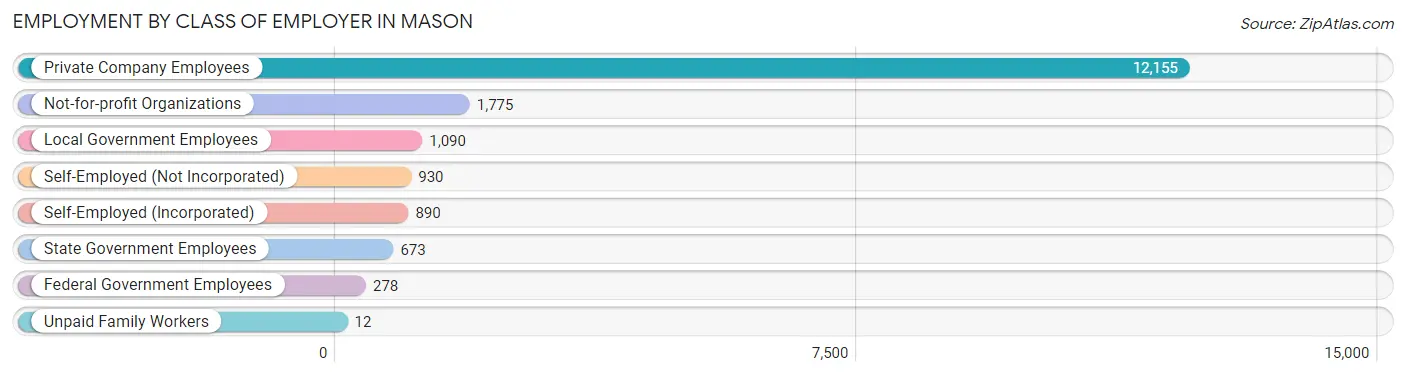
| Employer Class | # Employees | % Employees |
| Private Company Employees | 12,155 | 68.3% |
| Self-Employed (Incorporated) | 890 | 5.0% |
| Self-Employed (Not Incorporated) | 930 | 5.2% |
| Not-for-profit Organizations | 1,775 | 10.0% |
| Local Government Employees | 1,090 | 6.1% |
| State Government Employees | 673 | 3.8% |
| Federal Government Employees | 278 | 1.6% |
| Unpaid Family Workers | 12 | 0.1% |
| Total | 17,803 | 100.0% |
Employment Status by Age in Mason
According to the labor force statistics for Mason, out of the total population over 16 years of age (27,197), 67.4% or 18,331 individuals are in the labor force, with 1.8% or 330 of them unemployed. The age group with the highest labor force participation rate is 45 to 54 years, with 91.1% or 4,771 individuals in the labor force. Within the labor force, the 20 to 24 years age range has the highest percentage of unemployed individuals, with 8.1% or 107 of them being unemployed.
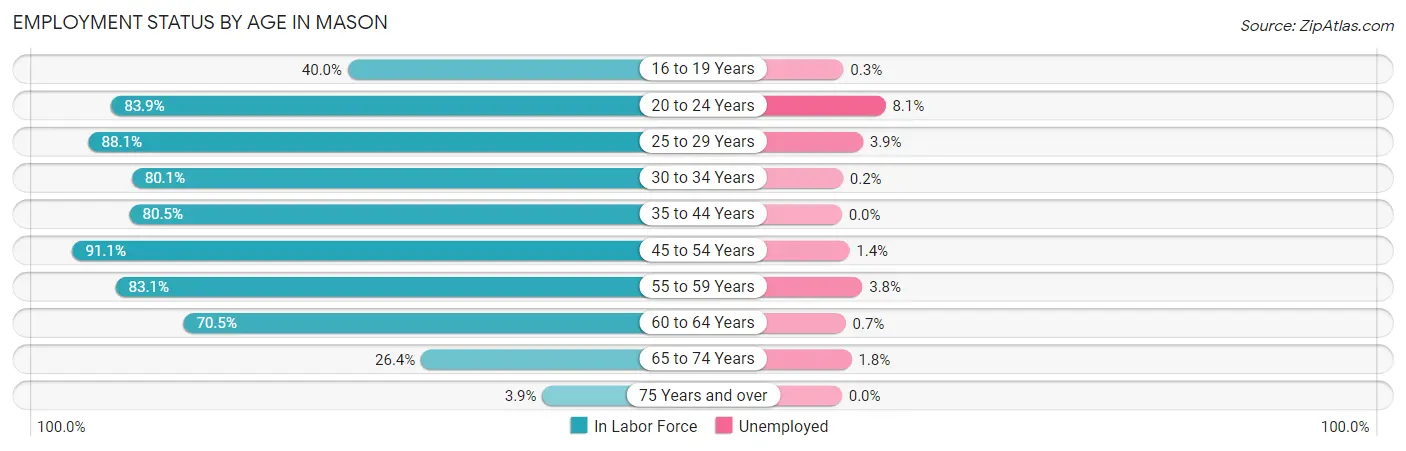
| Age Bracket | In Labor Force | Unemployed |
| 16 to 19 Years | 886 (40.0%) | 3 (0.3%) |
| 20 to 24 Years | 1,322 (83.9%) | 107 (8.1%) |
| 25 to 29 Years | 1,122 (88.1%) | 44 (3.9%) |
| 30 to 34 Years | 1,245 (80.1%) | 2 (0.2%) |
| 35 to 44 Years | 4,308 (80.5%) | 0 (0.0%) |
| 45 to 54 Years | 4,771 (91.1%) | 67 (1.4%) |
| 55 to 59 Years | 2,099 (83.1%) | 80 (3.8%) |
| 60 to 64 Years | 1,901 (70.5%) | 13 (0.7%) |
| 65 to 74 Years | 561 (26.4%) | 10 (1.8%) |
| 75 Years and over | 103 (3.9%) | 0 (0.0%) |
| Total | 18,331 (67.4%) | 330 (1.8%) |
Employment Status by Educational Attainment in Mason
According to labor force statistics for Mason, 82.9% of individuals (15,453) out of the total population between 25 and 64 years of age (18,640) are in the labor force, with 1.4% or 216 of them being unemployed. The group with the highest labor force participation rate are those with the educational attainment of bachelor's degree or higher, with 86.2% or 10,766 individuals in the labor force. Within the labor force, individuals with less than high school education have the highest percentage of unemployment, with 6.1% or 15 of them being unemployed.
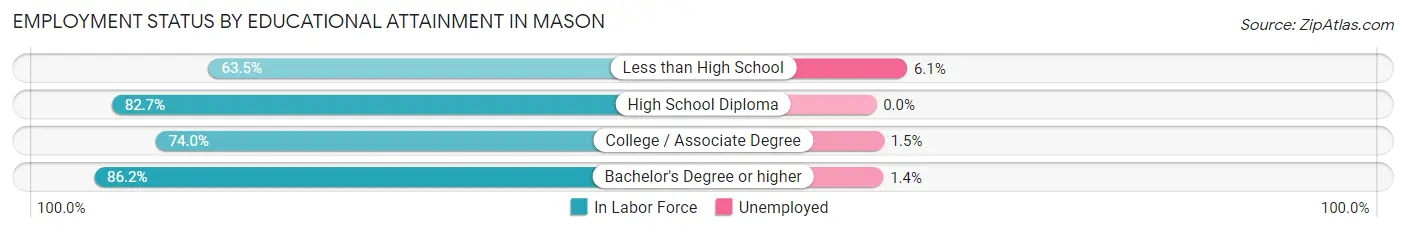
| Educational Attainment | In Labor Force | Unemployed |
| Less than High School | 244 (63.5%) | 23 (6.1%) |
| High School Diploma | 1,551 (82.7%) | 0 (0.0%) |
| College / Associate Degree | 2,879 (74.0%) | 58 (1.5%) |
| Bachelor's Degree or higher | 10,766 (86.2%) | 175 (1.4%) |
| Total | 15,453 (82.9%) | 261 (1.4%) |
Employment Occupations by Sex in Mason
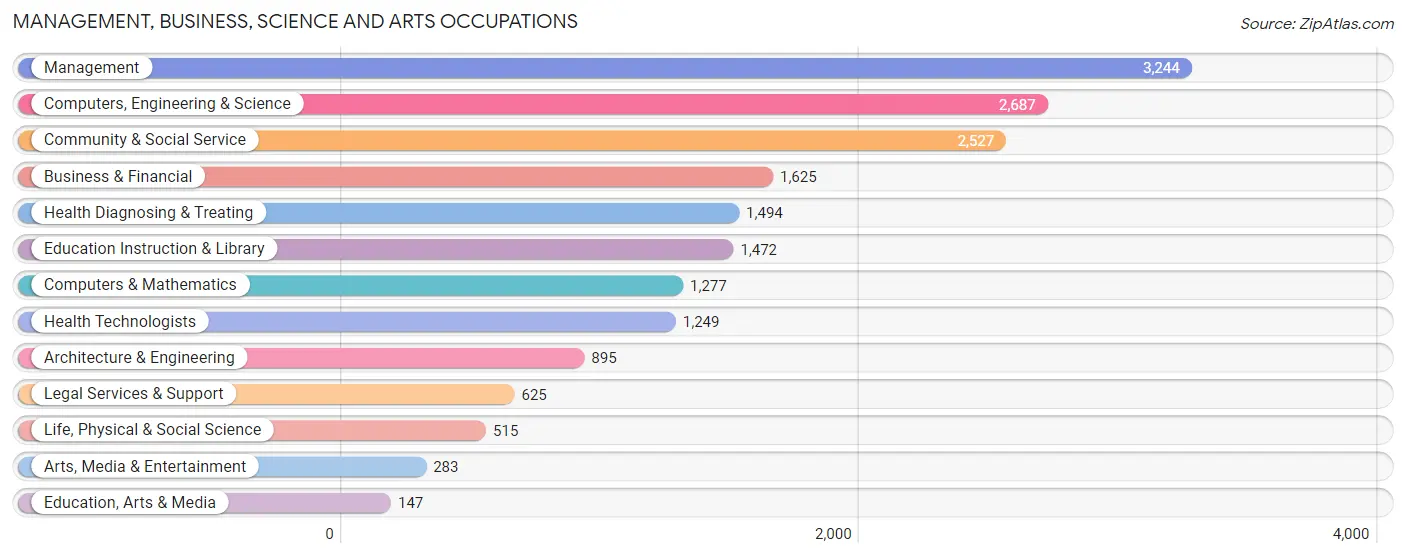
Management, Business, Science and Arts Occupations
The most common Management, Business, Science and Arts occupations in Mason are Management (3,244 | 18.0%), Computers, Engineering & Science (2,687 | 14.9%), Community & Social Service (2,527 | 14.1%), Business & Financial (1,625 | 9.0%), and Health Diagnosing & Treating (1,494 | 8.3%).
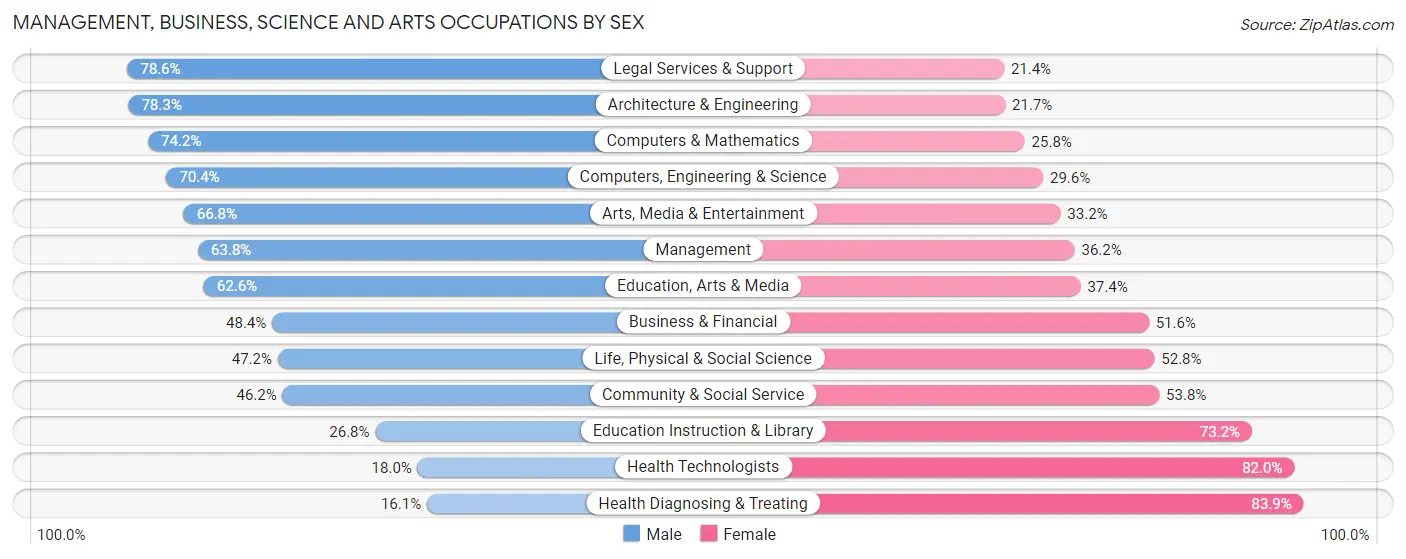
Management, Business, Science and Arts Occupations by Sex
Within the Management, Business, Science and Arts occupations in Mason, the most male-oriented occupations are Legal Services & Support (78.6%), Architecture & Engineering (78.3%), and Computers & Mathematics (74.2%), while the most female-oriented occupations are Health Diagnosing & Treating (83.9%), Health Technologists (82.0%), and Education Instruction & Library (73.2%).
| Occupation | Male | Female |
| Management | 2,071 (63.8%) | 1,173 (36.2%) |
| Business & Financial | 786 (48.4%) | 839 (51.6%) |
| Computers, Engineering & Science | 1,892 (70.4%) | 795 (29.6%) |
| Computers & Mathematics | 948 (74.2%) | 329 (25.8%) |
| Architecture & Engineering | 701 (78.3%) | 194 (21.7%) |
| Life, Physical & Social Science | 243 (47.2%) | 272 (52.8%) |
| Community & Social Service | 1,167 (46.2%) | 1,360 (53.8%) |
| Education, Arts & Media | 92 (62.6%) | 55 (37.4%) |
| Legal Services & Support | 491 (78.6%) | 134 (21.4%) |
| Education Instruction & Library | 395 (26.8%) | 1,077 (73.2%) |
| Arts, Media & Entertainment | 189 (66.8%) | 94 (33.2%) |
| Health Diagnosing & Treating | 240 (16.1%) | 1,254 (83.9%) |
| Health Technologists | 225 (18.0%) | 1,024 (82.0%) |
| Total (Category) | 6,156 (53.2%) | 5,421 (46.8%) |
| Total (Overall) | 9,404 (52.3%) | 8,569 (47.7%) |
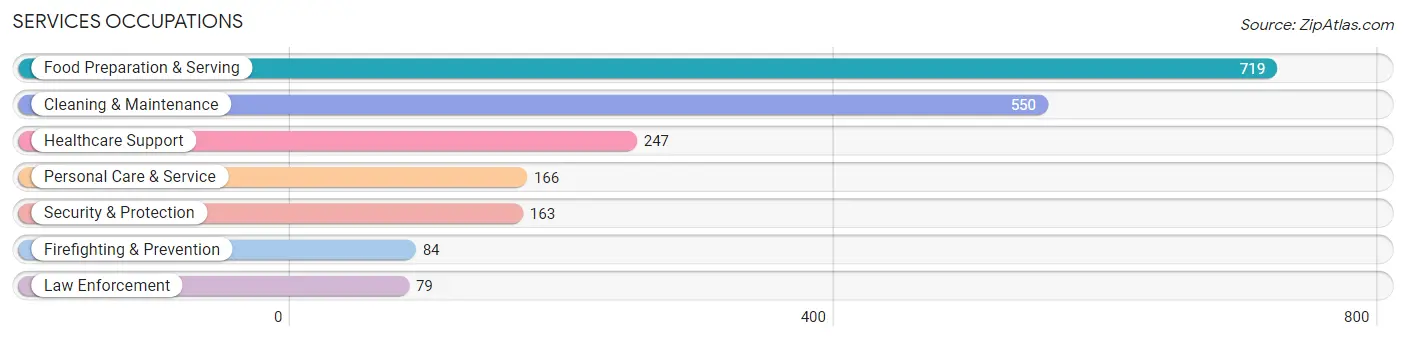
Services Occupations
The most common Services occupations in Mason are Food Preparation & Serving (719 | 4.0%), Cleaning & Maintenance (550 | 3.1%), Healthcare Support (247 | 1.4%), Personal Care & Service (166 | 0.9%), and Security & Protection (163 | 0.9%).
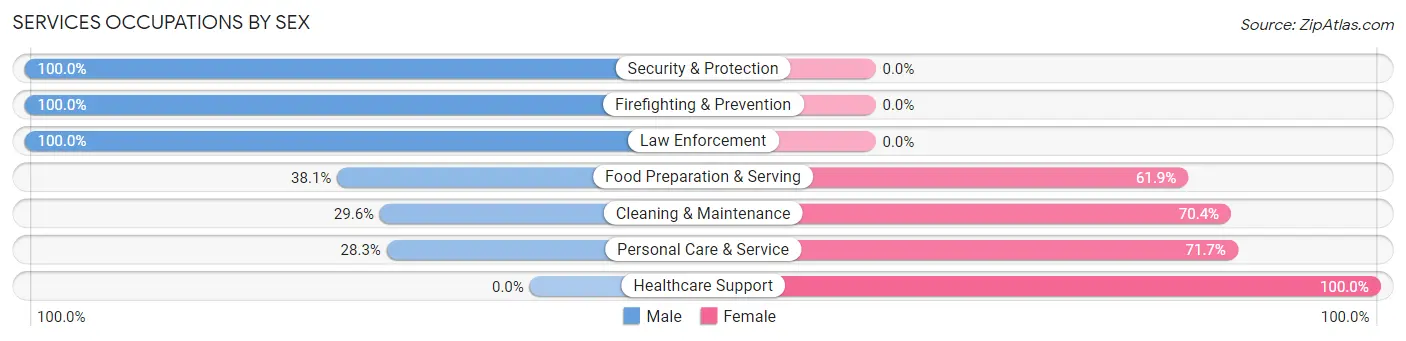
Services Occupations by Sex
Within the Services occupations in Mason, the most male-oriented occupations are Security & Protection (100.0%), Firefighting & Prevention (100.0%), and Law Enforcement (100.0%), while the most female-oriented occupations are Healthcare Support (100.0%), Personal Care & Service (71.7%), and Cleaning & Maintenance (70.4%).
| Occupation | Male | Female |
| Healthcare Support | 0 (0.0%) | 247 (100.0%) |
| Security & Protection | 163 (100.0%) | 0 (0.0%) |
| Firefighting & Prevention | 84 (100.0%) | 0 (0.0%) |
| Law Enforcement | 79 (100.0%) | 0 (0.0%) |
| Food Preparation & Serving | 274 (38.1%) | 445 (61.9%) |
| Cleaning & Maintenance | 163 (29.6%) | 387 (70.4%) |
| Personal Care & Service | 47 (28.3%) | 119 (71.7%) |
| Total (Category) | 647 (35.1%) | 1,198 (64.9%) |
| Total (Overall) | 9,404 (52.3%) | 8,569 (47.7%) |
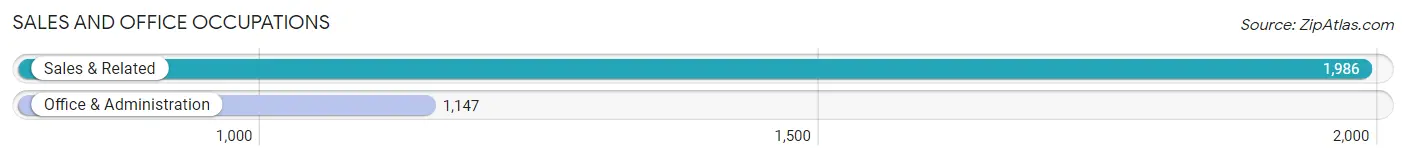
Sales and Office Occupations
The most common Sales and Office occupations in Mason are Sales & Related (1,986 | 11.1%), and Office & Administration (1,147 | 6.4%).
Sales and Office Occupations by Sex
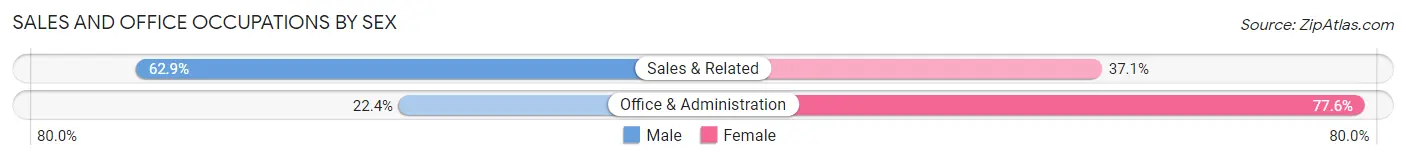
| Occupation | Male | Female |
| Sales & Related | 1,249 (62.9%) | 737 (37.1%) |
| Office & Administration | 257 (22.4%) | 890 (77.6%) |
| Total (Category) | 1,506 (48.1%) | 1,627 (51.9%) |
| Total (Overall) | 9,404 (52.3%) | 8,569 (47.7%) |
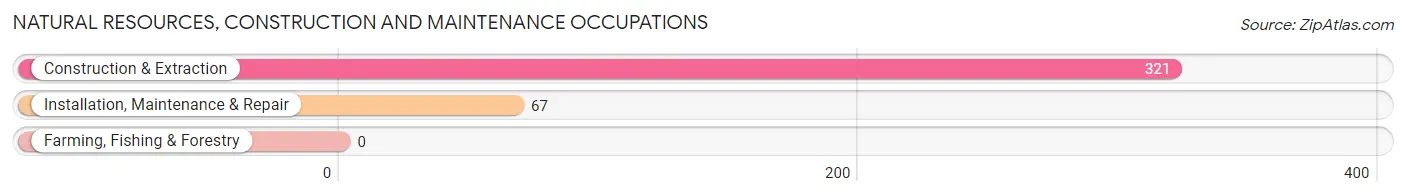
Natural Resources, Construction and Maintenance Occupations
The most common Natural Resources, Construction and Maintenance occupations in Mason are Construction & Extraction (321 | 1.8%), and Installation, Maintenance & Repair (67 | 0.4%).
Natural Resources, Construction and Maintenance Occupations by Sex
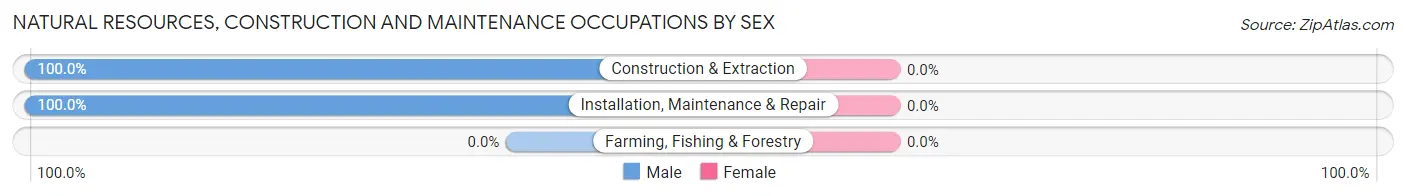
| Occupation | Male | Female |
| Farming, Fishing & Forestry | 0 (0.0%) | 0 (0.0%) |
| Construction & Extraction | 321 (100.0%) | 0 (0.0%) |
| Installation, Maintenance & Repair | 67 (100.0%) | 0 (0.0%) |
| Total (Category) | 388 (100.0%) | 0 (0.0%) |
| Total (Overall) | 9,404 (52.3%) | 8,569 (47.7%) |
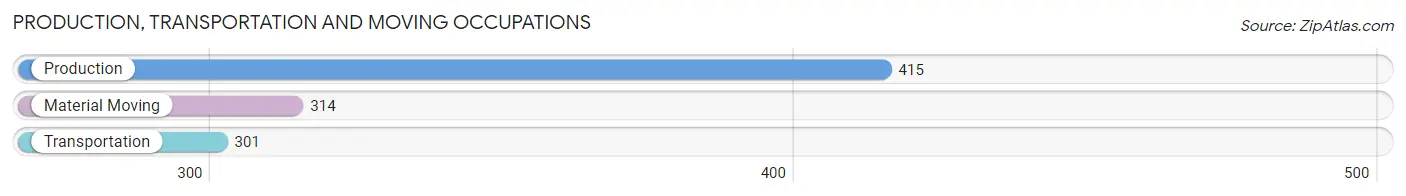
Production, Transportation and Moving Occupations
The most common Production, Transportation and Moving occupations in Mason are Production (415 | 2.3%), Material Moving (314 | 1.8%), and Transportation (301 | 1.7%).
Production, Transportation and Moving Occupations by Sex
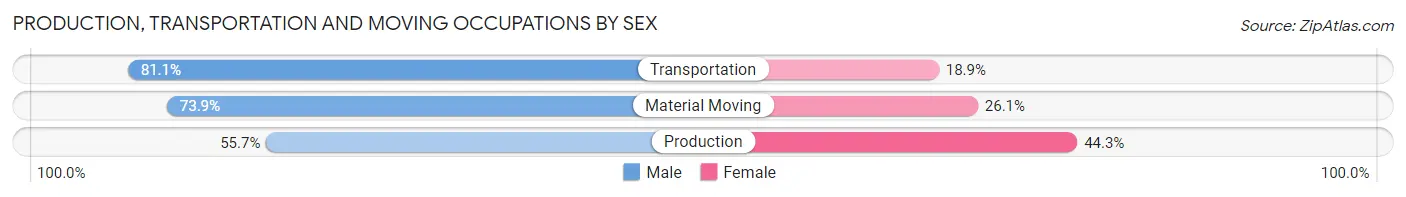
| Occupation | Male | Female |
| Production | 231 (55.7%) | 184 (44.3%) |
| Transportation | 244 (81.1%) | 57 (18.9%) |
| Material Moving | 232 (73.9%) | 82 (26.1%) |
| Total (Category) | 707 (68.6%) | 323 (31.4%) |
| Total (Overall) | 9,404 (52.3%) | 8,569 (47.7%) |
Employment Industries by Sex in Mason
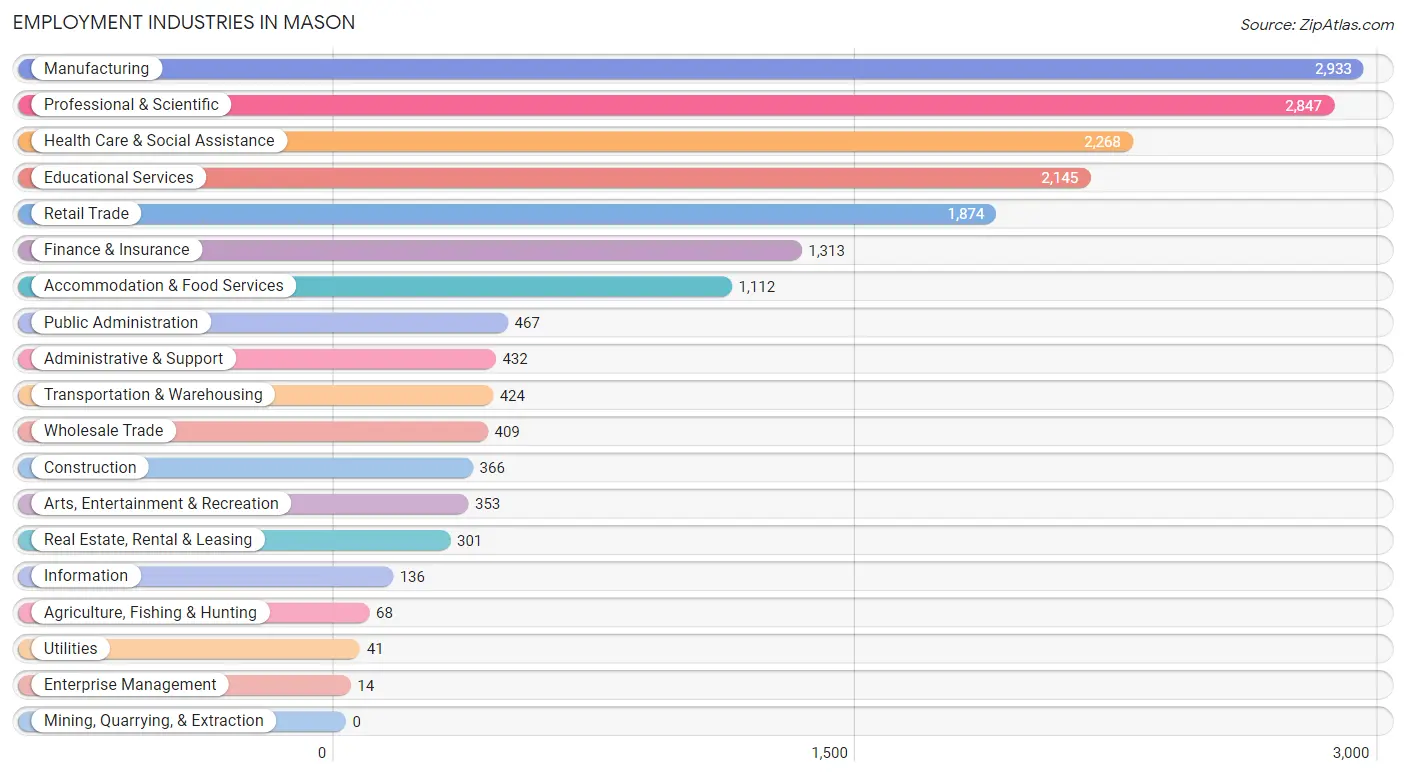
Employment Industries in Mason
The major employment industries in Mason include Manufacturing (2,933 | 16.3%), Professional & Scientific (2,847 | 15.8%), Health Care & Social Assistance (2,268 | 12.6%), Educational Services (2,145 | 11.9%), and Retail Trade (1,874 | 10.4%).
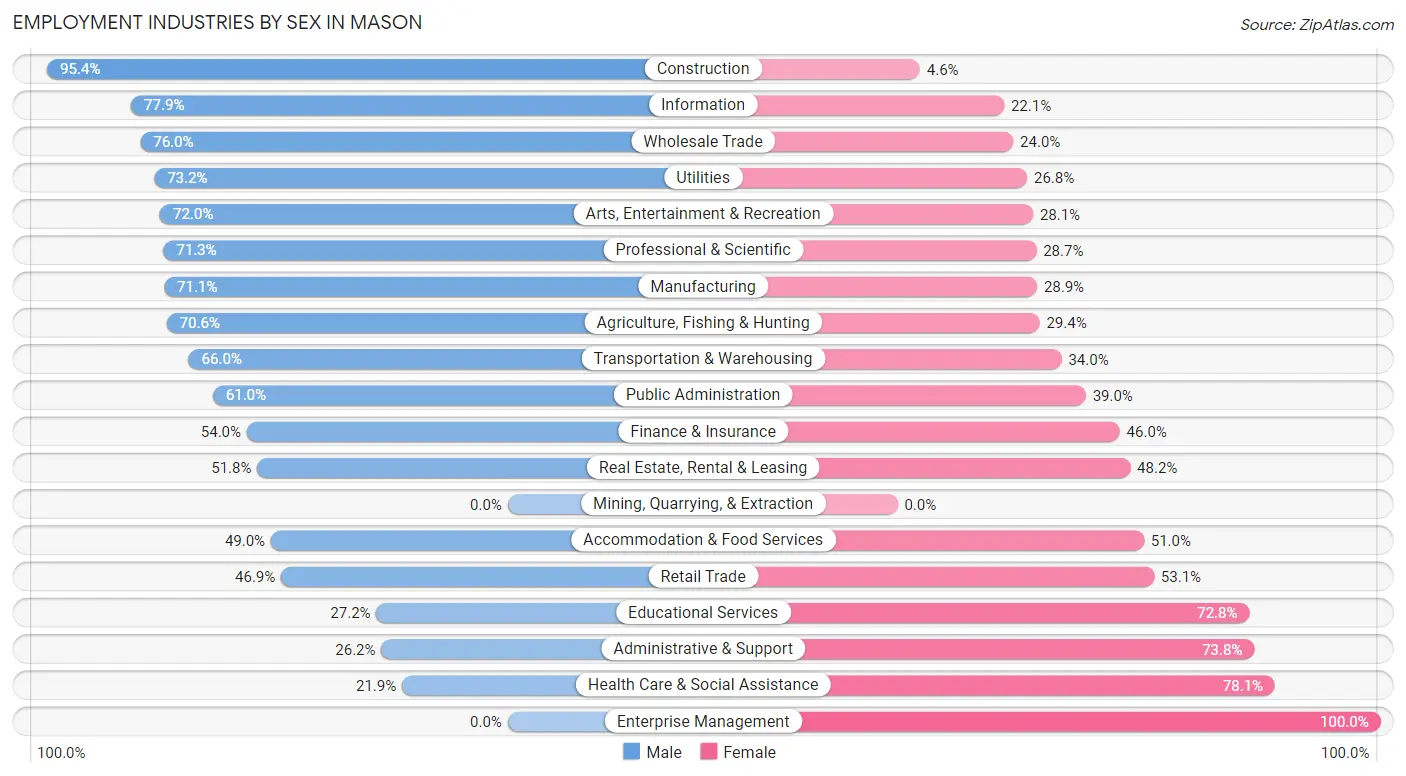
Employment Industries by Sex in Mason
The Mason industries that see more men than women are Construction (95.4%), Information (77.9%), and Wholesale Trade (76.0%), whereas the industries that tend to have a higher number of women are Enterprise Management (100.0%), Health Care & Social Assistance (78.1%), and Administrative & Support (73.8%).
| Industry | Male | Female |
| Agriculture, Fishing & Hunting | 48 (70.6%) | 20 (29.4%) |
| Mining, Quarrying, & Extraction | 0 (0.0%) | 0 (0.0%) |
| Construction | 349 (95.4%) | 17 (4.6%) |
| Manufacturing | 2,086 (71.1%) | 847 (28.9%) |
| Wholesale Trade | 311 (76.0%) | 98 (24.0%) |
| Retail Trade | 879 (46.9%) | 995 (53.1%) |
| Transportation & Warehousing | 280 (66.0%) | 144 (34.0%) |
| Utilities | 30 (73.2%) | 11 (26.8%) |
| Information | 106 (77.9%) | 30 (22.1%) |
| Finance & Insurance | 709 (54.0%) | 604 (46.0%) |
| Real Estate, Rental & Leasing | 156 (51.8%) | 145 (48.2%) |
| Professional & Scientific | 2,029 (71.3%) | 818 (28.7%) |
| Enterprise Management | 0 (0.0%) | 14 (100.0%) |
| Administrative & Support | 113 (26.2%) | 319 (73.8%) |
| Educational Services | 583 (27.2%) | 1,562 (72.8%) |
| Health Care & Social Assistance | 496 (21.9%) | 1,772 (78.1%) |
| Arts, Entertainment & Recreation | 254 (72.0%) | 99 (28.1%) |
| Accommodation & Food Services | 545 (49.0%) | 567 (51.0%) |
| Public Administration | 285 (61.0%) | 182 (39.0%) |
| Total | 9,404 (52.3%) | 8,569 (47.7%) |
Education in Mason
School Enrollment in Mason
The most common levels of schooling among the 10,344 students in Mason are high school (2,739 | 26.5%), middle school (2,425 | 23.4%), and elementary school (1,842 | 17.8%).
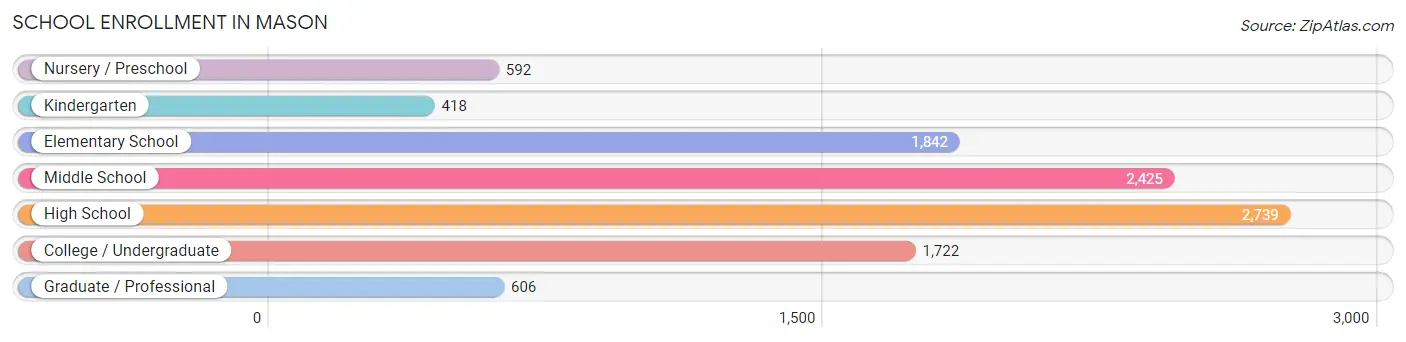
| School Level | # Students | % Students |
| Nursery / Preschool | 592 | 5.7% |
| Kindergarten | 418 | 4.0% |
| Elementary School | 1,842 | 17.8% |
| Middle School | 2,425 | 23.4% |
| High School | 2,739 | 26.5% |
| College / Undergraduate | 1,722 | 16.7% |
| Graduate / Professional | 606 | 5.9% |
| Total | 10,344 | 100.0% |
School Enrollment by Age by Funding Source in Mason
Out of a total of 10,344 students who are enrolled in schools in Mason, 1,531 (14.8%) attend a private institution, while the remaining 8,813 (85.2%) are enrolled in public schools. The age group of 3 to 4 year olds has the highest likelihood of being enrolled in private schools, with 369 (62.0% in the age bracket) enrolled. Conversely, the age group of 25 to 34 year olds has the lowest likelihood of being enrolled in a private school, with 495 (97.3% in the age bracket) attending a public institution.
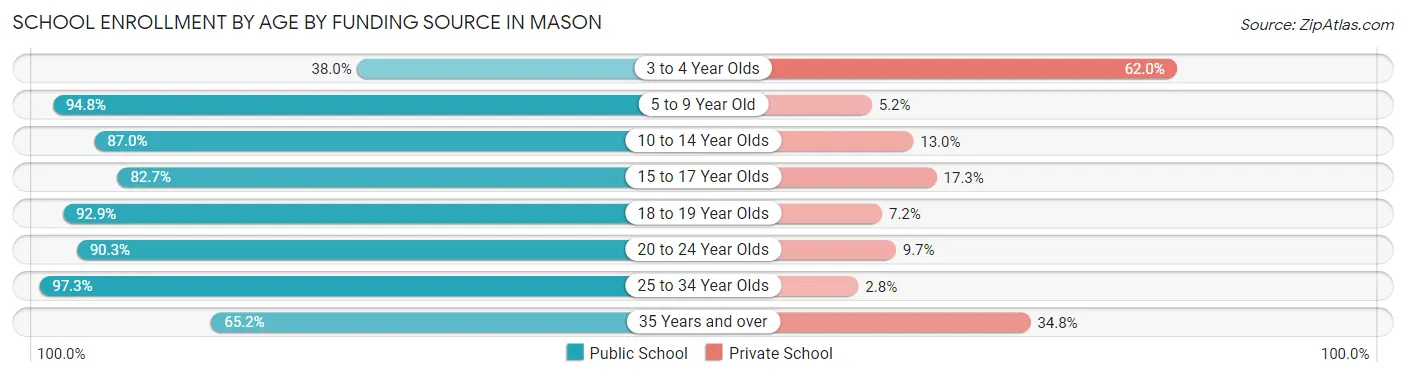
| Age Bracket | Public School | Private School |
| 3 to 4 Year Olds | 226 (38.0%) | 369 (62.0%) |
| 5 to 9 Year Old | 1,864 (94.8%) | 103 (5.2%) |
| 10 to 14 Year Olds | 2,683 (87.0%) | 400 (13.0%) |
| 15 to 17 Year Olds | 1,639 (82.7%) | 343 (17.3%) |
| 18 to 19 Year Olds | 662 (92.8%) | 51 (7.1%) |
| 20 to 24 Year Olds | 958 (90.3%) | 103 (9.7%) |
| 25 to 34 Year Olds | 495 (97.3%) | 14 (2.8%) |
| 35 Years and over | 283 (65.2%) | 151 (34.8%) |
| Total | 8,813 (85.2%) | 1,531 (14.8%) |
Educational Attainment by Field of Study in Mason
Business (3,494 | 22.4%), engineering (2,773 | 17.8%), education (1,619 | 10.4%), science & technology (1,046 | 6.7%), and computers & mathematics (937 | 6.0%) are the most common fields of study among 15,617 individuals in Mason who have obtained a bachelor's degree or higher.
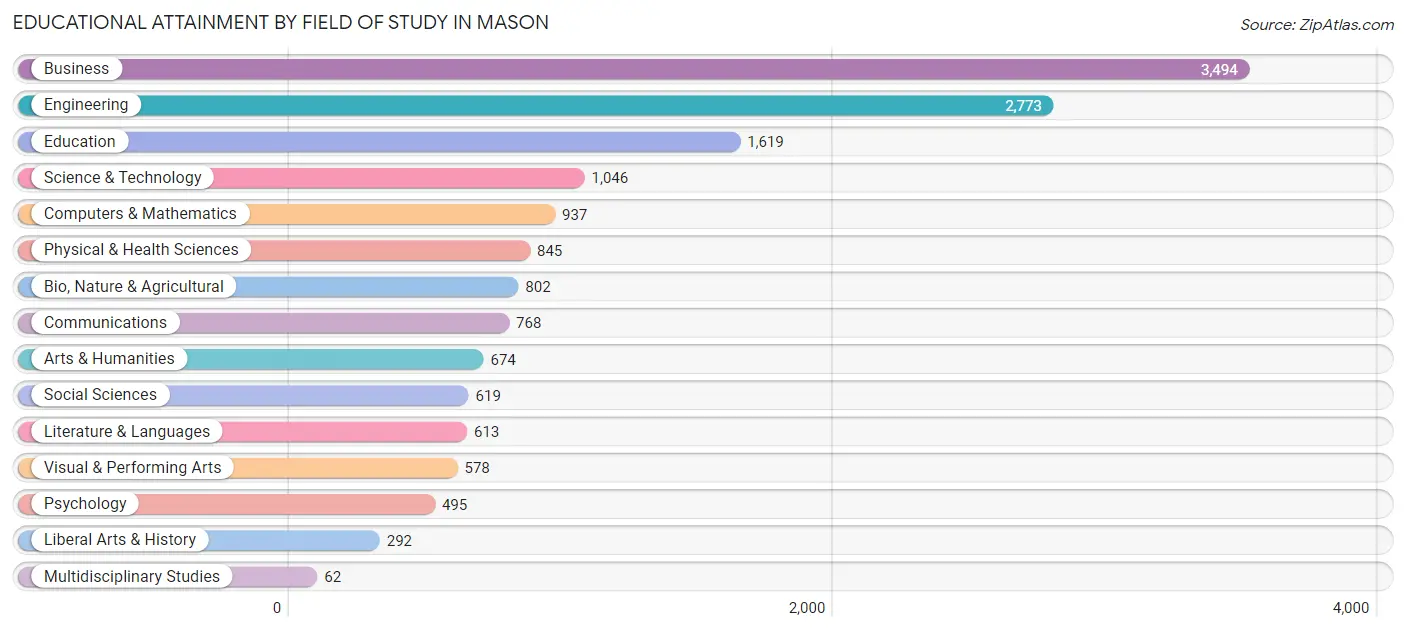
| Field of Study | # Graduates | % Graduates |
| Computers & Mathematics | 937 | 6.0% |
| Bio, Nature & Agricultural | 802 | 5.1% |
| Physical & Health Sciences | 845 | 5.4% |
| Psychology | 495 | 3.2% |
| Social Sciences | 619 | 4.0% |
| Engineering | 2,773 | 17.8% |
| Multidisciplinary Studies | 62 | 0.4% |
| Science & Technology | 1,046 | 6.7% |
| Business | 3,494 | 22.4% |
| Education | 1,619 | 10.4% |
| Literature & Languages | 613 | 3.9% |
| Liberal Arts & History | 292 | 1.9% |
| Visual & Performing Arts | 578 | 3.7% |
| Communications | 768 | 4.9% |
| Arts & Humanities | 674 | 4.3% |
| Total | 15,617 | 100.0% |
Transportation & Commute in Mason
Vehicle Availability by Sex in Mason
The most prevalent vehicle ownership categories in Mason are males with 2 vehicles (4,293, accounting for 45.9%) and females with 2 vehicles (3,403, making up 50.9%).
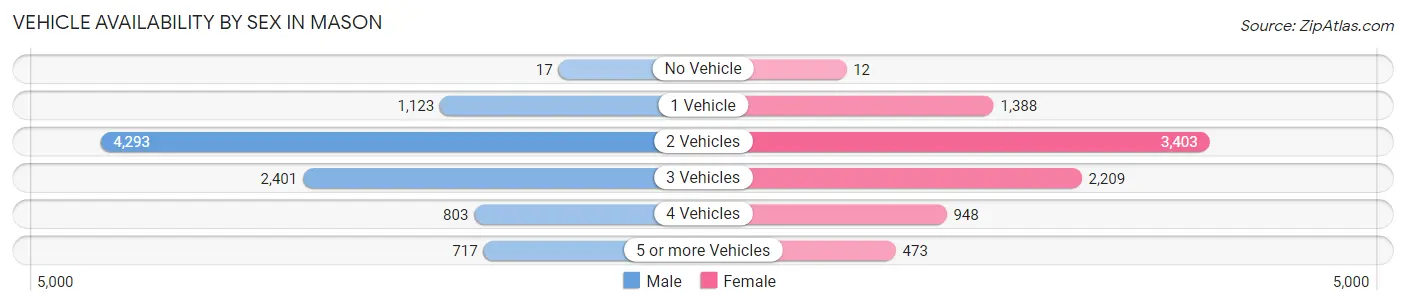
| Vehicles Available | Male | Female |
| No Vehicle | 17 (0.2%) | 12 (0.1%) |
| 1 Vehicle | 1,123 (12.0%) | 1,388 (16.5%) |
| 2 Vehicles | 4,293 (45.9%) | 3,403 (40.4%) |
| 3 Vehicles | 2,401 (25.7%) | 2,209 (26.2%) |
| 4 Vehicles | 803 (8.6%) | 948 (11.2%) |
| 5 or more Vehicles | 717 (7.7%) | 473 (5.6%) |
| Total | 9,354 (100.0%) | 8,433 (100.0%) |
Commute Time in Mason
The most frequently occuring commute durations in Mason are 30 to 34 minutes (2,491 commuters, 17.4%), 15 to 19 minutes (2,367 commuters, 16.5%), and 10 to 14 minutes (2,170 commuters, 15.1%).
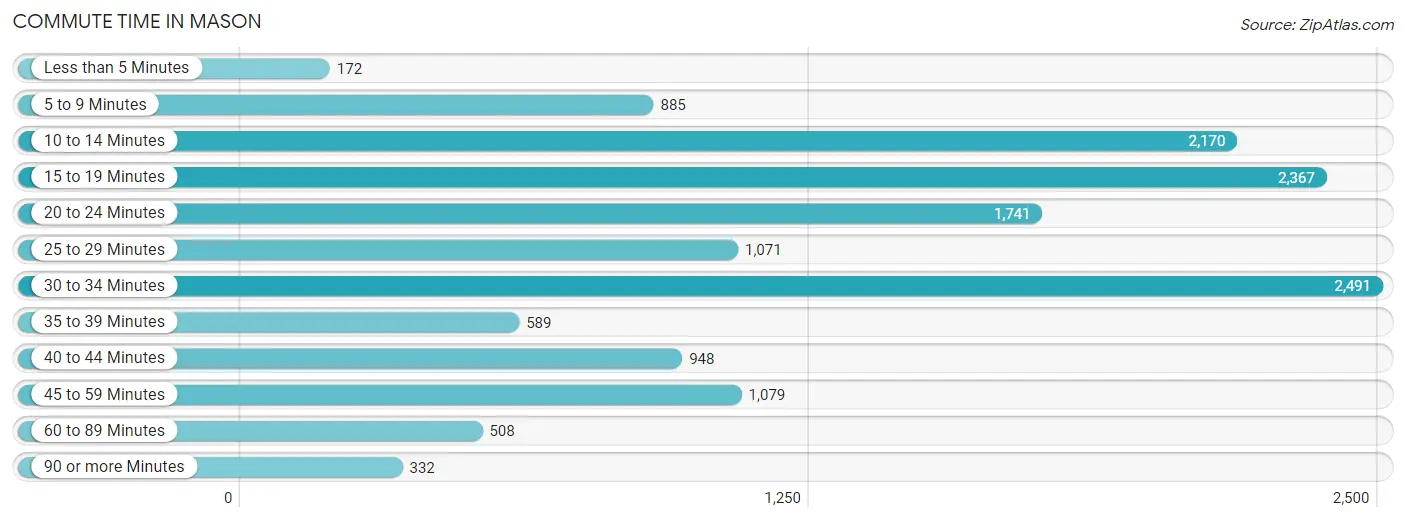
| Commute Time | # Commuters | % Commuters |
| Less than 5 Minutes | 172 | 1.2% |
| 5 to 9 Minutes | 885 | 6.2% |
| 10 to 14 Minutes | 2,170 | 15.1% |
| 15 to 19 Minutes | 2,367 | 16.5% |
| 20 to 24 Minutes | 1,741 | 12.1% |
| 25 to 29 Minutes | 1,071 | 7.5% |
| 30 to 34 Minutes | 2,491 | 17.4% |
| 35 to 39 Minutes | 589 | 4.1% |
| 40 to 44 Minutes | 948 | 6.6% |
| 45 to 59 Minutes | 1,079 | 7.5% |
| 60 to 89 Minutes | 508 | 3.5% |
| 90 or more Minutes | 332 | 2.3% |
Commute Time by Sex in Mason
The most common commute times in Mason are 30 to 34 minutes (1,409 commuters, 19.2%) for males and 15 to 19 minutes (1,436 commuters, 20.5%) for females.
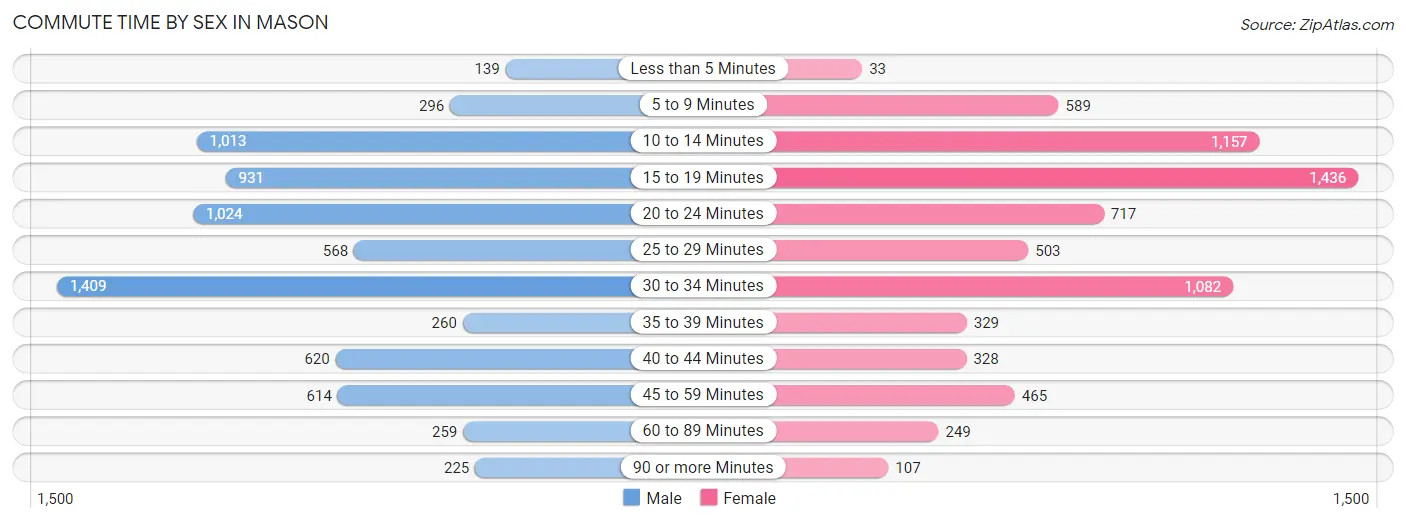
| Commute Time | Male | Female |
| Less than 5 Minutes | 139 (1.9%) | 33 (0.5%) |
| 5 to 9 Minutes | 296 (4.0%) | 589 (8.4%) |
| 10 to 14 Minutes | 1,013 (13.8%) | 1,157 (16.5%) |
| 15 to 19 Minutes | 931 (12.7%) | 1,436 (20.5%) |
| 20 to 24 Minutes | 1,024 (13.9%) | 717 (10.2%) |
| 25 to 29 Minutes | 568 (7.7%) | 503 (7.2%) |
| 30 to 34 Minutes | 1,409 (19.2%) | 1,082 (15.5%) |
| 35 to 39 Minutes | 260 (3.5%) | 329 (4.7%) |
| 40 to 44 Minutes | 620 (8.4%) | 328 (4.7%) |
| 45 to 59 Minutes | 614 (8.3%) | 465 (6.7%) |
| 60 to 89 Minutes | 259 (3.5%) | 249 (3.6%) |
| 90 or more Minutes | 225 (3.1%) | 107 (1.5%) |
Time of Departure to Work by Sex in Mason
The most frequent times of departure to work in Mason are 7:00 AM to 7:29 AM (1,332, 18.1%) for males and 7:00 AM to 7:29 AM (1,344, 19.2%) for females.
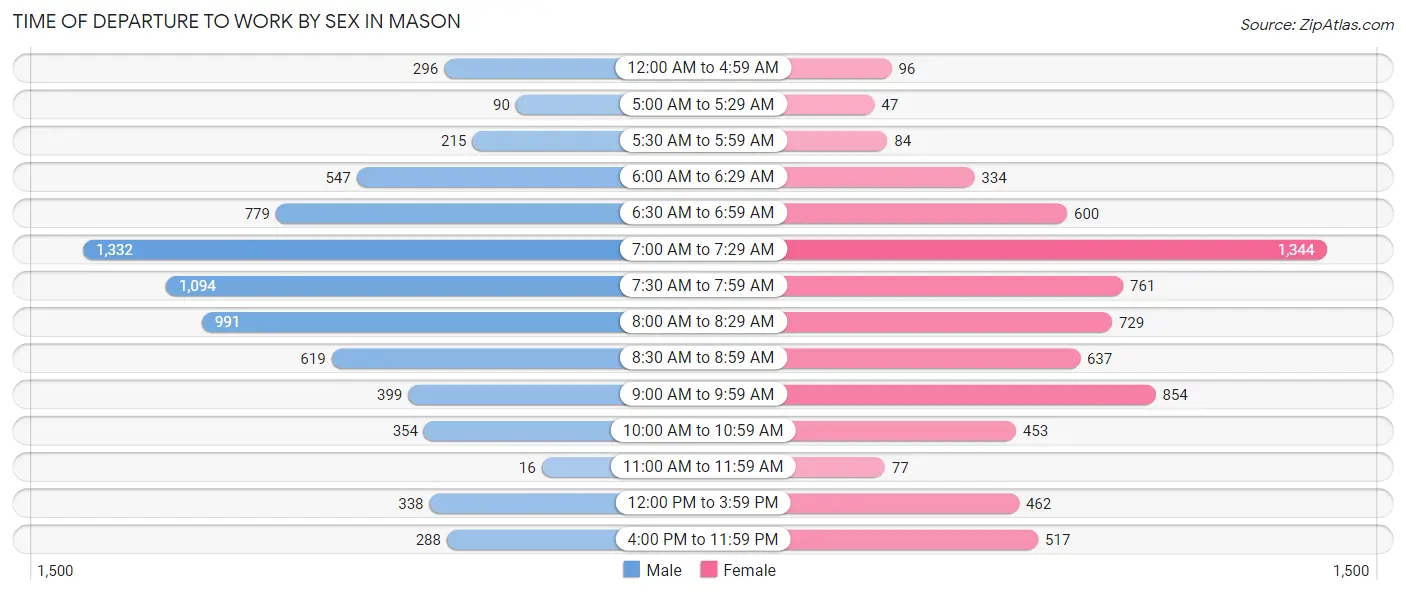
| Time of Departure | Male | Female |
| 12:00 AM to 4:59 AM | 296 (4.0%) | 96 (1.4%) |
| 5:00 AM to 5:29 AM | 90 (1.2%) | 47 (0.7%) |
| 5:30 AM to 5:59 AM | 215 (2.9%) | 84 (1.2%) |
| 6:00 AM to 6:29 AM | 547 (7.4%) | 334 (4.8%) |
| 6:30 AM to 6:59 AM | 779 (10.6%) | 600 (8.6%) |
| 7:00 AM to 7:29 AM | 1,332 (18.1%) | 1,344 (19.2%) |
| 7:30 AM to 7:59 AM | 1,094 (14.9%) | 761 (10.9%) |
| 8:00 AM to 8:29 AM | 991 (13.5%) | 729 (10.4%) |
| 8:30 AM to 8:59 AM | 619 (8.4%) | 637 (9.1%) |
| 9:00 AM to 9:59 AM | 399 (5.4%) | 854 (12.2%) |
| 10:00 AM to 10:59 AM | 354 (4.8%) | 453 (6.5%) |
| 11:00 AM to 11:59 AM | 16 (0.2%) | 77 (1.1%) |
| 12:00 PM to 3:59 PM | 338 (4.6%) | 462 (6.6%) |
| 4:00 PM to 11:59 PM | 288 (3.9%) | 517 (7.4%) |
| Total | 7,358 (100.0%) | 6,995 (100.0%) |
Housing Occupancy in Mason
Occupancy by Ownership in Mason
Of the total 12,670 dwellings in Mason, owner-occupied units account for 9,939 (78.4%), while renter-occupied units make up 2,731 (21.5%).
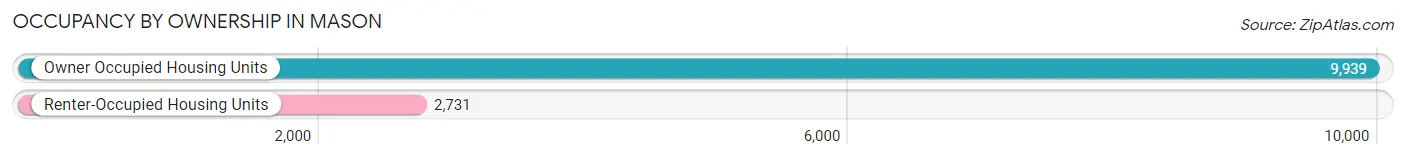
| Occupancy | # Housing Units | % Housing Units |
| Owner Occupied Housing Units | 9,939 | 78.4% |
| Renter-Occupied Housing Units | 2,731 | 21.5% |
| Total Occupied Housing Units | 12,670 | 100.0% |
Occupancy by Household Size in Mason
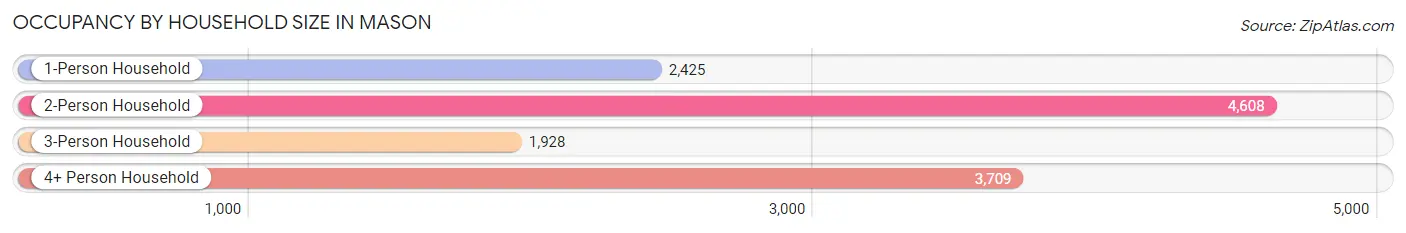
| Household Size | # Housing Units | % Housing Units |
| 1-Person Household | 2,425 | 19.1% |
| 2-Person Household | 4,608 | 36.4% |
| 3-Person Household | 1,928 | 15.2% |
| 4+ Person Household | 3,709 | 29.3% |
| Total Housing Units | 12,670 | 100.0% |
Occupancy by Ownership by Household Size in Mason
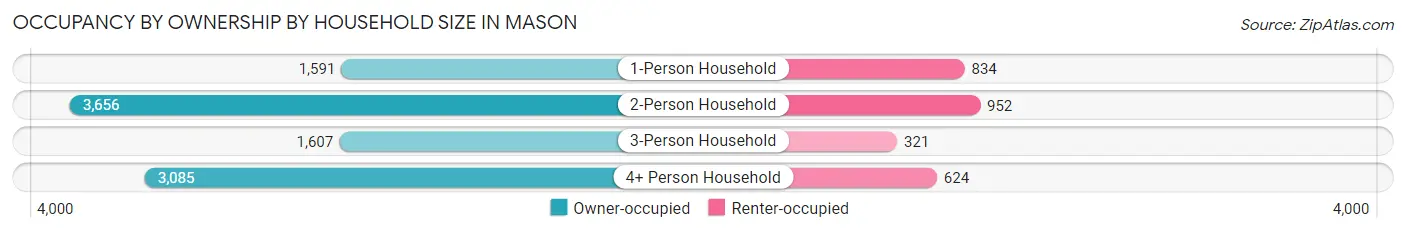
| Household Size | Owner-occupied | Renter-occupied |
| 1-Person Household | 1,591 (65.6%) | 834 (34.4%) |
| 2-Person Household | 3,656 (79.3%) | 952 (20.7%) |
| 3-Person Household | 1,607 (83.4%) | 321 (16.7%) |
| 4+ Person Household | 3,085 (83.2%) | 624 (16.8%) |
| Total Housing Units | 9,939 (78.4%) | 2,731 (21.5%) |
Occupancy by Educational Attainment in Mason
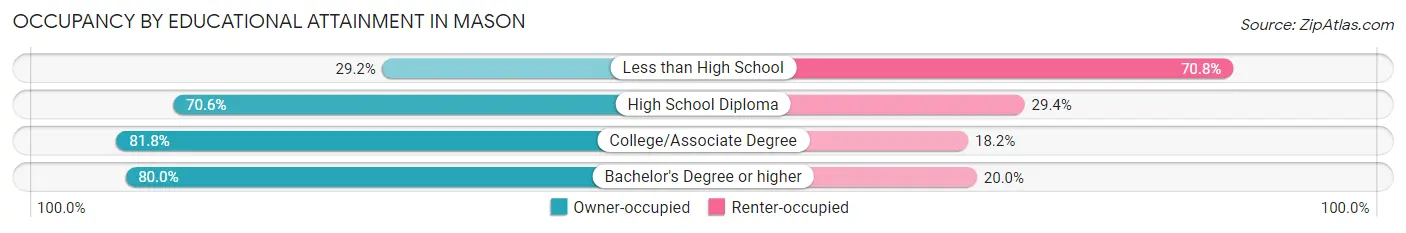
| Household Size | Owner-occupied | Renter-occupied |
| Less than High School | 64 (29.2%) | 155 (70.8%) |
| High School Diploma | 1,031 (70.6%) | 430 (29.4%) |
| College/Associate Degree | 2,224 (81.8%) | 495 (18.2%) |
| Bachelor's Degree or higher | 6,620 (80.0%) | 1,651 (20.0%) |
Occupancy by Age of Householder in Mason
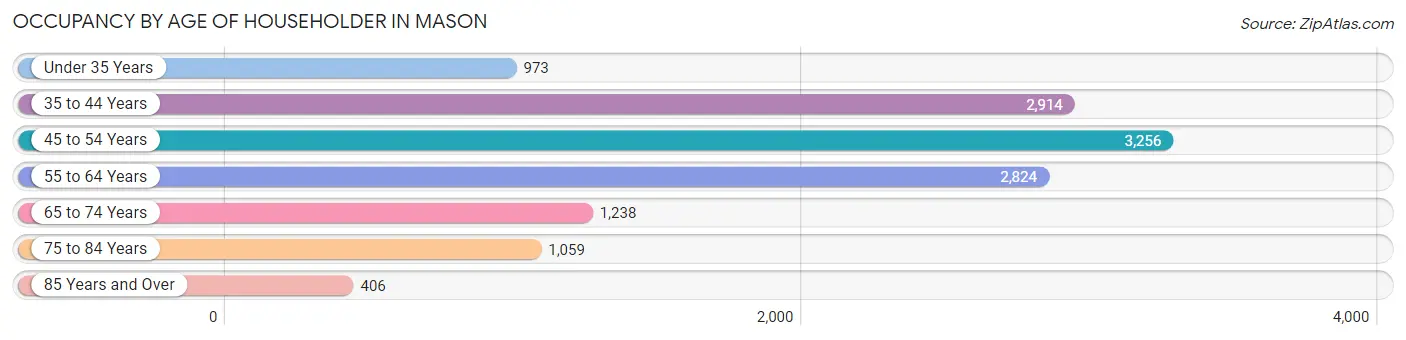
| Age Bracket | # Households | % Households |
| Under 35 Years | 973 | 7.7% |
| 35 to 44 Years | 2,914 | 23.0% |
| 45 to 54 Years | 3,256 | 25.7% |
| 55 to 64 Years | 2,824 | 22.3% |
| 65 to 74 Years | 1,238 | 9.8% |
| 75 to 84 Years | 1,059 | 8.4% |
| 85 Years and Over | 406 | 3.2% |
| Total | 12,670 | 100.0% |
Housing Finances in Mason
Median Income by Occupancy in Mason
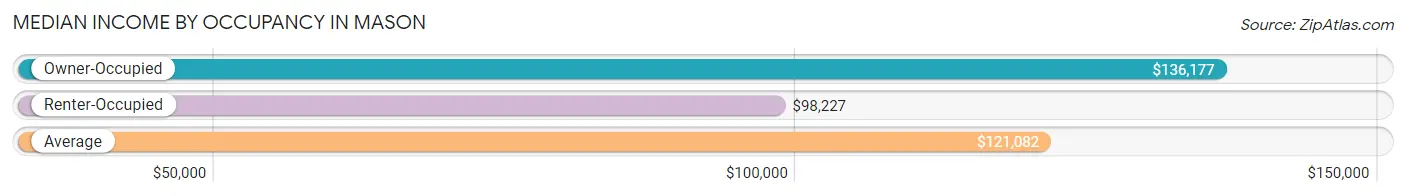
| Occupancy Type | # Households | Median Income |
| Owner-Occupied | 9,939 (78.4%) | $136,177 |
| Renter-Occupied | 2,731 (21.5%) | $98,227 |
| Average | 12,670 (100.0%) | $121,082 |
Occupancy by Householder Income Bracket in Mason
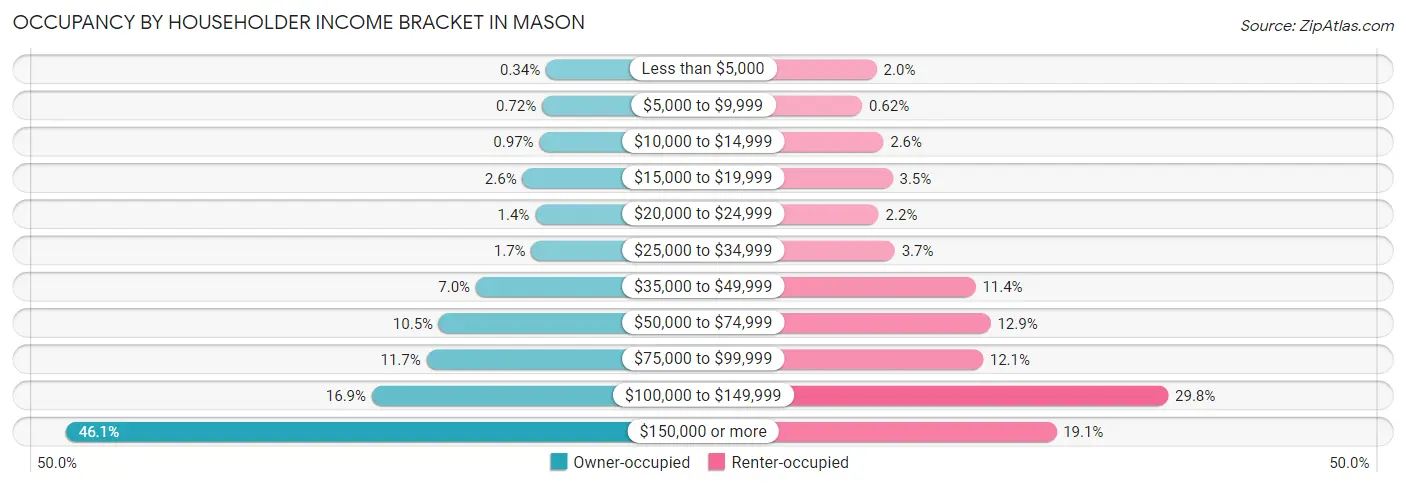
| Income Bracket | Owner-occupied | Renter-occupied |
| Less than $5,000 | 34 (0.3%) | 55 (2.0%) |
| $5,000 to $9,999 | 72 (0.7%) | 17 (0.6%) |
| $10,000 to $14,999 | 96 (1.0%) | 72 (2.6%) |
| $15,000 to $19,999 | 256 (2.6%) | 96 (3.5%) |
| $20,000 to $24,999 | 136 (1.4%) | 60 (2.2%) |
| $25,000 to $34,999 | 172 (1.7%) | 102 (3.7%) |
| $35,000 to $49,999 | 698 (7.0%) | 312 (11.4%) |
| $50,000 to $74,999 | 1,048 (10.5%) | 351 (12.9%) |
| $75,000 to $99,999 | 1,165 (11.7%) | 331 (12.1%) |
| $100,000 to $149,999 | 1,683 (16.9%) | 813 (29.8%) |
| $150,000 or more | 4,579 (46.1%) | 522 (19.1%) |
| Total | 9,939 (100.0%) | 2,731 (100.0%) |
Monthly Housing Cost Tiers in Mason
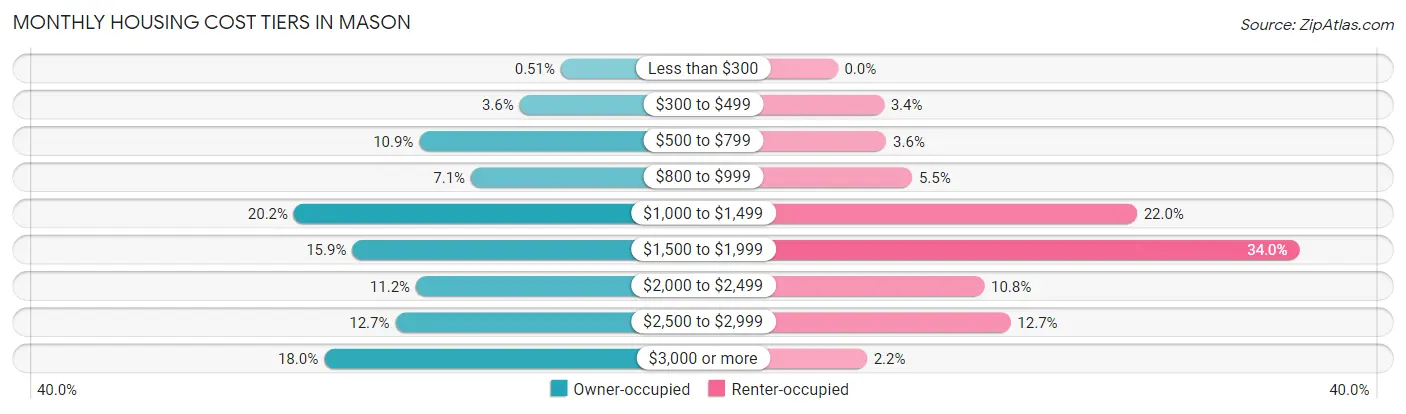
| Monthly Cost | Owner-occupied | Renter-occupied |
| Less than $300 | 51 (0.5%) | 0 (0.0%) |
| $300 to $499 | 353 (3.5%) | 93 (3.4%) |
| $500 to $799 | 1,087 (10.9%) | 98 (3.6%) |
| $800 to $999 | 709 (7.1%) | 150 (5.5%) |
| $1,000 to $1,499 | 2,005 (20.2%) | 602 (22.0%) |
| $1,500 to $1,999 | 1,577 (15.9%) | 929 (34.0%) |
| $2,000 to $2,499 | 1,111 (11.2%) | 295 (10.8%) |
| $2,500 to $2,999 | 1,262 (12.7%) | 348 (12.7%) |
| $3,000 or more | 1,784 (17.9%) | 59 (2.2%) |
| Total | 9,939 (100.0%) | 2,731 (100.0%) |
Physical Housing Characteristics in Mason
Housing Structures in Mason
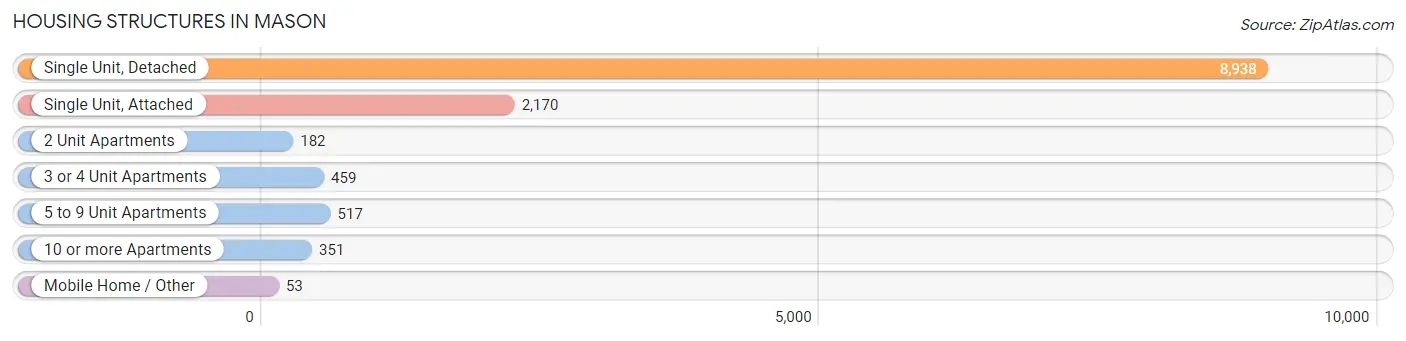
| Structure Type | # Housing Units | % Housing Units |
| Single Unit, Detached | 8,938 | 70.5% |
| Single Unit, Attached | 2,170 | 17.1% |
| 2 Unit Apartments | 182 | 1.4% |
| 3 or 4 Unit Apartments | 459 | 3.6% |
| 5 to 9 Unit Apartments | 517 | 4.1% |
| 10 or more Apartments | 351 | 2.8% |
| Mobile Home / Other | 53 | 0.4% |
| Total | 12,670 | 100.0% |
Housing Structures by Occupancy in Mason
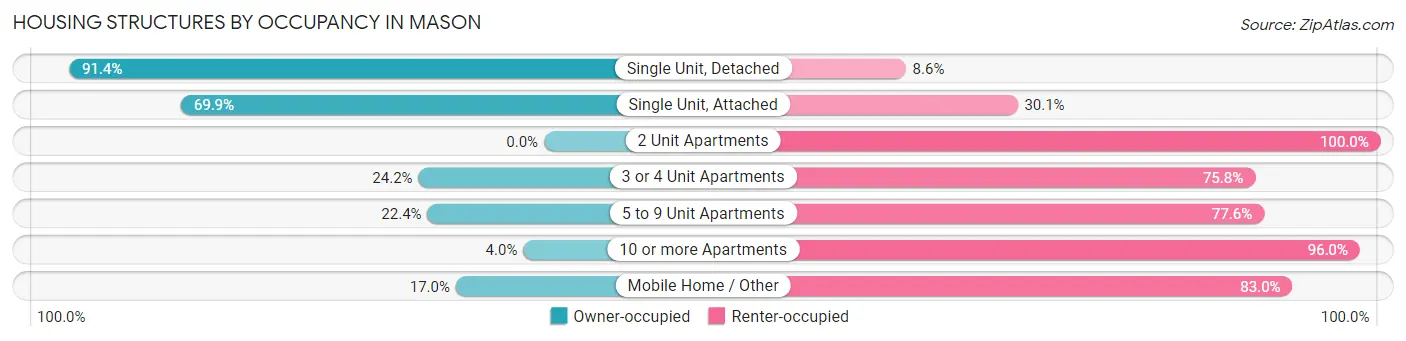
| Structure Type | Owner-occupied | Renter-occupied |
| Single Unit, Detached | 8,172 (91.4%) | 766 (8.6%) |
| Single Unit, Attached | 1,517 (69.9%) | 653 (30.1%) |
| 2 Unit Apartments | 0 (0.0%) | 182 (100.0%) |
| 3 or 4 Unit Apartments | 111 (24.2%) | 348 (75.8%) |
| 5 to 9 Unit Apartments | 116 (22.4%) | 401 (77.6%) |
| 10 or more Apartments | 14 (4.0%) | 337 (96.0%) |
| Mobile Home / Other | 9 (17.0%) | 44 (83.0%) |
| Total | 9,939 (78.4%) | 2,731 (21.5%) |
Housing Structures by Number of Rooms in Mason
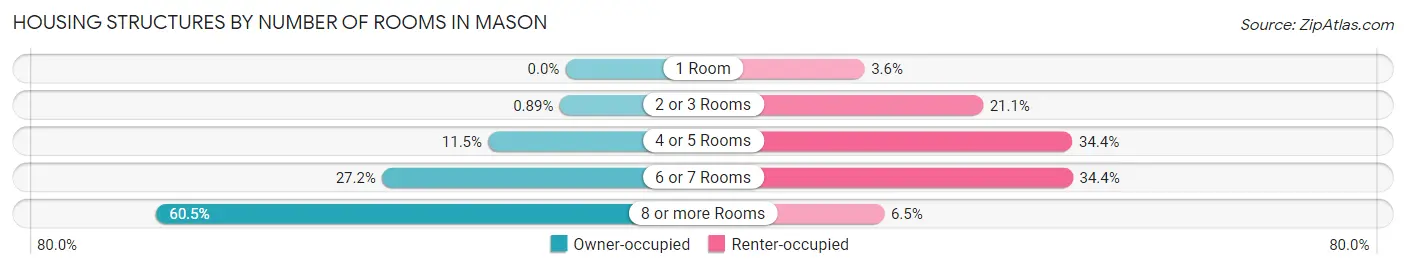
| Number of Rooms | Owner-occupied | Renter-occupied |
| 1 Room | 0 (0.0%) | 98 (3.6%) |
| 2 or 3 Rooms | 88 (0.9%) | 577 (21.1%) |
| 4 or 5 Rooms | 1,138 (11.5%) | 938 (34.4%) |
| 6 or 7 Rooms | 2,699 (27.2%) | 940 (34.4%) |
| 8 or more Rooms | 6,014 (60.5%) | 178 (6.5%) |
| Total | 9,939 (100.0%) | 2,731 (100.0%) |
Housing Structure by Heating Type in Mason
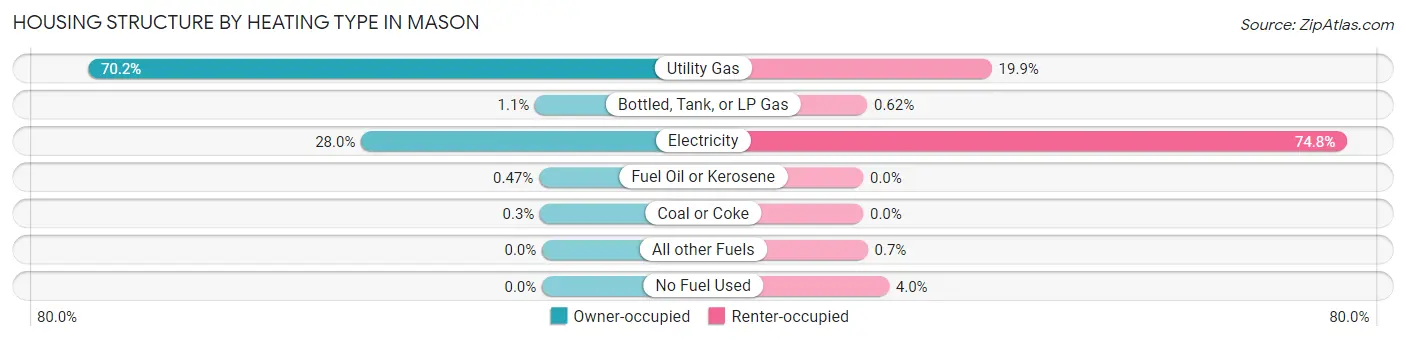
| Heating Type | Owner-occupied | Renter-occupied |
| Utility Gas | 6,977 (70.2%) | 543 (19.9%) |
| Bottled, Tank, or LP Gas | 106 (1.1%) | 17 (0.6%) |
| Electricity | 2,779 (28.0%) | 2,043 (74.8%) |
| Fuel Oil or Kerosene | 47 (0.5%) | 0 (0.0%) |
| Coal or Coke | 30 (0.3%) | 0 (0.0%) |
| All other Fuels | 0 (0.0%) | 19 (0.7%) |
| No Fuel Used | 0 (0.0%) | 109 (4.0%) |
| Total | 9,939 (100.0%) | 2,731 (100.0%) |
Household Vehicle Usage in Mason
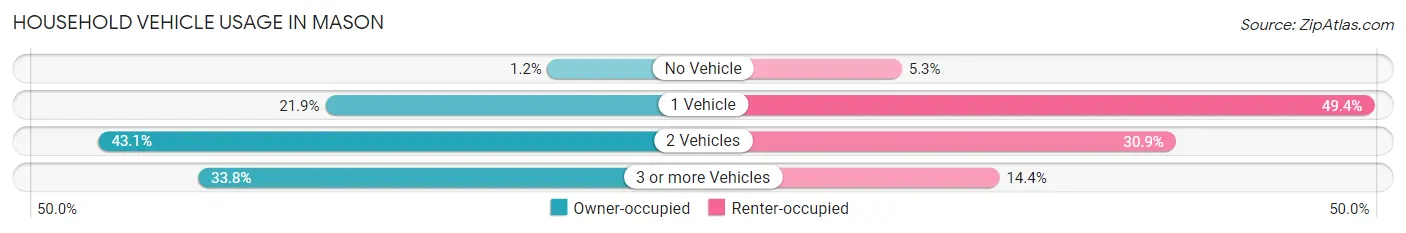
| Vehicles per Household | Owner-occupied | Renter-occupied |
| No Vehicle | 116 (1.2%) | 145 (5.3%) |
| 1 Vehicle | 2,180 (21.9%) | 1,349 (49.4%) |
| 2 Vehicles | 4,284 (43.1%) | 843 (30.9%) |
| 3 or more Vehicles | 3,359 (33.8%) | 394 (14.4%) |
| Total | 9,939 (100.0%) | 2,731 (100.0%) |
Real Estate & Mortgages in Mason
Real Estate and Mortgage Overview in Mason
| Characteristic | Without Mortgage | With Mortgage |
| Housing Units | 2,765 | 7,174 |
| Median Property Value | $300,100 | $402,700 |
| Median Household Income | $120,517 | $3,501 |
| Monthly Housing Costs | $783 | $1,784 |
| Real Estate Taxes | $4,043 | $74 |
Property Value by Mortgage Status in Mason
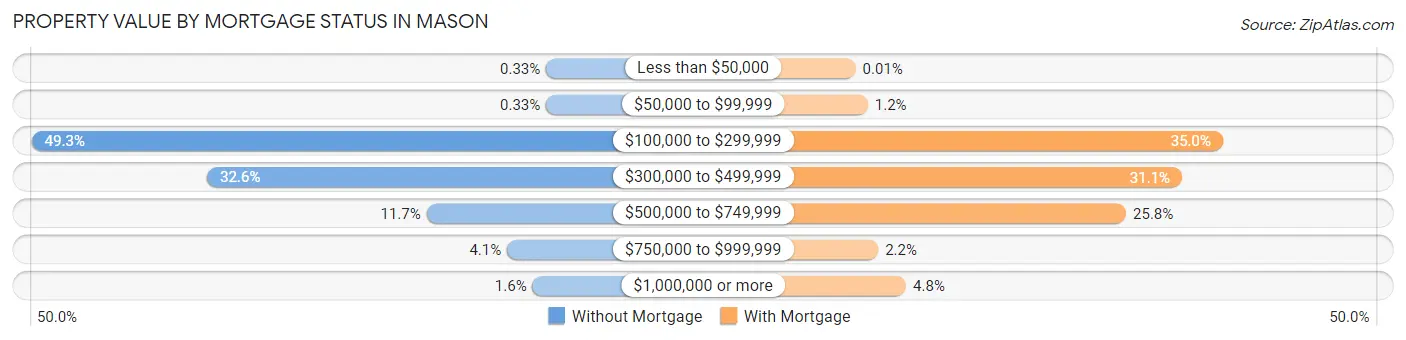
| Property Value | Without Mortgage | With Mortgage |
| Less than $50,000 | 9 (0.3%) | 1 (0.0%) |
| $50,000 to $99,999 | 9 (0.3%) | 84 (1.2%) |
| $100,000 to $299,999 | 1,364 (49.3%) | 2,509 (35.0%) |
| $300,000 to $499,999 | 902 (32.6%) | 2,230 (31.1%) |
| $500,000 to $749,999 | 324 (11.7%) | 1,849 (25.8%) |
| $750,000 to $999,999 | 112 (4.1%) | 155 (2.2%) |
| $1,000,000 or more | 45 (1.6%) | 346 (4.8%) |
| Total | 2,765 (100.0%) | 7,174 (100.0%) |
Household Income by Mortgage Status in Mason
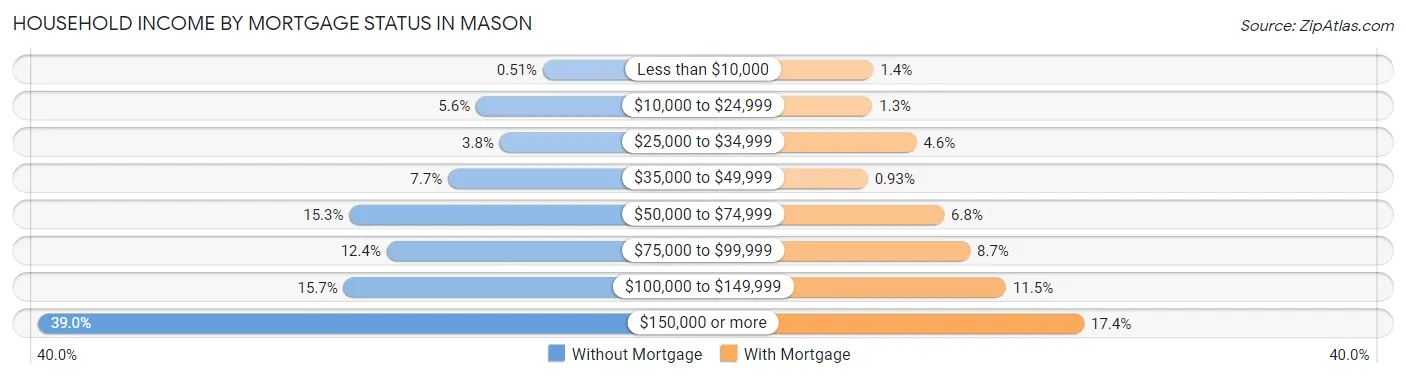
| Household Income | Without Mortgage | With Mortgage |
| Less than $10,000 | 14 (0.5%) | 98 (1.4%) |
| $10,000 to $24,999 | 155 (5.6%) | 92 (1.3%) |
| $25,000 to $34,999 | 105 (3.8%) | 333 (4.6%) |
| $35,000 to $49,999 | 214 (7.7%) | 67 (0.9%) |
| $50,000 to $74,999 | 422 (15.3%) | 484 (6.8%) |
| $75,000 to $99,999 | 343 (12.4%) | 626 (8.7%) |
| $100,000 to $149,999 | 434 (15.7%) | 822 (11.5%) |
| $150,000 or more | 1,078 (39.0%) | 1,249 (17.4%) |
| Total | 2,765 (100.0%) | 7,174 (100.0%) |
Property Value to Household Income Ratio in Mason
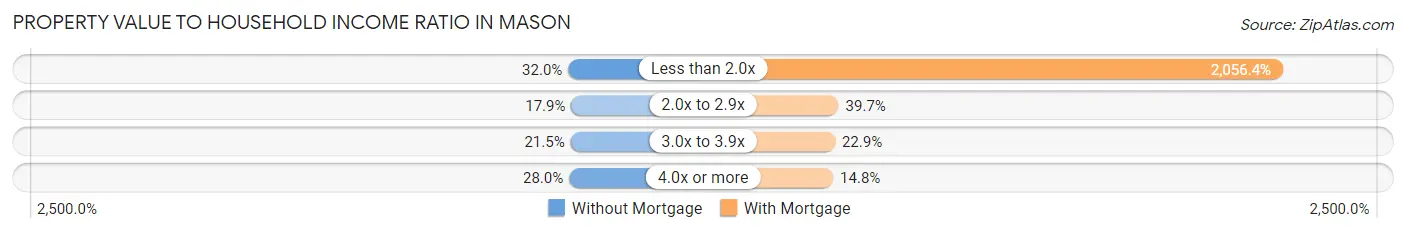
| Value-to-Income Ratio | Without Mortgage | With Mortgage |
| Less than 2.0x | 886 (32.0%) | 147,529 (2,056.4%) |
| 2.0x to 2.9x | 495 (17.9%) | 2,846 (39.7%) |
| 3.0x to 3.9x | 595 (21.5%) | 1,646 (22.9%) |
| 4.0x or more | 775 (28.0%) | 1,060 (14.8%) |
| Total | 2,765 (100.0%) | 7,174 (100.0%) |
Real Estate Taxes by Mortgage Status in Mason
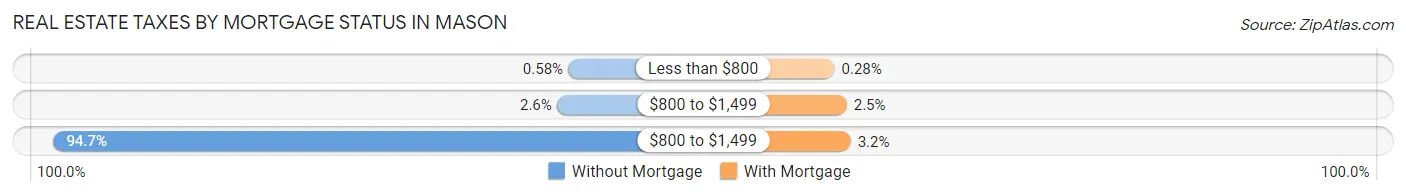
| Property Taxes | Without Mortgage | With Mortgage |
| Less than $800 | 16 (0.6%) | 20 (0.3%) |
| $800 to $1,499 | 73 (2.6%) | 180 (2.5%) |
| $800 to $1,499 | 2,619 (94.7%) | 232 (3.2%) |
| Total | 2,765 (100.0%) | 7,174 (100.0%) |
Health & Disability in Mason
Health Insurance Coverage by Age in Mason
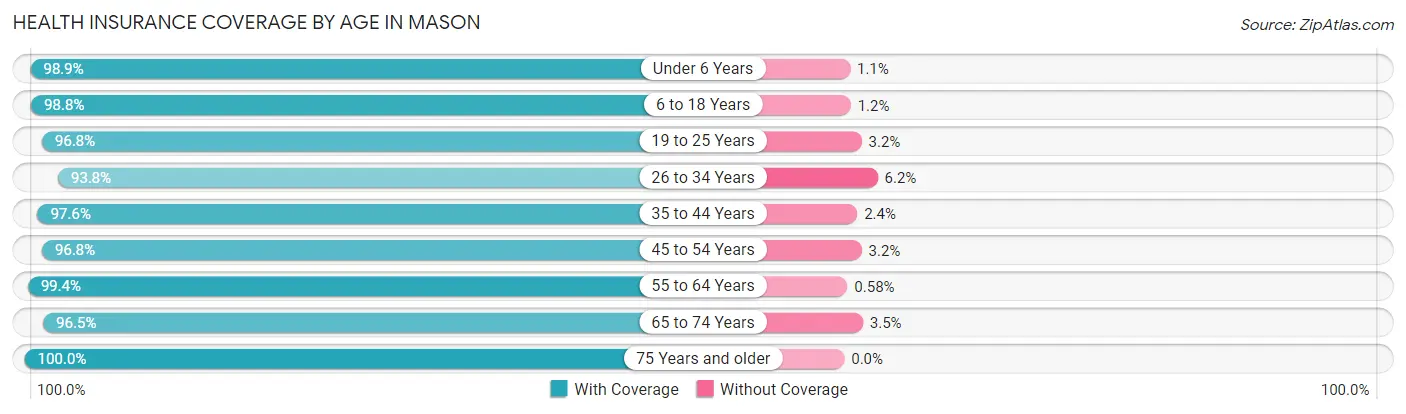
| Age Bracket | With Coverage | Without Coverage |
| Under 6 Years | 1,847 (98.9%) | 20 (1.1%) |
| 6 to 18 Years | 7,583 (98.8%) | 92 (1.2%) |
| 19 to 25 Years | 1,863 (96.8%) | 62 (3.2%) |
| 26 to 34 Years | 2,537 (93.8%) | 168 (6.2%) |
| 35 to 44 Years | 5,219 (97.6%) | 129 (2.4%) |
| 45 to 54 Years | 5,044 (96.8%) | 168 (3.2%) |
| 55 to 64 Years | 5,140 (99.4%) | 30 (0.6%) |
| 65 to 74 Years | 2,007 (96.5%) | 72 (3.5%) |
| 75 Years and older | 2,480 (100.0%) | 0 (0.0%) |
| Total | 33,720 (97.9%) | 741 (2.1%) |
Health Insurance Coverage by Citizenship Status in Mason
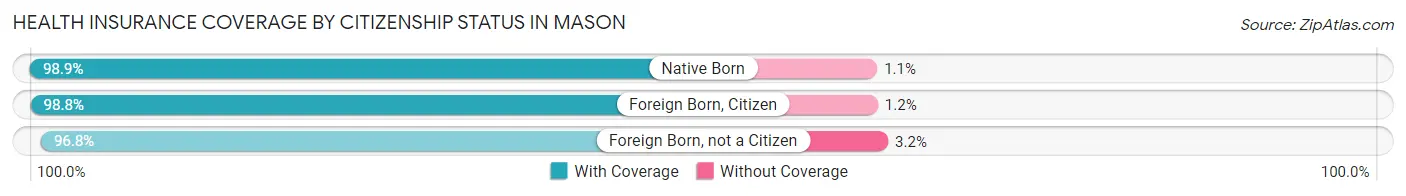
| Citizenship Status | With Coverage | Without Coverage |
| Native Born | 1,847 (98.9%) | 20 (1.1%) |
| Foreign Born, Citizen | 7,583 (98.8%) | 92 (1.2%) |
| Foreign Born, not a Citizen | 1,863 (96.8%) | 62 (3.2%) |
Health Insurance Coverage by Household Income in Mason
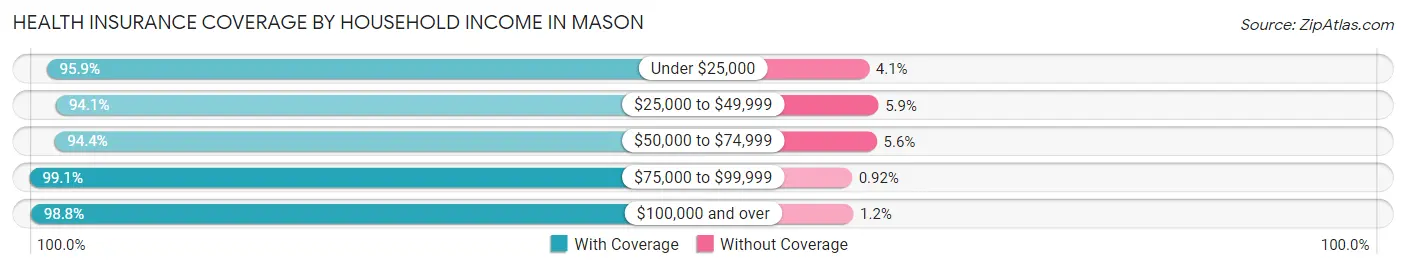
| Household Income | With Coverage | Without Coverage |
| Under $25,000 | 1,531 (95.9%) | 66 (4.1%) |
| $25,000 to $49,999 | 2,922 (94.1%) | 183 (5.9%) |
| $50,000 to $74,999 | 2,890 (94.4%) | 171 (5.6%) |
| $75,000 to $99,999 | 3,444 (99.1%) | 32 (0.9%) |
| $100,000 and over | 22,874 (98.8%) | 273 (1.2%) |
Public vs Private Health Insurance Coverage by Age in Mason
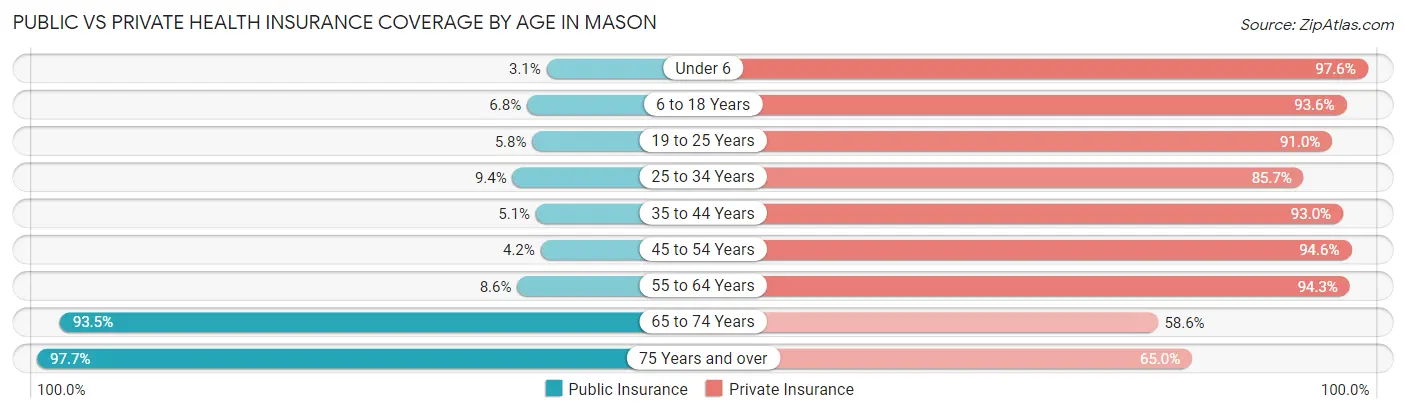
| Age Bracket | Public Insurance | Private Insurance |
| Under 6 | 58 (3.1%) | 1,822 (97.6%) |
| 6 to 18 Years | 518 (6.8%) | 7,187 (93.6%) |
| 19 to 25 Years | 111 (5.8%) | 1,752 (91.0%) |
| 25 to 34 Years | 255 (9.4%) | 2,319 (85.7%) |
| 35 to 44 Years | 272 (5.1%) | 4,974 (93.0%) |
| 45 to 54 Years | 220 (4.2%) | 4,928 (94.6%) |
| 55 to 64 Years | 442 (8.6%) | 4,874 (94.3%) |
| 65 to 74 Years | 1,943 (93.5%) | 1,218 (58.6%) |
| 75 Years and over | 2,422 (97.7%) | 1,612 (65.0%) |
| Total | 6,241 (18.1%) | 30,686 (89.0%) |
Disability Status by Sex by Age in Mason
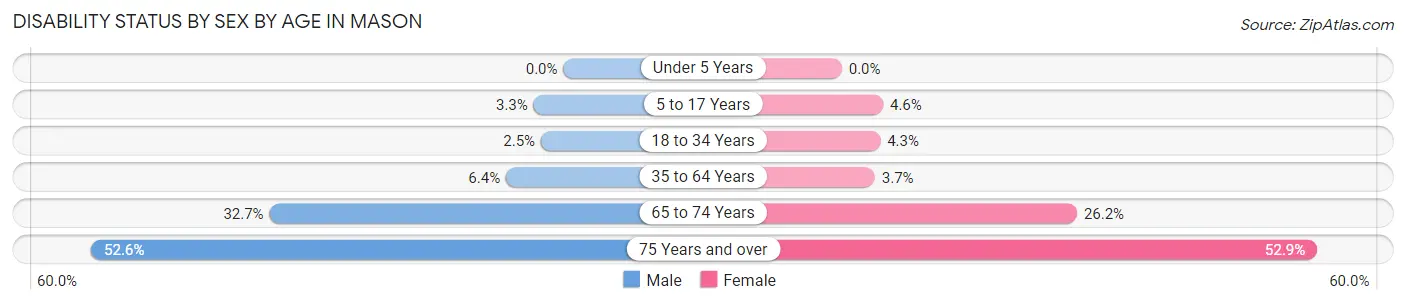
| Age Bracket | Male | Female |
| Under 5 Years | 0 (0.0%) | 0 (0.0%) |
| 5 to 17 Years | 139 (3.3%) | 143 (4.6%) |
| 18 to 34 Years | 54 (2.5%) | 131 (4.3%) |
| 35 to 64 Years | 496 (6.4%) | 293 (3.7%) |
| 65 to 74 Years | 323 (32.7%) | 286 (26.2%) |
| 75 Years and over | 569 (52.6%) | 740 (52.9%) |
Disability Class by Sex by Age in Mason
Disability Class: Hearing Difficulty
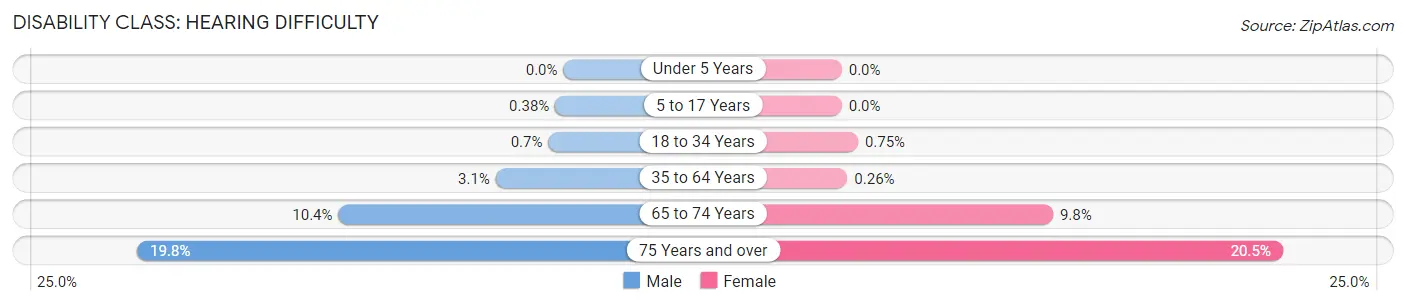
| Age Bracket | Male | Female |
| Under 5 Years | 0 (0.0%) | 0 (0.0%) |
| 5 to 17 Years | 16 (0.4%) | 0 (0.0%) |
| 18 to 34 Years | 15 (0.7%) | 23 (0.7%) |
| 35 to 64 Years | 244 (3.1%) | 21 (0.3%) |
| 65 to 74 Years | 103 (10.4%) | 107 (9.8%) |
| 75 Years and over | 214 (19.8%) | 286 (20.5%) |
Disability Class: Vision Difficulty
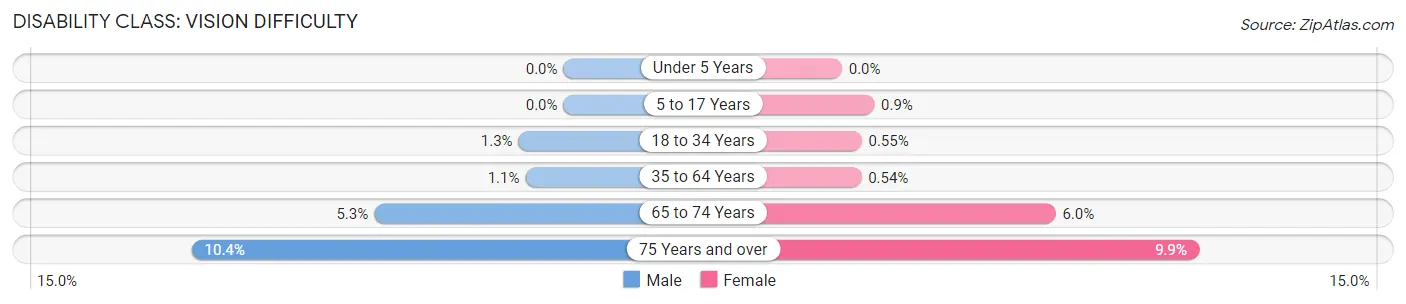
| Age Bracket | Male | Female |
| Under 5 Years | 0 (0.0%) | 0 (0.0%) |
| 5 to 17 Years | 0 (0.0%) | 28 (0.9%) |
| 18 to 34 Years | 27 (1.3%) | 17 (0.5%) |
| 35 to 64 Years | 82 (1.1%) | 43 (0.5%) |
| 65 to 74 Years | 52 (5.3%) | 65 (5.9%) |
| 75 Years and over | 112 (10.3%) | 139 (9.9%) |
Disability Class: Cognitive Difficulty
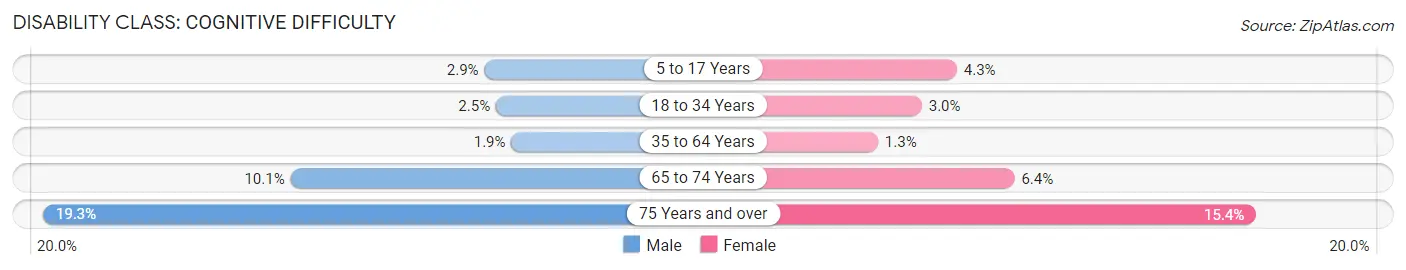
| Age Bracket | Male | Female |
| 5 to 17 Years | 123 (2.9%) | 133 (4.3%) |
| 18 to 34 Years | 54 (2.5%) | 91 (3.0%) |
| 35 to 64 Years | 150 (1.9%) | 107 (1.3%) |
| 65 to 74 Years | 100 (10.1%) | 70 (6.4%) |
| 75 Years and over | 209 (19.3%) | 215 (15.4%) |
Disability Class: Ambulatory Difficulty
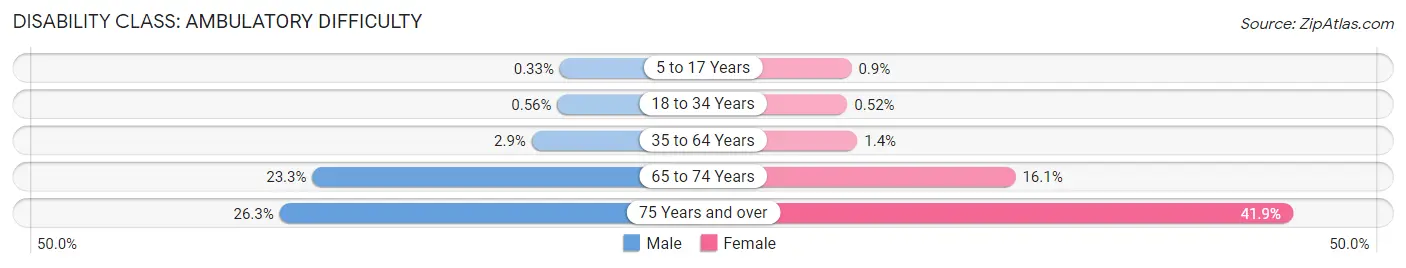
| Age Bracket | Male | Female |
| 5 to 17 Years | 14 (0.3%) | 28 (0.9%) |
| 18 to 34 Years | 12 (0.6%) | 16 (0.5%) |
| 35 to 64 Years | 228 (2.9%) | 115 (1.4%) |
| 65 to 74 Years | 230 (23.3%) | 176 (16.1%) |
| 75 Years and over | 285 (26.3%) | 585 (41.8%) |
Disability Class: Self-Care Difficulty
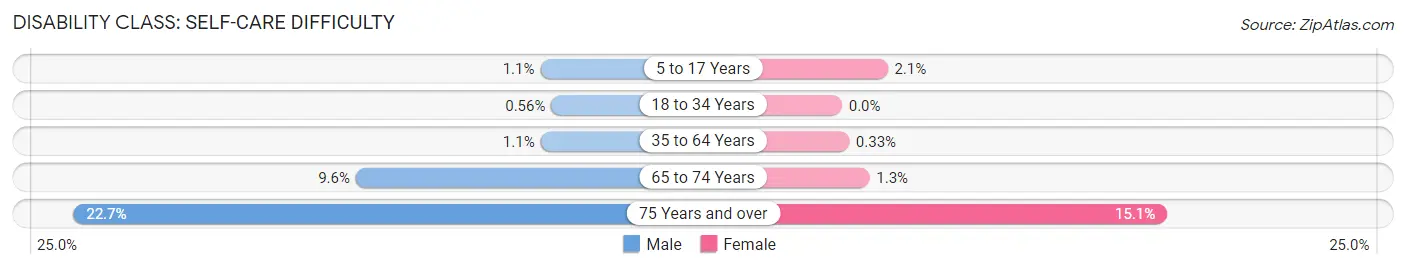
| Age Bracket | Male | Female |
| 5 to 17 Years | 45 (1.1%) | 66 (2.1%) |
| 18 to 34 Years | 12 (0.6%) | 0 (0.0%) |
| 35 to 64 Years | 82 (1.1%) | 26 (0.3%) |
| 65 to 74 Years | 95 (9.6%) | 14 (1.3%) |
| 75 Years and over | 246 (22.7%) | 211 (15.1%) |
Technology Access in Mason
Computing Device Access in Mason
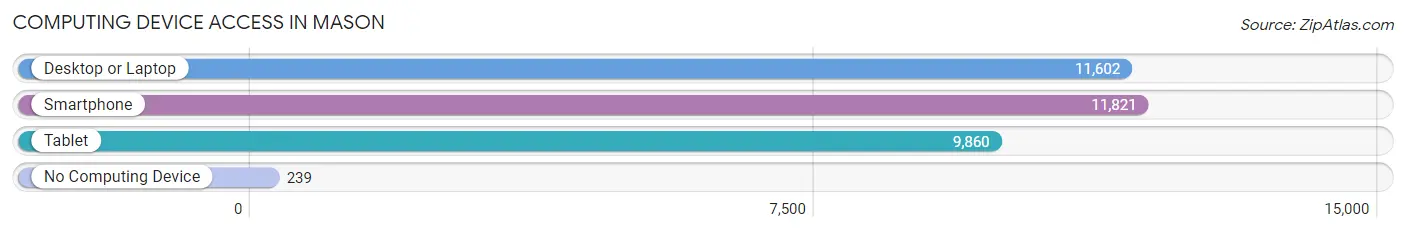
| Device Type | # Households | % Households |
| Desktop or Laptop | 11,602 | 91.6% |
| Smartphone | 11,821 | 93.3% |
| Tablet | 9,860 | 77.8% |
| No Computing Device | 239 | 1.9% |
| Total | 12,670 | 100.0% |
Internet Access in Mason
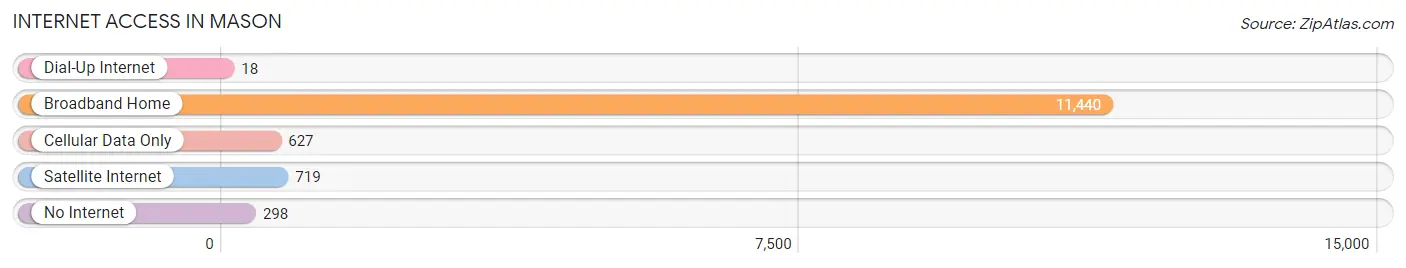
| Internet Type | # Households | % Households |
| Dial-Up Internet | 18 | 0.1% |
| Broadband Home | 11,440 | 90.3% |
| Cellular Data Only | 627 | 5.0% |
| Satellite Internet | 719 | 5.7% |
| No Internet | 298 | 2.4% |
| Total | 12,670 | 100.0% |
Mason Summary
Mason, Ohio is a city located in Warren County, Ohio, United States. It is part of the Cincinnati metropolitan area and is located about 22 miles northeast of downtown Cincinnati. The city was founded in 1815 and has a population of about 30,000 people.
History
Mason was founded in 1815 by William Mason, a Revolutionary War veteran. He purchased the land from the Symmes Purchase and named the town after himself. The town was originally known as Palmyra, but the name was changed to Mason in 1835.
The city was incorporated in 1835 and was the first city in Warren County to be incorporated. The city was originally a farming community, but it began to grow in the late 19th century with the arrival of the railroad. The railroad allowed for the transportation of goods and people to and from the city, which helped to spur economic growth.
The city continued to grow throughout the 20th century, and by the 2000s, it had become a major suburb of Cincinnati. The city has seen a large influx of new residents in recent years, and its population has grown significantly.
Geography
Mason is located in Warren County, Ohio, about 22 miles northeast of downtown Cincinnati. The city is situated on the Little Miami River and is surrounded by the cities of Deerfield Township, Hamilton Township, and Lebanon.
The city has a total area of 16.2 square miles, of which 16.1 square miles is land and 0.1 square miles is water. The city is located in the humid continental climate zone, with hot, humid summers and cold, snowy winters.
Economy
Mason is a major suburb of Cincinnati and is home to a number of large employers. The city is home to the headquarters of Procter & Gamble, Cintas Corporation, and Luxottica. The city is also home to a number of smaller businesses, including restaurants, retail stores, and professional services.
The city has a strong economy and a low unemployment rate. The median household income in Mason is $90,000, which is higher than the national average. The city also has a low poverty rate, with only 8.3% of the population living below the poverty line.
Demographics
Mason has a population of about 30,000 people. The city is predominantly white, with about 87% of the population identifying as white. The city also has a large Asian population, with about 8% of the population identifying as Asian.
The city has a median age of 37.5 years, which is slightly lower than the national average. The city also has a higher than average percentage of college-educated residents, with about 44% of the population having a bachelor's degree or higher.
Conclusion
Mason, Ohio is a city located in Warren County, Ohio, United States. It is part of the Cincinnati metropolitan area and is located about 22 miles northeast of downtown Cincinnati. The city was founded in 1815 and has a population of about 30,000 people. Mason has a strong economy and a low unemployment rate, and the median household income in Mason is $90,000, which is higher than the national average. The city is predominantly white, with about 87% of the population identifying as white, and it also has a large Asian population, with about 8% of the population identifying as Asian. Mason is a major suburb of Cincinnati and is home to a number of large employers, as well as a number of smaller businesses.
Common Questions
What is Per Capita Income in Mason?
Per Capita income in Mason is $58,876.
What is the Median Family Income in Mason?
Median Family Income in Mason is $140,991.
What is the Median Household income in Mason?
Median Household Income in Mason is $121,082.
What is Income or Wage Gap in Mason?
Income or Wage Gap in Mason is 51.2%.
Women in Mason earn 48.8 cents for every dollar earned by a man.
What is Inequality or Gini Index in Mason?
Inequality or Gini Index in Mason is 0.42.
What is the Total Population of Mason?
Total Population of Mason is 34,768.
What is the Total Male Population of Mason?
Total Male Population of Mason is 17,414.
What is the Total Female Population of Mason?
Total Female Population of Mason is 17,354.
What is the Ratio of Males per 100 Females in Mason?
There are 100.35 Males per 100 Females in Mason.
What is the Ratio of Females per 100 Males in Mason?
There are 99.66 Females per 100 Males in Mason.
What is the Median Population Age in Mason?
Median Population Age in Mason is 41.7 Years.
What is the Average Family Size in Mason
Average Family Size in Mason is 3.1 People.
What is the Average Household Size in Mason
Average Household Size in Mason is 2.7 People.
How Large is the Labor Force in Mason?
There are 18,331 People in the Labor Forcein in Mason.
What is the Percentage of People in the Labor Force in Mason?
67.4% of People are in the Labor Force in Mason.
What is the Unemployment Rate in Mason?
Unemployment Rate in Mason is 1.8%.