Cities with the Fewest Births per 1,000 Women Receiving Public Assitance in Ohio
RELATED REPORTS & OPTIONS
Lowest Birth Rate | Public Income
Ohio
Compare Cities
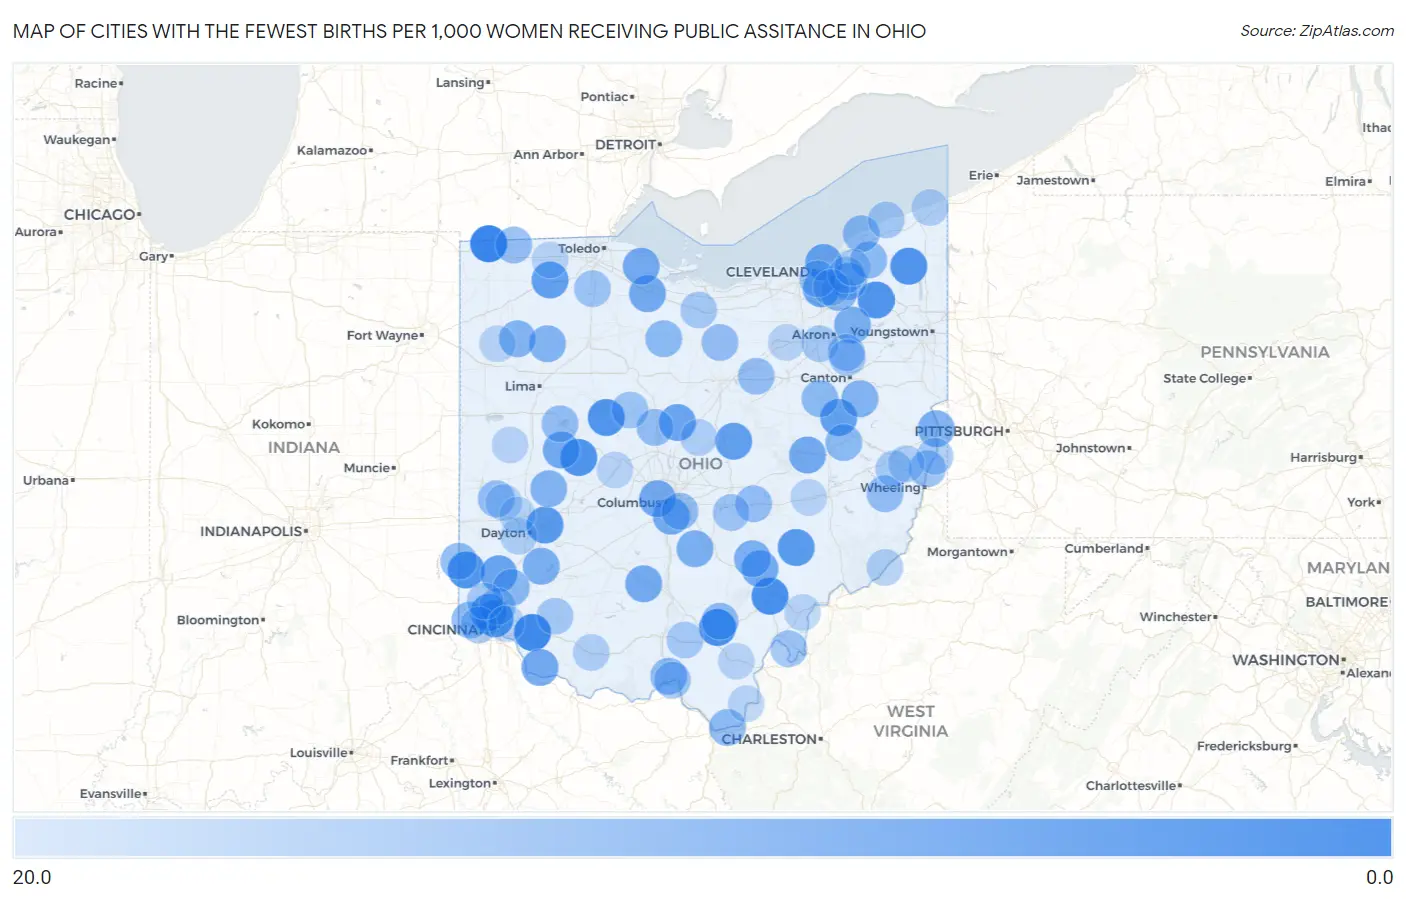
Map of Cities with the Fewest Births per 1,000 Women Receiving Public Assitance in Ohio
20.0
0.0
Cities with the Fewest Births per 1,000 Women Receiving Public Assitance in Ohio
| City | Births / 1,000 Women | vs State | vs National | |
| 1. | Pioneer | 3.0 | 55.0(-52.0)#1 | 52.0(-49.0)#43 |
| 2. | Batavia | 4.0 | 55.0(-51.0)#2 | 52.0(-48.0)#66 |
| 3. | Athens | 5.0 | 55.0(-50.0)#3 | 52.0(-47.0)#81 |
| 4. | Wellston | 5.0 | 55.0(-50.0)#4 | 52.0(-47.0)#100 |
| 5. | Oxford | 6.0 | 55.0(-49.0)#5 | 52.0(-46.0)#129 |
| 6. | St Bernard | 6.0 | 55.0(-49.0)#6 | 52.0(-46.0)#152 |
| 7. | Orwell | 6.0 | 55.0(-49.0)#7 | 52.0(-46.0)#163 |
| 8. | West Liberty | 6.0 | 55.0(-49.0)#8 | 52.0(-46.0)#164 |
| 9. | Hiram | 6.0 | 55.0(-49.0)#9 | 52.0(-46.0)#175 |
| 10. | Mount Victory | 6.0 | 55.0(-49.0)#10 | 52.0(-46.0)#190 |
| 11. | North College Hill | 7.0 | 55.0(-48.0)#11 | 52.0(-45.0)#197 |
| 12. | Mcconnelsville | 7.0 | 55.0(-48.0)#12 | 52.0(-45.0)#233 |
| 13. | Wright Patterson Afb | 7.0 | 55.0(-48.0)#13 | 52.0(-45.0)#246 |
| 14. | Dover | 8.0 | 55.0(-47.0)#14 | 52.0(-44.0)#285 |
| 15. | Gambier | 8.0 | 55.0(-47.0)#15 | 52.0(-44.0)#337 |
| 16. | Liberty Center | 8.0 | 55.0(-47.0)#16 | 52.0(-44.0)#364 |
| 17. | Trenton | 9.0 | 55.0(-46.0)#17 | 52.0(-43.0)#380 |
| 18. | Independence | 9.0 | 55.0(-46.0)#18 | 52.0(-43.0)#385 |
| 19. | Cardington | 9.0 | 55.0(-46.0)#19 | 52.0(-43.0)#434 |
| 20. | Bratenahl | 9.0 | 55.0(-46.0)#20 | 52.0(-43.0)#442 |
| 21. | Obetz | 10.0 | 55.0(-45.0)#21 | 52.0(-42.0)#499 |
| 22. | West Lafayette | 10.0 | 55.0(-45.0)#22 | 52.0(-42.0)#527 |
| 23. | Stony Prairie | 10.0 | 55.0(-45.0)#23 | 52.0(-42.0)#540 |
| 24. | De Graff | 10.0 | 55.0(-45.0)#24 | 52.0(-42.0)#544 |
| 25. | Frankfort | 10.0 | 55.0(-45.0)#25 | 52.0(-42.0)#557 |
| 26. | Marble Cliff | 10.0 | 55.0(-45.0)#26 | 52.0(-42.0)#566 |
| 27. | Felicity | 10.0 | 55.0(-45.0)#27 | 52.0(-42.0)#591 |
| 28. | Murray City | 10.0 | 55.0(-45.0)#28 | 52.0(-42.0)#594 |
| 29. | Rocky Ridge | 10.0 | 55.0(-45.0)#29 | 52.0(-42.0)#601 |
| 30. | Kent | 11.0 | 55.0(-44.0)#30 | 52.0(-41.0)#603 |
| 31. | Toronto | 11.0 | 55.0(-44.0)#31 | 52.0(-41.0)#628 |
| 32. | Waynesville | 11.0 | 55.0(-44.0)#32 | 52.0(-41.0)#649 |
| 33. | Amanda | 11.0 | 55.0(-44.0)#33 | 52.0(-41.0)#683 |
| 34. | New Straitsville | 11.0 | 55.0(-44.0)#34 | 52.0(-41.0)#684 |
| 35. | Ottawa | 12.0 | 55.0(-43.0)#35 | 52.0(-40.0)#745 |
| 36. | Chagrin Falls | 12.0 | 55.0(-43.0)#36 | 52.0(-40.0)#750 |
| 37. | Magnolia | 12.0 | 55.0(-43.0)#37 | 52.0(-40.0)#795 |
| 38. | Christiansburg | 12.0 | 55.0(-43.0)#38 | 52.0(-40.0)#827 |
| 39. | Dupont | 12.0 | 55.0(-43.0)#39 | 52.0(-40.0)#844 |
| 40. | Chardon | 13.0 | 55.0(-42.0)#40 | 52.0(-39.0)#871 |
| 41. | Miami Heights | 13.0 | 55.0(-42.0)#41 | 52.0(-39.0)#877 |
| 42. | Four Bridges | 13.0 | 55.0(-42.0)#42 | 52.0(-39.0)#888 |
| 43. | Fairport Harbor | 13.0 | 55.0(-42.0)#43 | 52.0(-39.0)#893 |
| 44. | Rosemount | 13.0 | 55.0(-42.0)#44 | 52.0(-39.0)#909 |
| 45. | Gnadenhutten | 13.0 | 55.0(-42.0)#45 | 52.0(-39.0)#922 |
| 46. | Chesapeake | 13.0 | 55.0(-42.0)#46 | 52.0(-39.0)#932 |
| 47. | Bloomville | 13.0 | 55.0(-42.0)#47 | 52.0(-39.0)#944 |
| 48. | Glenwillow | 13.0 | 55.0(-42.0)#48 | 52.0(-39.0)#947 |
| 49. | Hamden | 13.0 | 55.0(-42.0)#49 | 52.0(-39.0)#958 |
| 50. | College Corner | 13.0 | 55.0(-42.0)#50 | 52.0(-39.0)#978 |
| 51. | Wilmot | 13.0 | 55.0(-42.0)#51 | 52.0(-39.0)#980 |
| 52. | Blacklick Estates | 14.0 | 55.0(-41.0)#52 | 52.0(-38.0)#1,001 |
| 53. | Uniontown | 14.0 | 55.0(-41.0)#53 | 52.0(-38.0)#1,008 |
| 54. | Greenwich | 14.0 | 55.0(-41.0)#54 | 52.0(-38.0)#1,069 |
| 55. | Bethesda | 14.0 | 55.0(-41.0)#55 | 52.0(-38.0)#1,073 |
| 56. | Fayette | 14.0 | 55.0(-41.0)#56 | 52.0(-38.0)#1,078 |
| 57. | Lakeview | 14.0 | 55.0(-41.0)#57 | 52.0(-38.0)#1,080 |
| 58. | Jeromesville | 14.0 | 55.0(-41.0)#58 | 52.0(-38.0)#1,103 |
| 59. | Rayland | 14.0 | 55.0(-41.0)#59 | 52.0(-38.0)#1,116 |
| 60. | Waldo | 14.0 | 55.0(-41.0)#60 | 52.0(-38.0)#1,127 |
| 61. | Pitsburg | 14.0 | 55.0(-41.0)#61 | 52.0(-38.0)#1,129 |
| 62. | Gratiot | 14.0 | 55.0(-41.0)#62 | 52.0(-38.0)#1,135 |
| 63. | Bowling Green | 15.0 | 55.0(-40.0)#63 | 52.0(-37.0)#1,139 |
| 64. | Woodlawn | 15.0 | 55.0(-40.0)#64 | 52.0(-37.0)#1,202 |
| 65. | New Boston | 15.0 | 55.0(-40.0)#65 | 52.0(-37.0)#1,221 |
| 66. | Newburgh Heights | 15.0 | 55.0(-40.0)#66 | 52.0(-37.0)#1,232 |
| 67. | Thornville | 15.0 | 55.0(-40.0)#67 | 52.0(-37.0)#1,233 |
| 68. | Racine | 15.0 | 55.0(-40.0)#68 | 52.0(-37.0)#1,250 |
| 69. | New Bloomington | 15.0 | 55.0(-40.0)#69 | 52.0(-37.0)#1,287 |
| 70. | Norton | 16.0 | 55.0(-39.0)#70 | 52.0(-36.0)#1,312 |
| 71. | North Madison | 16.0 | 55.0(-39.0)#71 | 52.0(-36.0)#1,322 |
| 72. | Covedale | 16.0 | 55.0(-39.0)#72 | 52.0(-36.0)#1,332 |
| 73. | Pleasant Run | 16.0 | 55.0(-39.0)#73 | 52.0(-36.0)#1,337 |
| 74. | Greentown | 16.0 | 55.0(-39.0)#74 | 52.0(-36.0)#1,356 |
| 75. | Monroeville | 16.0 | 55.0(-39.0)#75 | 52.0(-36.0)#1,396 |
| 76. | Lake Lorelei | 16.0 | 55.0(-39.0)#76 | 52.0(-36.0)#1,407 |
| 77. | Brilliant | 16.0 | 55.0(-39.0)#77 | 52.0(-36.0)#1,412 |
| 78. | Hunting Valley | 16.0 | 55.0(-39.0)#78 | 52.0(-36.0)#1,428 |
| 79. | Beaver | 16.0 | 55.0(-39.0)#79 | 52.0(-36.0)#1,458 |
| 80. | New Athens | 16.0 | 55.0(-39.0)#80 | 52.0(-36.0)#1,476 |
| 81. | Bedford | 17.0 | 55.0(-38.0)#81 | 52.0(-35.0)#1,494 |
| 82. | Chesterland | 17.0 | 55.0(-38.0)#82 | 52.0(-35.0)#1,506 |
| 83. | North Kingsville | 17.0 | 55.0(-38.0)#83 | 52.0(-35.0)#1,555 |
| 84. | Drexel | 17.0 | 55.0(-38.0)#84 | 52.0(-35.0)#1,580 |
| 85. | Winchester | 17.0 | 55.0(-38.0)#85 | 52.0(-35.0)#1,583 |
| 86. | Matamoras | 17.0 | 55.0(-38.0)#86 | 52.0(-35.0)#1,586 |
| 87. | Adena | 17.0 | 55.0(-38.0)#87 | 52.0(-35.0)#1,607 |
| 88. | Potsdam | 17.0 | 55.0(-38.0)#88 | 52.0(-35.0)#1,631 |
| 89. | Sparta | 17.0 | 55.0(-38.0)#89 | 52.0(-35.0)#1,646 |
| 90. | Clayton | 18.0 | 55.0(-37.0)#90 | 52.0(-34.0)#1,659 |
| 91. | Delta | 18.0 | 55.0(-37.0)#91 | 52.0(-34.0)#1,713 |
| 92. | New Concord | 18.0 | 55.0(-37.0)#92 | 52.0(-34.0)#1,721 |
| 93. | Fairfax | 18.0 | 55.0(-37.0)#93 | 52.0(-34.0)#1,749 |
| 94. | Fort Loramie | 18.0 | 55.0(-37.0)#94 | 52.0(-34.0)#1,752 |
| 95. | Westfield Center | 18.0 | 55.0(-37.0)#95 | 52.0(-34.0)#1,760 |
| 96. | Rio Grande | 18.0 | 55.0(-37.0)#96 | 52.0(-34.0)#1,783 |
| 97. | Milford Center | 18.0 | 55.0(-37.0)#97 | 52.0(-34.0)#1,787 |
| 98. | Coolville | 18.0 | 55.0(-37.0)#98 | 52.0(-34.0)#1,798 |
| 99. | Crown City | 18.0 | 55.0(-37.0)#99 | 52.0(-34.0)#1,805 |
| 100. | Grover Hill | 18.0 | 55.0(-37.0)#100 | 52.0(-34.0)#1,811 |
Common Questions
What are the Top 10 Cities with the Fewest Births per 1,000 Women Receiving Public Assitance in Ohio?
Top 10 Cities with the Fewest Births per 1,000 Women Receiving Public Assitance in Ohio are:
#1
3.0
#2
4.0
#3
5.0
#4
5.0
#5
6.0
#6
6.0
#7
6.0
#8
6.0
#9
6.0
#10
6.0
What city has the Fewest Births per 1,000 Women Receiving Public Assitance in Ohio?
Pioneer has the Fewest Births per 1,000 Women Receiving Public Assitance in Ohio with 3.0.
What is the Number of Births per 1,000 Women Receiving Public Assitance in the State of Ohio?
Number of Births per 1,000 Women Receiving Public Assitance in Ohio is 55.0.
What is the Number of Births per 1,000 Women Receiving Public Assitance in the United States?
Number of Births per 1,000 Women Receiving Public Assitance in the United States is 52.0.