Howard, OH Map & Demographics
Howard Map
Howard Overview
$25,173
PER CAPITA INCOME
$72,757
AVG FAMILY INCOME
0.28
INEQUALITY / GINI INDEX
463
TOTAL POPULATION
221
MALE POPULATION
242
FEMALE POPULATION
91.32
MALES / 100 FEMALES
109.50
FEMALES / 100 MALES
29.8
MEDIAN AGE
2.9
AVG FAMILY SIZE
3.0
AVG HOUSEHOLD SIZE
241
LABOR FORCE [ PEOPLE ]
84.0%
PERCENT IN LABOR FORCE
Howard Zip Codes
Howard Area Codes
Income in Howard
Income Overview in Howard
| Characteristic | Number | Measure |
| Per Capita Income | 463 | $25,173 |
| Median Family Income | 139 | $72,757 |
| Mean Family Income | 139 | $80,342 |
| Median Household Income | 152 | $0 |
| Mean Household Income | 152 | $79,367 |
| Income Deficit | 139 | $0 |
| Wage / Income Gap (%) | 463 | 0.00% |
| Wage / Income Gap ($) | 463 | 100.00¢ per $1 |
| Gini / Inequality Index | 463 | 0.28 |
Earnings by Sex in Howard
| Sex | Number | Average Earnings |
| Male | 93 (38.6%) | $0 |
| Female | 148 (61.4%) | $0 |
| Total | 241 (100.0%) | $0 |
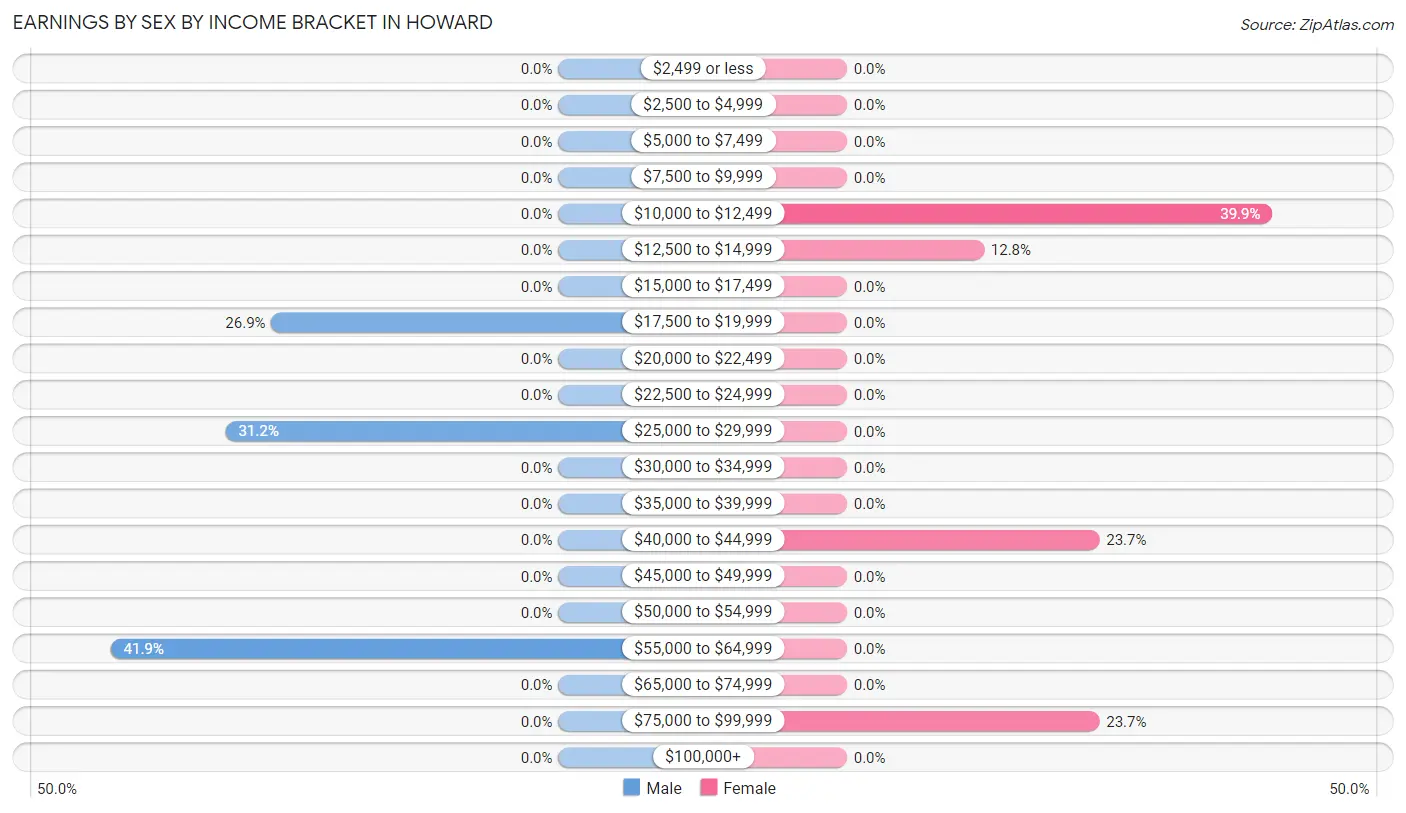
Earnings by Sex by Income Bracket in Howard
The most common earnings brackets in Howard are $55,000 to $64,999 for men (39 | 41.9%) and $10,000 to $12,499 for women (59 | 39.9%).
| Income | Male | Female |
| $2,499 or less | 0 (0.0%) | 0 (0.0%) |
| $2,500 to $4,999 | 0 (0.0%) | 0 (0.0%) |
| $5,000 to $7,499 | 0 (0.0%) | 0 (0.0%) |
| $7,500 to $9,999 | 0 (0.0%) | 0 (0.0%) |
| $10,000 to $12,499 | 0 (0.0%) | 59 (39.9%) |
| $12,500 to $14,999 | 0 (0.0%) | 19 (12.8%) |
| $15,000 to $17,499 | 0 (0.0%) | 0 (0.0%) |
| $17,500 to $19,999 | 25 (26.9%) | 0 (0.0%) |
| $20,000 to $22,499 | 0 (0.0%) | 0 (0.0%) |
| $22,500 to $24,999 | 0 (0.0%) | 0 (0.0%) |
| $25,000 to $29,999 | 29 (31.2%) | 0 (0.0%) |
| $30,000 to $34,999 | 0 (0.0%) | 0 (0.0%) |
| $35,000 to $39,999 | 0 (0.0%) | 0 (0.0%) |
| $40,000 to $44,999 | 0 (0.0%) | 35 (23.6%) |
| $45,000 to $49,999 | 0 (0.0%) | 0 (0.0%) |
| $50,000 to $54,999 | 0 (0.0%) | 0 (0.0%) |
| $55,000 to $64,999 | 39 (41.9%) | 0 (0.0%) |
| $65,000 to $74,999 | 0 (0.0%) | 0 (0.0%) |
| $75,000 to $99,999 | 0 (0.0%) | 35 (23.6%) |
| $100,000+ | 0 (0.0%) | 0 (0.0%) |
| Total | 93 (100.0%) | 148 (100.0%) |
Earnings by Sex by Educational Attainment in Howard
| Educational Attainment | Male Income | Female Income |
| Less than High School | - | - |
| High School Diploma | - | - |
| College or Associate's Degree | - | - |
| Bachelor's Degree | - | - |
| Graduate Degree | - | - |
| Total | - | - |
Family Income in Howard
Family Income Brackets in Howard
According to the Howard family income data, there are 53 families falling into the $50,000 to $74,999 income range, which is the most common income bracket and makes up 38.1% of all families.
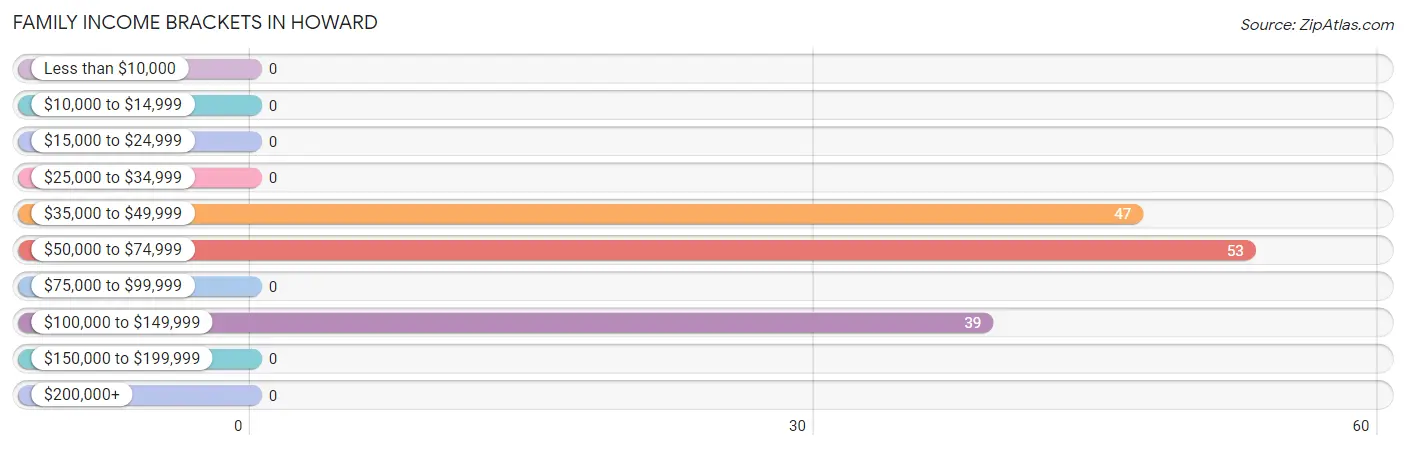
| Income Bracket | # Families | % Families |
| Less than $10,000 | 0 | 0.0% |
| $10,000 to $14,999 | 0 | 0.0% |
| $15,000 to $24,999 | 0 | 0.0% |
| $25,000 to $34,999 | 0 | 0.0% |
| $35,000 to $49,999 | 47 | 33.8% |
| $50,000 to $74,999 | 53 | 38.1% |
| $75,000 to $99,999 | 0 | 0.0% |
| $100,000 to $149,999 | 39 | 28.1% |
| $150,000 to $199,999 | 0 | 0.0% |
| $200,000+ | 0 | 0.0% |
Family Income by Famaliy Size in Howard
| Income Bracket | # Families | Median Income |
| 2-Person Families | 46 (33.1%) | $0 |
| 3-Person Families | 54 (38.9%) | $0 |
| 4-Person Families | 39 (28.1%) | $0 |
| 5-Person Families | 0 (0.0%) | $0 |
| 6-Person Families | 0 (0.0%) | $0 |
| 7+ Person Families | 0 (0.0%) | $0 |
| Total | 139 (100.0%) | $72,757 |
Family Income by Number of Earners in Howard
| Number of Earners | # Families | Median Income |
| No Earners | 0 (0.0%) | $0 |
| 1 Earner | 81 (58.3%) | $0 |
| 2 Earners | 58 (41.7%) | $0 |
| 3+ Earners | 0 (0.0%) | $0 |
| Total | 139 (100.0%) | $72,757 |
Household Income in Howard
Household Income Brackets in Howard
With 60 households falling in the category, the $35,000 to $49,999 income range is the most frequent in Howard, accounting for 39.5% of all households.
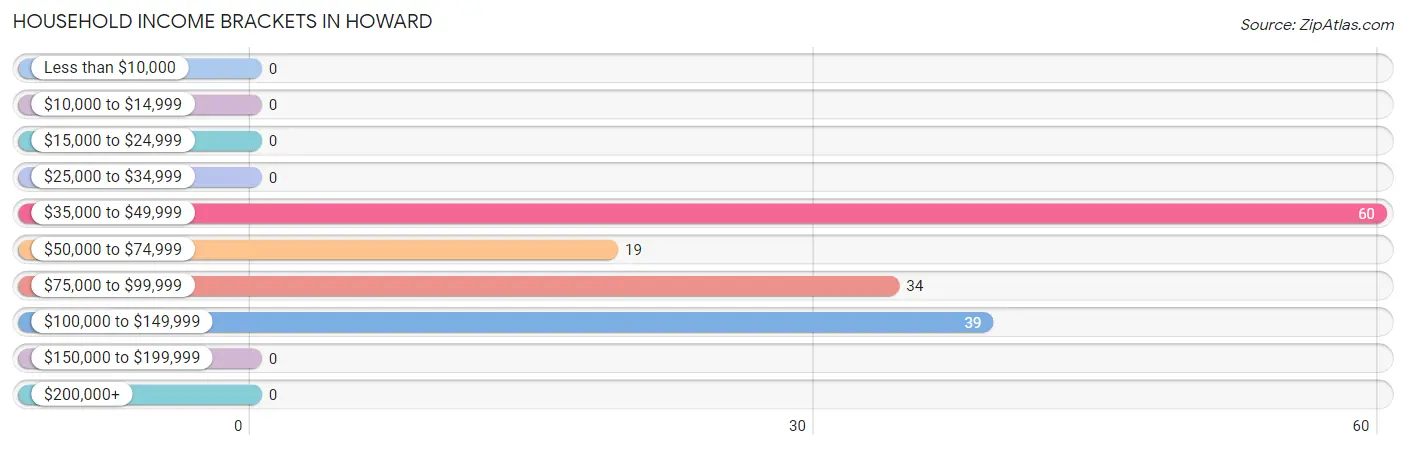
| Income Bracket | # Households | % Households |
| Less than $10,000 | 0 | 0.0% |
| $10,000 to $14,999 | 0 | 0.0% |
| $15,000 to $24,999 | 0 | 0.0% |
| $25,000 to $34,999 | 0 | 0.0% |
| $35,000 to $49,999 | 60 | 39.5% |
| $50,000 to $74,999 | 19 | 12.5% |
| $75,000 to $99,999 | 34 | 22.4% |
| $100,000 to $149,999 | 39 | 25.7% |
| $150,000 to $199,999 | 0 | 0.0% |
| $200,000+ | 0 | 0.0% |
Household Income by Householder Age in Howard
| Income Bracket | # Households | Median Income |
| 15 to 24 Years | 0 (0.0%) | $0 |
| 25 to 44 Years | 74 (48.7%) | $0 |
| 45 to 64 Years | 32 (21.0%) | $0 |
| 65+ Years | 46 (30.3%) | $0 |
| Total | 152 (100.0%) | $0 |
Poverty in Howard
Income Below Poverty by Sex and Age in Howard
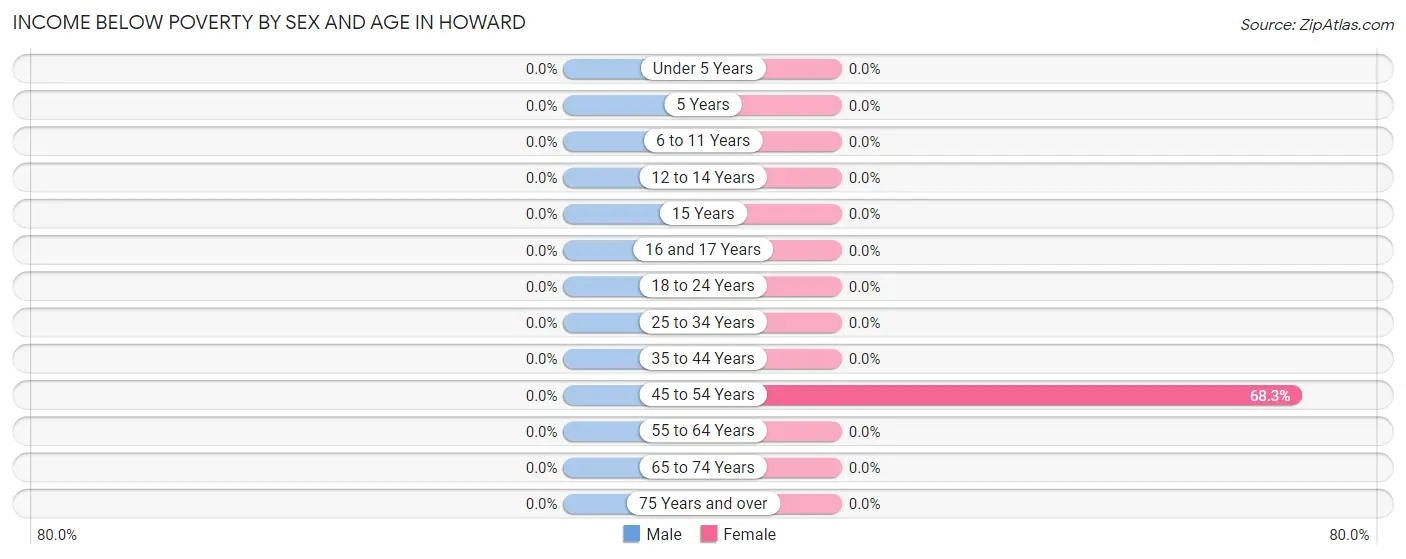
| Age Bracket | Male | Female |
| Under 5 Years | 0 (0.0%) | 0 (0.0%) |
| 5 Years | 0 (0.0%) | 0 (0.0%) |
| 6 to 11 Years | 0 (0.0%) | 0 (0.0%) |
| 12 to 14 Years | 0 (0.0%) | 0 (0.0%) |
| 15 Years | 0 (0.0%) | 0 (0.0%) |
| 16 and 17 Years | 0 (0.0%) | 0 (0.0%) |
| 18 to 24 Years | 0 (0.0%) | 0 (0.0%) |
| 25 to 34 Years | 0 (0.0%) | 0 (0.0%) |
| 35 to 44 Years | 0 (0.0%) | 0 (0.0%) |
| 45 to 54 Years | 0 (0.0%) | 41 (68.3%) |
| 55 to 64 Years | 0 (0.0%) | 0 (0.0%) |
| 65 to 74 Years | 0 (0.0%) | 0 (0.0%) |
| 75 Years and over | 0 (0.0%) | 0 (0.0%) |
| Total | 0 (0.0%) | 41 (16.9%) |
Income Above Poverty by Sex and Age in Howard
According to the poverty statistics in Howard, males aged under 5 years and females aged under 5 years are the age groups that are most secure financially, with 100.0% of males and 100.0% of females in these age groups living above the poverty line.
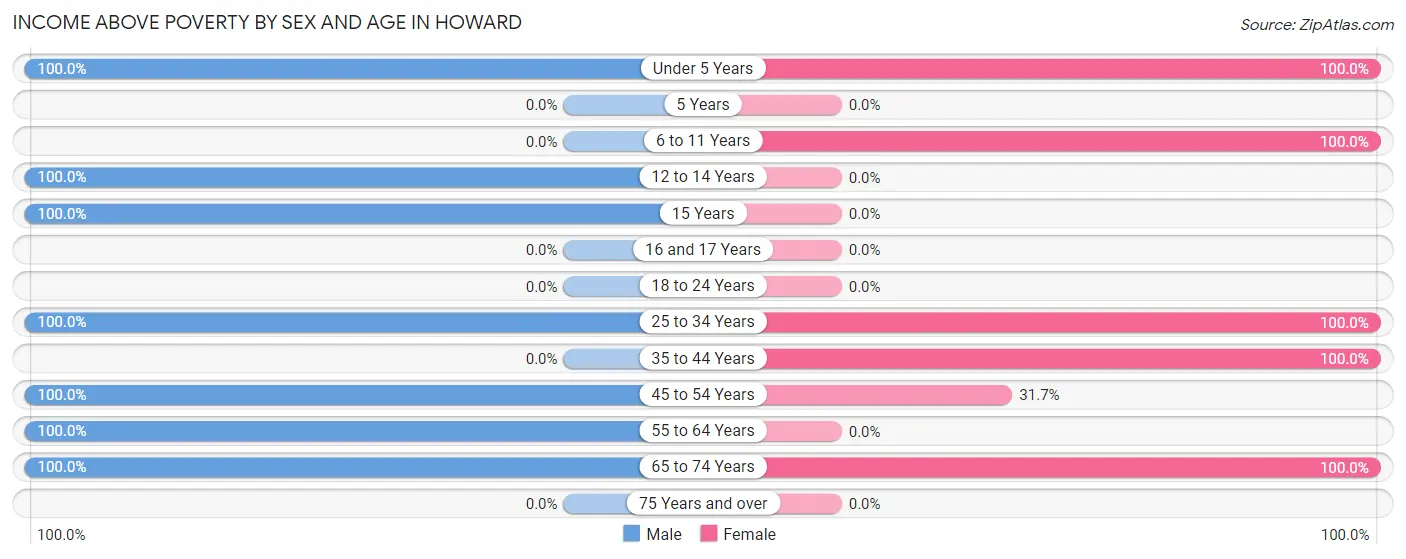
| Age Bracket | Male | Female |
| Under 5 Years | 31 (100.0%) | 34 (100.0%) |
| 5 Years | 0 (0.0%) | 0 (0.0%) |
| 6 to 11 Years | 0 (0.0%) | 48 (100.0%) |
| 12 to 14 Years | 38 (100.0%) | 0 (0.0%) |
| 15 Years | 25 (100.0%) | 0 (0.0%) |
| 16 and 17 Years | 0 (0.0%) | 0 (0.0%) |
| 18 to 24 Years | 0 (0.0%) | 0 (0.0%) |
| 25 to 34 Years | 39 (100.0%) | 53 (100.0%) |
| 35 to 44 Years | 0 (0.0%) | 35 (100.0%) |
| 45 to 54 Years | 29 (100.0%) | 19 (31.7%) |
| 55 to 64 Years | 25 (100.0%) | 0 (0.0%) |
| 65 to 74 Years | 34 (100.0%) | 12 (100.0%) |
| 75 Years and over | 0 (0.0%) | 0 (0.0%) |
| Total | 221 (100.0%) | 201 (83.1%) |
Income Below Poverty Among Married-Couple Families in Howard
| Children | Above Poverty | Below Poverty |
| No Children | 0 (0.0%) | 0 (0.0%) |
| 1 or 2 Children | 58 (100.0%) | 0 (0.0%) |
| 3 or 4 Children | 0 (0.0%) | 0 (0.0%) |
| 5 or more Children | 0 (0.0%) | 0 (0.0%) |
| Total | 58 (100.0%) | 0 (0.0%) |
Income Below Poverty Among Single-Parent Households in Howard
| Children | Single Father | Single Mother |
| No Children | 0 (0.0%) | 0 (0.0%) |
| 1 or 2 Children | 0 (0.0%) | 0 (0.0%) |
| 3 or 4 Children | 0 (0.0%) | 0 (0.0%) |
| 5 or more Children | 0 (0.0%) | 0 (0.0%) |
| Total | 0 (0.0%) | 0 (0.0%) |
Income Below Poverty Among Married-Couple vs Single-Parent Households in Howard
| Children | Married-Couple Families | Single-Parent Households |
| No Children | 0 (0.0%) | 0 (0.0%) |
| 1 or 2 Children | 0 (0.0%) | 0 (0.0%) |
| 3 or 4 Children | 0 (0.0%) | 0 (0.0%) |
| 5 or more Children | 0 (0.0%) | 0 (0.0%) |
| Total | 0 (0.0%) | 0 (0.0%) |
Race in Howard
The most populous races in Howard are White / Caucasian (447 | 96.5%), and Two or more Races (16 | 3.5%).
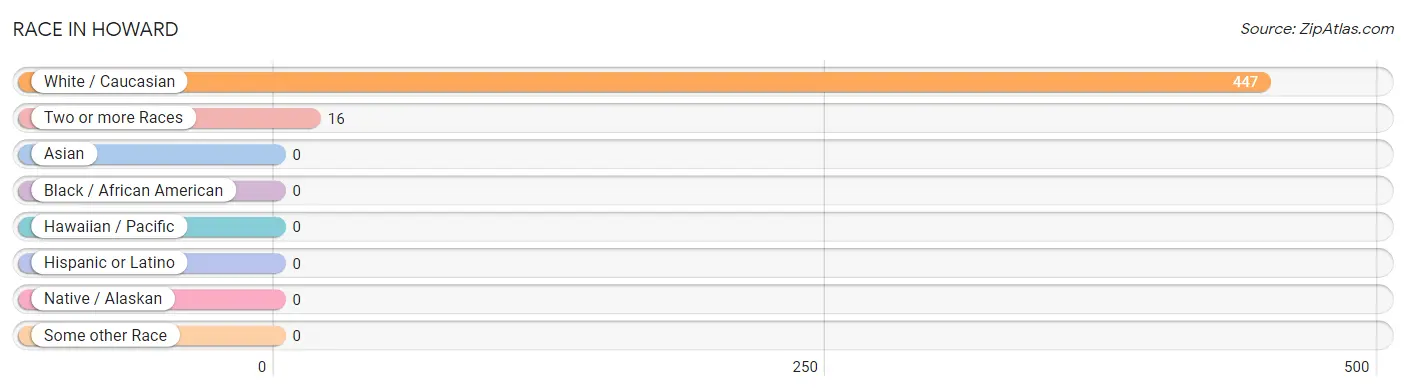
| Race | # Population | % Population |
| Asian | 0 | 0.0% |
| Black / African American | 0 | 0.0% |
| Hawaiian / Pacific | 0 | 0.0% |
| Hispanic or Latino | 0 | 0.0% |
| Native / Alaskan | 0 | 0.0% |
| White / Caucasian | 447 | 96.5% |
| Two or more Races | 16 | 3.5% |
| Some other Race | 0 | 0.0% |
| Total | 463 | 100.0% |
Ancestry in Howard
The most populous ancestries reported in Howard are German (325 | 70.2%), Irish (194 | 41.9%), American (99 | 21.4%), English (57 | 12.3%), and Apache (16 | 3.5%), together accounting for 149.2% of all Howard residents.
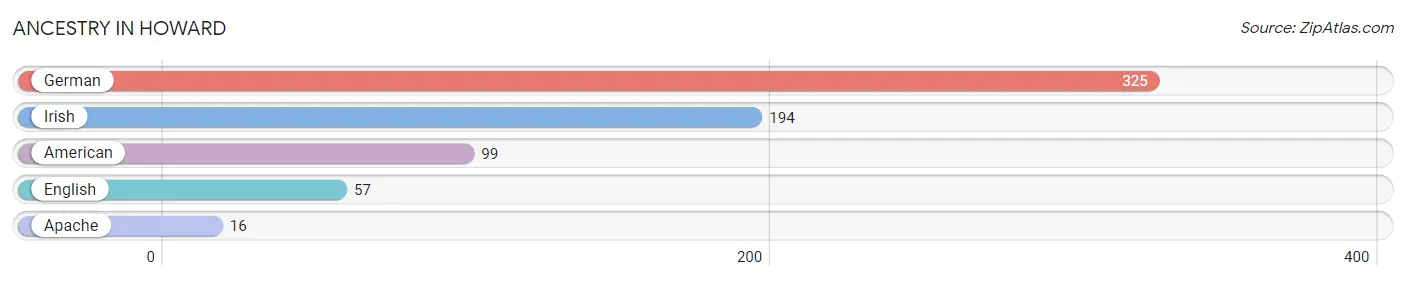
| Ancestry | # Population | % Population |
| American | 99 | 21.4% |
| Apache | 16 | 3.5% |
| English | 57 | 12.3% |
| German | 325 | 70.2% |
| Irish | 194 | 41.9% | View All 5 Rows |
Immigrants in Howard

| Immigration Origin | # Population | % Population | View All 0 Rows |
Sex and Age in Howard
Sex and Age in Howard
The most populous age groups in Howard are 25 to 29 Years (39 | 17.6%) for men and 10 to 14 Years (48 | 19.8%) for women.
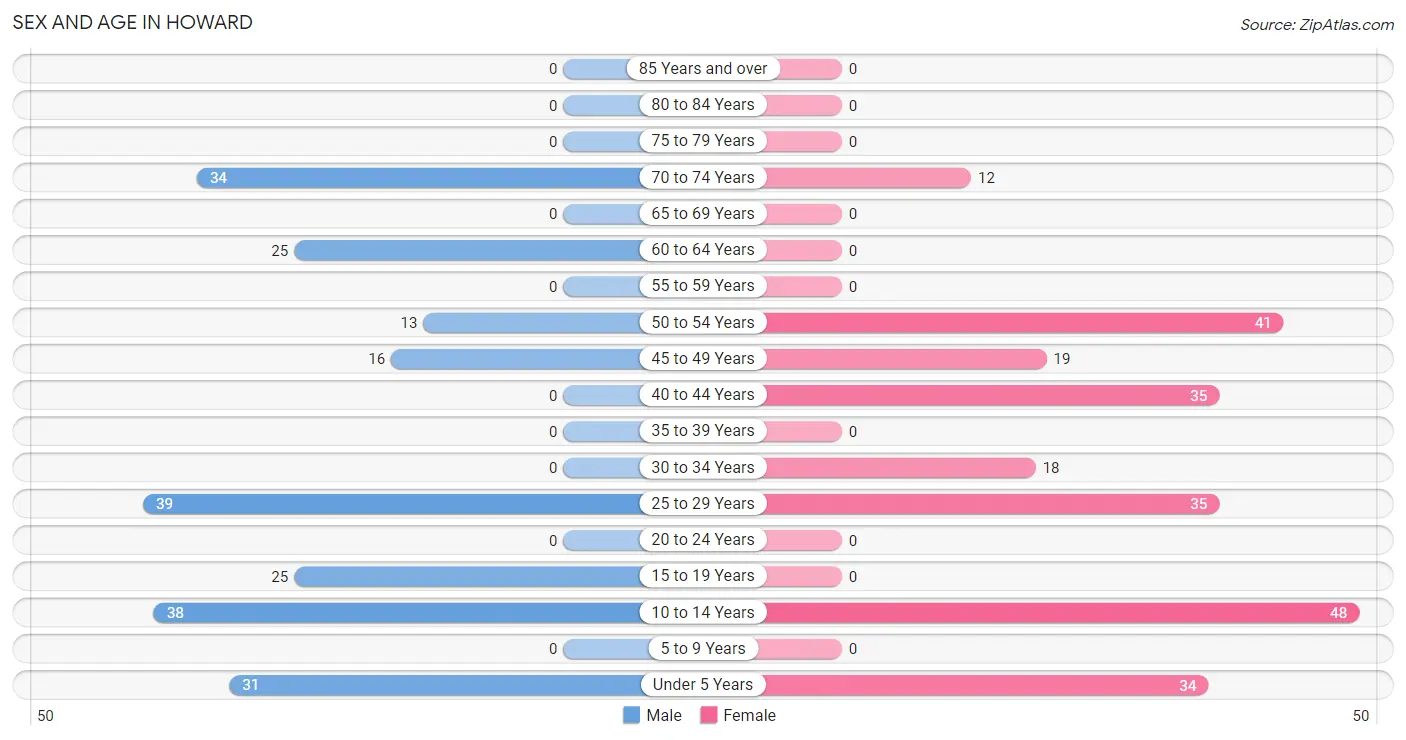
| Age Bracket | Male | Female |
| Under 5 Years | 31 (14.0%) | 34 (14.1%) |
| 5 to 9 Years | 0 (0.0%) | 0 (0.0%) |
| 10 to 14 Years | 38 (17.2%) | 48 (19.8%) |
| 15 to 19 Years | 25 (11.3%) | 0 (0.0%) |
| 20 to 24 Years | 0 (0.0%) | 0 (0.0%) |
| 25 to 29 Years | 39 (17.6%) | 35 (14.5%) |
| 30 to 34 Years | 0 (0.0%) | 18 (7.4%) |
| 35 to 39 Years | 0 (0.0%) | 0 (0.0%) |
| 40 to 44 Years | 0 (0.0%) | 35 (14.5%) |
| 45 to 49 Years | 16 (7.2%) | 19 (7.9%) |
| 50 to 54 Years | 13 (5.9%) | 41 (16.9%) |
| 55 to 59 Years | 0 (0.0%) | 0 (0.0%) |
| 60 to 64 Years | 25 (11.3%) | 0 (0.0%) |
| 65 to 69 Years | 0 (0.0%) | 0 (0.0%) |
| 70 to 74 Years | 34 (15.4%) | 12 (5.0%) |
| 75 to 79 Years | 0 (0.0%) | 0 (0.0%) |
| 80 to 84 Years | 0 (0.0%) | 0 (0.0%) |
| 85 Years and over | 0 (0.0%) | 0 (0.0%) |
| Total | 221 (100.0%) | 242 (100.0%) |
Families and Households in Howard
Median Family Size in Howard
The median family size in Howard is 2.94 persons per family, with married-couple families (58 | 41.7%) accounting for the largest median family size of 3.59 persons per family. On the other hand, single male/father families (34 | 24.5%) represent the smallest median family size with 1.47 persons per family.
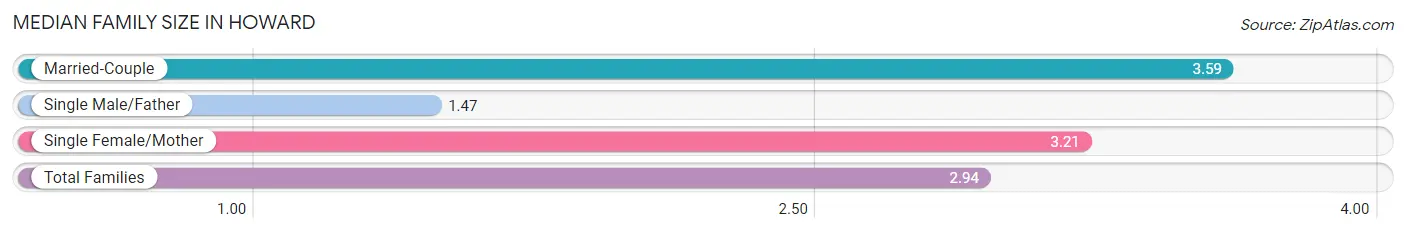
| Family Type | # Families | Family Size |
| Married-Couple | 58 (41.7%) | 3.59 |
| Single Male/Father | 34 (24.5%) | 1.47 |
| Single Female/Mother | 47 (33.8%) | 3.21 |
| Total Families | 139 (100.0%) | 2.94 |
Median Household Size in Howard
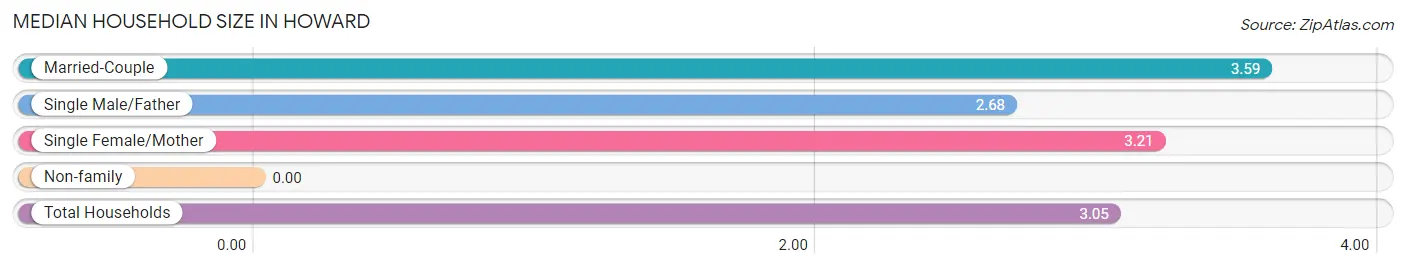
| Household Type | # Households | Household Size |
| Married-Couple | 58 (38.2%) | 3.59 |
| Single Male/Father | 34 (22.4%) | 2.68 |
| Single Female/Mother | 47 (30.9%) | 3.21 |
| Non-family | 13 (8.6%) | - |
| Total Households | 152 (100.0%) | 3.05 |
Household Size by Marriage Status in Howard
Out of a total of 152 households in Howard, 139 (91.4%) are family households, while 13 (8.6%) are nonfamily households. The most numerous type of family households are 3-person households, comprising 88, and the most common type of nonfamily households are 1-person households, comprising 13.
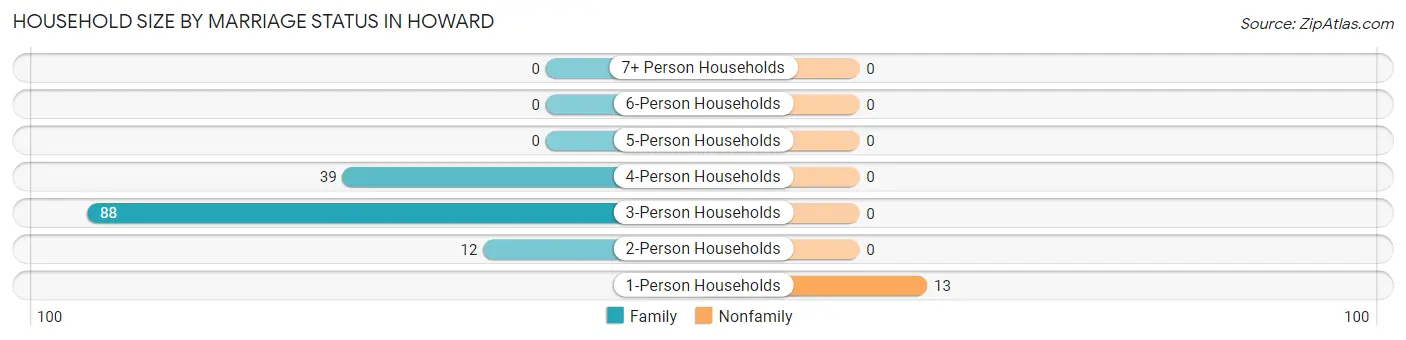
| Household Size | Family Households | Nonfamily Households |
| 1-Person Households | - | 13 (8.6%) |
| 2-Person Households | 12 (7.9%) | 0 (0.0%) |
| 3-Person Households | 88 (57.9%) | 0 (0.0%) |
| 4-Person Households | 39 (25.7%) | 0 (0.0%) |
| 5-Person Households | 0 (0.0%) | 0 (0.0%) |
| 6-Person Households | 0 (0.0%) | 0 (0.0%) |
| 7+ Person Households | 0 (0.0%) | 0 (0.0%) |
| Total | 139 (91.4%) | 13 (8.6%) |
Female Fertility in Howard
Fertility by Age in Howard
Average fertility rate in Howard is 327.0 births per 1,000 women. Women in the age bracket of 20 to 34 years have the highest fertility rate with 660.0 births per 1,000 women. Women in the age bracket of 20 to 34 years acount for 100.0% of all women with births.
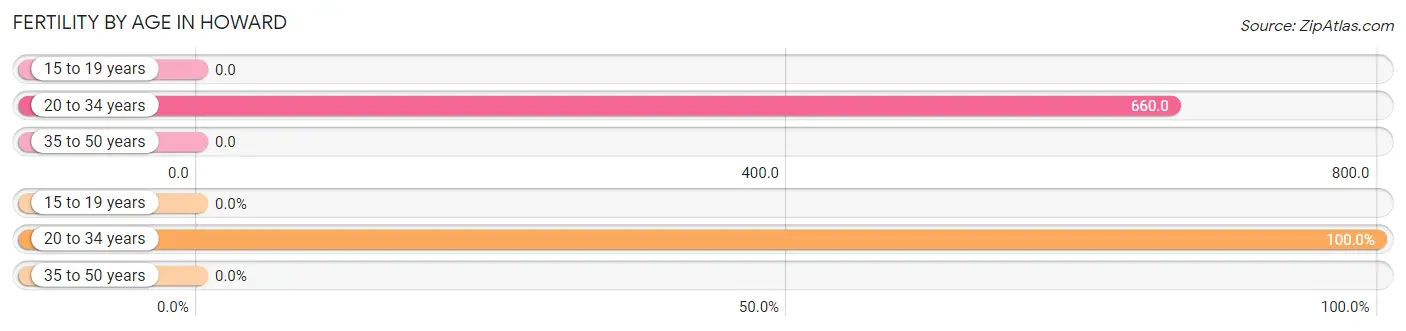
| Age Bracket | Women with Births | Births / 1,000 Women |
| 15 to 19 years | 0 (0.0%) | 0.0 |
| 20 to 34 years | 35 (100.0%) | 660.0 |
| 35 to 50 years | 0 (0.0%) | 0.0 |
| Total | 35 (100.0%) | 327.0 |
Fertility by Age by Marriage Status in Howard
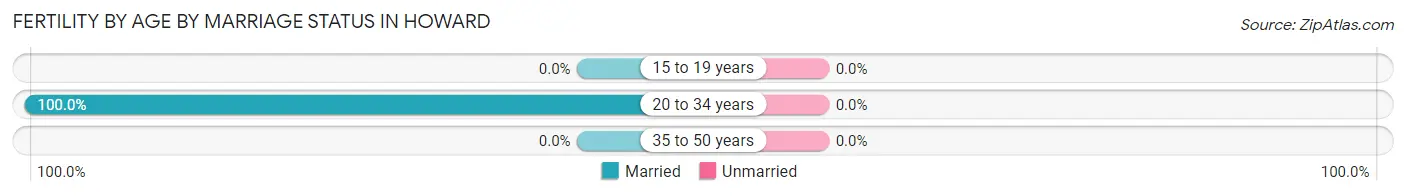
| Age Bracket | Married | Unmarried |
| 15 to 19 years | 0 (0.0%) | 0 (0.0%) |
| 20 to 34 years | 35 (100.0%) | 0 (0.0%) |
| 35 to 50 years | 0 (0.0%) | 0 (0.0%) |
| Total | 35 (100.0%) | 0 (0.0%) |
Fertility by Education in Howard
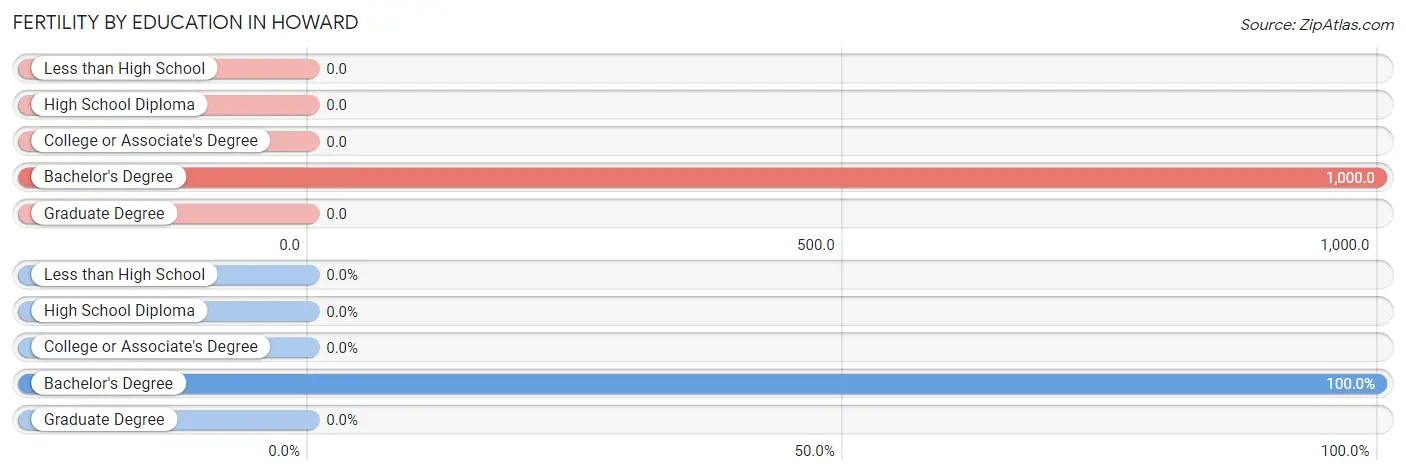
| Educational Attainment | Women with Births | Births / 1,000 Women |
| Less than High School | 0 (0.0%) | 0.0 |
| High School Diploma | 0 (0.0%) | 0.0 |
| College or Associate's Degree | 0 (0.0%) | 0.0 |
| Bachelor's Degree | 35 (100.0%) | 1,000.0 |
| Graduate Degree | 0 (0.0%) | 0.0 |
| Total | 35 (100.0%) | 327.0 |
Fertility by Education by Marriage Status in Howard
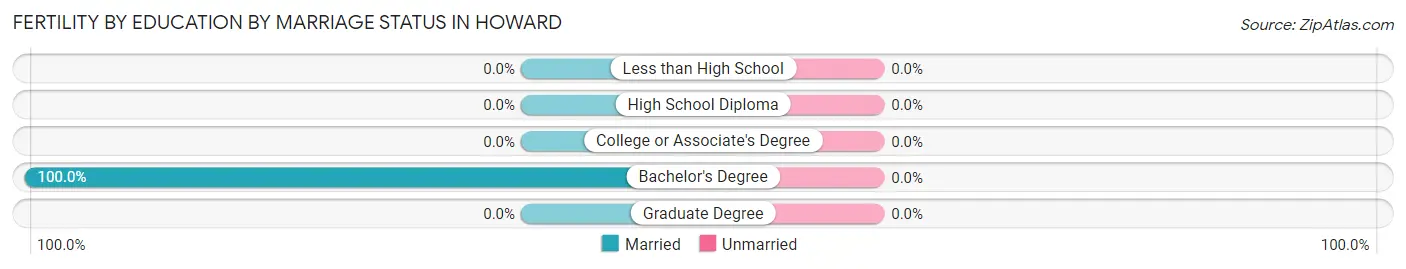
| Educational Attainment | Married | Unmarried |
| Less than High School | 0 (0.0%) | 0 (0.0%) |
| High School Diploma | 0 (0.0%) | 0 (0.0%) |
| College or Associate's Degree | 0 (0.0%) | 0 (0.0%) |
| Bachelor's Degree | 35 (100.0%) | 0 (0.0%) |
| Graduate Degree | 0 (0.0%) | 0 (0.0%) |
| Total | 35 (100.0%) | 0 (0.0%) |
Employment Characteristics in Howard
Employment by Class of Employer in Howard
Among the 241 employed individuals in Howard, private company employees (228 | 94.6%), and unpaid family workers (13 | 5.4%) make up the most common classes of employment.
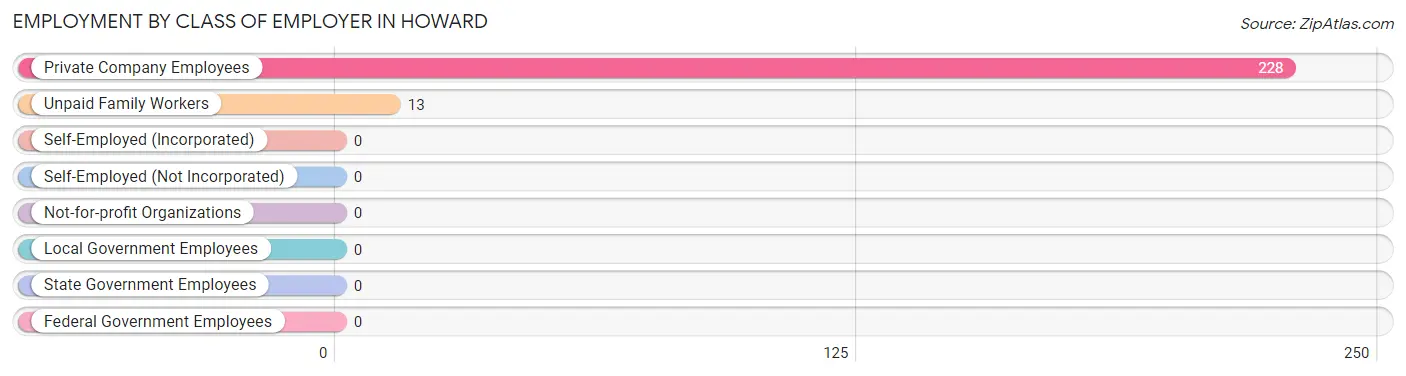
| Employer Class | # Employees | % Employees |
| Private Company Employees | 228 | 94.6% |
| Self-Employed (Incorporated) | 0 | 0.0% |
| Self-Employed (Not Incorporated) | 0 | 0.0% |
| Not-for-profit Organizations | 0 | 0.0% |
| Local Government Employees | 0 | 0.0% |
| State Government Employees | 0 | 0.0% |
| Federal Government Employees | 0 | 0.0% |
| Unpaid Family Workers | 13 | 5.4% |
| Total | 241 | 100.0% |
Employment Status by Age in Howard
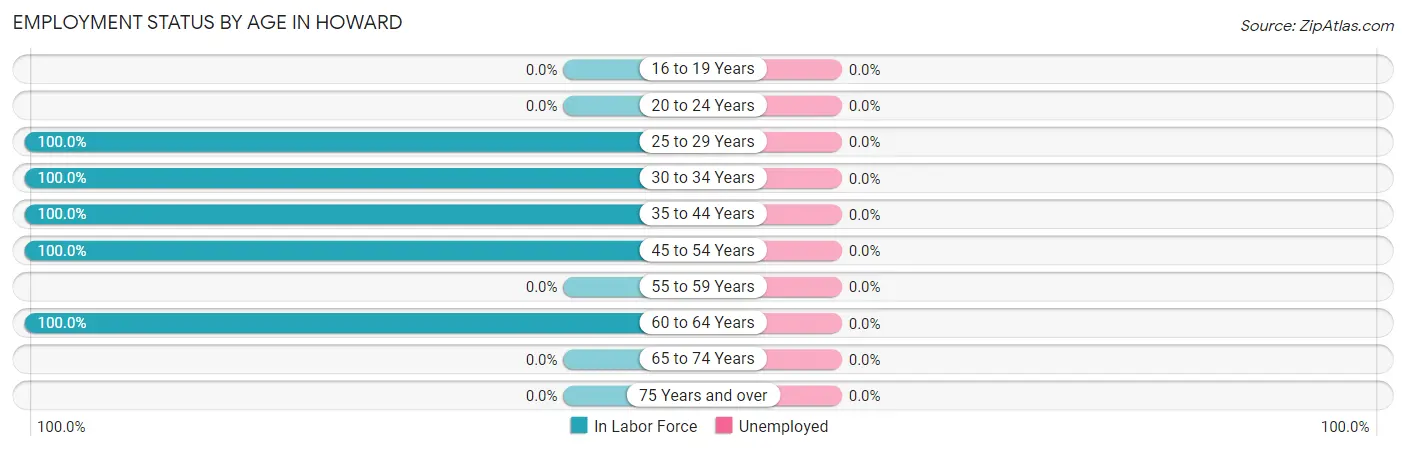
| Age Bracket | In Labor Force | Unemployed |
| 16 to 19 Years | 0 (0.0%) | 0 (0.0%) |
| 20 to 24 Years | 0 (0.0%) | 0 (0.0%) |
| 25 to 29 Years | 74 (100.0%) | 0 (0.0%) |
| 30 to 34 Years | 18 (100.0%) | 0 (0.0%) |
| 35 to 44 Years | 35 (100.0%) | 0 (0.0%) |
| 45 to 54 Years | 89 (100.0%) | 0 (0.0%) |
| 55 to 59 Years | 0 (0.0%) | 0 (0.0%) |
| 60 to 64 Years | 25 (100.0%) | 0 (0.0%) |
| 65 to 74 Years | 0 (0.0%) | 0 (0.0%) |
| 75 Years and over | 0 (0.0%) | 0 (0.0%) |
| Total | 241 (84.0%) | 0 (0.0%) |
Employment Status by Educational Attainment in Howard
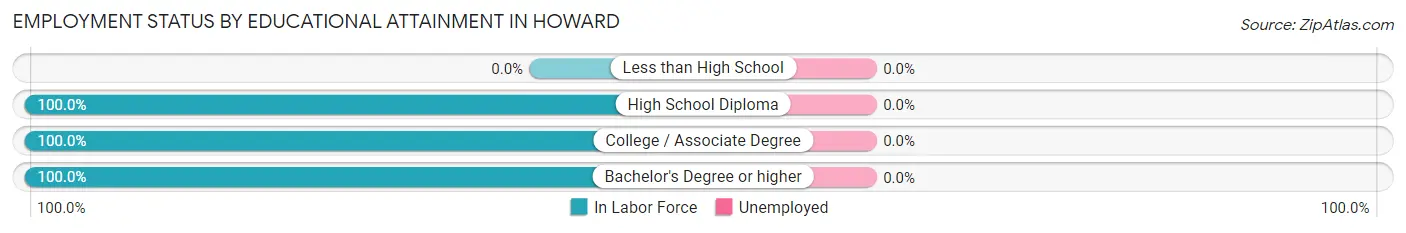
| Educational Attainment | In Labor Force | Unemployed |
| Less than High School | 0 (0.0%) | 0 (0.0%) |
| High School Diploma | 73 (100.0%) | 0 (0.0%) |
| College / Associate Degree | 133 (100.0%) | 0 (0.0%) |
| Bachelor's Degree or higher | 35 (100.0%) | 0 (0.0%) |
| Total | 241 (100.0%) | 0 (0.0%) |
Employment Occupations by Sex in Howard
Management, Business, Science and Arts Occupations
The most common Management, Business, Science and Arts occupations in Howard are Health Diagnosing & Treating (111 | 46.1%), Computers, Engineering & Science (39 | 16.2%), Architecture & Engineering (39 | 16.2%), Health Technologists (35 | 14.5%), and Community & Social Service (25 | 10.4%).
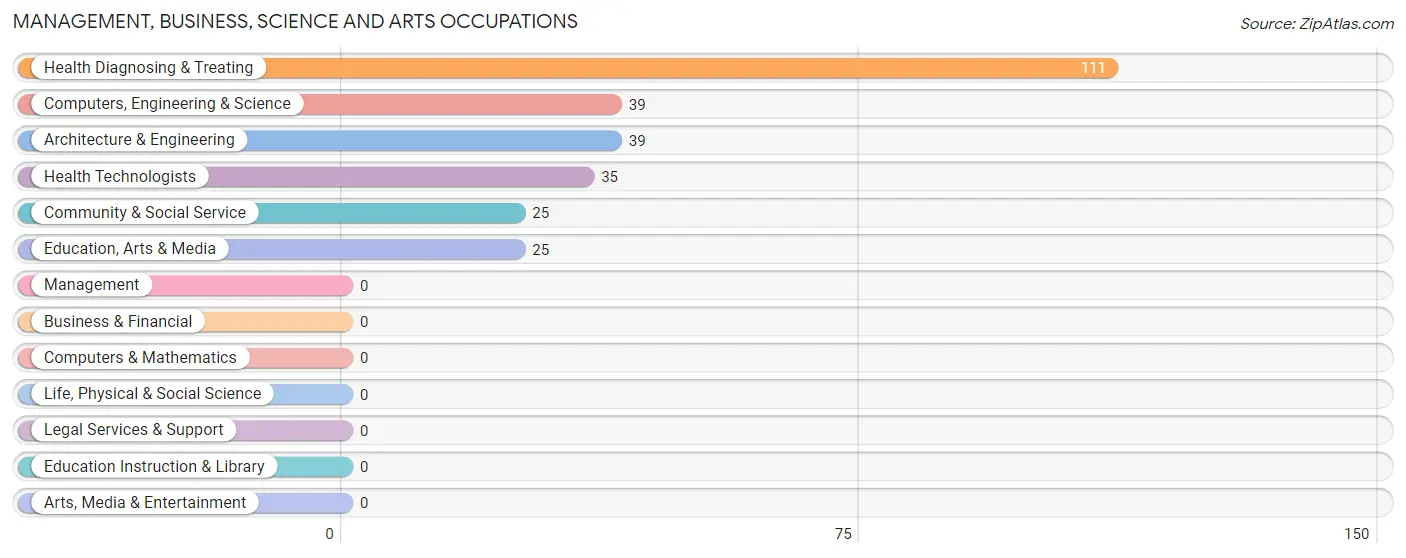
Management, Business, Science and Arts Occupations by Sex
Within the Management, Business, Science and Arts occupations in Howard, the most male-oriented occupations are Computers, Engineering & Science (100.0%), Architecture & Engineering (100.0%), and Community & Social Service (100.0%), while the most female-oriented occupations are Health Diagnosing & Treating (100.0%), and Health Technologists (100.0%).
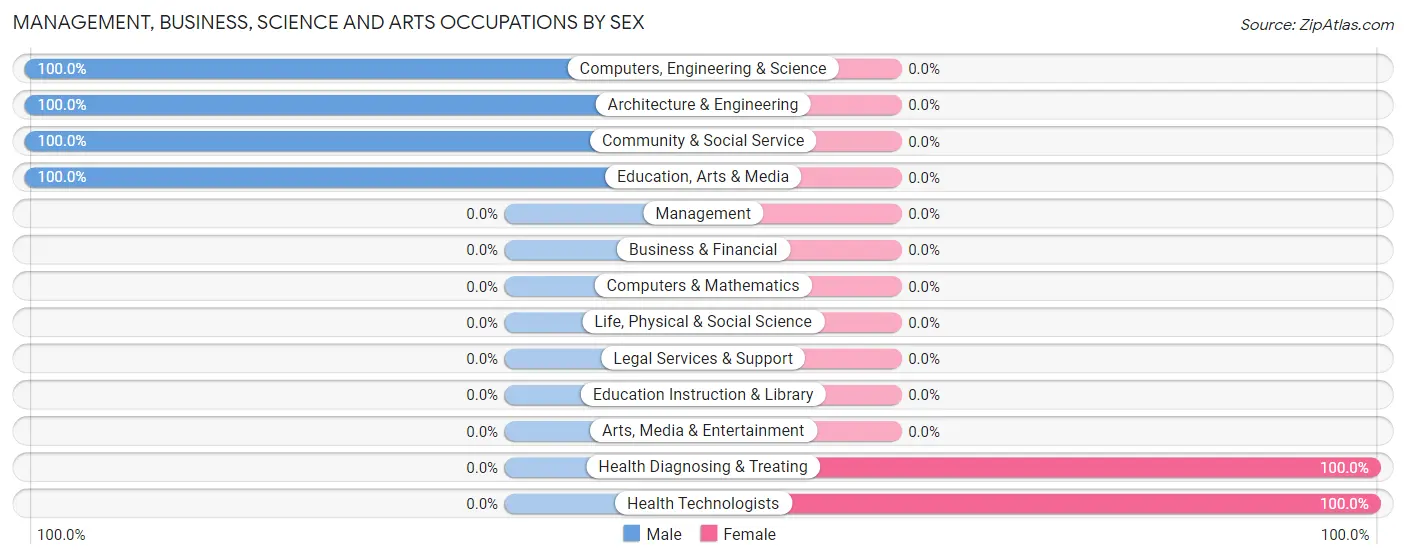
| Occupation | Male | Female |
| Management | 0 (0.0%) | 0 (0.0%) |
| Business & Financial | 0 (0.0%) | 0 (0.0%) |
| Computers, Engineering & Science | 39 (100.0%) | 0 (0.0%) |
| Computers & Mathematics | 0 (0.0%) | 0 (0.0%) |
| Architecture & Engineering | 39 (100.0%) | 0 (0.0%) |
| Life, Physical & Social Science | 0 (0.0%) | 0 (0.0%) |
| Community & Social Service | 25 (100.0%) | 0 (0.0%) |
| Education, Arts & Media | 25 (100.0%) | 0 (0.0%) |
| Legal Services & Support | 0 (0.0%) | 0 (0.0%) |
| Education Instruction & Library | 0 (0.0%) | 0 (0.0%) |
| Arts, Media & Entertainment | 0 (0.0%) | 0 (0.0%) |
| Health Diagnosing & Treating | 0 (0.0%) | 111 (100.0%) |
| Health Technologists | 0 (0.0%) | 35 (100.0%) |
| Total (Category) | 64 (36.6%) | 111 (63.4%) |
| Total (Overall) | 93 (38.6%) | 148 (61.4%) |
Services Occupations
Services Occupations by Sex
| Occupation | Male | Female |
| Healthcare Support | 0 (0.0%) | 0 (0.0%) |
| Security & Protection | 0 (0.0%) | 0 (0.0%) |
| Firefighting & Prevention | 0 (0.0%) | 0 (0.0%) |
| Law Enforcement | 0 (0.0%) | 0 (0.0%) |
| Food Preparation & Serving | 0 (0.0%) | 0 (0.0%) |
| Cleaning & Maintenance | 0 (0.0%) | 0 (0.0%) |
| Personal Care & Service | 0 (0.0%) | 0 (0.0%) |
| Total (Category) | 0 (0.0%) | 0 (0.0%) |
| Total (Overall) | 93 (38.6%) | 148 (61.4%) |
Sales and Office Occupations
The most common Sales and Office occupations in Howard are Office & Administration (19 | 7.9%), and Sales & Related (18 | 7.5%).
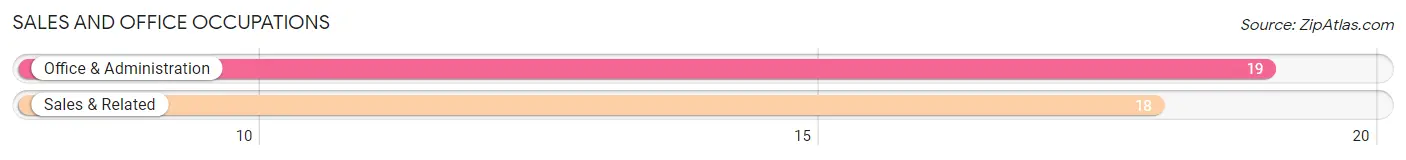
Sales and Office Occupations by Sex
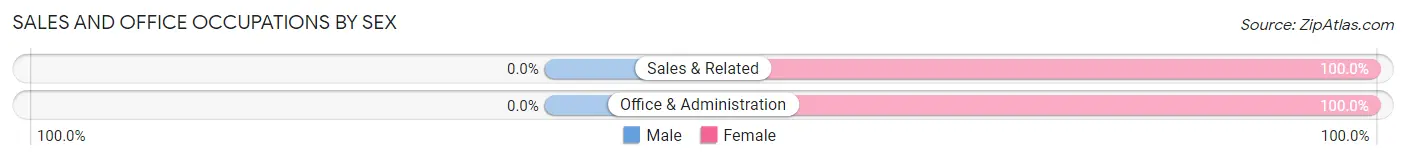
| Occupation | Male | Female |
| Sales & Related | 0 (0.0%) | 18 (100.0%) |
| Office & Administration | 0 (0.0%) | 19 (100.0%) |
| Total (Category) | 0 (0.0%) | 37 (100.0%) |
| Total (Overall) | 93 (38.6%) | 148 (61.4%) |
Natural Resources, Construction and Maintenance Occupations
The most common Natural Resources, Construction and Maintenance occupations in Howard are , and Farming, Fishing & Forestry (13 | 5.4%).
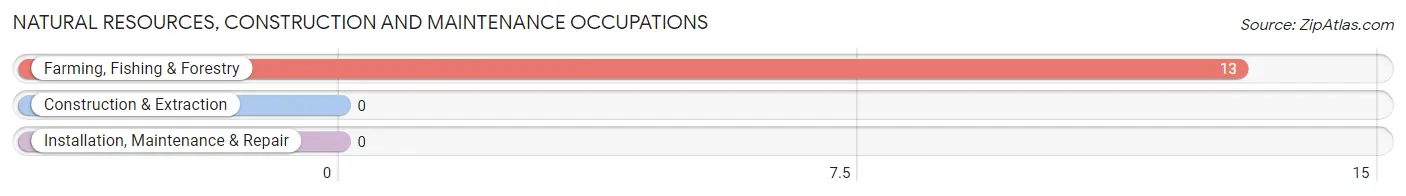
Natural Resources, Construction and Maintenance Occupations by Sex
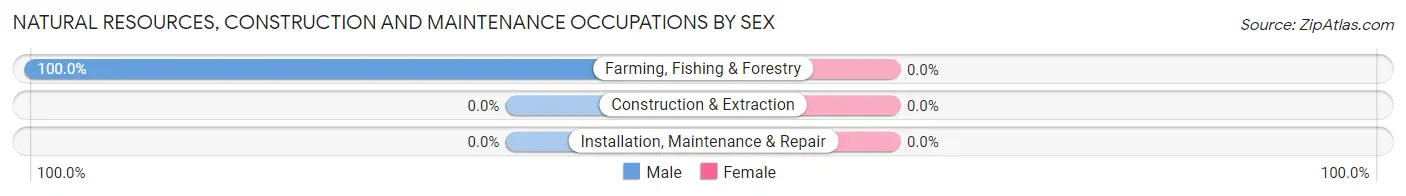
| Occupation | Male | Female |
| Farming, Fishing & Forestry | 13 (100.0%) | 0 (0.0%) |
| Construction & Extraction | 0 (0.0%) | 0 (0.0%) |
| Installation, Maintenance & Repair | 0 (0.0%) | 0 (0.0%) |
| Total (Category) | 13 (100.0%) | 0 (0.0%) |
| Total (Overall) | 93 (38.6%) | 148 (61.4%) |
Production, Transportation and Moving Occupations
The most common Production, Transportation and Moving occupations in Howard are , and Material Moving (16 | 6.6%).
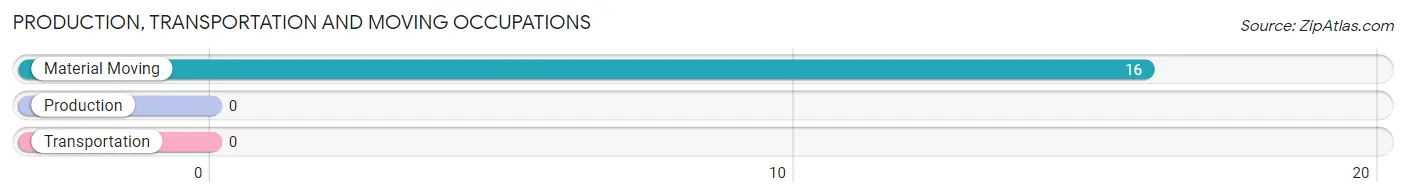
Production, Transportation and Moving Occupations by Sex
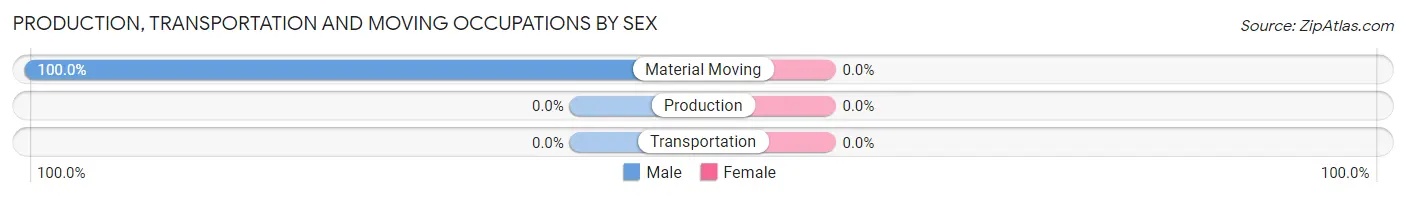
| Occupation | Male | Female |
| Production | 0 (0.0%) | 0 (0.0%) |
| Transportation | 0 (0.0%) | 0 (0.0%) |
| Material Moving | 16 (100.0%) | 0 (0.0%) |
| Total (Category) | 16 (100.0%) | 0 (0.0%) |
| Total (Overall) | 93 (38.6%) | 148 (61.4%) |
Employment Industries by Sex in Howard
Employment Industries in Howard
The major employment industries in Howard include Health Care & Social Assistance (76 | 31.5%), Construction (64 | 26.6%), Administrative & Support (35 | 14.5%), Accommodation & Food Services (19 | 7.9%), and Retail Trade (18 | 7.5%).
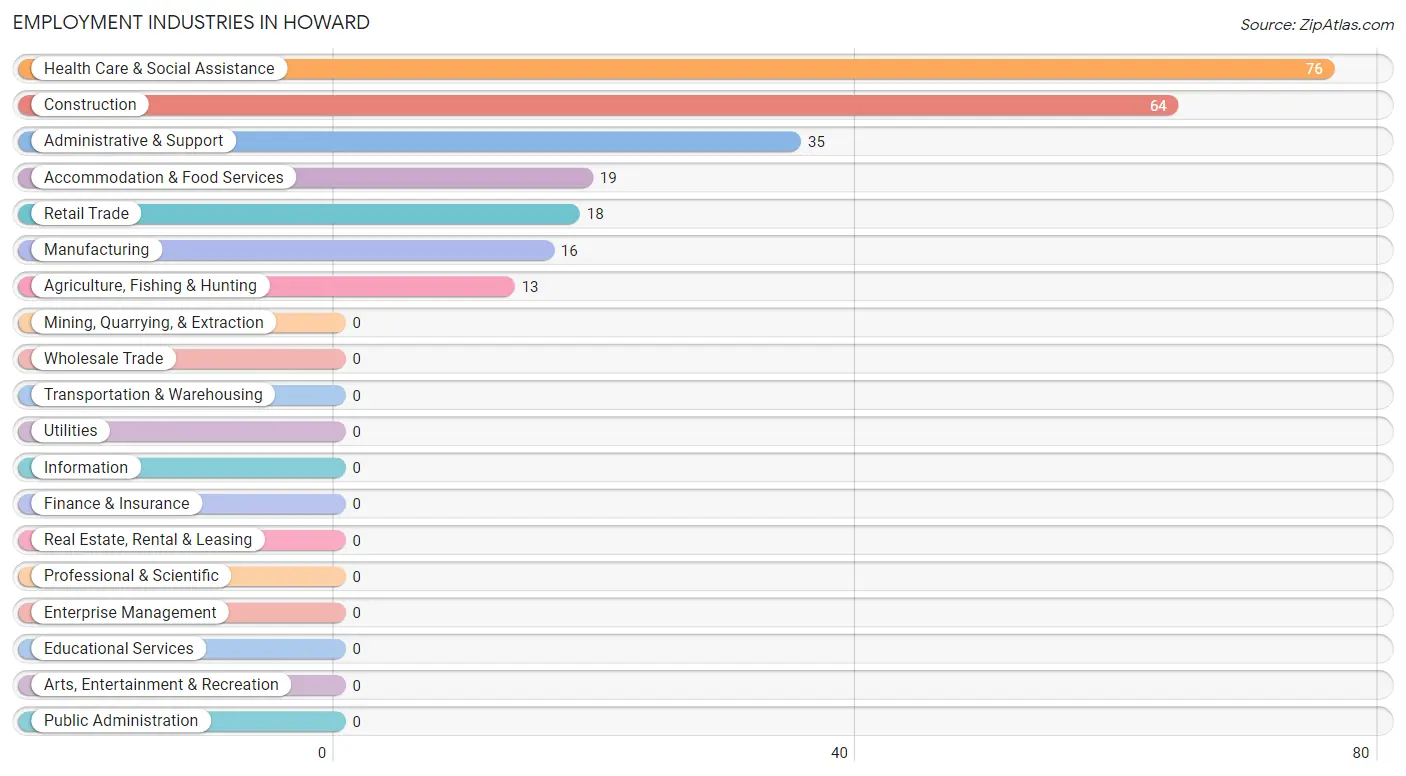
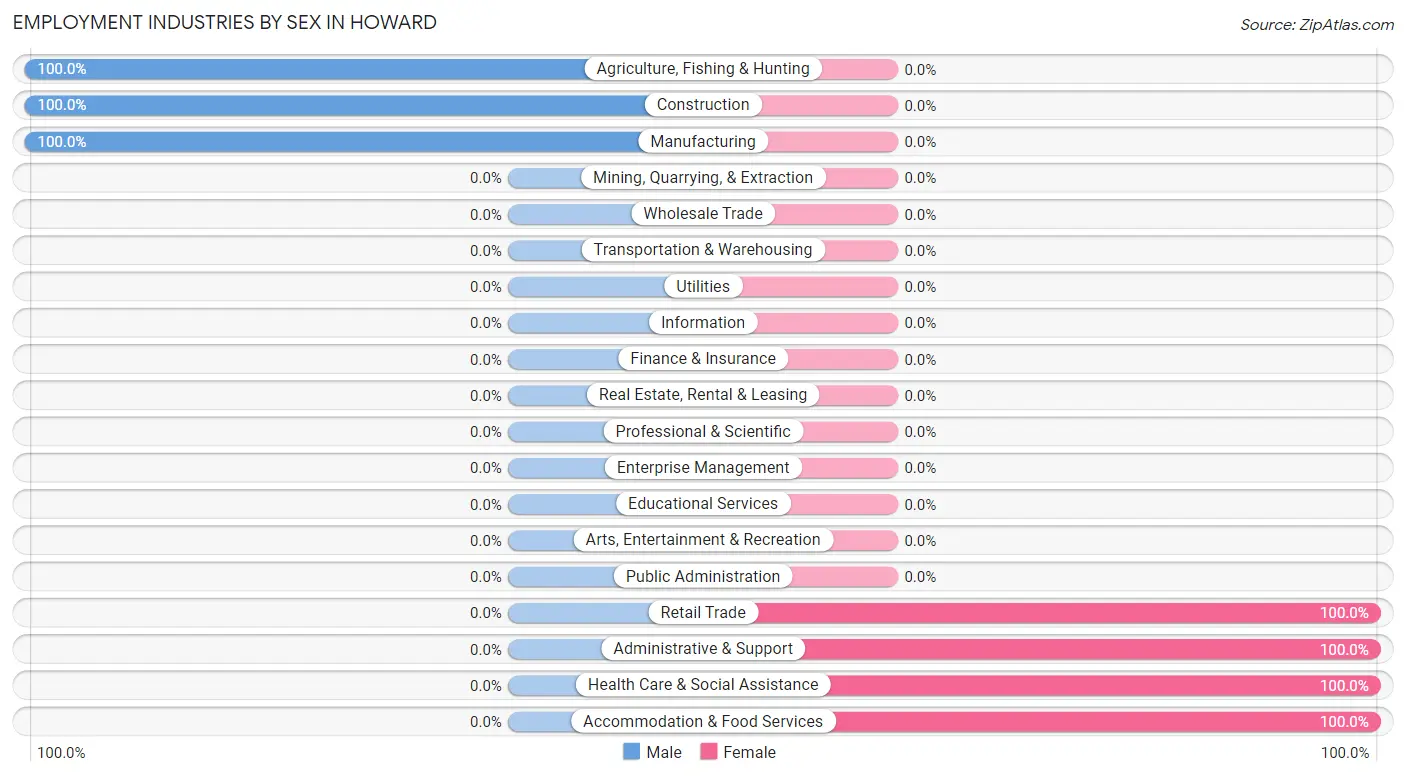
Employment Industries by Sex in Howard
The Howard industries that see more men than women are Agriculture, Fishing & Hunting (100.0%), Construction (100.0%), and Manufacturing (100.0%), whereas the industries that tend to have a higher number of women are Retail Trade (100.0%), Administrative & Support (100.0%), and Health Care & Social Assistance (100.0%).
| Industry | Male | Female |
| Agriculture, Fishing & Hunting | 13 (100.0%) | 0 (0.0%) |
| Mining, Quarrying, & Extraction | 0 (0.0%) | 0 (0.0%) |
| Construction | 64 (100.0%) | 0 (0.0%) |
| Manufacturing | 16 (100.0%) | 0 (0.0%) |
| Wholesale Trade | 0 (0.0%) | 0 (0.0%) |
| Retail Trade | 0 (0.0%) | 18 (100.0%) |
| Transportation & Warehousing | 0 (0.0%) | 0 (0.0%) |
| Utilities | 0 (0.0%) | 0 (0.0%) |
| Information | 0 (0.0%) | 0 (0.0%) |
| Finance & Insurance | 0 (0.0%) | 0 (0.0%) |
| Real Estate, Rental & Leasing | 0 (0.0%) | 0 (0.0%) |
| Professional & Scientific | 0 (0.0%) | 0 (0.0%) |
| Enterprise Management | 0 (0.0%) | 0 (0.0%) |
| Administrative & Support | 0 (0.0%) | 35 (100.0%) |
| Educational Services | 0 (0.0%) | 0 (0.0%) |
| Health Care & Social Assistance | 0 (0.0%) | 76 (100.0%) |
| Arts, Entertainment & Recreation | 0 (0.0%) | 0 (0.0%) |
| Accommodation & Food Services | 0 (0.0%) | 19 (100.0%) |
| Public Administration | 0 (0.0%) | 0 (0.0%) |
| Total | 93 (38.6%) | 148 (61.4%) |
Education in Howard
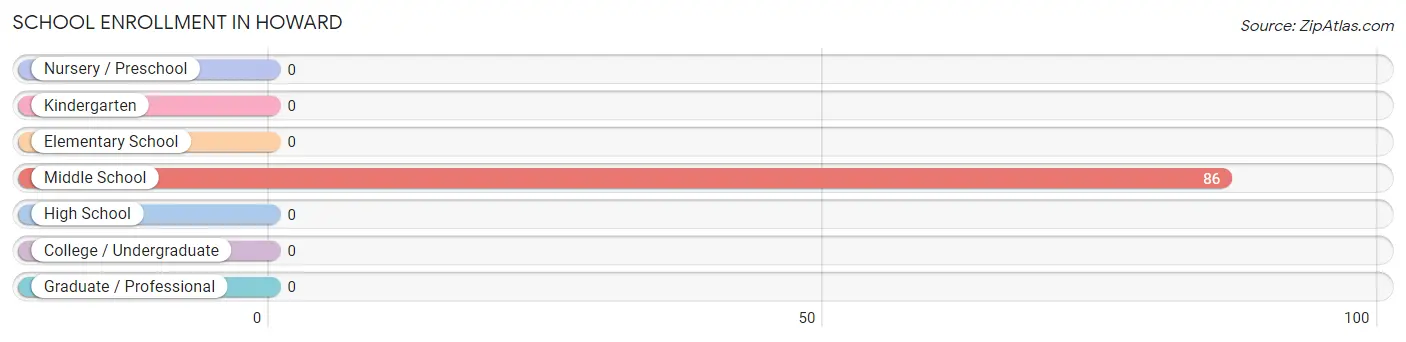
School Enrollment in Howard
| School Level | # Students | % Students |
| Nursery / Preschool | 0 | 0.0% |
| Kindergarten | 0 | 0.0% |
| Elementary School | 0 | 0.0% |
| Middle School | 86 | 100.0% |
| High School | 0 | 0.0% |
| College / Undergraduate | 0 | 0.0% |
| Graduate / Professional | 0 | 0.0% |
| Total | 86 | 100.0% |
School Enrollment by Age by Funding Source in Howard
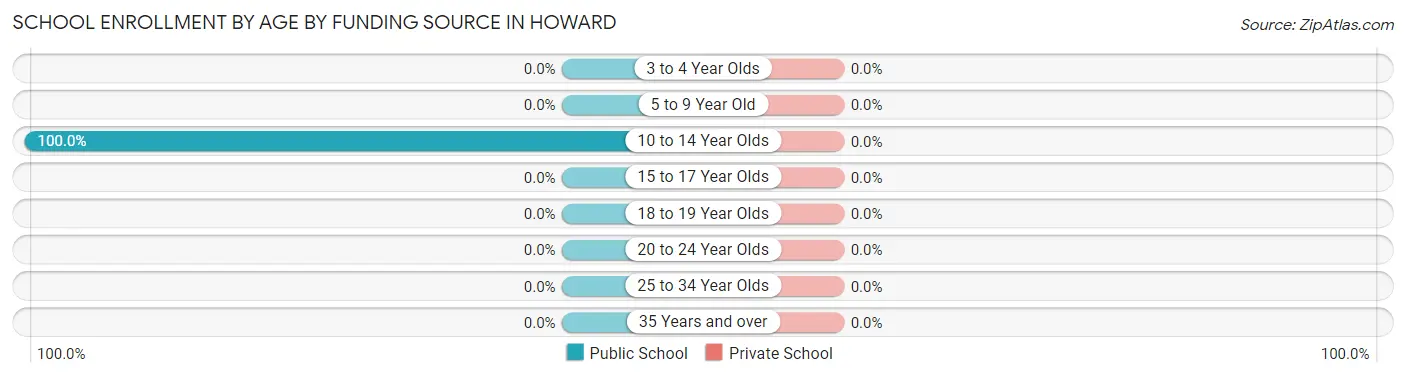
| Age Bracket | Public School | Private School |
| 3 to 4 Year Olds | 0 (0.0%) | 0 (0.0%) |
| 5 to 9 Year Old | 0 (0.0%) | 0 (0.0%) |
| 10 to 14 Year Olds | 86 (100.0%) | 0 (0.0%) |
| 15 to 17 Year Olds | 0 (0.0%) | 0 (0.0%) |
| 18 to 19 Year Olds | 0 (0.0%) | 0 (0.0%) |
| 20 to 24 Year Olds | 0 (0.0%) | 0 (0.0%) |
| 25 to 34 Year Olds | 0 (0.0%) | 0 (0.0%) |
| 35 Years and over | 0 (0.0%) | 0 (0.0%) |
| Total | 86 (100.0%) | 0 (0.0%) |
Educational Attainment by Field of Study in Howard
, and science & technology (35 | 100.0%) are the most common fields of study among 35 individuals in Howard who have obtained a bachelor's degree or higher.
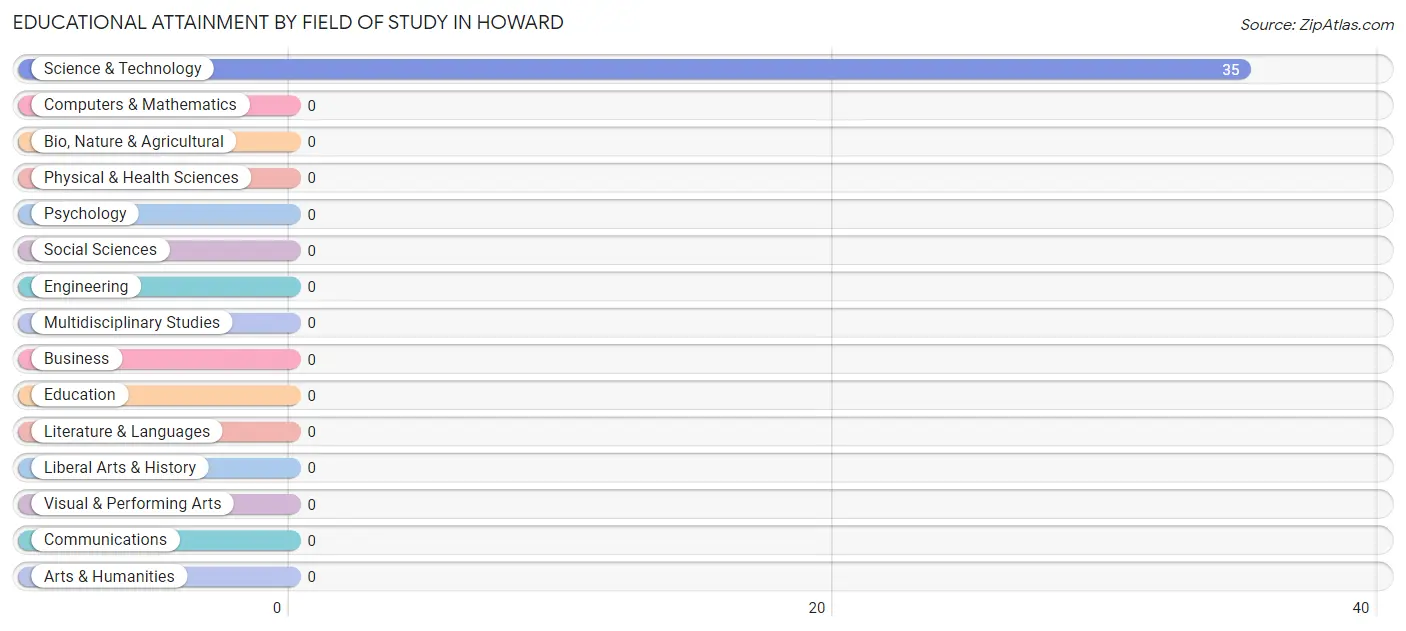
| Field of Study | # Graduates | % Graduates |
| Computers & Mathematics | 0 | 0.0% |
| Bio, Nature & Agricultural | 0 | 0.0% |
| Physical & Health Sciences | 0 | 0.0% |
| Psychology | 0 | 0.0% |
| Social Sciences | 0 | 0.0% |
| Engineering | 0 | 0.0% |
| Multidisciplinary Studies | 0 | 0.0% |
| Science & Technology | 35 | 100.0% |
| Business | 0 | 0.0% |
| Education | 0 | 0.0% |
| Literature & Languages | 0 | 0.0% |
| Liberal Arts & History | 0 | 0.0% |
| Visual & Performing Arts | 0 | 0.0% |
| Communications | 0 | 0.0% |
| Arts & Humanities | 0 | 0.0% |
| Total | 35 | 100.0% |
Transportation & Commute in Howard
Vehicle Availability by Sex in Howard
The most prevalent vehicle ownership categories in Howard are males with 4 vehicles (55, accounting for 59.1%) and females with 4 vehicles (76, making up 37.2%).
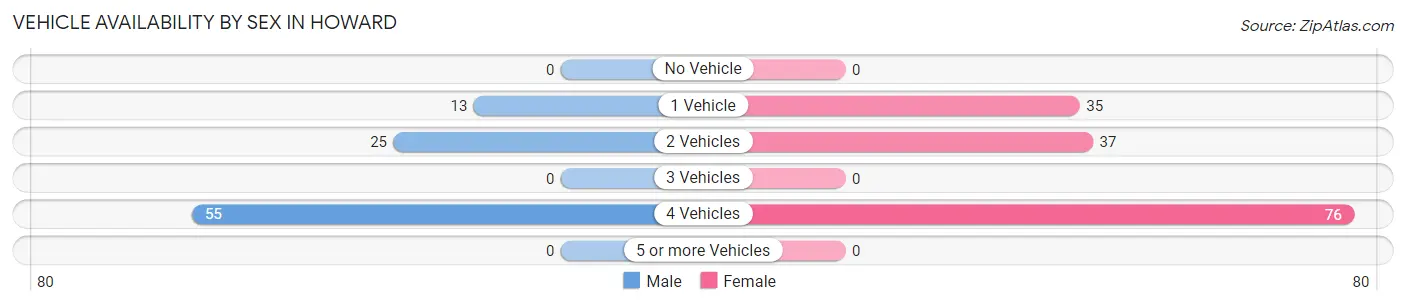
| Vehicles Available | Male | Female |
| No Vehicle | 0 (0.0%) | 0 (0.0%) |
| 1 Vehicle | 13 (14.0%) | 35 (23.6%) |
| 2 Vehicles | 25 (26.9%) | 37 (25.0%) |
| 3 Vehicles | 0 (0.0%) | 0 (0.0%) |
| 4 Vehicles | 55 (59.1%) | 76 (51.3%) |
| 5 or more Vehicles | 0 (0.0%) | 0 (0.0%) |
| Total | 93 (100.0%) | 148 (100.0%) |
Commute Time in Howard
The most frequently occuring commute durations in Howard are 90 or more minutes (74 commuters, 30.7%), 10 to 14 minutes (41 commuters, 17.0%), and 45 to 59 minutes (35 commuters, 14.5%).
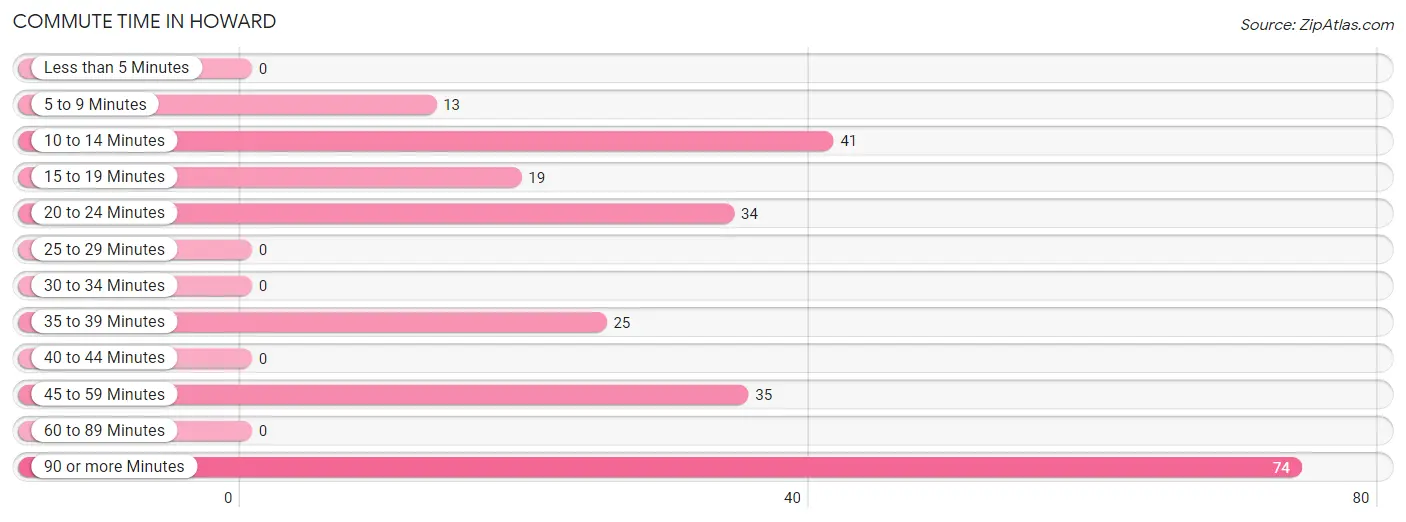
| Commute Time | # Commuters | % Commuters |
| Less than 5 Minutes | 0 | 0.0% |
| 5 to 9 Minutes | 13 | 5.4% |
| 10 to 14 Minutes | 41 | 17.0% |
| 15 to 19 Minutes | 19 | 7.9% |
| 20 to 24 Minutes | 34 | 14.1% |
| 25 to 29 Minutes | 0 | 0.0% |
| 30 to 34 Minutes | 0 | 0.0% |
| 35 to 39 Minutes | 25 | 10.4% |
| 40 to 44 Minutes | 0 | 0.0% |
| 45 to 59 Minutes | 35 | 14.5% |
| 60 to 89 Minutes | 0 | 0.0% |
| 90 or more Minutes | 74 | 30.7% |
Commute Time by Sex in Howard
The most common commute times in Howard are 90 or more minutes (39 commuters, 41.9%) for males and 10 to 14 minutes (41 commuters, 27.7%) for females.
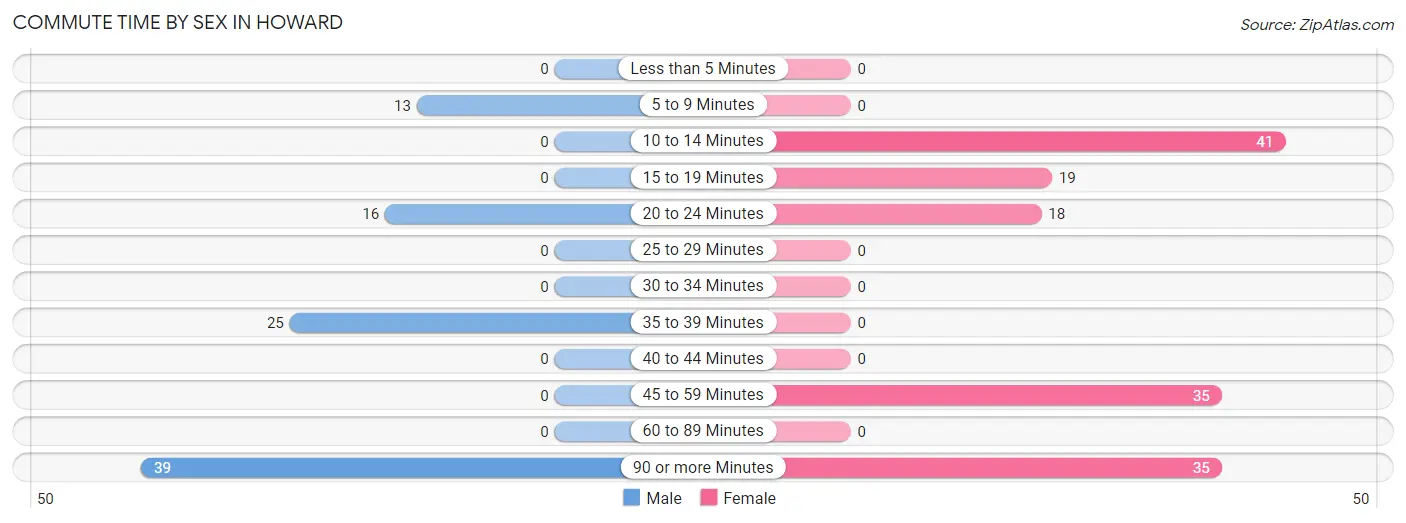
| Commute Time | Male | Female |
| Less than 5 Minutes | 0 (0.0%) | 0 (0.0%) |
| 5 to 9 Minutes | 13 (14.0%) | 0 (0.0%) |
| 10 to 14 Minutes | 0 (0.0%) | 41 (27.7%) |
| 15 to 19 Minutes | 0 (0.0%) | 19 (12.8%) |
| 20 to 24 Minutes | 16 (17.2%) | 18 (12.2%) |
| 25 to 29 Minutes | 0 (0.0%) | 0 (0.0%) |
| 30 to 34 Minutes | 0 (0.0%) | 0 (0.0%) |
| 35 to 39 Minutes | 25 (26.9%) | 0 (0.0%) |
| 40 to 44 Minutes | 0 (0.0%) | 0 (0.0%) |
| 45 to 59 Minutes | 0 (0.0%) | 35 (23.6%) |
| 60 to 89 Minutes | 0 (0.0%) | 0 (0.0%) |
| 90 or more Minutes | 39 (41.9%) | 35 (23.6%) |
Time of Departure to Work by Sex in Howard
The most frequent times of departure to work in Howard are 6:30 AM to 6:59 AM (39, 41.9%) for males and 6:30 AM to 6:59 AM (41, 27.7%) for females.
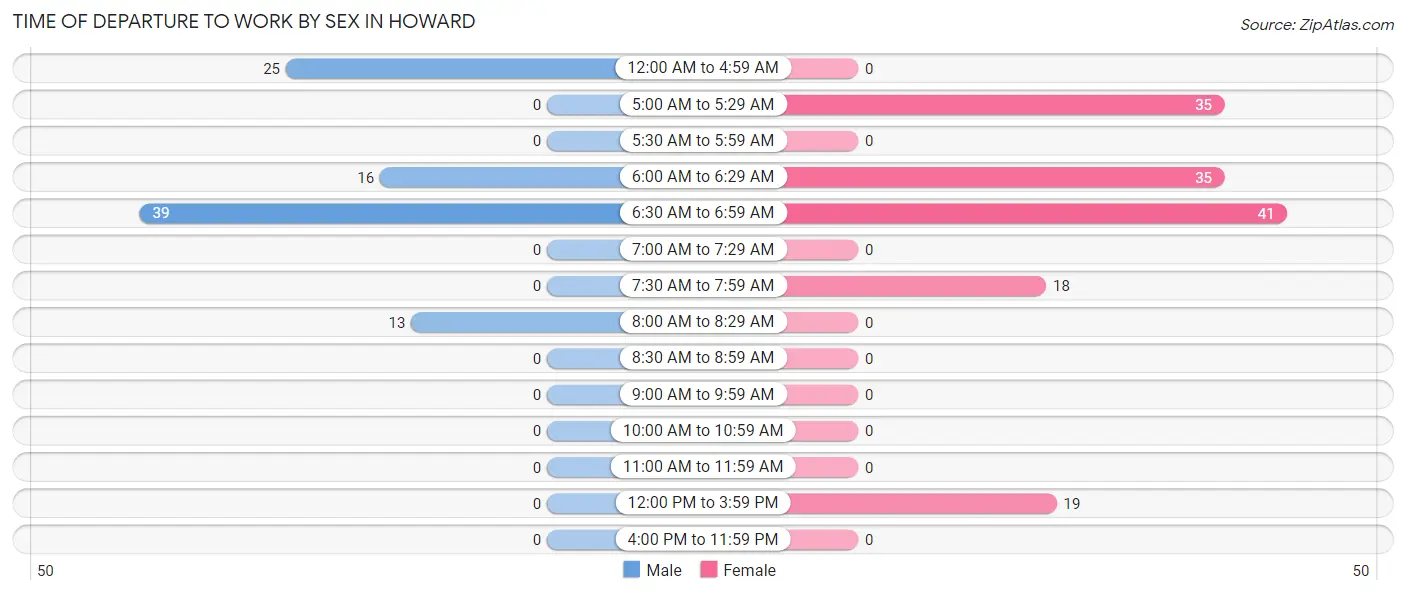
| Time of Departure | Male | Female |
| 12:00 AM to 4:59 AM | 25 (26.9%) | 0 (0.0%) |
| 5:00 AM to 5:29 AM | 0 (0.0%) | 35 (23.6%) |
| 5:30 AM to 5:59 AM | 0 (0.0%) | 0 (0.0%) |
| 6:00 AM to 6:29 AM | 16 (17.2%) | 35 (23.6%) |
| 6:30 AM to 6:59 AM | 39 (41.9%) | 41 (27.7%) |
| 7:00 AM to 7:29 AM | 0 (0.0%) | 0 (0.0%) |
| 7:30 AM to 7:59 AM | 0 (0.0%) | 18 (12.2%) |
| 8:00 AM to 8:29 AM | 13 (14.0%) | 0 (0.0%) |
| 8:30 AM to 8:59 AM | 0 (0.0%) | 0 (0.0%) |
| 9:00 AM to 9:59 AM | 0 (0.0%) | 0 (0.0%) |
| 10:00 AM to 10:59 AM | 0 (0.0%) | 0 (0.0%) |
| 11:00 AM to 11:59 AM | 0 (0.0%) | 0 (0.0%) |
| 12:00 PM to 3:59 PM | 0 (0.0%) | 19 (12.8%) |
| 4:00 PM to 11:59 PM | 0 (0.0%) | 0 (0.0%) |
| Total | 93 (100.0%) | 148 (100.0%) |
Housing Occupancy in Howard
Occupancy by Ownership in Howard
Of the total 152 dwellings in Howard, owner-occupied units account for 117 (77.0%), while renter-occupied units make up 35 (23.0%).
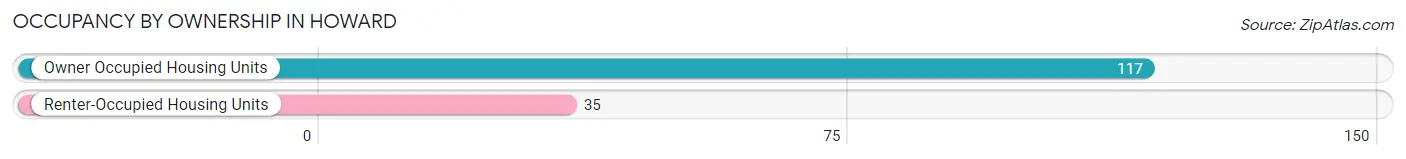
| Occupancy | # Housing Units | % Housing Units |
| Owner Occupied Housing Units | 117 | 77.0% |
| Renter-Occupied Housing Units | 35 | 23.0% |
| Total Occupied Housing Units | 152 | 100.0% |
Occupancy by Household Size in Howard
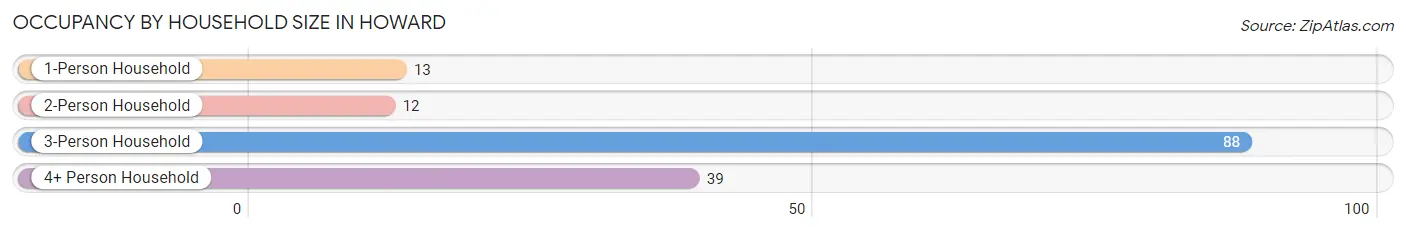
| Household Size | # Housing Units | % Housing Units |
| 1-Person Household | 13 | 8.6% |
| 2-Person Household | 12 | 7.9% |
| 3-Person Household | 88 | 57.9% |
| 4+ Person Household | 39 | 25.7% |
| Total Housing Units | 152 | 100.0% |
Occupancy by Ownership by Household Size in Howard
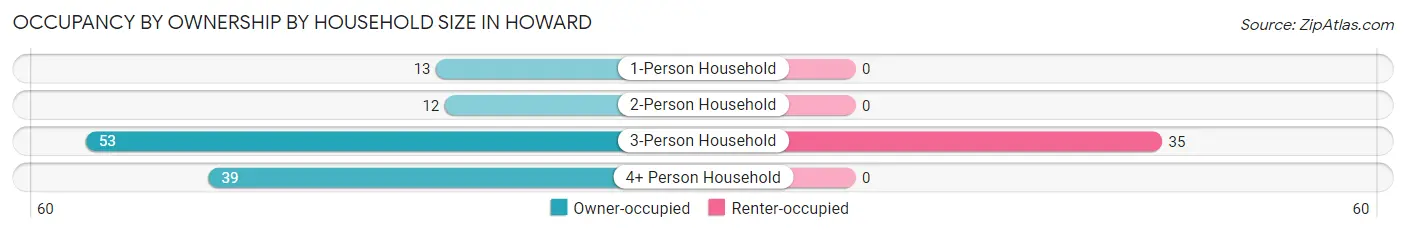
| Household Size | Owner-occupied | Renter-occupied |
| 1-Person Household | 13 (100.0%) | 0 (0.0%) |
| 2-Person Household | 12 (100.0%) | 0 (0.0%) |
| 3-Person Household | 53 (60.2%) | 35 (39.8%) |
| 4+ Person Household | 39 (100.0%) | 0 (0.0%) |
| Total Housing Units | 117 (77.0%) | 35 (23.0%) |
Occupancy by Educational Attainment in Howard
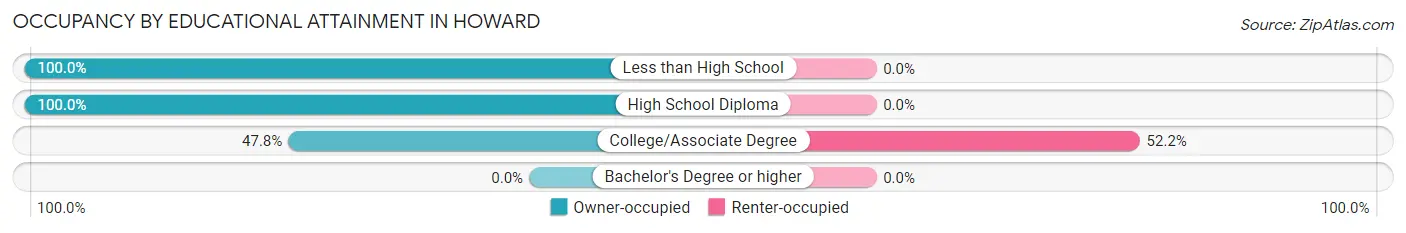
| Household Size | Owner-occupied | Renter-occupied |
| Less than High School | 12 (100.0%) | 0 (0.0%) |
| High School Diploma | 73 (100.0%) | 0 (0.0%) |
| College/Associate Degree | 32 (47.8%) | 35 (52.2%) |
| Bachelor's Degree or higher | 0 (0.0%) | 0 (0.0%) |
Occupancy by Age of Householder in Howard
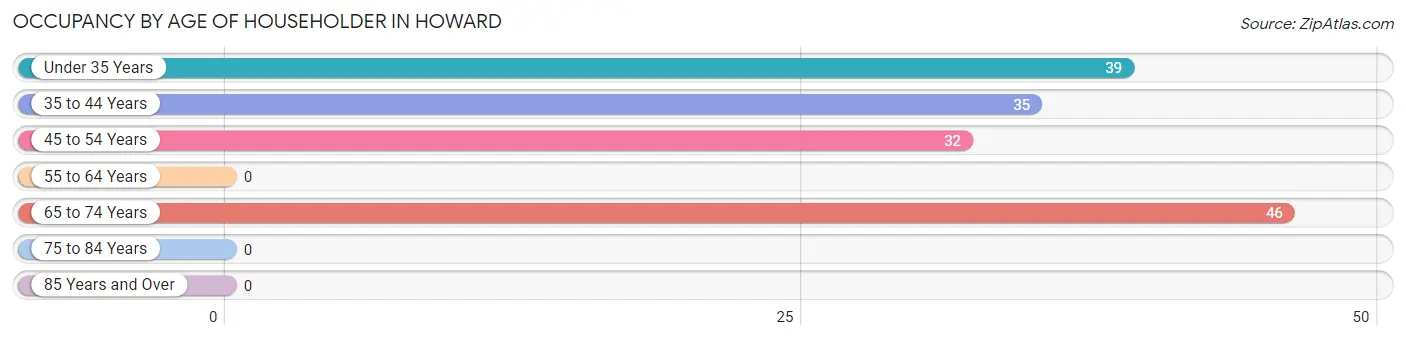
| Age Bracket | # Households | % Households |
| Under 35 Years | 39 | 25.7% |
| 35 to 44 Years | 35 | 23.0% |
| 45 to 54 Years | 32 | 21.0% |
| 55 to 64 Years | 0 | 0.0% |
| 65 to 74 Years | 46 | 30.3% |
| 75 to 84 Years | 0 | 0.0% |
| 85 Years and Over | 0 | 0.0% |
| Total | 152 | 100.0% |
Housing Finances in Howard
Median Income by Occupancy in Howard
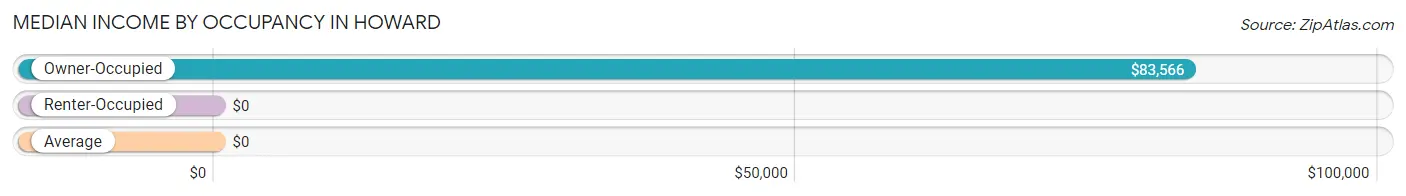
| Occupancy Type | # Households | Median Income |
| Owner-Occupied | 117 (77.0%) | $83,566 |
| Renter-Occupied | 35 (23.0%) | $0 |
| Average | 152 (100.0%) | $0 |
Occupancy by Householder Income Bracket in Howard
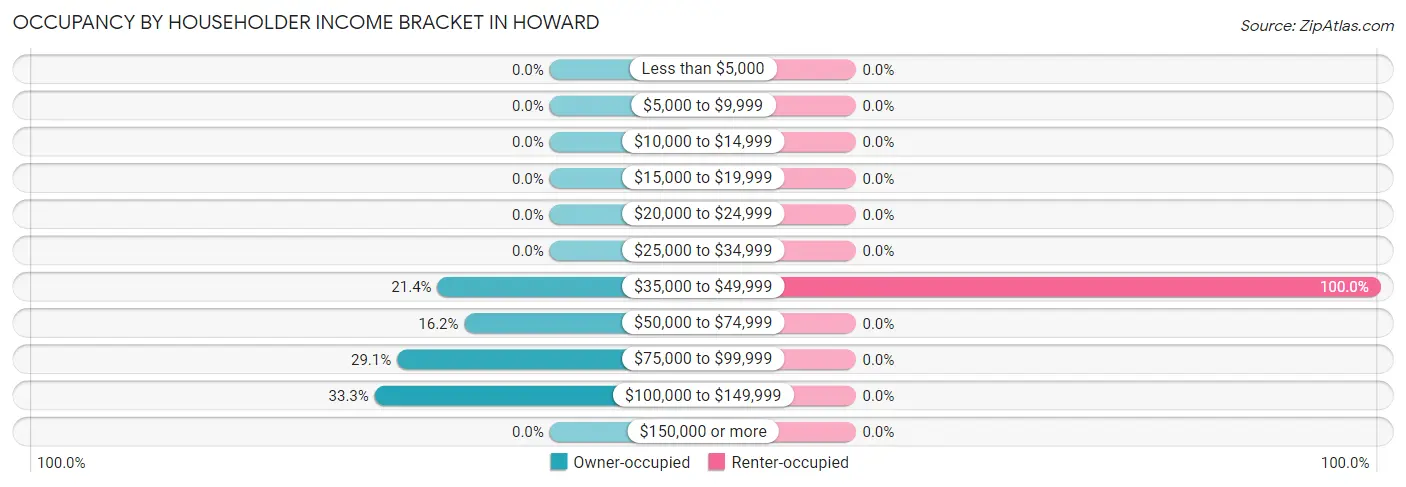
| Income Bracket | Owner-occupied | Renter-occupied |
| Less than $5,000 | 0 (0.0%) | 0 (0.0%) |
| $5,000 to $9,999 | 0 (0.0%) | 0 (0.0%) |
| $10,000 to $14,999 | 0 (0.0%) | 0 (0.0%) |
| $15,000 to $19,999 | 0 (0.0%) | 0 (0.0%) |
| $20,000 to $24,999 | 0 (0.0%) | 0 (0.0%) |
| $25,000 to $34,999 | 0 (0.0%) | 0 (0.0%) |
| $35,000 to $49,999 | 25 (21.4%) | 35 (100.0%) |
| $50,000 to $74,999 | 19 (16.2%) | 0 (0.0%) |
| $75,000 to $99,999 | 34 (29.1%) | 0 (0.0%) |
| $100,000 to $149,999 | 39 (33.3%) | 0 (0.0%) |
| $150,000 or more | 0 (0.0%) | 0 (0.0%) |
| Total | 117 (100.0%) | 35 (100.0%) |
Monthly Housing Cost Tiers in Howard
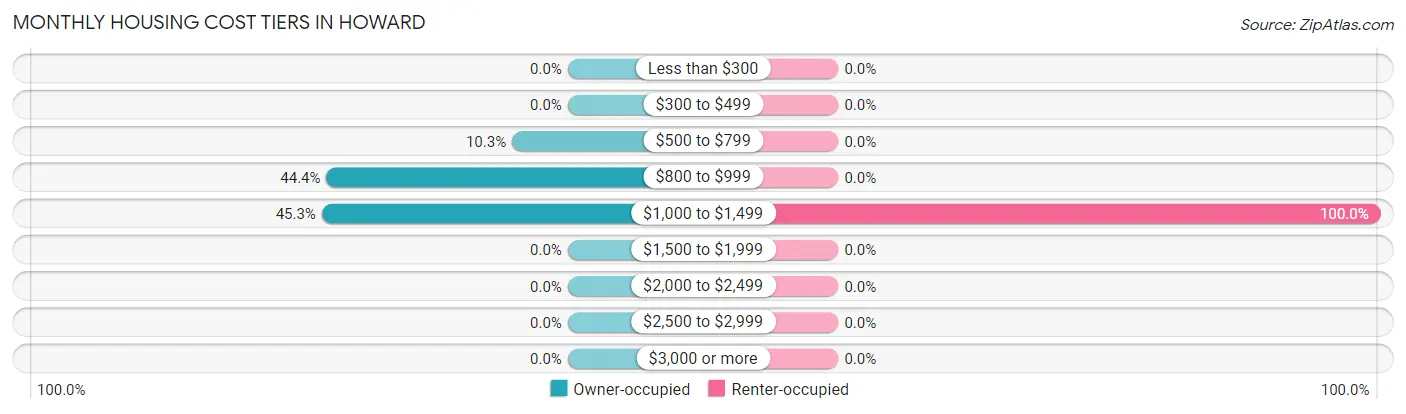
| Monthly Cost | Owner-occupied | Renter-occupied |
| Less than $300 | 0 (0.0%) | 0 (0.0%) |
| $300 to $499 | 0 (0.0%) | 0 (0.0%) |
| $500 to $799 | 12 (10.3%) | 0 (0.0%) |
| $800 to $999 | 52 (44.4%) | 0 (0.0%) |
| $1,000 to $1,499 | 53 (45.3%) | 35 (100.0%) |
| $1,500 to $1,999 | 0 (0.0%) | 0 (0.0%) |
| $2,000 to $2,499 | 0 (0.0%) | 0 (0.0%) |
| $2,500 to $2,999 | 0 (0.0%) | 0 (0.0%) |
| $3,000 or more | 0 (0.0%) | 0 (0.0%) |
| Total | 117 (100.0%) | 35 (100.0%) |
Physical Housing Characteristics in Howard
Housing Structures in Howard
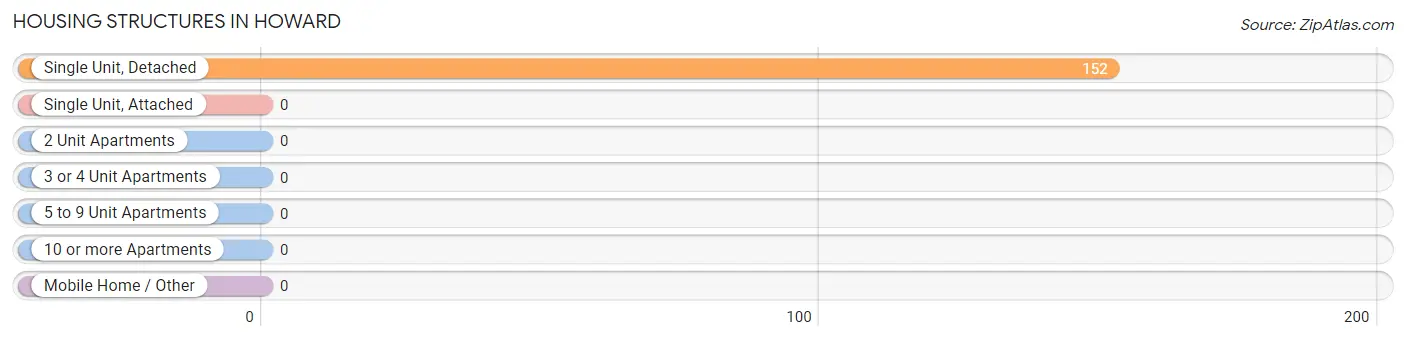
| Structure Type | # Housing Units | % Housing Units |
| Single Unit, Detached | 152 | 100.0% |
| Single Unit, Attached | 0 | 0.0% |
| 2 Unit Apartments | 0 | 0.0% |
| 3 or 4 Unit Apartments | 0 | 0.0% |
| 5 to 9 Unit Apartments | 0 | 0.0% |
| 10 or more Apartments | 0 | 0.0% |
| Mobile Home / Other | 0 | 0.0% |
| Total | 152 | 100.0% |
Housing Structures by Occupancy in Howard
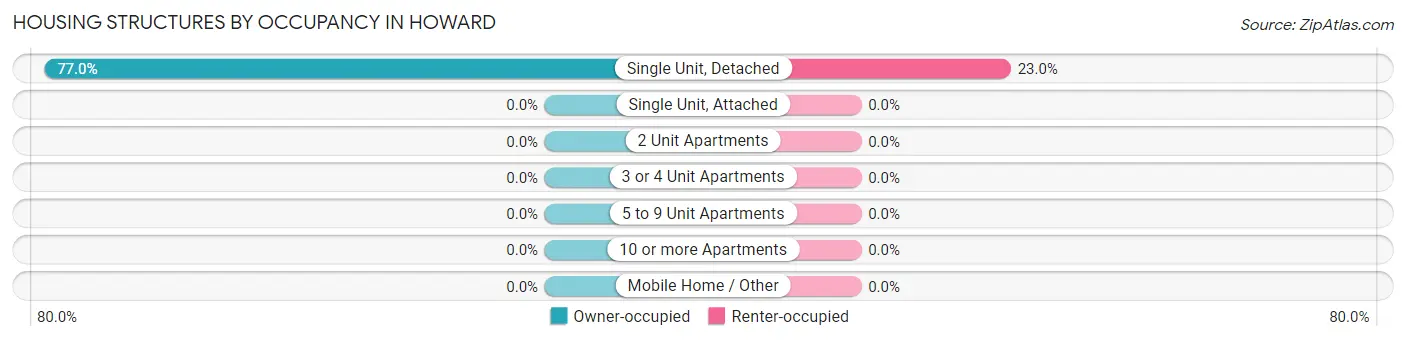
| Structure Type | Owner-occupied | Renter-occupied |
| Single Unit, Detached | 117 (77.0%) | 35 (23.0%) |
| Single Unit, Attached | 0 (0.0%) | 0 (0.0%) |
| 2 Unit Apartments | 0 (0.0%) | 0 (0.0%) |
| 3 or 4 Unit Apartments | 0 (0.0%) | 0 (0.0%) |
| 5 to 9 Unit Apartments | 0 (0.0%) | 0 (0.0%) |
| 10 or more Apartments | 0 (0.0%) | 0 (0.0%) |
| Mobile Home / Other | 0 (0.0%) | 0 (0.0%) |
| Total | 117 (77.0%) | 35 (23.0%) |
Housing Structures by Number of Rooms in Howard
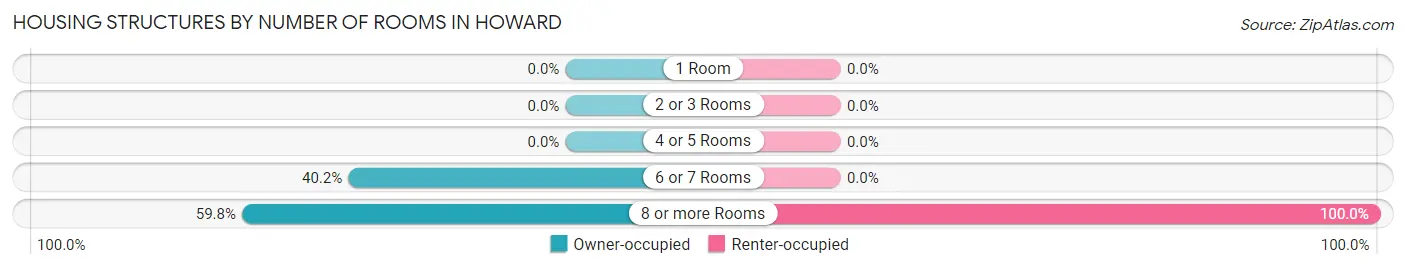
| Number of Rooms | Owner-occupied | Renter-occupied |
| 1 Room | 0 (0.0%) | 0 (0.0%) |
| 2 or 3 Rooms | 0 (0.0%) | 0 (0.0%) |
| 4 or 5 Rooms | 0 (0.0%) | 0 (0.0%) |
| 6 or 7 Rooms | 47 (40.2%) | 0 (0.0%) |
| 8 or more Rooms | 70 (59.8%) | 35 (100.0%) |
| Total | 117 (100.0%) | 35 (100.0%) |
Housing Structure by Heating Type in Howard
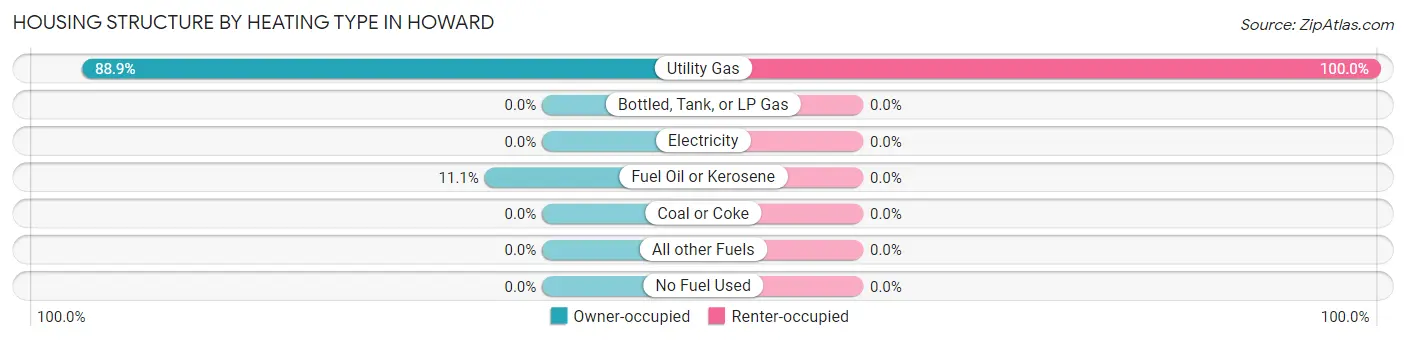
| Heating Type | Owner-occupied | Renter-occupied |
| Utility Gas | 104 (88.9%) | 35 (100.0%) |
| Bottled, Tank, or LP Gas | 0 (0.0%) | 0 (0.0%) |
| Electricity | 0 (0.0%) | 0 (0.0%) |
| Fuel Oil or Kerosene | 13 (11.1%) | 0 (0.0%) |
| Coal or Coke | 0 (0.0%) | 0 (0.0%) |
| All other Fuels | 0 (0.0%) | 0 (0.0%) |
| No Fuel Used | 0 (0.0%) | 0 (0.0%) |
| Total | 117 (100.0%) | 35 (100.0%) |
Household Vehicle Usage in Howard
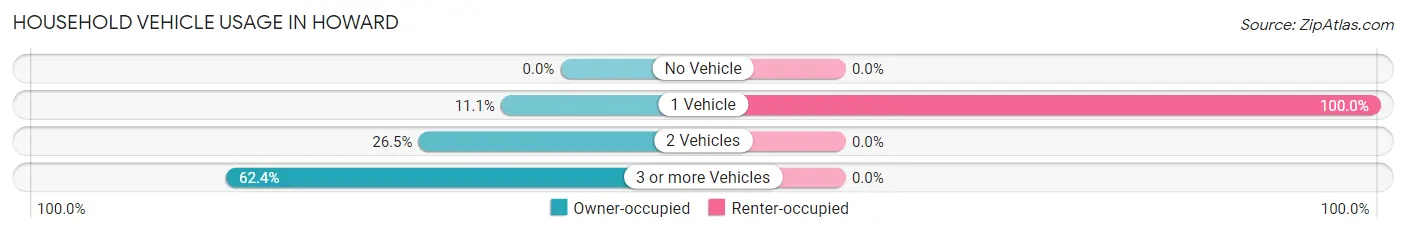
| Vehicles per Household | Owner-occupied | Renter-occupied |
| No Vehicle | 0 (0.0%) | 0 (0.0%) |
| 1 Vehicle | 13 (11.1%) | 35 (100.0%) |
| 2 Vehicles | 31 (26.5%) | 0 (0.0%) |
| 3 or more Vehicles | 73 (62.4%) | 0 (0.0%) |
| Total | 117 (100.0%) | 35 (100.0%) |
Real Estate & Mortgages in Howard
Real Estate and Mortgage Overview in Howard
| Characteristic | Without Mortgage | With Mortgage |
| Housing Units | 12 | 105 |
| Median Property Value | - | - |
| Median Household Income | - | - |
| Monthly Housing Costs | - | - |
| Real Estate Taxes | - | - |
Property Value by Mortgage Status in Howard
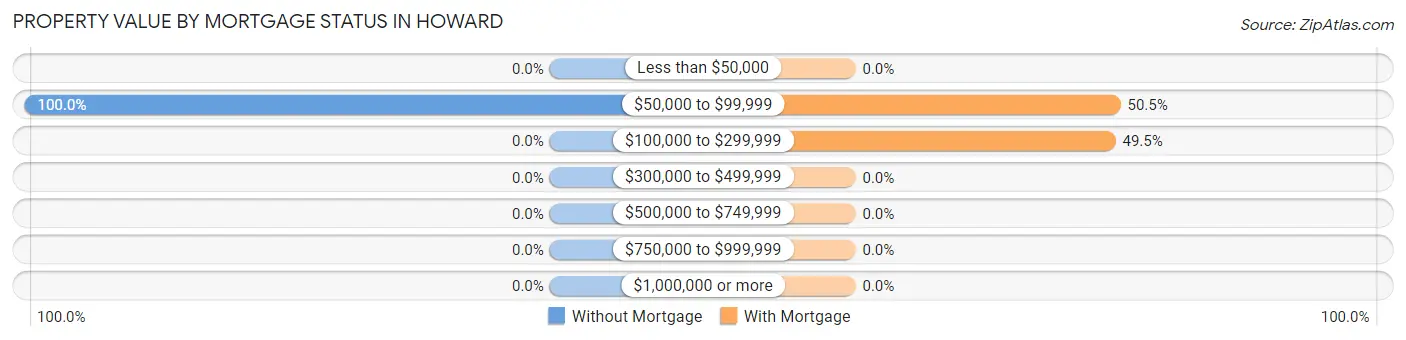
| Property Value | Without Mortgage | With Mortgage |
| Less than $50,000 | 0 (0.0%) | 0 (0.0%) |
| $50,000 to $99,999 | 12 (100.0%) | 53 (50.5%) |
| $100,000 to $299,999 | 0 (0.0%) | 52 (49.5%) |
| $300,000 to $499,999 | 0 (0.0%) | 0 (0.0%) |
| $500,000 to $749,999 | 0 (0.0%) | 0 (0.0%) |
| $750,000 to $999,999 | 0 (0.0%) | 0 (0.0%) |
| $1,000,000 or more | 0 (0.0%) | 0 (0.0%) |
| Total | 12 (100.0%) | 105 (100.0%) |
Household Income by Mortgage Status in Howard
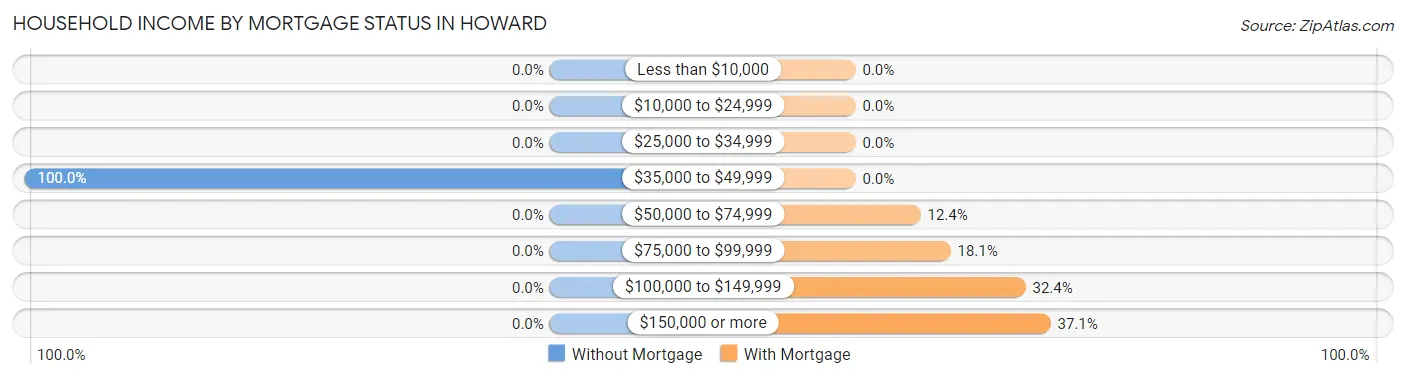
| Household Income | Without Mortgage | With Mortgage |
| Less than $10,000 | 0 (0.0%) | 0 (0.0%) |
| $10,000 to $24,999 | 0 (0.0%) | 0 (0.0%) |
| $25,000 to $34,999 | 0 (0.0%) | 0 (0.0%) |
| $35,000 to $49,999 | 12 (100.0%) | 0 (0.0%) |
| $50,000 to $74,999 | 0 (0.0%) | 13 (12.4%) |
| $75,000 to $99,999 | 0 (0.0%) | 19 (18.1%) |
| $100,000 to $149,999 | 0 (0.0%) | 34 (32.4%) |
| $150,000 or more | 0 (0.0%) | 39 (37.1%) |
| Total | 12 (100.0%) | 105 (100.0%) |
Property Value to Household Income Ratio in Howard
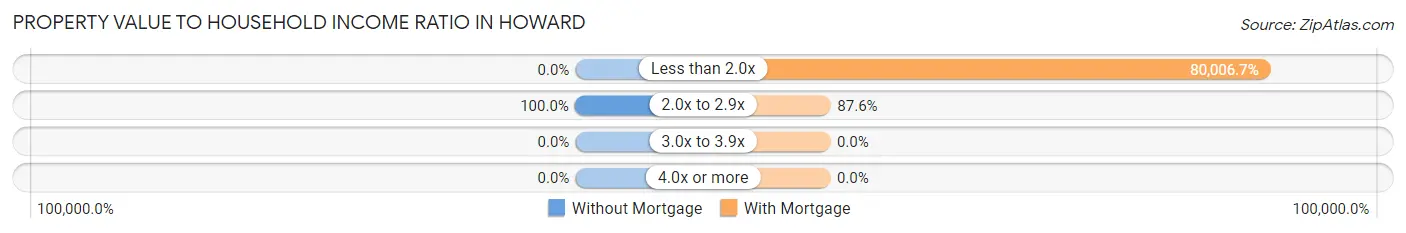
| Value-to-Income Ratio | Without Mortgage | With Mortgage |
| Less than 2.0x | 0 (0.0%) | 84,007 (80,006.7%) |
| 2.0x to 2.9x | 12 (100.0%) | 92 (87.6%) |
| 3.0x to 3.9x | 0 (0.0%) | 0 (0.0%) |
| 4.0x or more | 0 (0.0%) | 0 (0.0%) |
| Total | 12 (100.0%) | 105 (100.0%) |
Real Estate Taxes by Mortgage Status in Howard
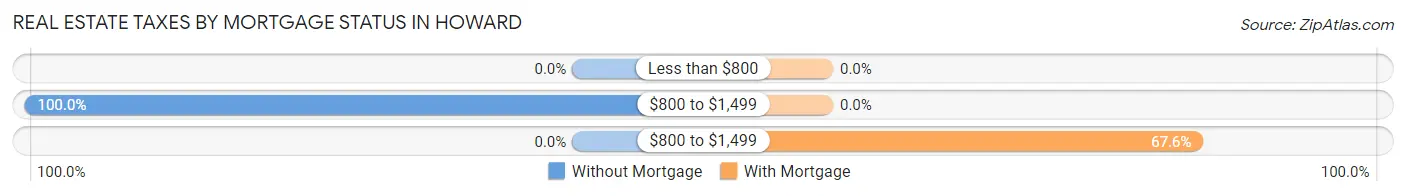
| Property Taxes | Without Mortgage | With Mortgage |
| Less than $800 | 0 (0.0%) | 0 (0.0%) |
| $800 to $1,499 | 12 (100.0%) | 0 (0.0%) |
| $800 to $1,499 | 0 (0.0%) | 71 (67.6%) |
| Total | 12 (100.0%) | 105 (100.0%) |
Health & Disability in Howard
Health Insurance Coverage by Age in Howard
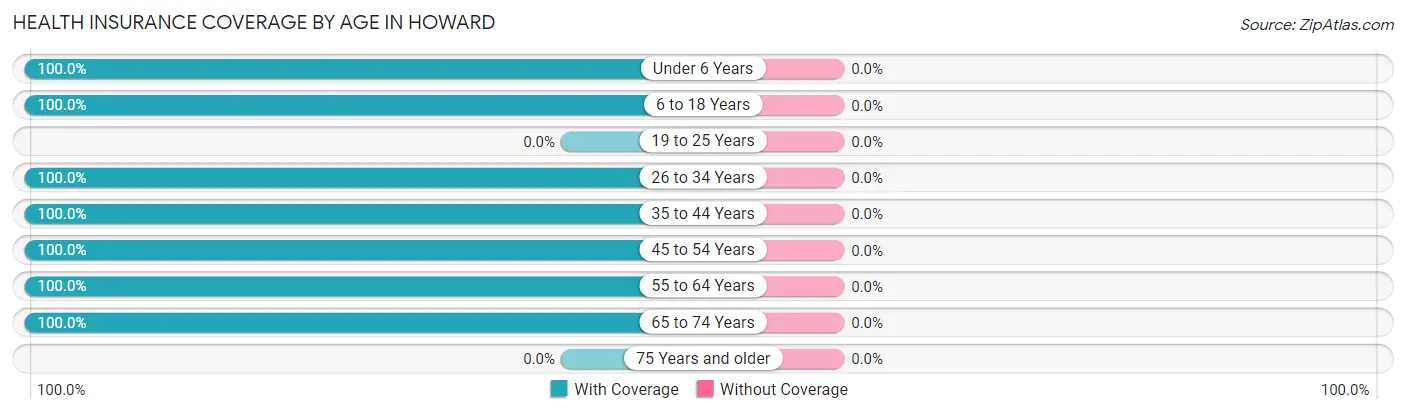
| Age Bracket | With Coverage | Without Coverage |
| Under 6 Years | 65 (100.0%) | 0 (0.0%) |
| 6 to 18 Years | 111 (100.0%) | 0 (0.0%) |
| 19 to 25 Years | 0 (0.0%) | 0 (0.0%) |
| 26 to 34 Years | 92 (100.0%) | 0 (0.0%) |
| 35 to 44 Years | 35 (100.0%) | 0 (0.0%) |
| 45 to 54 Years | 89 (100.0%) | 0 (0.0%) |
| 55 to 64 Years | 25 (100.0%) | 0 (0.0%) |
| 65 to 74 Years | 46 (100.0%) | 0 (0.0%) |
| 75 Years and older | 0 (0.0%) | 0 (0.0%) |
| Total | 463 (100.0%) | 0 (0.0%) |
Health Insurance Coverage by Citizenship Status in Howard
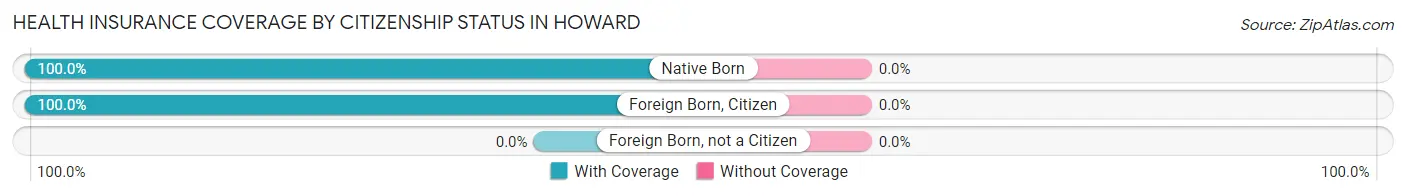
| Citizenship Status | With Coverage | Without Coverage |
| Native Born | 65 (100.0%) | 0 (0.0%) |
| Foreign Born, Citizen | 111 (100.0%) | 0 (0.0%) |
| Foreign Born, not a Citizen | 0 (0.0%) | 0 (0.0%) |
Health Insurance Coverage by Household Income in Howard
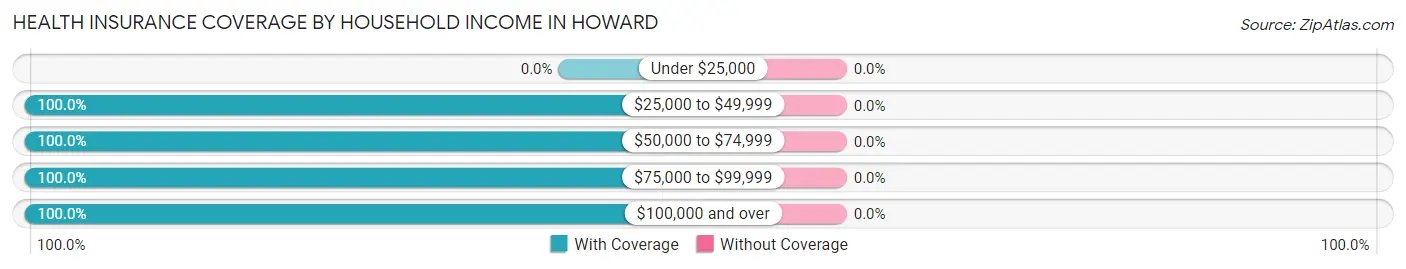
| Household Income | With Coverage | Without Coverage |
| Under $25,000 | 0 (0.0%) | 0 (0.0%) |
| $25,000 to $49,999 | 164 (100.0%) | 0 (0.0%) |
| $50,000 to $74,999 | 69 (100.0%) | 0 (0.0%) |
| $75,000 to $99,999 | 91 (100.0%) | 0 (0.0%) |
| $100,000 and over | 139 (100.0%) | 0 (0.0%) |
Public vs Private Health Insurance Coverage by Age in Howard
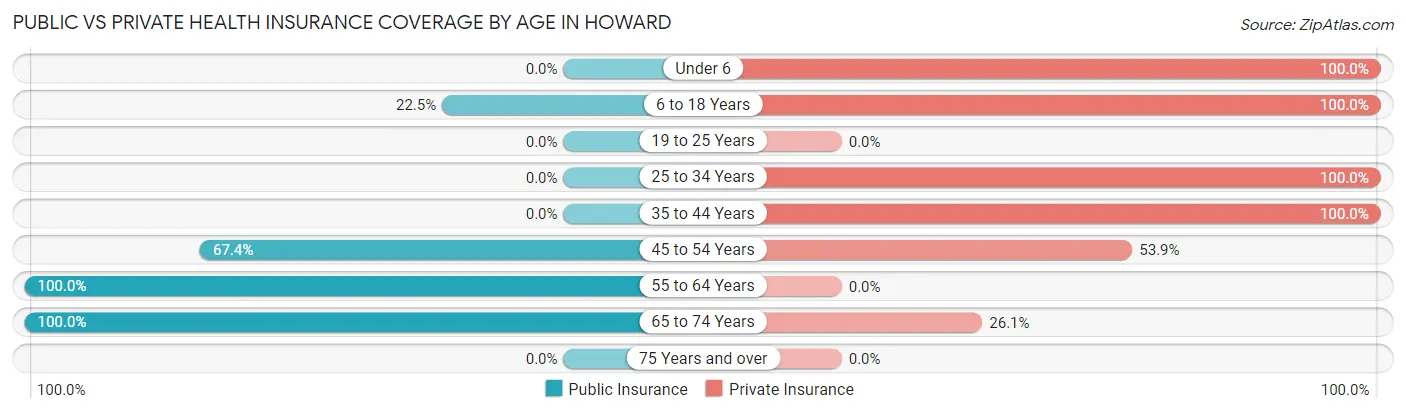
| Age Bracket | Public Insurance | Private Insurance |
| Under 6 | 0 (0.0%) | 65 (100.0%) |
| 6 to 18 Years | 25 (22.5%) | 111 (100.0%) |
| 19 to 25 Years | 0 (0.0%) | 0 (0.0%) |
| 25 to 34 Years | 0 (0.0%) | 92 (100.0%) |
| 35 to 44 Years | 0 (0.0%) | 35 (100.0%) |
| 45 to 54 Years | 60 (67.4%) | 48 (53.9%) |
| 55 to 64 Years | 25 (100.0%) | 0 (0.0%) |
| 65 to 74 Years | 46 (100.0%) | 12 (26.1%) |
| 75 Years and over | 0 (0.0%) | 0 (0.0%) |
| Total | 156 (33.7%) | 363 (78.4%) |
Disability Status by Sex by Age in Howard
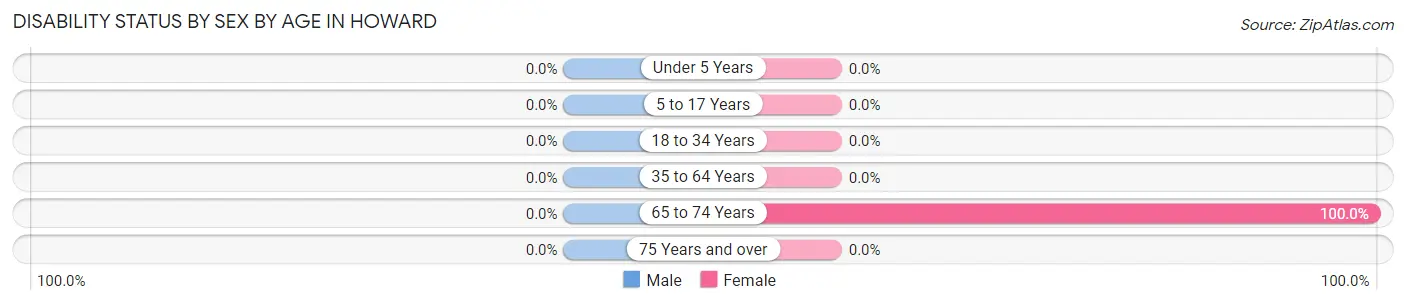
| Age Bracket | Male | Female |
| Under 5 Years | 0 (0.0%) | 0 (0.0%) |
| 5 to 17 Years | 0 (0.0%) | 0 (0.0%) |
| 18 to 34 Years | 0 (0.0%) | 0 (0.0%) |
| 35 to 64 Years | 0 (0.0%) | 0 (0.0%) |
| 65 to 74 Years | 0 (0.0%) | 12 (100.0%) |
| 75 Years and over | 0 (0.0%) | 0 (0.0%) |
Disability Class by Sex by Age in Howard
Disability Class: Hearing Difficulty
| Age Bracket | Male | Female |
| Under 5 Years | 0 (0.0%) | 0 (0.0%) |
| 5 to 17 Years | 0 (0.0%) | 0 (0.0%) |
| 18 to 34 Years | 0 (0.0%) | 0 (0.0%) |
| 35 to 64 Years | 0 (0.0%) | 0 (0.0%) |
| 65 to 74 Years | 0 (0.0%) | 0 (0.0%) |
| 75 Years and over | 0 (0.0%) | 0 (0.0%) |
Disability Class: Vision Difficulty
| Age Bracket | Male | Female |
| Under 5 Years | 0 (0.0%) | 0 (0.0%) |
| 5 to 17 Years | 0 (0.0%) | 0 (0.0%) |
| 18 to 34 Years | 0 (0.0%) | 0 (0.0%) |
| 35 to 64 Years | 0 (0.0%) | 0 (0.0%) |
| 65 to 74 Years | 0 (0.0%) | 0 (0.0%) |
| 75 Years and over | 0 (0.0%) | 0 (0.0%) |
Disability Class: Cognitive Difficulty
| Age Bracket | Male | Female |
| 5 to 17 Years | 0 (0.0%) | 0 (0.0%) |
| 18 to 34 Years | 0 (0.0%) | 0 (0.0%) |
| 35 to 64 Years | 0 (0.0%) | 0 (0.0%) |
| 65 to 74 Years | 0 (0.0%) | 0 (0.0%) |
| 75 Years and over | 0 (0.0%) | 0 (0.0%) |
Disability Class: Ambulatory Difficulty
| Age Bracket | Male | Female |
| 5 to 17 Years | 0 (0.0%) | 0 (0.0%) |
| 18 to 34 Years | 0 (0.0%) | 0 (0.0%) |
| 35 to 64 Years | 0 (0.0%) | 0 (0.0%) |
| 65 to 74 Years | 0 (0.0%) | 12 (100.0%) |
| 75 Years and over | 0 (0.0%) | 0 (0.0%) |
Disability Class: Self-Care Difficulty
| Age Bracket | Male | Female |
| 5 to 17 Years | 0 (0.0%) | 0 (0.0%) |
| 18 to 34 Years | 0 (0.0%) | 0 (0.0%) |
| 35 to 64 Years | 0 (0.0%) | 0 (0.0%) |
| 65 to 74 Years | 0 (0.0%) | 0 (0.0%) |
| 75 Years and over | 0 (0.0%) | 0 (0.0%) |
Technology Access in Howard
Computing Device Access in Howard
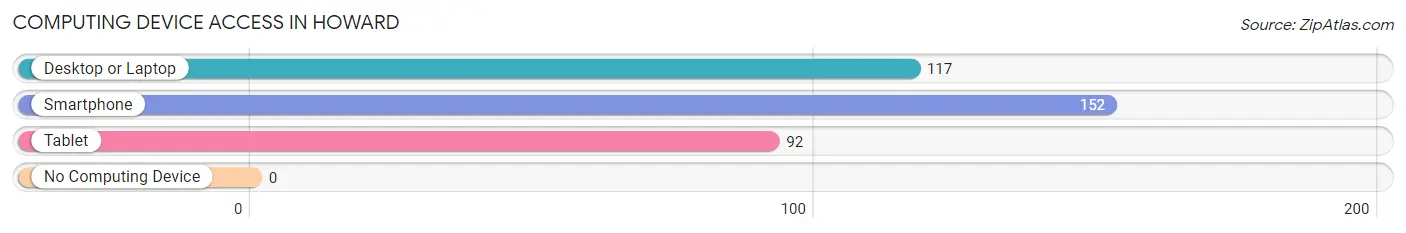
| Device Type | # Households | % Households |
| Desktop or Laptop | 117 | 77.0% |
| Smartphone | 152 | 100.0% |
| Tablet | 92 | 60.5% |
| No Computing Device | 0 | 0.0% |
| Total | 152 | 100.0% |
Internet Access in Howard
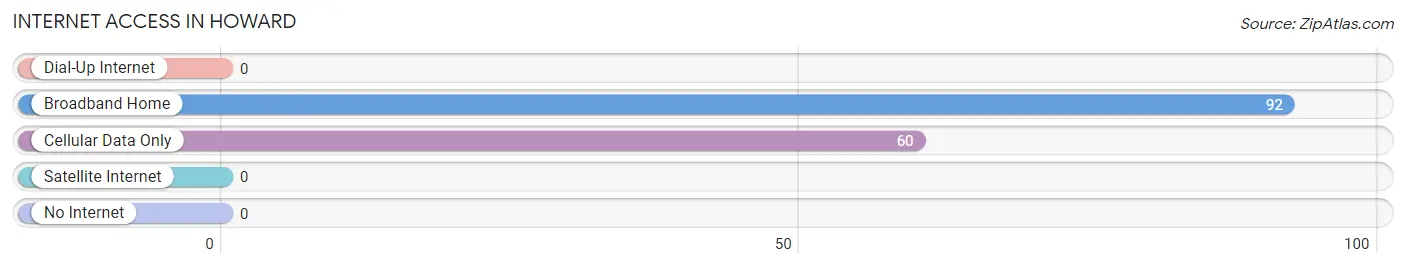
| Internet Type | # Households | % Households |
| Dial-Up Internet | 0 | 0.0% |
| Broadband Home | 92 | 60.5% |
| Cellular Data Only | 60 | 39.5% |
| Satellite Internet | 0 | 0.0% |
| No Internet | 0 | 0.0% |
| Total | 152 | 100.0% |
Howard Summary
Howard, Ohio is a small village located in Knox County, Ohio. It is situated in the Appalachian foothills of the Appalachian Mountains, approximately 30 miles east of Columbus. The village has a population of approximately 1,000 people and is part of the Mount Vernon Micropolitan Statistical Area.
Geography
Howard is located at 40°25'25" North, 82°25'45" West (40.423, -82.429). According to the United States Census Bureau, the village has a total area of 0.6 square miles (1.6 km2), all of it land.
The village is situated in the Appalachian foothills of the Appalachian Mountains. The terrain is mostly rolling hills and valleys, with some flat areas. The village is located in the Black Fork Creek watershed.
Economy
The economy of Howard is largely based on agriculture and small businesses. The village is home to several small businesses, including a grocery store, a hardware store, a restaurant, and a gas station. The village also has a post office and a bank.
The village is also home to several farms, which produce a variety of crops, including corn, soybeans, wheat, and hay. The village also has a small manufacturing sector, which produces a variety of products, including furniture, clothing, and food products.
Demographics
As of the census of 2000, there were 1,000 people, 393 households, and 279 families residing in the village. The population density was 1,637.2 people per square mile (631.2/km2). There were 431 housing units at an average density of 705.2 per square mile (272.3/km2). The racial makeup of the village was 98.50% White, 0.10% African American, 0.30% Native American, 0.10% Asian, 0.10% from other races, and 0.90% from two or more races. Hispanic or Latino of any race were 0.50% of the population.
There were 393 households, out of which 33.2% had children under the age of 18 living with them, 57.2% were married couples living together, 9.9% had a female householder with no husband present, and 28.7% were non-families. 24.6% of all households were made up of individuals, and 11.2% had someone living alone who was 65 years of age or older. The average household size was 2.54 and the average family size was 3.02.
In the village, the population was spread out, with 25.7% under the age of 18, 8.2% from 18 to 24, 28.2% from 25 to 44, 22.7% from 45 to 64, and 15.2% who were 65 years of age or older. The median age was 37 years. For every 100 females, there were 97.2 males. For every 100 females age 18 and over, there were 92.2 males.
The median income for a household in the village was $35,000, and the median income for a family was $41,250. Males had a median income of $30,000 versus $21,250 for females. The per capita income for the village was $15,945. About 8.2% of families and 10.2% of the population were below the poverty line, including 11.2% of those under age 18 and 8.2% of those age 65 or over.
Common Questions
What is Per Capita Income in Howard?
Per Capita income in Howard is $25,173.
What is the Median Family Income in Howard?
Median Family Income in Howard is $72,757.
What is Inequality or Gini Index in Howard?
Inequality or Gini Index in Howard is 0.28.
What is the Total Population of Howard?
Total Population of Howard is 463.
What is the Total Male Population of Howard?
Total Male Population of Howard is 221.
What is the Total Female Population of Howard?
Total Female Population of Howard is 242.
What is the Ratio of Males per 100 Females in Howard?
There are 91.32 Males per 100 Females in Howard.
What is the Ratio of Females per 100 Males in Howard?
There are 109.50 Females per 100 Males in Howard.
What is the Median Population Age in Howard?
Median Population Age in Howard is 29.8 Years.
What is the Average Family Size in Howard
Average Family Size in Howard is 2.9 People.
What is the Average Household Size in Howard
Average Household Size in Howard is 3.0 People.
How Large is the Labor Force in Howard?
There are 241 People in the Labor Forcein in Howard.
What is the Percentage of People in the Labor Force in Howard?
84.0% of People are in the Labor Force in Howard.