Cities with the Most Immigrants from Croatia in Ohio
RELATED REPORTS & OPTIONS
Croatia
Ohio
Compare Cities
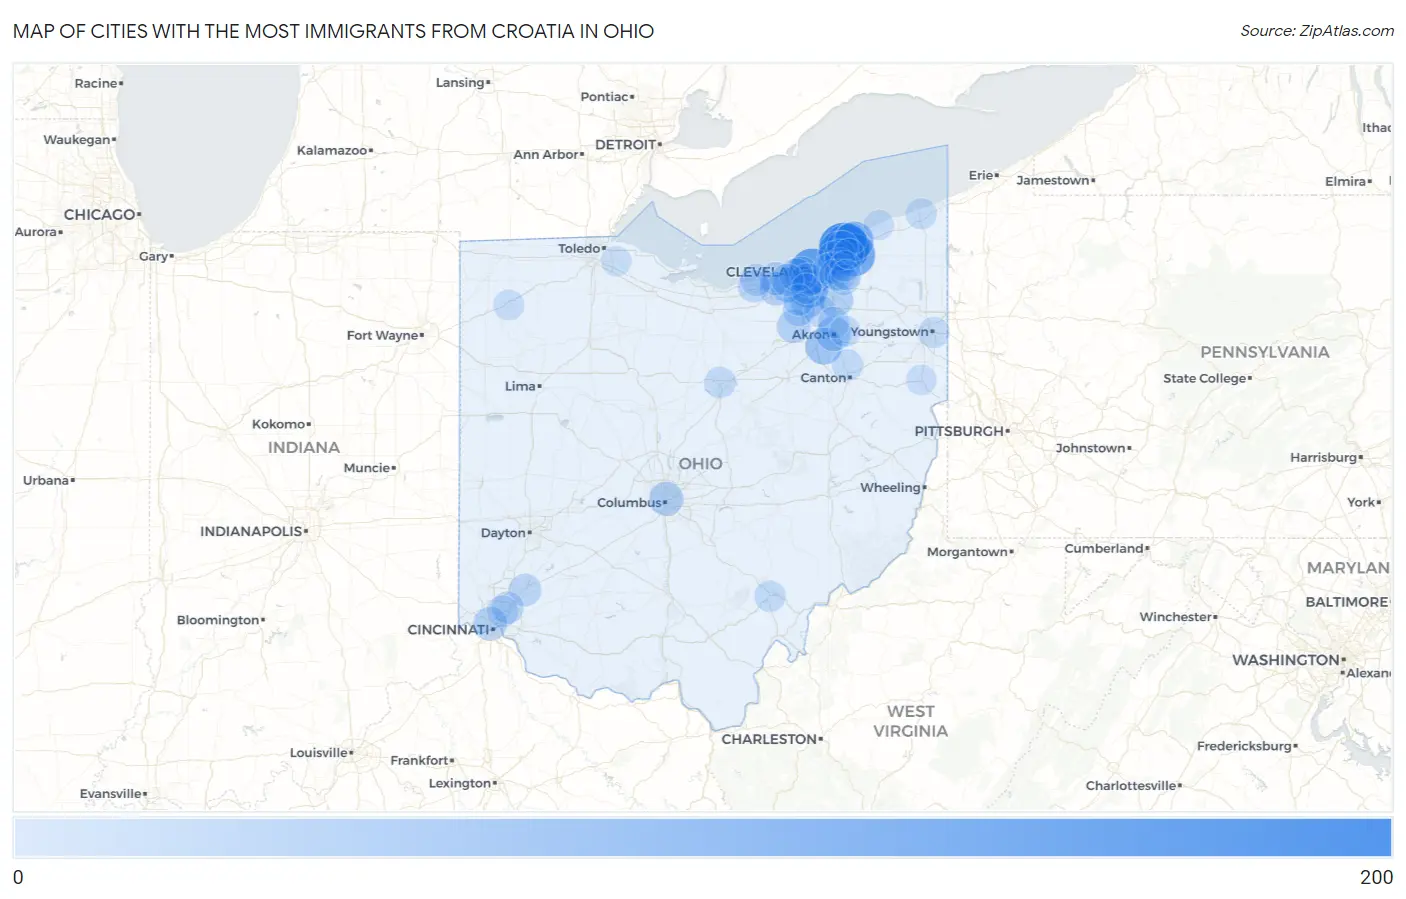
Map of Cities with the Most Immigrants from Croatia in Ohio
0
200
Cities with the Most Immigrants from Croatia in Ohio
| City | Croatia | vs State | vs National | |
| 1. | Eastlake | 196 | 2,185(8.97%)#1 | 38,180(0.51%)#14 |
| 2. | Willoughby | 161 | 2,185(7.37%)#2 | 38,180(0.42%)#18 |
| 3. | Cleveland | 154 | 2,185(7.05%)#3 | 38,180(0.40%)#22 |
| 4. | Kirtland | 128 | 2,185(5.86%)#4 | 38,180(0.34%)#30 |
| 5. | Willowick | 98 | 2,185(4.49%)#5 | 38,180(0.26%)#54 |
| 6. | Mentor | 94 | 2,185(4.30%)#6 | 38,180(0.25%)#57 |
| 7. | Parma | 81 | 2,185(3.71%)#7 | 38,180(0.21%)#74 |
| 8. | Barberton | 65 | 2,185(2.97%)#8 | 38,180(0.17%)#97 |
| 9. | North Royalton | 50 | 2,185(2.29%)#9 | 38,180(0.13%)#137 |
| 10. | Akron | 47 | 2,185(2.15%)#10 | 38,180(0.12%)#144 |
| 11. | North Olmsted | 42 | 2,185(1.92%)#11 | 38,180(0.11%)#164 |
| 12. | Lakewood | 39 | 2,185(1.78%)#12 | 38,180(0.10%)#183 |
| 13. | Columbus | 38 | 2,185(1.74%)#13 | 38,180(0.10%)#185 |
| 14. | Macedonia | 37 | 2,185(1.69%)#14 | 38,180(0.10%)#192 |
| 15. | Cincinnati | 34 | 2,185(1.56%)#15 | 38,180(0.09%)#206 |
| 16. | North Ridgeville | 34 | 2,185(1.56%)#16 | 38,180(0.09%)#209 |
| 17. | Medina | 34 | 2,185(1.56%)#17 | 38,180(0.09%)#210 |
| 18. | Avon | 30 | 2,185(1.37%)#18 | 38,180(0.08%)#242 |
| 19. | Brooklyn | 30 | 2,185(1.37%)#19 | 38,180(0.08%)#246 |
| 20. | Rocky River | 29 | 2,185(1.33%)#20 | 38,180(0.08%)#253 |
| 21. | South Lebanon | 24 | 2,185(1.10%)#21 | 38,180(0.06%)#303 |
| 22. | Brunswick | 23 | 2,185(1.05%)#22 | 38,180(0.06%)#313 |
| 23. | Euclid | 22 | 2,185(1.01%)#23 | 38,180(0.06%)#328 |
| 24. | Westlake | 21 | 2,185(0.96%)#24 | 38,180(0.06%)#341 |
| 25. | Lyndhurst | 20 | 2,185(0.92%)#25 | 38,180(0.05%)#358 |
| 26. | Amherst | 20 | 2,185(0.92%)#26 | 38,180(0.05%)#359 |
| 27. | Lorain | 19 | 2,185(0.87%)#27 | 38,180(0.05%)#367 |
| 28. | Blue Ash | 19 | 2,185(0.87%)#28 | 38,180(0.05%)#376 |
| 29. | Highland Heights | 15 | 2,185(0.69%)#29 | 38,180(0.04%)#446 |
| 30. | Richfield | 15 | 2,185(0.69%)#30 | 38,180(0.04%)#449 |
| 31. | Cuyahoga Falls | 13 | 2,185(0.59%)#31 | 38,180(0.03%)#493 |
| 32. | Mansfield | 13 | 2,185(0.59%)#32 | 38,180(0.03%)#496 |
| 33. | South Euclid | 13 | 2,185(0.59%)#33 | 38,180(0.03%)#503 |
| 34. | Reading | 13 | 2,185(0.59%)#34 | 38,180(0.03%)#509 |
| 35. | Mentor On The Lake | 13 | 2,185(0.59%)#35 | 38,180(0.03%)#512 |
| 36. | Strongsville | 12 | 2,185(0.55%)#36 | 38,180(0.03%)#523 |
| 37. | Cleveland Heights | 12 | 2,185(0.55%)#37 | 38,180(0.03%)#524 |
| 38. | Athens | 12 | 2,185(0.55%)#38 | 38,180(0.03%)#526 |
| 39. | North Canton | 12 | 2,185(0.55%)#39 | 38,180(0.03%)#531 |
| 40. | Pepper Pike | 11 | 2,185(0.50%)#40 | 38,180(0.03%)#568 |
| 41. | Youngstown | 10 | 2,185(0.46%)#41 | 38,180(0.03%)#583 |
| 42. | Tallmadge | 9 | 2,185(0.41%)#42 | 38,180(0.02%)#638 |
| 43. | Beachwood | 9 | 2,185(0.41%)#43 | 38,180(0.02%)#645 |
| 44. | Edgewood | 9 | 2,185(0.41%)#44 | 38,180(0.02%)#658 |
| 45. | Defiance | 8 | 2,185(0.37%)#45 | 38,180(0.02%)#684 |
| 46. | Wickliffe | 8 | 2,185(0.37%)#46 | 38,180(0.02%)#685 |
| 47. | Moreland Hills | 8 | 2,185(0.37%)#47 | 38,180(0.02%)#697 |
| 48. | Timberlake | 6 | 2,185(0.27%)#48 | 38,180(0.02%)#764 |
| 49. | Gates Mills | 5 | 2,185(0.23%)#49 | 38,180(0.01%)#788 |
| 50. | Parma Heights | 4 | 2,185(0.18%)#50 | 38,180(0.01%)#808 |
| 51. | Lisbon | 4 | 2,185(0.18%)#51 | 38,180(0.01%)#813 |
| 52. | Hunting Valley | 4 | 2,185(0.18%)#52 | 38,180(0.01%)#818 |
| 53. | North Perry | 3 | 2,185(0.14%)#53 | 38,180(0.01%)#832 |
| 54. | Millbury | 2 | 2,185(0.09%)#54 | 38,180(0.01%)#843 |
| 55. | Waite Hill | 2 | 2,185(0.09%)#55 | 38,180(0.01%)#848 |
Common Questions
What are the Top 10 Cities with the Most Immigrants from Croatia in Ohio?
Top 10 Cities with the Most Immigrants from Croatia in Ohio are:
#1
196
#2
161
#3
154
#4
128
#5
98
#6
94
#7
81
#8
65
#9
50
#10
47
What city has the Most Immigrants from Croatia in Ohio?
Eastlake has the Most Immigrants from Croatia in Ohio with 196.
What is the Total Immigrants from Croatia in the State of Ohio?
Total Immigrants from Croatia in Ohio is 2,185.
What is the Total Immigrants from Croatia in the United States?
Total Immigrants from Croatia in the United States is 38,180.