Cities with the Highest Percentage of Immigrants from Mexico in Ohio
RELATED REPORTS & OPTIONS
Mexico
Ohio
Compare Cities
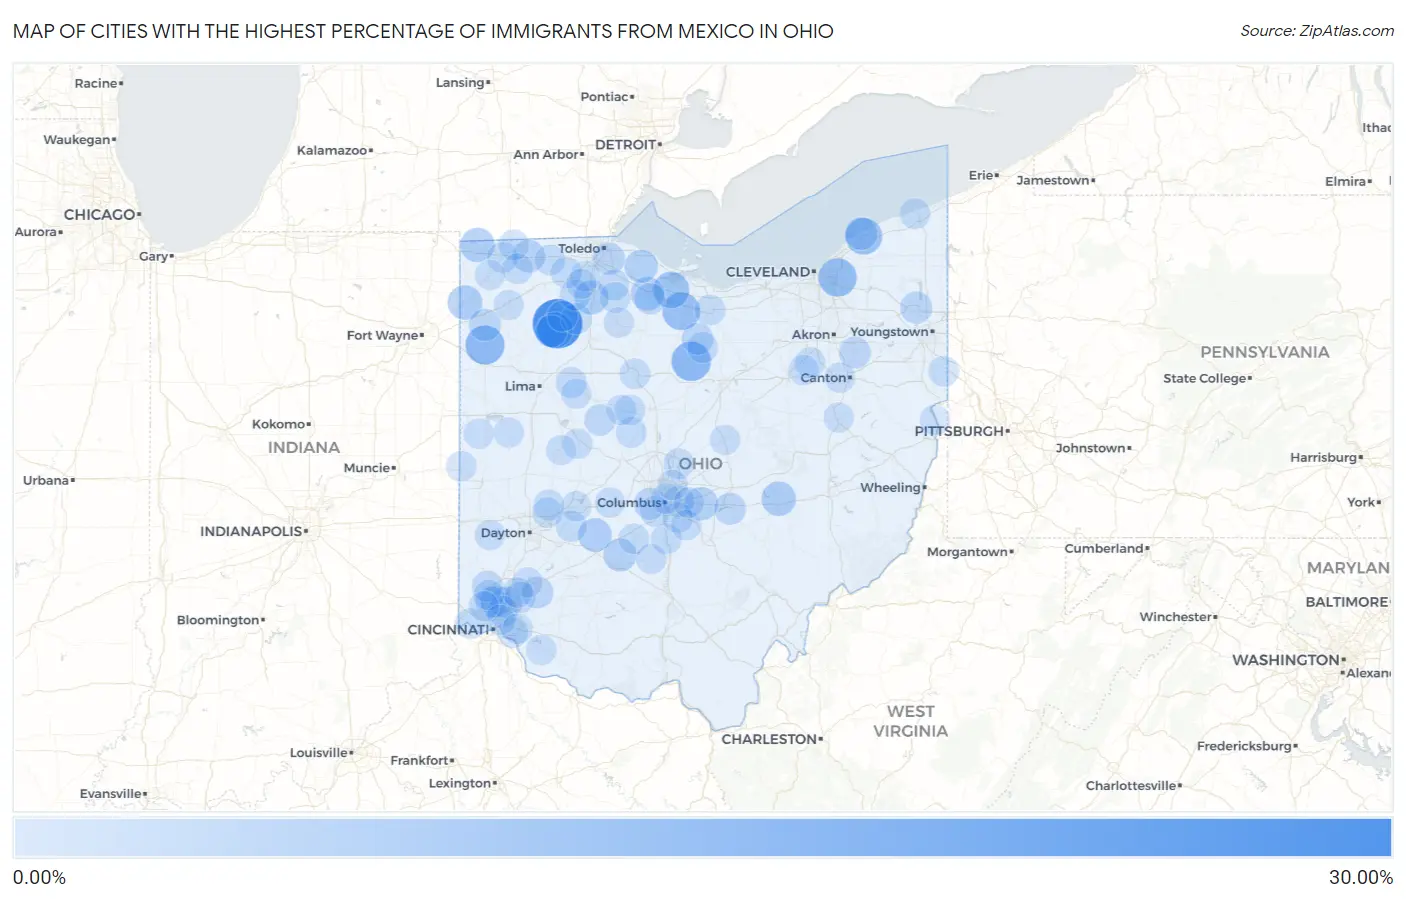
Map of Cities with the Highest Percentage of Immigrants from Mexico in Ohio
0.00%
30.00%
Cities with the Highest Percentage of Immigrants from Mexico in Ohio
| City | Mexico | vs State | vs National | |
| 1. | Belmore | 29.79% | 0.38%(+29.4)#-1 | 3.25%(+26.5)#0 |
| 2. | Tiro | 14.46% | 0.38%(+14.1)#0 | 3.25%(+11.2)#1 |
| 3. | Haviland | 13.89% | 0.38%(+13.5)#1 | 3.25%(+10.6)#2 |
| 4. | Woodmere | 12.59% | 0.38%(+12.2)#2 | 3.25%(+9.34)#3 |
| 5. | Flat Rock | 11.95% | 0.38%(+11.6)#3 | 3.25%(+8.69)#4 |
| 6. | Painesville | 10.39% | 0.38%(+10.0)#4 | 3.25%(+7.14)#5 |
| 7. | Vickery | 9.66% | 0.38%(+9.28)#5 | 3.25%(+6.41)#6 |
| 8. | Leipsic | 9.07% | 0.38%(+8.69)#6 | 3.25%(+5.82)#7 |
| 9. | Hicksville | 7.06% | 0.38%(+6.68)#7 | 3.25%(+3.81)#8 |
| 10. | North Zanesville | 6.95% | 0.38%(+6.57)#8 | 3.25%(+3.70)#9 |
| 11. | Lake Seneca | 6.79% | 0.38%(+6.41)#9 | 3.25%(+3.54)#10 |
| 12. | Ai | 6.37% | 0.38%(+5.99)#10 | 3.25%(+3.12)#11 |
| 13. | Portage | 6.29% | 0.38%(+5.91)#11 | 3.25%(+3.04)#12 |
| 14. | Stony Prairie | 5.80% | 0.38%(+5.42)#12 | 3.25%(+2.55)#13 |
| 15. | South Solon | 5.71% | 0.38%(+5.33)#13 | 3.25%(+2.46)#14 |
| 16. | Etna | 5.43% | 0.38%(+5.05)#14 | 3.25%(+2.18)#15 |
| 17. | Rocky Ridge | 5.26% | 0.38%(+4.88)#15 | 3.25%(+2.01)#16 |
| 18. | Bloomingburg | 4.93% | 0.38%(+4.55)#16 | 3.25%(+1.67)#17 |
| 19. | Tedrow | 4.40% | 0.38%(+4.02)#17 | 3.25%(+1.15)#18 |
| 20. | Fairport Harbor | 4.19% | 0.38%(+3.81)#18 | 3.25%(+0.942)#19 |
| 21. | Walbridge | 3.84% | 0.38%(+3.46)#19 | 3.25%(+0.585)#20 |
| 22. | Lincoln Village | 3.62% | 0.38%(+3.24)#20 | 3.25%(+0.370)#21 |
| 23. | Paulding | 3.52% | 0.38%(+3.14)#21 | 3.25%(+0.266)#22 |
| 24. | Morgandale | 3.38% | 0.38%(+3.00)#22 | 3.25%(+0.128)#23 |
| 25. | West Leipsic | 3.24% | 0.38%(+2.86)#23 | 3.25%(-0.013)#24 |
| 26. | Thornport | 3.17% | 0.38%(+2.79)#24 | 3.25%(-0.079)#25 |
| 27. | Morrow | 3.12% | 0.38%(+2.74)#25 | 3.25%(-0.130)#26 |
| 28. | Hartville | 3.10% | 0.38%(+2.72)#26 | 3.25%(-0.148)#27 |
| 29. | Willard | 3.09% | 0.38%(+2.71)#27 | 3.25%(-0.166)#28 |
| 30. | Springdale | 3.01% | 0.38%(+2.63)#28 | 3.25%(-0.240)#29 |
| 31. | Sharonville | 3.01% | 0.38%(+2.63)#29 | 3.25%(-0.243)#30 |
| 32. | Miller | 2.99% | 0.38%(+2.61)#30 | 3.25%(-0.261)#31 |
| 33. | Forest Park | 2.45% | 0.38%(+2.07)#31 | 3.25%(-0.803)#32 |
| 34. | Ballville | 2.45% | 0.38%(+2.07)#32 | 3.25%(-0.804)#33 |
| 35. | Ridgeway | 2.41% | 0.38%(+2.03)#33 | 3.25%(-0.846)#34 |
| 36. | Whitehall | 2.28% | 0.38%(+1.90)#34 | 3.25%(-0.976)#35 |
| 37. | Landen | 2.25% | 0.38%(+1.87)#35 | 3.25%(-1.01)#36 |
| 38. | Hamilton | 2.25% | 0.38%(+1.87)#36 | 3.25%(-1.01)#37 |
| 39. | Hoytville | 2.17% | 0.38%(+1.79)#37 | 3.25%(-1.08)#38 |
| 40. | Clifton | 2.13% | 0.38%(+1.75)#38 | 3.25%(-1.12)#39 |
| 41. | Neapolis | 2.07% | 0.38%(+1.69)#39 | 3.25%(-1.18)#40 |
| 42. | Weston | 2.07% | 0.38%(+1.69)#40 | 3.25%(-1.18)#41 |
| 43. | Ada | 2.02% | 0.38%(+1.64)#41 | 3.25%(-1.23)#42 |
| 44. | Reading | 2.02% | 0.38%(+1.64)#42 | 3.25%(-1.23)#43 |
| 45. | Pemberville | 1.91% | 0.38%(+1.53)#43 | 3.25%(-1.34)#44 |
| 46. | South Bloomfield | 1.83% | 0.38%(+1.45)#44 | 3.25%(-1.42)#45 |
| 47. | Plymouth | 1.79% | 0.38%(+1.41)#45 | 3.25%(-1.46)#46 |
| 48. | West Unity | 1.76% | 0.38%(+1.38)#46 | 3.25%(-1.49)#47 |
| 49. | New Carlisle | 1.72% | 0.38%(+1.34)#47 | 3.25%(-1.53)#48 |
| 50. | Bradner | 1.71% | 0.38%(+1.33)#48 | 3.25%(-1.54)#49 |
| 51. | Ashtabula | 1.67% | 0.38%(+1.29)#49 | 3.25%(-1.59)#50 |
| 52. | Galena | 1.66% | 0.38%(+1.28)#50 | 3.25%(-1.59)#51 |
| 53. | Urbancrest | 1.64% | 0.38%(+1.26)#51 | 3.25%(-1.61)#52 |
| 54. | Deshler | 1.61% | 0.38%(+1.23)#52 | 3.25%(-1.64)#53 |
| 55. | Upper Sandusky | 1.61% | 0.38%(+1.23)#53 | 3.25%(-1.65)#54 |
| 56. | Norwalk | 1.60% | 0.38%(+1.22)#54 | 3.25%(-1.66)#55 |
| 57. | Delta | 1.56% | 0.38%(+1.18)#55 | 3.25%(-1.69)#56 |
| 58. | Marshallville | 1.55% | 0.38%(+1.17)#56 | 3.25%(-1.71)#57 |
| 59. | Fayette | 1.53% | 0.38%(+1.15)#57 | 3.25%(-1.72)#58 |
| 60. | Archbold | 1.46% | 0.38%(+1.08)#58 | 3.25%(-1.79)#59 |
| 61. | Mount Sterling | 1.43% | 0.38%(+1.05)#59 | 3.25%(-1.82)#60 |
| 62. | Fairfield | 1.42% | 0.38%(+1.04)#60 | 3.25%(-1.83)#61 |
| 63. | Richwood | 1.40% | 0.38%(+1.01)#61 | 3.25%(-1.86)#62 |
| 64. | New Bloomington | 1.38% | 0.38%(+0.997)#62 | 3.25%(-1.87)#63 |
| 65. | East Palestine | 1.38% | 0.38%(+0.996)#63 | 3.25%(-1.88)#64 |
| 66. | Addyston | 1.34% | 0.38%(+0.959)#64 | 3.25%(-1.91)#65 |
| 67. | Forestville | 1.31% | 0.38%(+0.925)#65 | 3.25%(-1.95)#66 |
| 68. | Norwood | 1.28% | 0.38%(+0.903)#66 | 3.25%(-1.97)#67 |
| 69. | Orrville | 1.24% | 0.38%(+0.860)#67 | 3.25%(-2.01)#68 |
| 70. | Groveport | 1.23% | 0.38%(+0.851)#68 | 3.25%(-2.02)#69 |
| 71. | Lithopolis | 1.21% | 0.38%(+0.828)#69 | 3.25%(-2.04)#70 |
| 72. | Park Layne | 1.18% | 0.38%(+0.802)#70 | 3.25%(-2.07)#71 |
| 73. | Bethel | 1.18% | 0.38%(+0.795)#71 | 3.25%(-2.08)#72 |
| 74. | La Rue | 1.13% | 0.38%(+0.753)#72 | 3.25%(-2.12)#73 |
| 75. | Springfield | 1.13% | 0.38%(+0.747)#73 | 3.25%(-2.12)#74 |
| 76. | Mount Carmel | 1.12% | 0.38%(+0.737)#74 | 3.25%(-2.13)#75 |
| 77. | Columbus | 1.11% | 0.38%(+0.731)#75 | 3.25%(-2.14)#76 |
| 78. | Minerva Park | 1.11% | 0.38%(+0.728)#76 | 3.25%(-2.14)#77 |
| 79. | Fostoria | 1.07% | 0.38%(+0.689)#77 | 3.25%(-2.18)#78 |
| 80. | New Bremen | 1.05% | 0.38%(+0.674)#78 | 3.25%(-2.20)#79 |
| 81. | Mcguffey | 1.05% | 0.38%(+0.672)#79 | 3.25%(-2.20)#80 |
| 82. | Reynoldsburg | 1.05% | 0.38%(+0.668)#80 | 3.25%(-2.20)#81 |
| 83. | Haskins | 1.04% | 0.38%(+0.660)#81 | 3.25%(-2.21)#82 |
| 84. | West Alexandria | 1.04% | 0.38%(+0.660)#82 | 3.25%(-2.21)#83 |
| 85. | Tontogany | 1.01% | 0.38%(+0.625)#83 | 3.25%(-2.25)#84 |
| 86. | Perry Heights | 0.99% | 0.38%(+0.612)#84 | 3.25%(-2.26)#85 |
| 87. | Union City | 0.98% | 0.38%(+0.601)#85 | 3.25%(-2.27)#86 |
| 88. | Lebanon | 0.98% | 0.38%(+0.596)#86 | 3.25%(-2.28)#87 |
| 89. | Dover | 0.97% | 0.38%(+0.588)#87 | 3.25%(-2.28)#88 |
| 90. | Northgate | 0.96% | 0.38%(+0.581)#88 | 3.25%(-2.29)#89 |
| 91. | Defiance | 0.94% | 0.38%(+0.563)#89 | 3.25%(-2.31)#90 |
| 92. | Williamsport | 0.94% | 0.38%(+0.559)#90 | 3.25%(-2.31)#91 |
| 93. | Mount Vernon | 0.91% | 0.38%(+0.527)#91 | 3.25%(-2.34)#92 |
| 94. | Mason | 0.90% | 0.38%(+0.517)#92 | 3.25%(-2.35)#93 |
| 95. | Bryan | 0.89% | 0.38%(+0.508)#93 | 3.25%(-2.36)#94 |
| 96. | Bellefontaine | 0.89% | 0.38%(+0.505)#94 | 3.25%(-2.37)#95 |
| 97. | Empire | 0.87% | 0.38%(+0.485)#95 | 3.25%(-2.39)#96 |
| 98. | St Henry | 0.86% | 0.38%(+0.479)#96 | 3.25%(-2.39)#97 |
| 99. | De Graff | 0.86% | 0.38%(+0.475)#97 | 3.25%(-2.40)#98 |
| 100. | Choctaw Lake | 0.83% | 0.38%(+0.445)#98 | 3.25%(-2.43)#99 |
Common Questions
What are the Top 10 Cities with the Highest Percentage of Immigrants from Mexico in Ohio?
Top 10 Cities with the Highest Percentage of Immigrants from Mexico in Ohio are:
#1
29.79%
#2
14.46%
#3
13.89%
#4
12.59%
#5
11.95%
#6
10.39%
#7
9.66%
#8
9.07%
#9
7.06%
#10
6.95%
What city has the Highest Percentage of Immigrants from Mexico in Ohio?
Belmore has the Highest Percentage of Immigrants from Mexico in Ohio with 29.79%.
What is the Percentage of Immigrants from Mexico in the State of Ohio?
Percentage of Immigrants from Mexico in Ohio is 0.38%.
What is the Percentage of Immigrants from Mexico in the United States?
Percentage of Immigrants from Mexico in the United States is 3.25%.