Cities with the Most Immigrants from Central America in Ohio
RELATED REPORTS & OPTIONS
Central America
Ohio
Compare Cities
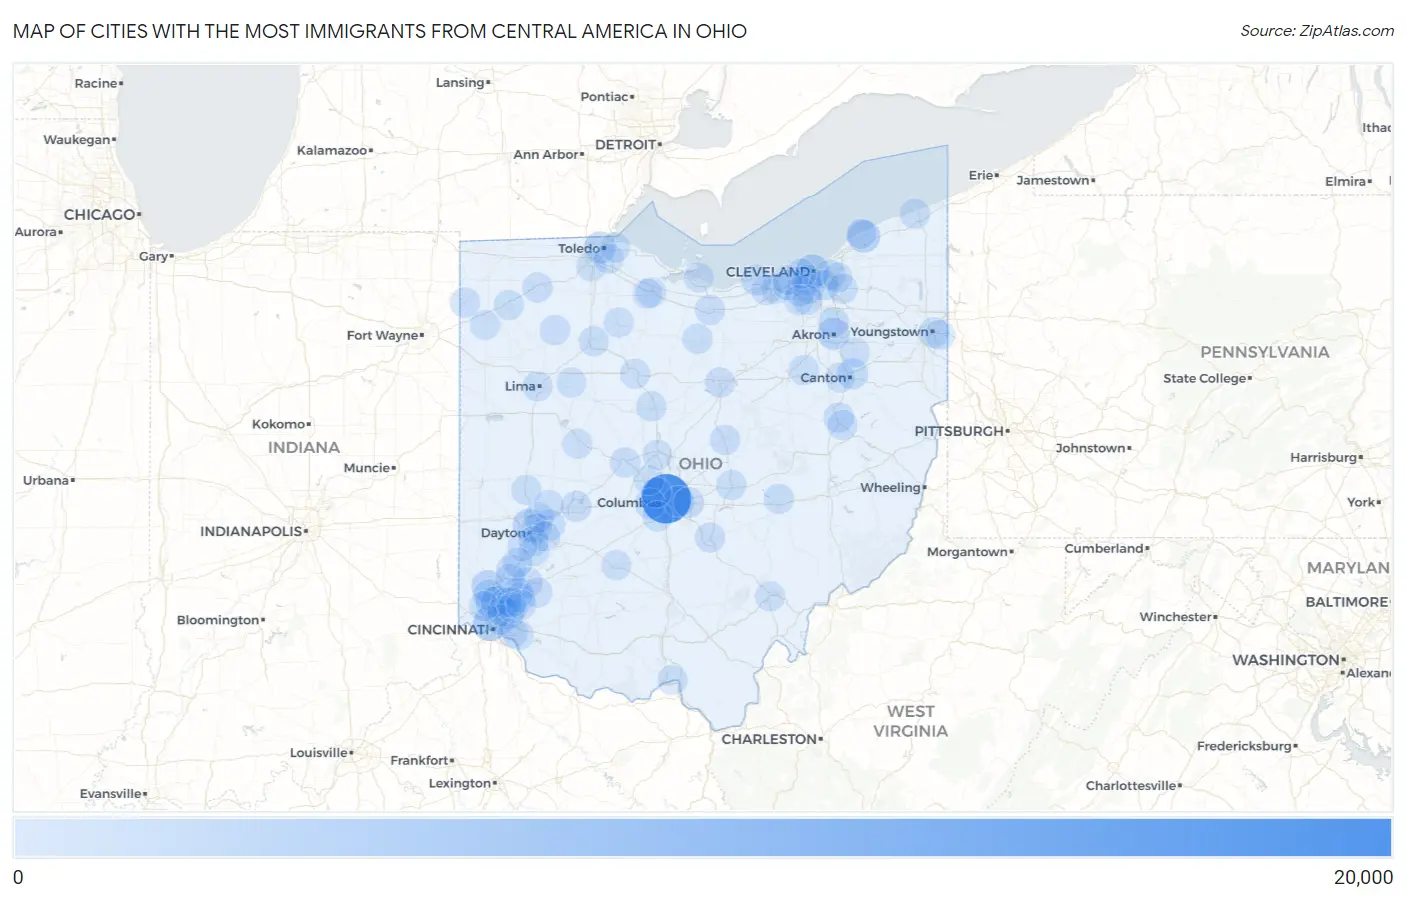
Map of Cities with the Most Immigrants from Central America in Ohio
0
20,000
Cities with the Most Immigrants from Central America in Ohio
| City | Central America | vs State | vs National | |
| 1. | Columbus | 16,795 | 71,910(23.36%)#1 | 14,469,050(0.12%)#104 |
| 2. | Cincinnati | 3,687 | 71,910(5.13%)#2 | 14,469,050(0.03%)#574 |
| 3. | Cleveland | 3,046 | 71,910(4.24%)#3 | 14,469,050(0.02%)#688 |
| 4. | Painesville | 2,167 | 71,910(3.01%)#4 | 14,469,050(0.01%)#898 |
| 5. | Dayton | 1,840 | 71,910(2.56%)#5 | 14,469,050(0.01%)#1,022 |
| 6. | Hamilton | 1,798 | 71,910(2.50%)#6 | 14,469,050(0.01%)#1,038 |
| 7. | Akron | 1,623 | 71,910(2.26%)#7 | 14,469,050(0.01%)#1,116 |
| 8. | Toledo | 1,454 | 71,910(2.02%)#8 | 14,469,050(0.01%)#1,208 |
| 9. | Forest Park | 1,035 | 71,910(1.44%)#9 | 14,469,050(0.01%)#1,538 |
| 10. | Canton | 902 | 71,910(1.25%)#10 | 14,469,050(0.01%)#1,712 |
| 11. | Fairfield | 841 | 71,910(1.17%)#11 | 14,469,050(0.01%)#1,786 |
| 12. | Springdale | 717 | 71,910(1.00%)#12 | 14,469,050(0.00%)#1,980 |
| 13. | Springfield | 688 | 71,910(0.96%)#13 | 14,469,050(0.00%)#2,042 |
| 14. | Whitehall | 670 | 71,910(0.93%)#14 | 14,469,050(0.00%)#2,079 |
| 15. | Lorain | 587 | 71,910(0.82%)#15 | 14,469,050(0.00%)#2,261 |
| 16. | Kenwood | 515 | 71,910(0.72%)#16 | 14,469,050(0.00%)#2,443 |
| 17. | Lincoln Village | 508 | 71,910(0.71%)#17 | 14,469,050(0.00%)#2,462 |
| 18. | Youngstown | 485 | 71,910(0.67%)#18 | 14,469,050(0.00%)#2,545 |
| 19. | Reynoldsburg | 480 | 71,910(0.67%)#19 | 14,469,050(0.00%)#2,560 |
| 20. | Sharonville | 470 | 71,910(0.65%)#20 | 14,469,050(0.00%)#2,595 |
| 21. | Cuyahoga Falls | 445 | 71,910(0.62%)#21 | 14,469,050(0.00%)#2,682 |
| 22. | Middletown | 387 | 71,910(0.54%)#22 | 14,469,050(0.00%)#2,915 |
| 23. | Mason | 356 | 71,910(0.50%)#23 | 14,469,050(0.00%)#3,045 |
| 24. | Dover | 335 | 71,910(0.47%)#24 | 14,469,050(0.00%)#3,160 |
| 25. | Dublin | 311 | 71,910(0.43%)#25 | 14,469,050(0.00%)#3,275 |
| 26. | Fairborn | 311 | 71,910(0.43%)#26 | 14,469,050(0.00%)#3,277 |
| 27. | Ashtabula | 306 | 71,910(0.43%)#27 | 14,469,050(0.00%)#3,307 |
| 28. | Newark | 300 | 71,910(0.42%)#28 | 14,469,050(0.00%)#3,342 |
| 29. | New Philadelphia | 290 | 71,910(0.40%)#29 | 14,469,050(0.00%)#3,407 |
| 30. | Lebanon | 281 | 71,910(0.39%)#30 | 14,469,050(0.00%)#3,469 |
| 31. | Leipsic | 276 | 71,910(0.38%)#31 | 14,469,050(0.00%)#3,510 |
| 32. | Parma | 273 | 71,910(0.38%)#32 | 14,469,050(0.00%)#3,532 |
| 33. | Norwalk | 272 | 71,910(0.38%)#33 | 14,469,050(0.00%)#3,540 |
| 34. | North Ridgeville | 270 | 71,910(0.38%)#34 | 14,469,050(0.00%)#3,553 |
| 35. | Elyria | 263 | 71,910(0.37%)#35 | 14,469,050(0.00%)#3,612 |
| 36. | Norwood | 262 | 71,910(0.36%)#36 | 14,469,050(0.00%)#3,620 |
| 37. | Upper Arlington | 244 | 71,910(0.34%)#37 | 14,469,050(0.00%)#3,751 |
| 38. | Findlay | 231 | 71,910(0.32%)#38 | 14,469,050(0.00%)#3,849 |
| 39. | Marysville | 230 | 71,910(0.32%)#39 | 14,469,050(0.00%)#3,857 |
| 40. | North Olmsted | 227 | 71,910(0.32%)#40 | 14,469,050(0.00%)#3,876 |
| 41. | Reading | 226 | 71,910(0.31%)#41 | 14,469,050(0.00%)#3,883 |
| 42. | Hicksville | 220 | 71,910(0.31%)#42 | 14,469,050(0.00%)#3,934 |
| 43. | Shaker Heights | 219 | 71,910(0.30%)#43 | 14,469,050(0.00%)#3,937 |
| 44. | Brooklyn | 215 | 71,910(0.30%)#44 | 14,469,050(0.00%)#3,968 |
| 45. | Grove City | 212 | 71,910(0.29%)#45 | 14,469,050(0.00%)#3,987 |
| 46. | Orrville | 211 | 71,910(0.29%)#46 | 14,469,050(0.00%)#4,010 |
| 47. | Napoleon | 207 | 71,910(0.29%)#47 | 14,469,050(0.00%)#4,047 |
| 48. | Willard | 206 | 71,910(0.29%)#48 | 14,469,050(0.00%)#4,062 |
| 49. | Marion | 202 | 71,910(0.28%)#49 | 14,469,050(0.00%)#4,099 |
| 50. | Middleburg Heights | 200 | 71,910(0.28%)#50 | 14,469,050(0.00%)#4,124 |
| 51. | Riverside | 194 | 71,910(0.27%)#51 | 14,469,050(0.00%)#4,202 |
| 52. | Landen | 191 | 71,910(0.27%)#52 | 14,469,050(0.00%)#4,248 |
| 53. | Garfield Heights | 190 | 71,910(0.26%)#53 | 14,469,050(0.00%)#4,255 |
| 54. | Lancaster | 183 | 71,910(0.25%)#54 | 14,469,050(0.00%)#4,342 |
| 55. | North Zanesville | 183 | 71,910(0.25%)#55 | 14,469,050(0.00%)#4,351 |
| 56. | Troy | 180 | 71,910(0.25%)#56 | 14,469,050(0.00%)#4,379 |
| 57. | North Royalton | 178 | 71,910(0.25%)#57 | 14,469,050(0.00%)#4,413 |
| 58. | Lakewood | 176 | 71,910(0.24%)#58 | 14,469,050(0.00%)#4,451 |
| 59. | Solon | 175 | 71,910(0.24%)#59 | 14,469,050(0.00%)#4,468 |
| 60. | Mansfield | 171 | 71,910(0.24%)#60 | 14,469,050(0.00%)#4,515 |
| 61. | Lima | 169 | 71,910(0.24%)#61 | 14,469,050(0.00%)#4,545 |
| 62. | Defiance | 169 | 71,910(0.24%)#62 | 14,469,050(0.00%)#4,547 |
| 63. | Northgate | 162 | 71,910(0.23%)#63 | 14,469,050(0.00%)#4,650 |
| 64. | Mount Vernon | 153 | 71,910(0.21%)#64 | 14,469,050(0.00%)#4,771 |
| 65. | Centerville | 146 | 71,910(0.20%)#65 | 14,469,050(0.00%)#4,872 |
| 66. | Portsmouth | 146 | 71,910(0.20%)#66 | 14,469,050(0.00%)#4,873 |
| 67. | Huber Heights | 144 | 71,910(0.20%)#67 | 14,469,050(0.00%)#4,892 |
| 68. | Westlake | 140 | 71,910(0.19%)#68 | 14,469,050(0.00%)#4,946 |
| 69. | Forestville | 140 | 71,910(0.19%)#69 | 14,469,050(0.00%)#4,952 |
| 70. | Fostoria | 138 | 71,910(0.19%)#70 | 14,469,050(0.00%)#4,987 |
| 71. | Perrysburg | 137 | 71,910(0.19%)#71 | 14,469,050(0.00%)#4,999 |
| 72. | Fremont | 137 | 71,910(0.19%)#72 | 14,469,050(0.00%)#5,001 |
| 73. | Fairport Harbor | 130 | 71,910(0.18%)#73 | 14,469,050(0.00%)#5,103 |
| 74. | Paulding | 128 | 71,910(0.18%)#74 | 14,469,050(0.00%)#5,136 |
| 75. | Kettering | 123 | 71,910(0.17%)#75 | 14,469,050(0.00%)#5,217 |
| 76. | Bellefontaine | 122 | 71,910(0.17%)#76 | 14,469,050(0.00%)#5,237 |
| 77. | Brecon | 122 | 71,910(0.17%)#77 | 14,469,050(0.00%)#5,253 |
| 78. | Monroe | 121 | 71,910(0.17%)#78 | 14,469,050(0.00%)#5,258 |
| 79. | Beavercreek | 117 | 71,910(0.16%)#79 | 14,469,050(0.00%)#5,344 |
| 80. | West Carrollton | 116 | 71,910(0.16%)#80 | 14,469,050(0.00%)#5,363 |
| 81. | Walbridge | 116 | 71,910(0.16%)#81 | 14,469,050(0.00%)#5,375 |
| 82. | Oregon | 114 | 71,910(0.16%)#82 | 14,469,050(0.00%)#5,405 |
| 83. | Morrow | 107 | 71,910(0.15%)#83 | 14,469,050(0.00%)#5,566 |
| 84. | Woodmere | 106 | 71,910(0.15%)#84 | 14,469,050(0.00%)#5,590 |
| 85. | Upper Sandusky | 105 | 71,910(0.15%)#85 | 14,469,050(0.00%)#5,605 |
| 86. | Ada | 103 | 71,910(0.14%)#86 | 14,469,050(0.00%)#5,650 |
| 87. | Hartville | 103 | 71,910(0.14%)#87 | 14,469,050(0.00%)#5,653 |
| 88. | Franklin | 102 | 71,910(0.14%)#88 | 14,469,050(0.00%)#5,670 |
| 89. | Montgomery | 101 | 71,910(0.14%)#89 | 14,469,050(0.00%)#5,701 |
| 90. | Perry Heights | 100 | 71,910(0.14%)#90 | 14,469,050(0.00%)#5,723 |
| 91. | New Carlisle | 100 | 71,910(0.14%)#91 | 14,469,050(0.00%)#5,731 |
| 92. | Stony Prairie | 100 | 71,910(0.14%)#92 | 14,469,050(0.00%)#5,736 |
| 93. | Strongsville | 98 | 71,910(0.14%)#93 | 14,469,050(0.00%)#5,765 |
| 94. | Sandusky | 97 | 71,910(0.13%)#94 | 14,469,050(0.00%)#5,792 |
| 95. | Athens | 97 | 71,910(0.13%)#95 | 14,469,050(0.00%)#5,793 |
| 96. | Washington Court House | 95 | 71,910(0.13%)#96 | 14,469,050(0.00%)#5,838 |
| 97. | Loveland | 95 | 71,910(0.13%)#97 | 14,469,050(0.00%)#5,840 |
| 98. | Withamsville | 94 | 71,910(0.13%)#98 | 14,469,050(0.00%)#5,860 |
| 99. | Delaware | 92 | 71,910(0.13%)#99 | 14,469,050(0.00%)#5,909 |
| 100. | Campbell | 91 | 71,910(0.13%)#100 | 14,469,050(0.00%)#5,949 |
Common Questions
What are the Top 10 Cities with the Most Immigrants from Central America in Ohio?
Top 10 Cities with the Most Immigrants from Central America in Ohio are:
#1
16,795
#2
3,687
#3
3,046
#4
2,167
#5
1,840
#6
1,798
#7
1,623
#8
1,454
#9
1,035
#10
902
What city has the Most Immigrants from Central America in Ohio?
Columbus has the Most Immigrants from Central America in Ohio with 16,795.
What is the Total Immigrants from Central America in the State of Ohio?
Total Immigrants from Central America in Ohio is 71,910.
What is the Total Immigrants from Central America in the United States?
Total Immigrants from Central America in the United States is 14,469,050.