Evendale, OH Map & Demographics
Evendale Map
Evendale Overview
$68,371
PER CAPITA INCOME
$168,750
AVG FAMILY INCOME
$158,618
AVG HOUSEHOLD INCOME
49.1%
WAGE / INCOME GAP [ % ]
50.9¢/ $1
WAGE / INCOME GAP [ $ ]
0.39
INEQUALITY / GINI INDEX
2,663
TOTAL POPULATION
1,315
MALE POPULATION
1,348
FEMALE POPULATION
97.55
MALES / 100 FEMALES
102.51
FEMALES / 100 MALES
47.4
MEDIAN AGE
3.0
AVG FAMILY SIZE
2.8
AVG HOUSEHOLD SIZE
1,197
LABOR FORCE [ PEOPLE ]
56.0%
PERCENT IN LABOR FORCE
2.2%
UNEMPLOYMENT RATE
Income in Evendale
Income Overview in Evendale
Per Capita Income in Evendale is $68,371, while median incomes of families and households are $168,750 and $158,618 respectively.
| Characteristic | Number | Measure |
| Per Capita Income | 2,663 | $68,371 |
| Median Family Income | 822 | $168,750 |
| Mean Family Income | 822 | $207,707 |
| Median Household Income | 947 | $158,618 |
| Mean Household Income | 947 | $195,262 |
| Income Deficit | 822 | $0 |
| Wage / Income Gap (%) | 2,663 | 49.08% |
| Wage / Income Gap ($) | 2,663 | 50.92¢ per $1 |
| Gini / Inequality Index | 2,663 | 0.39 |
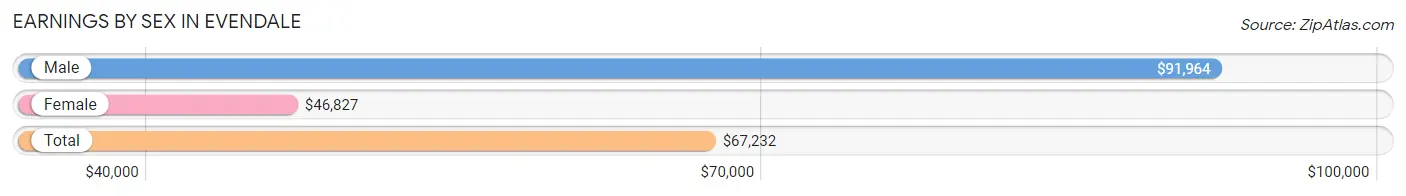
Earnings by Sex in Evendale
Average Earnings in Evendale are $67,232, $91,964 for men and $46,827 for women, a difference of 49.1%.
| Sex | Number | Average Earnings |
| Male | 728 (51.0%) | $91,964 |
| Female | 698 (48.9%) | $46,827 |
| Total | 1,426 (100.0%) | $67,232 |
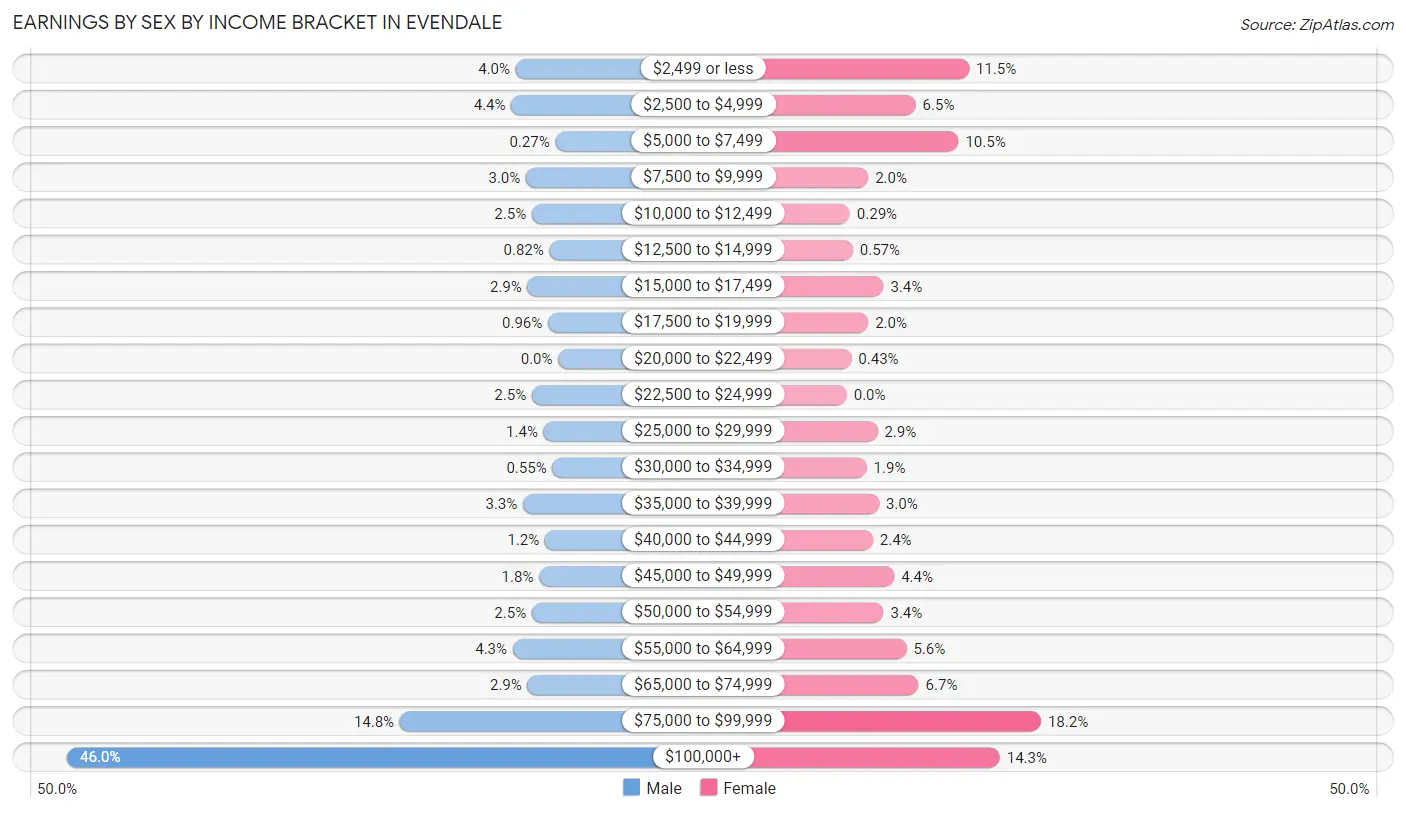
Earnings by Sex by Income Bracket in Evendale
The most common earnings brackets in Evendale are $100,000+ for men (335 | 46.0%) and $75,000 to $99,999 for women (127 | 18.2%).
| Income | Male | Female |
| $2,499 or less | 29 (4.0%) | 80 (11.5%) |
| $2,500 to $4,999 | 32 (4.4%) | 45 (6.5%) |
| $5,000 to $7,499 | 2 (0.3%) | 73 (10.5%) |
| $7,500 to $9,999 | 22 (3.0%) | 14 (2.0%) |
| $10,000 to $12,499 | 18 (2.5%) | 2 (0.3%) |
| $12,500 to $14,999 | 6 (0.8%) | 4 (0.6%) |
| $15,000 to $17,499 | 21 (2.9%) | 24 (3.4%) |
| $17,500 to $19,999 | 7 (1.0%) | 14 (2.0%) |
| $20,000 to $22,499 | 0 (0.0%) | 3 (0.4%) |
| $22,500 to $24,999 | 18 (2.5%) | 0 (0.0%) |
| $25,000 to $29,999 | 10 (1.4%) | 20 (2.9%) |
| $30,000 to $34,999 | 4 (0.5%) | 13 (1.9%) |
| $35,000 to $39,999 | 24 (3.3%) | 21 (3.0%) |
| $40,000 to $44,999 | 9 (1.2%) | 17 (2.4%) |
| $45,000 to $49,999 | 13 (1.8%) | 31 (4.4%) |
| $50,000 to $54,999 | 18 (2.5%) | 24 (3.4%) |
| $55,000 to $64,999 | 31 (4.3%) | 39 (5.6%) |
| $65,000 to $74,999 | 21 (2.9%) | 47 (6.7%) |
| $75,000 to $99,999 | 108 (14.8%) | 127 (18.2%) |
| $100,000+ | 335 (46.0%) | 100 (14.3%) |
| Total | 728 (100.0%) | 698 (100.0%) |
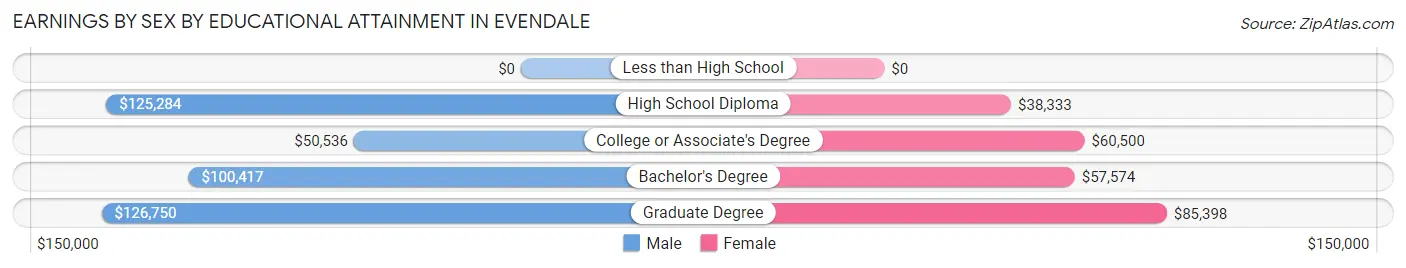
Earnings by Sex by Educational Attainment in Evendale
Average earnings in Evendale are $104,375 for men and $66,094 for women, a difference of 36.7%. Men with an educational attainment of graduate degree enjoy the highest average annual earnings of $126,750, while those with college or associate's degree education earn the least with $50,536. Women with an educational attainment of graduate degree earn the most with the average annual earnings of $85,398, while those with high school diploma education have the smallest earnings of $38,333.
| Educational Attainment | Male Income | Female Income |
| Less than High School | - | - |
| High School Diploma | $125,284 | $38,333 |
| College or Associate's Degree | $50,536 | $60,500 |
| Bachelor's Degree | $100,417 | $57,574 |
| Graduate Degree | $126,750 | $85,398 |
| Total | $104,375 | $66,094 |
Family Income in Evendale
Family Income Brackets in Evendale
According to the Evendale family income data, there are 276 families falling into the $200,000+ income range, which is the most common income bracket and makes up 33.6% of all families.
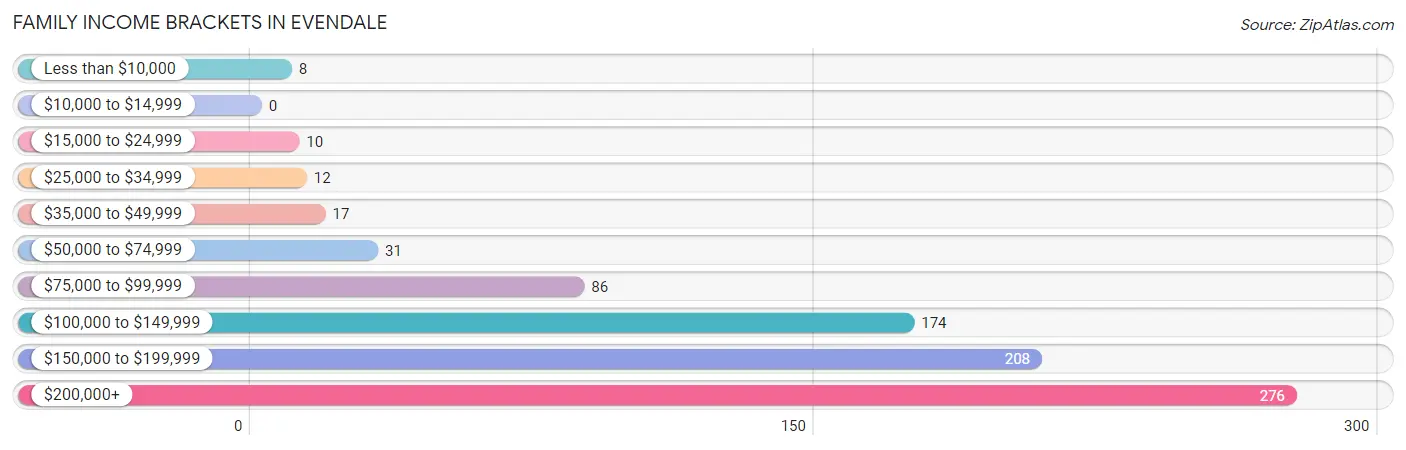
| Income Bracket | # Families | % Families |
| Less than $10,000 | 8 | 1.0% |
| $10,000 to $14,999 | 0 | 0.0% |
| $15,000 to $24,999 | 10 | 1.2% |
| $25,000 to $34,999 | 12 | 1.5% |
| $35,000 to $49,999 | 17 | 2.1% |
| $50,000 to $74,999 | 31 | 3.8% |
| $75,000 to $99,999 | 86 | 10.5% |
| $100,000 to $149,999 | 174 | 21.2% |
| $150,000 to $199,999 | 208 | 25.3% |
| $200,000+ | 276 | 33.6% |
Family Income by Famaliy Size in Evendale
6-person families (49 | 6.0%) account for the highest median family income in Evendale with $216,458 per family, while 2-person families (412 | 50.1%) have the highest median income of $72,174 per family member.
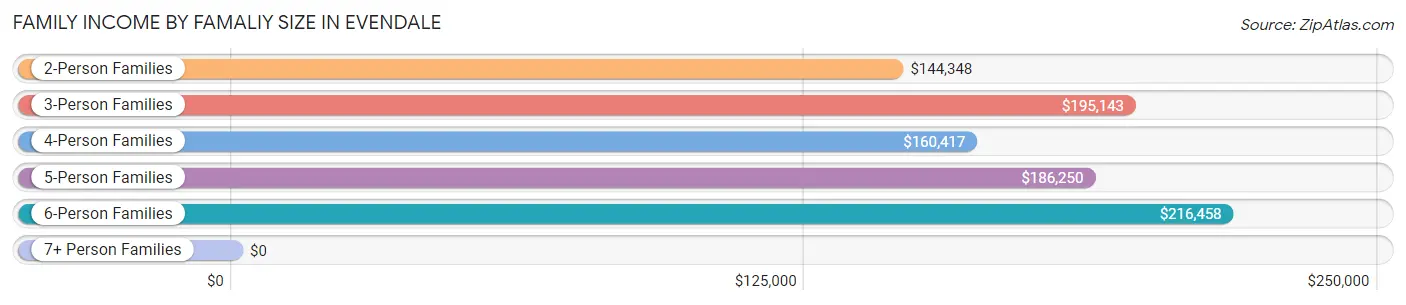
| Income Bracket | # Families | Median Income |
| 2-Person Families | 412 (50.1%) | $144,348 |
| 3-Person Families | 190 (23.1%) | $195,143 |
| 4-Person Families | 87 (10.6%) | $160,417 |
| 5-Person Families | 75 (9.1%) | $186,250 |
| 6-Person Families | 49 (6.0%) | $216,458 |
| 7+ Person Families | 9 (1.1%) | $0 |
| Total | 822 (100.0%) | $168,750 |
Family Income by Number of Earners in Evendale
The median family income in Evendale is $168,750, with families comprising 3+ earners (120) having the highest median family income of $206,053, while families with no earners (163) have the lowest median family income of $98,750, accounting for 14.6% and 19.8% of families, respectively.
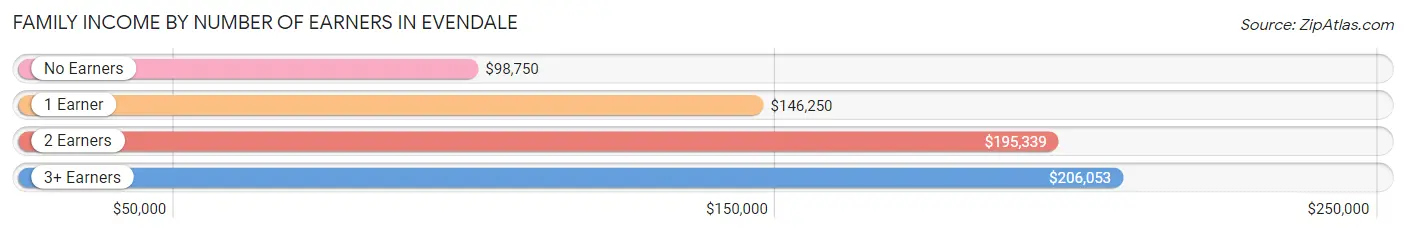
| Number of Earners | # Families | Median Income |
| No Earners | 163 (19.8%) | $98,750 |
| 1 Earner | 156 (19.0%) | $146,250 |
| 2 Earners | 383 (46.6%) | $195,339 |
| 3+ Earners | 120 (14.6%) | $206,053 |
| Total | 822 (100.0%) | $168,750 |
Household Income in Evendale
Household Income Brackets in Evendale
With 292 households falling in the category, the $200,000+ income range is the most frequent in Evendale, accounting for 30.8% of all households.
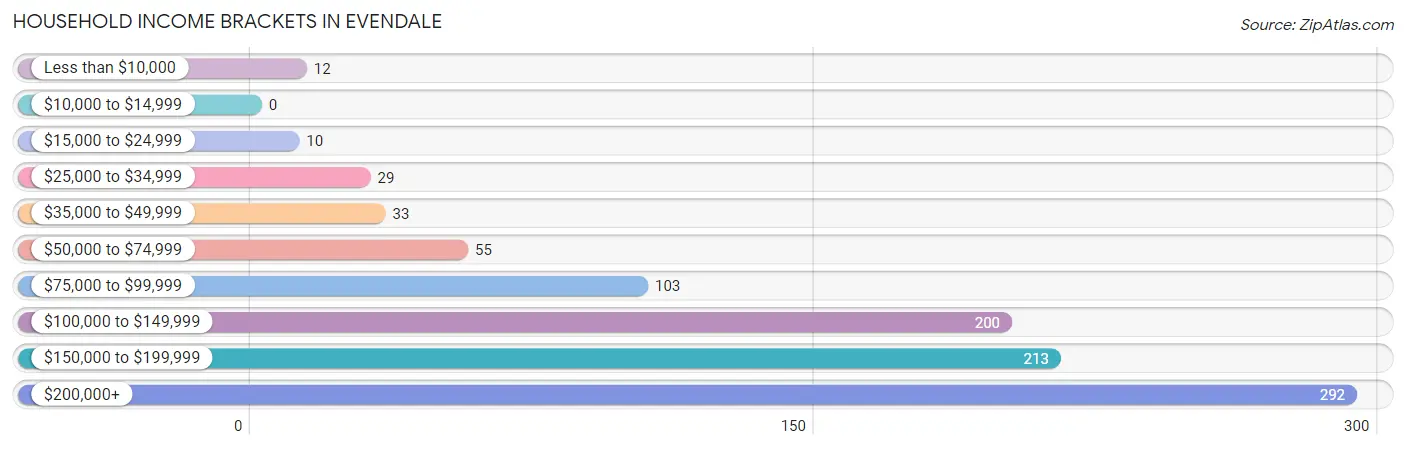
| Income Bracket | # Households | % Households |
| Less than $10,000 | 12 | 1.3% |
| $10,000 to $14,999 | 0 | 0.0% |
| $15,000 to $24,999 | 10 | 1.1% |
| $25,000 to $34,999 | 29 | 3.1% |
| $35,000 to $49,999 | 33 | 3.5% |
| $50,000 to $74,999 | 55 | 5.8% |
| $75,000 to $99,999 | 103 | 10.9% |
| $100,000 to $149,999 | 200 | 21.1% |
| $150,000 to $199,999 | 213 | 22.5% |
| $200,000+ | 292 | 30.8% |
Household Income by Householder Age in Evendale
The median household income in Evendale is $158,618, with the highest median household income of $191,607 found in the 25 to 44 years age bracket for the primary householder. A total of 179 households (18.9%) fall into this category.
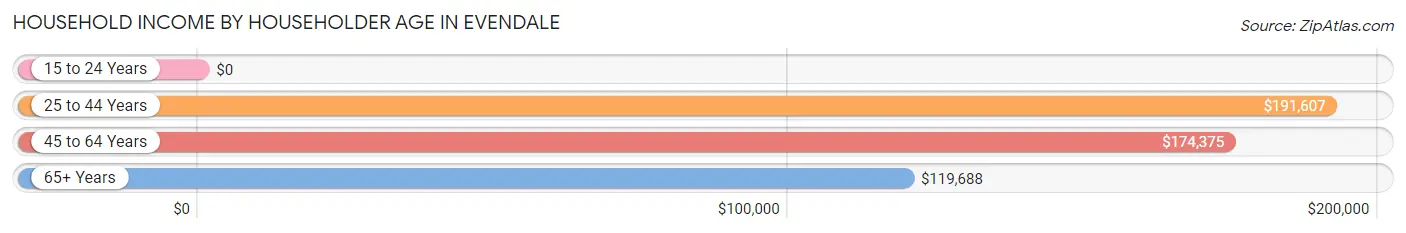
| Income Bracket | # Households | Median Income |
| 15 to 24 Years | 0 (0.0%) | $0 |
| 25 to 44 Years | 179 (18.9%) | $191,607 |
| 45 to 64 Years | 395 (41.7%) | $174,375 |
| 65+ Years | 373 (39.4%) | $119,688 |
| Total | 947 (100.0%) | $158,618 |
Poverty in Evendale
Income Below Poverty by Sex and Age in Evendale
With 1.8% poverty level for males and 3.4% for females among the residents of Evendale, 25 to 34 year old males and under 5 year old females are the most vulnerable to poverty, with 4 males (10.0%) and 13 females (19.1%) in their respective age groups living below the poverty level.
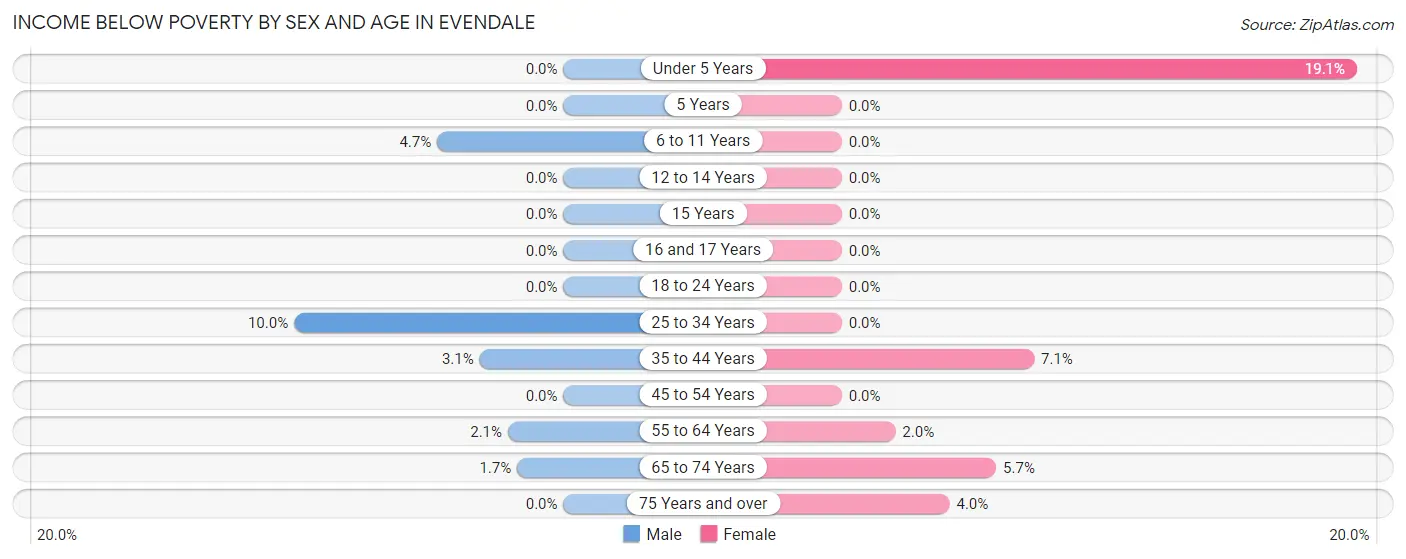
| Age Bracket | Male | Female |
| Under 5 Years | 0 (0.0%) | 13 (19.1%) |
| 5 Years | 0 (0.0%) | 0 (0.0%) |
| 6 to 11 Years | 6 (4.7%) | 0 (0.0%) |
| 12 to 14 Years | 0 (0.0%) | 0 (0.0%) |
| 15 Years | 0 (0.0%) | 0 (0.0%) |
| 16 and 17 Years | 0 (0.0%) | 0 (0.0%) |
| 18 to 24 Years | 0 (0.0%) | 0 (0.0%) |
| 25 to 34 Years | 4 (10.0%) | 0 (0.0%) |
| 35 to 44 Years | 5 (3.1%) | 13 (7.1%) |
| 45 to 54 Years | 0 (0.0%) | 0 (0.0%) |
| 55 to 64 Years | 4 (2.1%) | 5 (2.0%) |
| 65 to 74 Years | 4 (1.7%) | 11 (5.7%) |
| 75 Years and over | 0 (0.0%) | 4 (4.0%) |
| Total | 23 (1.8%) | 46 (3.4%) |
Income Above Poverty by Sex and Age in Evendale
According to the poverty statistics in Evendale, males aged under 5 years and females aged 5 years are the age groups that are most secure financially, with 100.0% of males and 100.0% of females in these age groups living above the poverty line.
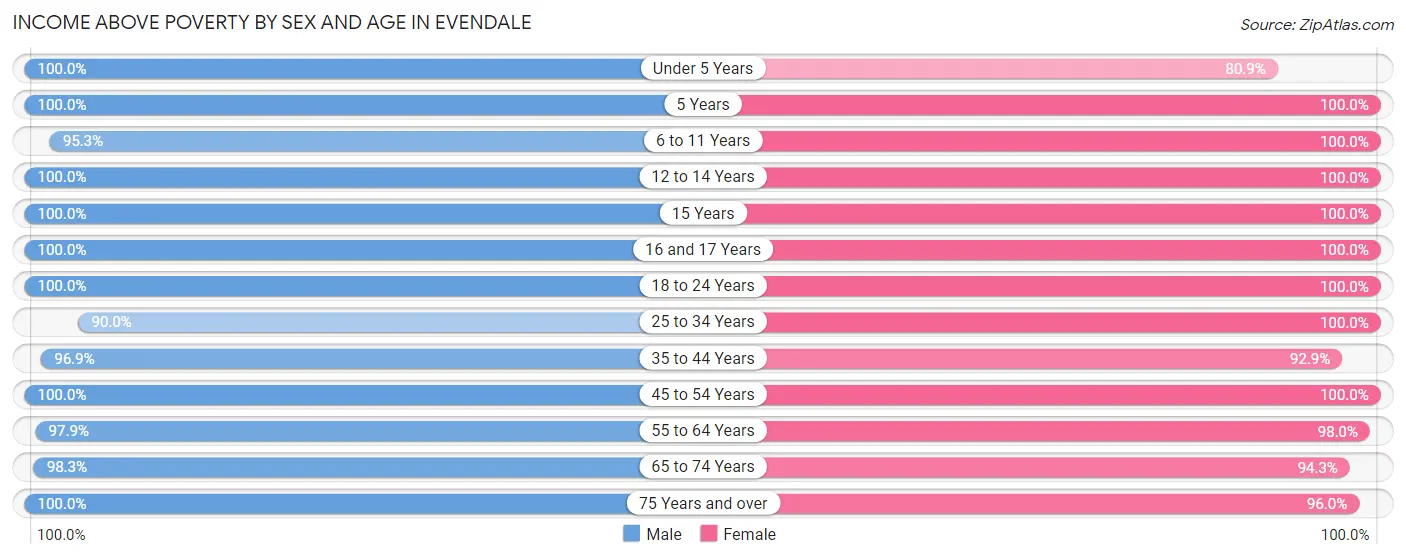
| Age Bracket | Male | Female |
| Under 5 Years | 37 (100.0%) | 55 (80.9%) |
| 5 Years | 50 (100.0%) | 17 (100.0%) |
| 6 to 11 Years | 122 (95.3%) | 75 (100.0%) |
| 12 to 14 Years | 55 (100.0%) | 30 (100.0%) |
| 15 Years | 23 (100.0%) | 35 (100.0%) |
| 16 and 17 Years | 54 (100.0%) | 51 (100.0%) |
| 18 to 24 Years | 35 (100.0%) | 127 (100.0%) |
| 25 to 34 Years | 36 (90.0%) | 44 (100.0%) |
| 35 to 44 Years | 156 (96.9%) | 169 (92.9%) |
| 45 to 54 Years | 184 (100.0%) | 176 (100.0%) |
| 55 to 64 Years | 190 (97.9%) | 246 (98.0%) |
| 65 to 74 Years | 228 (98.3%) | 181 (94.3%) |
| 75 Years and over | 115 (100.0%) | 96 (96.0%) |
| Total | 1,285 (98.2%) | 1,302 (96.6%) |
Income Below Poverty Among Married-Couple Families in Evendale
The poverty statistics for married-couple families in Evendale show that 1.1% or 8 of the total 761 families live below the poverty line. Families with no children have the highest poverty rate of 1.6%, comprising of 8 families. On the other hand, families with 1 or 2 children have the lowest poverty rate of 0.0%, which includes 0 families.
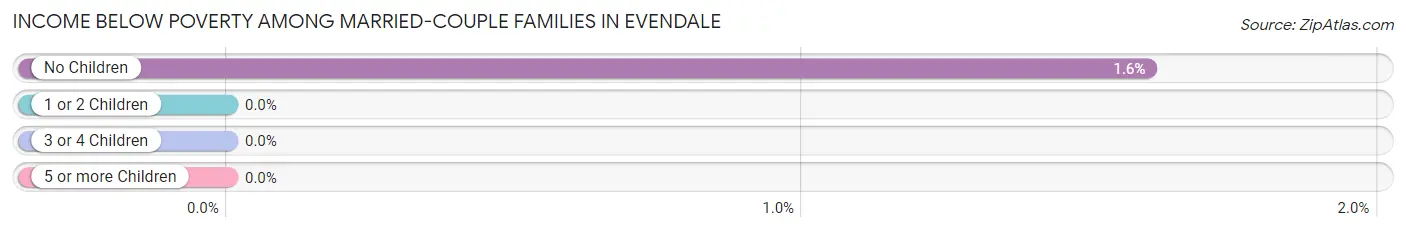
| Children | Above Poverty | Below Poverty |
| No Children | 493 (98.4%) | 8 (1.6%) |
| 1 or 2 Children | 147 (100.0%) | 0 (0.0%) |
| 3 or 4 Children | 104 (100.0%) | 0 (0.0%) |
| 5 or more Children | 9 (100.0%) | 0 (0.0%) |
| Total | 753 (99.0%) | 8 (1.1%) |
Income Below Poverty Among Single-Parent Households in Evendale
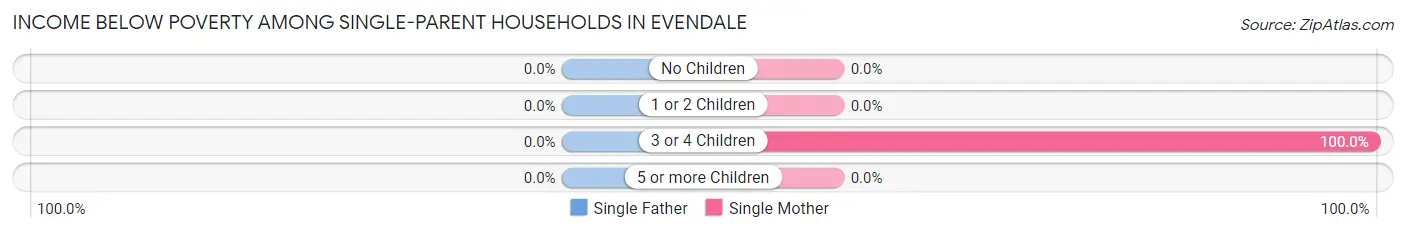
| Children | Single Father | Single Mother |
| No Children | 0 (0.0%) | 0 (0.0%) |
| 1 or 2 Children | 0 (0.0%) | 0 (0.0%) |
| 3 or 4 Children | 0 (0.0%) | 6 (100.0%) |
| 5 or more Children | 0 (0.0%) | 0 (0.0%) |
| Total | 0 (0.0%) | 6 (17.6%) |
Income Below Poverty Among Married-Couple vs Single-Parent Households in Evendale
The poverty data for Evendale shows that 8 of the married-couple family households (1.1%) and 6 of the single-parent households (9.8%) are living below the poverty level. Within the married-couple family households, those with no children have the highest poverty rate, with 8 households (1.6%) falling below the poverty line. Among the single-parent households, those with 3 or 4 children have the highest poverty rate, with 6 household (100.0%) living below poverty.
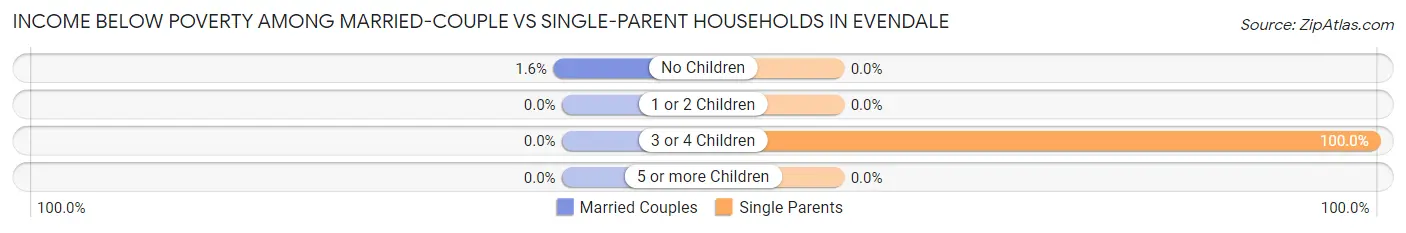
| Children | Married-Couple Families | Single-Parent Households |
| No Children | 8 (1.6%) | 0 (0.0%) |
| 1 or 2 Children | 0 (0.0%) | 0 (0.0%) |
| 3 or 4 Children | 0 (0.0%) | 6 (100.0%) |
| 5 or more Children | 0 (0.0%) | 0 (0.0%) |
| Total | 8 (1.1%) | 6 (9.8%) |
Race in Evendale
The most populous races in Evendale are White / Caucasian (2,172 | 81.6%), Two or more Races (231 | 8.7%), and Asian (132 | 5.0%).
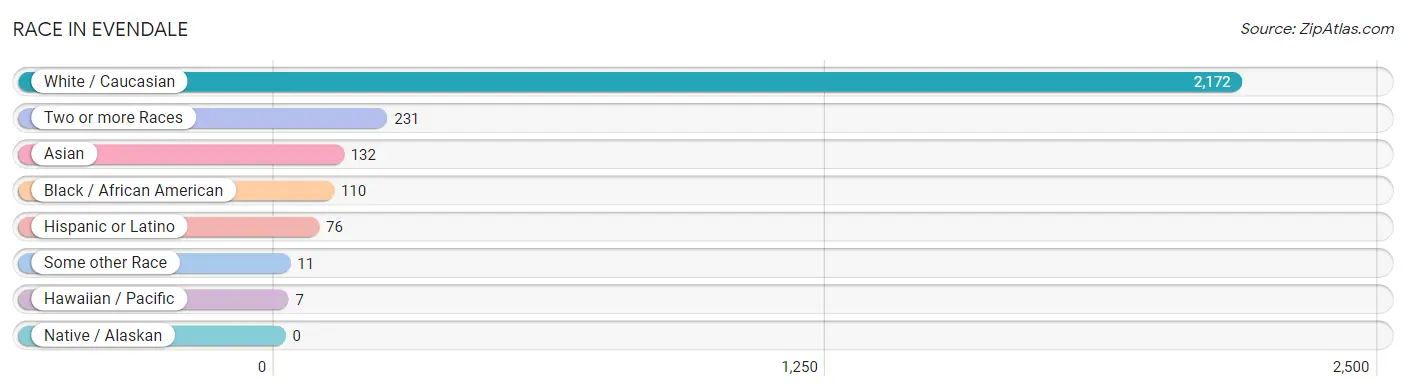
| Race | # Population | % Population |
| Asian | 132 | 5.0% |
| Black / African American | 110 | 4.1% |
| Hawaiian / Pacific | 7 | 0.3% |
| Hispanic or Latino | 76 | 2.9% |
| Native / Alaskan | 0 | 0.0% |
| White / Caucasian | 2,172 | 81.6% |
| Two or more Races | 231 | 8.7% |
| Some other Race | 11 | 0.4% |
| Total | 2,663 | 100.0% |
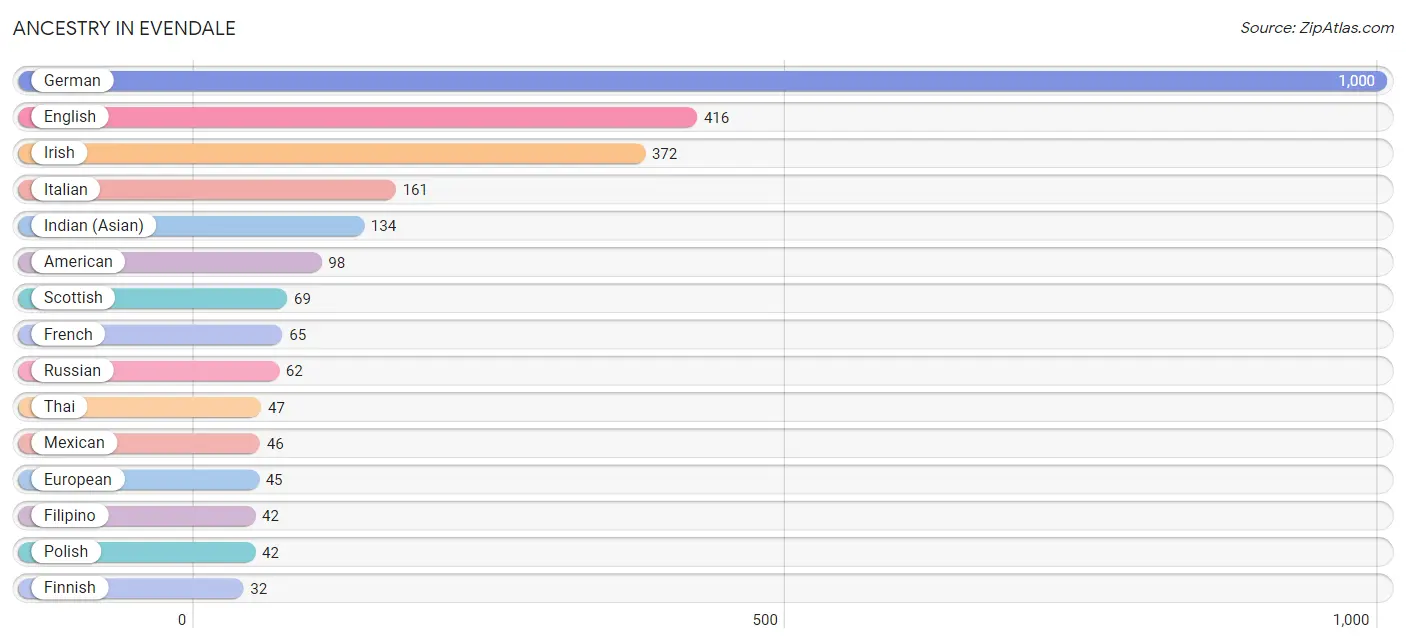
Ancestry in Evendale
The most populous ancestries reported in Evendale are German (1,000 | 37.6%), English (416 | 15.6%), Irish (372 | 14.0%), Italian (161 | 6.0%), and Indian (Asian) (134 | 5.0%), together accounting for 78.2% of all Evendale residents.
| Ancestry | # Population | % Population |
| African | 13 | 0.5% |
| American | 98 | 3.7% |
| Arab | 10 | 0.4% |
| Austrian | 13 | 0.5% |
| British | 5 | 0.2% |
| Canadian | 7 | 0.3% |
| Dutch | 21 | 0.8% |
| Eastern European | 11 | 0.4% |
| English | 416 | 15.6% |
| European | 45 | 1.7% |
| Filipino | 42 | 1.6% |
| Finnish | 32 | 1.2% |
| French | 65 | 2.4% |
| German | 1,000 | 37.6% |
| Greek | 4 | 0.2% |
| Indian (Asian) | 134 | 5.0% |
| Irish | 372 | 14.0% |
| Italian | 161 | 6.0% |
| Korean | 27 | 1.0% |
| Lebanese | 5 | 0.2% |
| Lithuanian | 19 | 0.7% |
| Mexican | 46 | 1.7% |
| Northern European | 5 | 0.2% |
| Norwegian | 4 | 0.2% |
| Palestinian | 5 | 0.2% |
| Pennsylvania German | 3 | 0.1% |
| Polish | 42 | 1.6% |
| Puerto Rican | 7 | 0.3% |
| Russian | 62 | 2.3% |
| Samoan | 7 | 0.3% |
| Scotch-Irish | 9 | 0.3% |
| Scottish | 69 | 2.6% |
| Slavic | 10 | 0.4% |
| Slovak | 3 | 0.1% |
| Spaniard | 15 | 0.6% |
| Spanish | 5 | 0.2% |
| Subsaharan African | 13 | 0.5% |
| Swedish | 20 | 0.7% |
| Swiss | 13 | 0.5% |
| Thai | 47 | 1.8% |
| Welsh | 29 | 1.1% | View All 41 Rows |
Immigrants in Evendale
The most numerous immigrant groups reported in Evendale came from Asia (116 | 4.4%), Europe (69 | 2.6%), India (43 | 1.6%), South Central Asia (43 | 1.6%), and Malaysia (39 | 1.5%), together accounting for 11.6% of all Evendale residents.
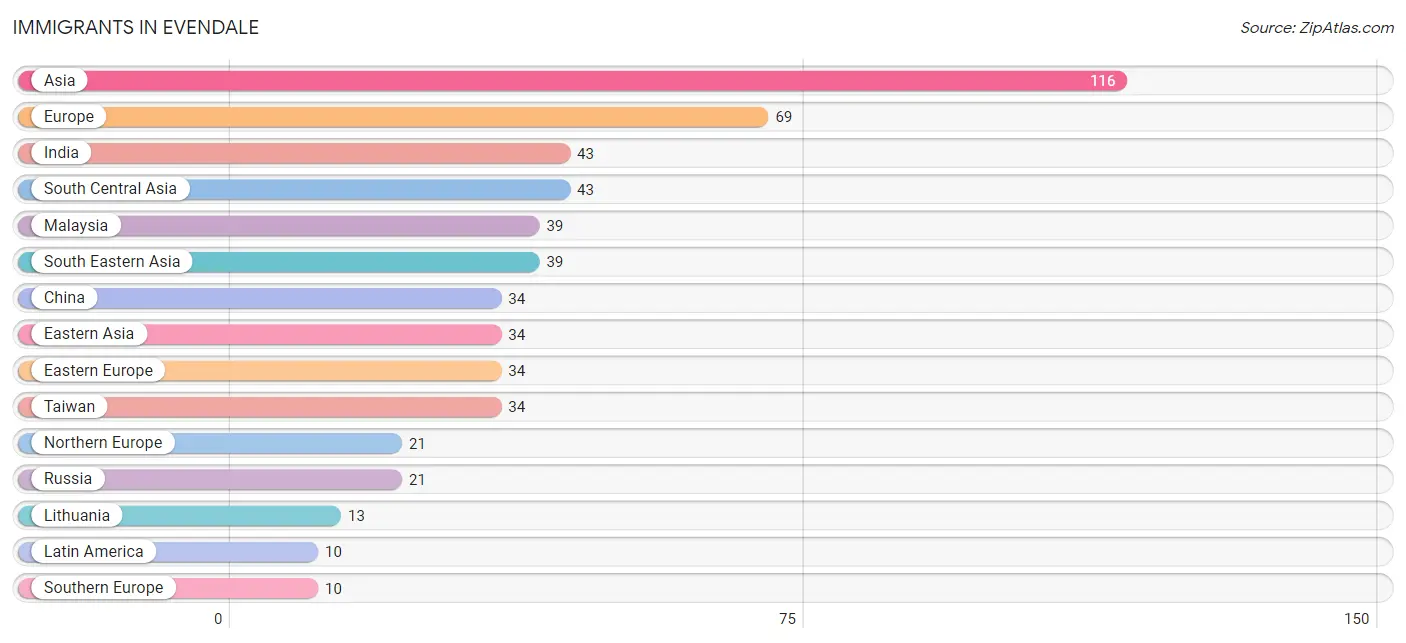
| Immigration Origin | # Population | % Population |
| Africa | 8 | 0.3% |
| Asia | 116 | 4.4% |
| Brazil | 5 | 0.2% |
| Central America | 5 | 0.2% |
| China | 34 | 1.3% |
| Eastern Asia | 34 | 1.3% |
| Eastern Europe | 34 | 1.3% |
| England | 5 | 0.2% |
| Europe | 69 | 2.6% |
| India | 43 | 1.6% |
| Latin America | 10 | 0.4% |
| Lithuania | 13 | 0.5% |
| Malaysia | 39 | 1.5% |
| Mexico | 5 | 0.2% |
| Northern Europe | 21 | 0.8% |
| Russia | 21 | 0.8% |
| South Africa | 8 | 0.3% |
| South America | 5 | 0.2% |
| South Central Asia | 43 | 1.6% |
| South Eastern Asia | 39 | 1.5% |
| Southern Europe | 10 | 0.4% |
| Spain | 10 | 0.4% |
| Switzerland | 4 | 0.2% |
| Taiwan | 34 | 1.3% |
| Western Europe | 4 | 0.2% | View All 25 Rows |
Sex and Age in Evendale
Sex and Age in Evendale
The most populous age groups in Evendale are 65 to 69 Years (153 | 11.6%) for men and 60 to 64 Years (155 | 11.5%) for women.
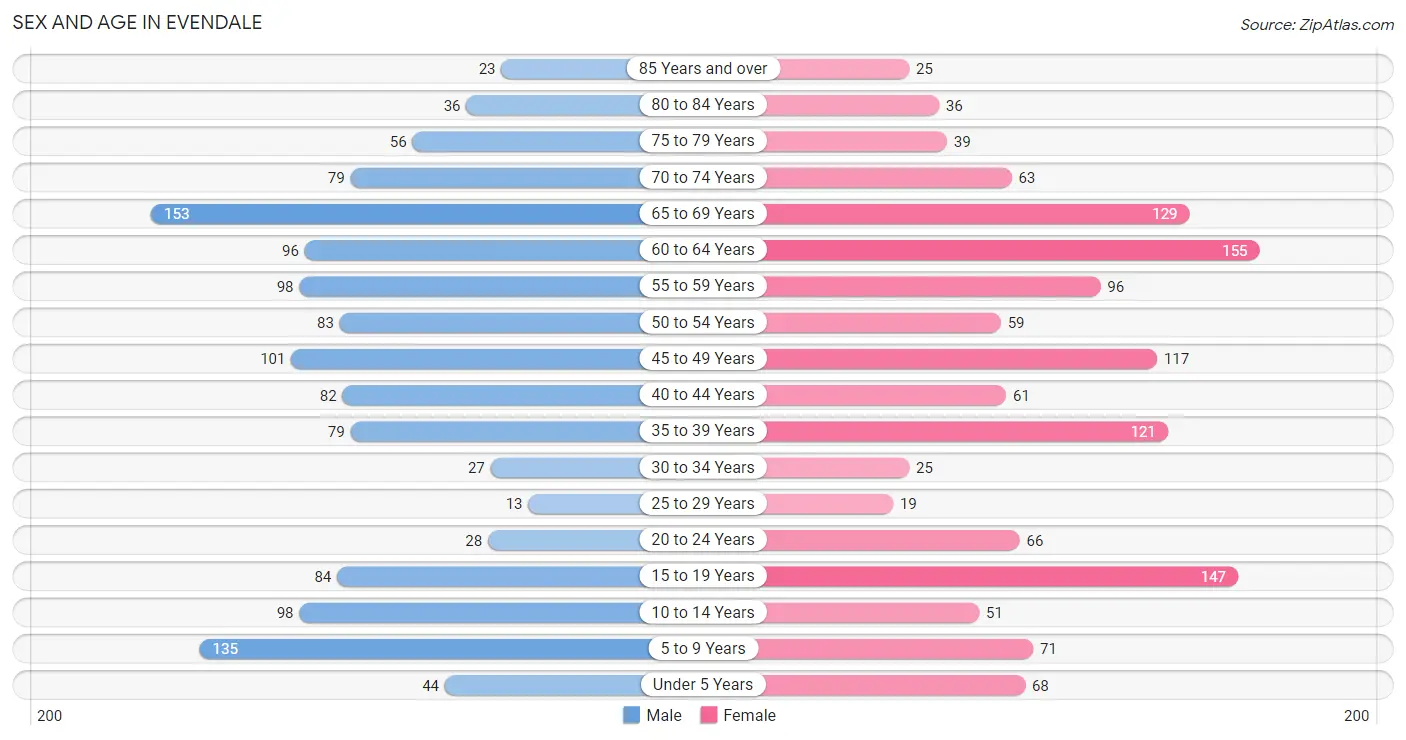
| Age Bracket | Male | Female |
| Under 5 Years | 44 (3.4%) | 68 (5.0%) |
| 5 to 9 Years | 135 (10.3%) | 71 (5.3%) |
| 10 to 14 Years | 98 (7.4%) | 51 (3.8%) |
| 15 to 19 Years | 84 (6.4%) | 147 (10.9%) |
| 20 to 24 Years | 28 (2.1%) | 66 (4.9%) |
| 25 to 29 Years | 13 (1.0%) | 19 (1.4%) |
| 30 to 34 Years | 27 (2.1%) | 25 (1.8%) |
| 35 to 39 Years | 79 (6.0%) | 121 (9.0%) |
| 40 to 44 Years | 82 (6.2%) | 61 (4.5%) |
| 45 to 49 Years | 101 (7.7%) | 117 (8.7%) |
| 50 to 54 Years | 83 (6.3%) | 59 (4.4%) |
| 55 to 59 Years | 98 (7.4%) | 96 (7.1%) |
| 60 to 64 Years | 96 (7.3%) | 155 (11.5%) |
| 65 to 69 Years | 153 (11.6%) | 129 (9.6%) |
| 70 to 74 Years | 79 (6.0%) | 63 (4.7%) |
| 75 to 79 Years | 56 (4.3%) | 39 (2.9%) |
| 80 to 84 Years | 36 (2.7%) | 36 (2.7%) |
| 85 Years and over | 23 (1.8%) | 25 (1.8%) |
| Total | 1,315 (100.0%) | 1,348 (100.0%) |
Families and Households in Evendale
Median Family Size in Evendale
The median family size in Evendale is 3.04 persons per family, with single female/mother families (34 | 4.1%) accounting for the largest median family size of 3.12 persons per family. On the other hand, single male/father families (27 | 3.3%) represent the smallest median family size with 2.70 persons per family.
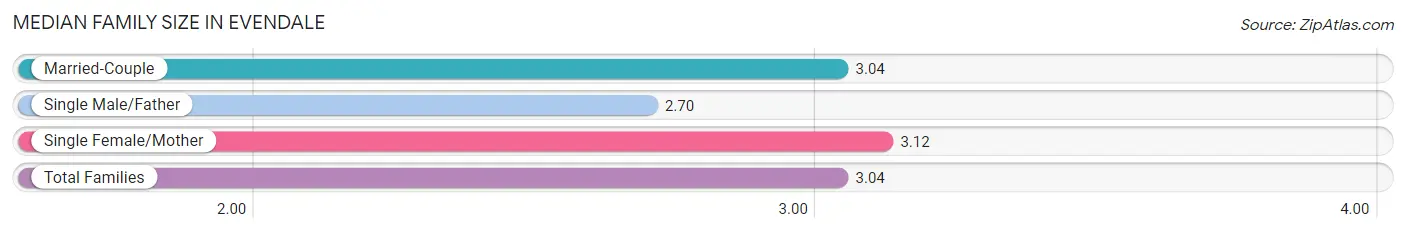
| Family Type | # Families | Family Size |
| Married-Couple | 761 (92.6%) | 3.04 |
| Single Male/Father | 27 (3.3%) | 2.70 |
| Single Female/Mother | 34 (4.1%) | 3.12 |
| Total Families | 822 (100.0%) | 3.04 |
Median Household Size in Evendale
The median household size in Evendale is 2.81 persons per household, with single female/mother households (34 | 3.6%) accounting for the largest median household size of 3.32 persons per household. non-family households (125 | 13.2%) represent the smallest median household size with 1.12 persons per household.
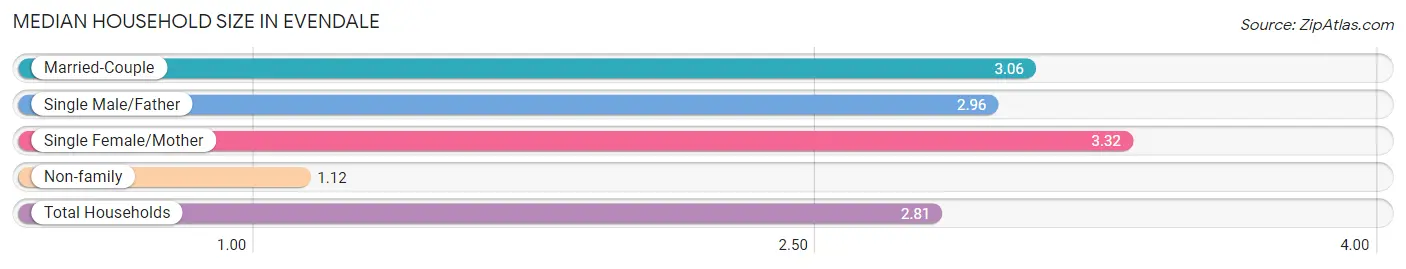
| Household Type | # Households | Household Size |
| Married-Couple | 761 (80.4%) | 3.06 |
| Single Male/Father | 27 (2.9%) | 2.96 |
| Single Female/Mother | 34 (3.6%) | 3.32 |
| Non-family | 125 (13.2%) | 1.12 |
| Total Households | 947 (100.0%) | 2.81 |
Household Size by Marriage Status in Evendale
Out of a total of 947 households in Evendale, 822 (86.8%) are family households, while 125 (13.2%) are nonfamily households. The most numerous type of family households are 2-person households, comprising 408, and the most common type of nonfamily households are 1-person households, comprising 115.
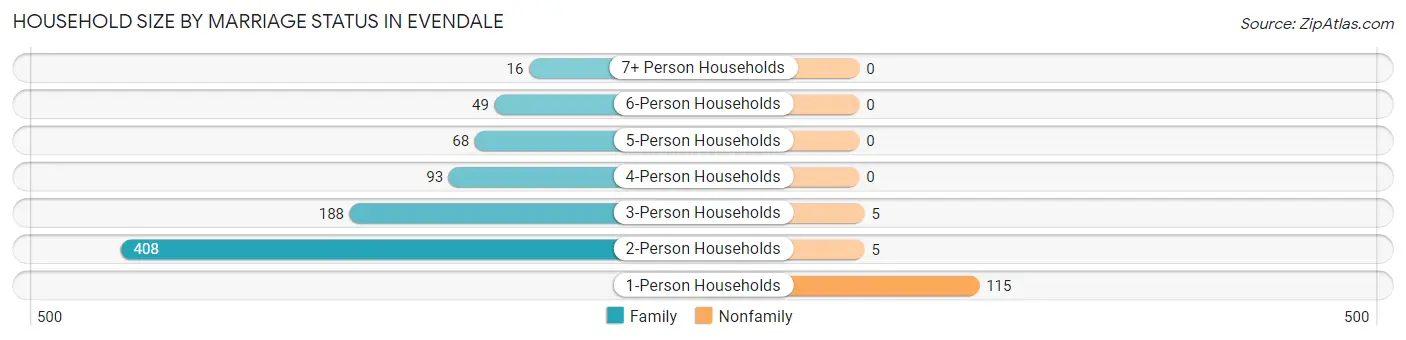
| Household Size | Family Households | Nonfamily Households |
| 1-Person Households | - | 115 (12.1%) |
| 2-Person Households | 408 (43.1%) | 5 (0.5%) |
| 3-Person Households | 188 (19.9%) | 5 (0.5%) |
| 4-Person Households | 93 (9.8%) | 0 (0.0%) |
| 5-Person Households | 68 (7.2%) | 0 (0.0%) |
| 6-Person Households | 49 (5.2%) | 0 (0.0%) |
| 7+ Person Households | 16 (1.7%) | 0 (0.0%) |
| Total | 822 (86.8%) | 125 (13.2%) |
Female Fertility in Evendale
Fertility by Age in Evendale
Average fertility rate in Evendale is 26.0 births per 1,000 women. Women in the age bracket of 35 to 50 years have the highest fertility rate with 47.0 births per 1,000 women. Women in the age bracket of 35 to 50 years acount for 100.0% of all women with births.
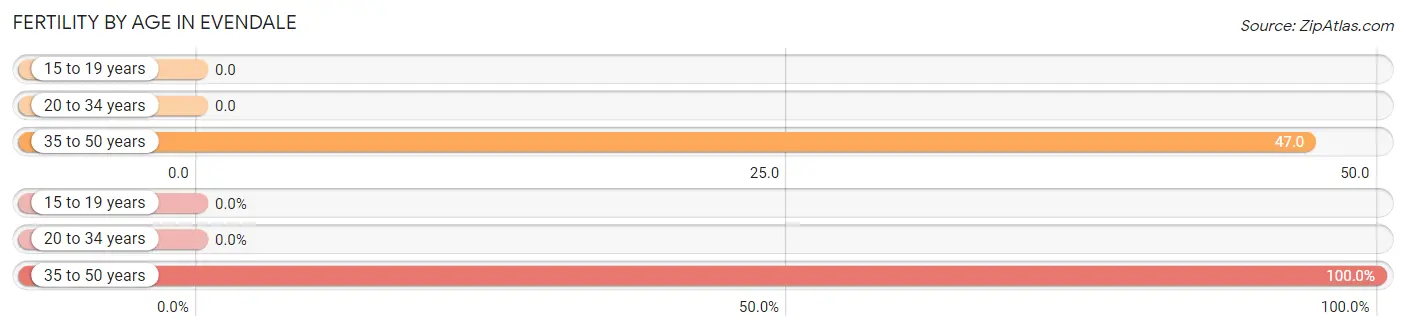
| Age Bracket | Women with Births | Births / 1,000 Women |
| 15 to 19 years | 0 (0.0%) | 0.0 |
| 20 to 34 years | 0 (0.0%) | 0.0 |
| 35 to 50 years | 15 (100.0%) | 47.0 |
| Total | 15 (100.0%) | 26.0 |
Fertility by Age by Marriage Status in Evendale
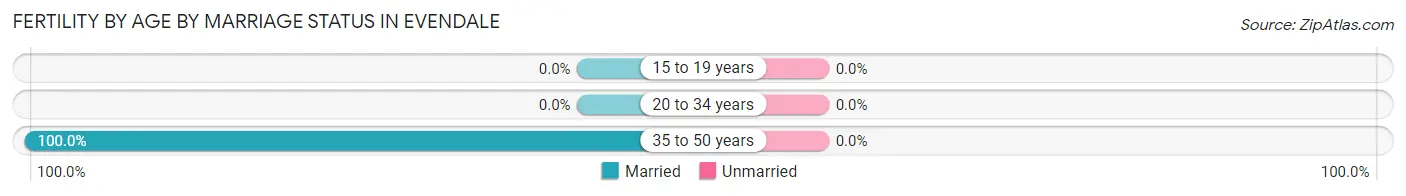
| Age Bracket | Married | Unmarried |
| 15 to 19 years | 0 (0.0%) | 0 (0.0%) |
| 20 to 34 years | 0 (0.0%) | 0 (0.0%) |
| 35 to 50 years | 15 (100.0%) | 0 (0.0%) |
| Total | 15 (100.0%) | 0 (0.0%) |
Fertility by Education in Evendale
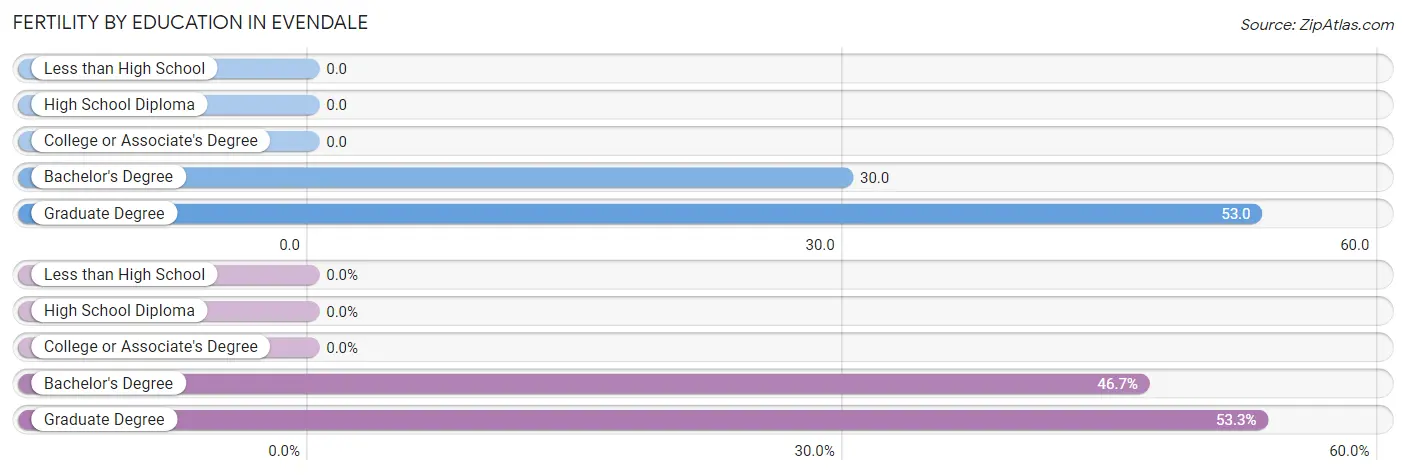
| Educational Attainment | Women with Births | Births / 1,000 Women |
| Less than High School | 0 (0.0%) | 0.0 |
| High School Diploma | 0 (0.0%) | 0.0 |
| College or Associate's Degree | 0 (0.0%) | 0.0 |
| Bachelor's Degree | 7 (46.7%) | 30.0 |
| Graduate Degree | 8 (53.3%) | 53.0 |
| Total | 15 (100.0%) | 26.0 |
Fertility by Education by Marriage Status in Evendale
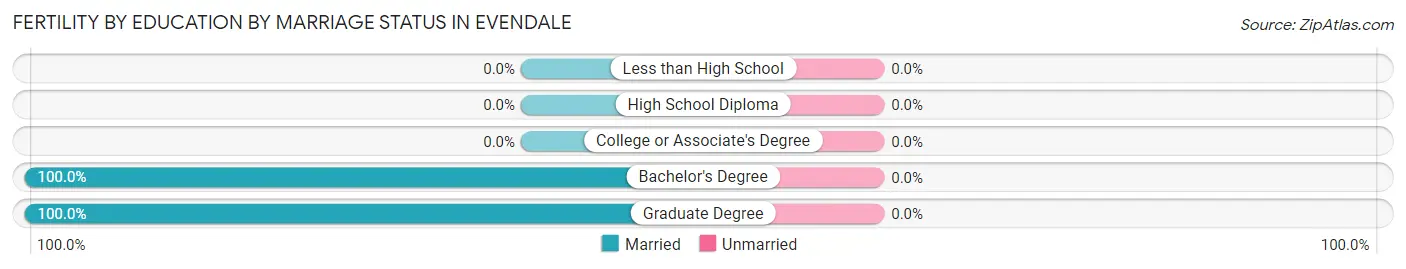
| Educational Attainment | Married | Unmarried |
| Less than High School | 0 (0.0%) | 0 (0.0%) |
| High School Diploma | 0 (0.0%) | 0 (0.0%) |
| College or Associate's Degree | 0 (0.0%) | 0 (0.0%) |
| Bachelor's Degree | 7 (100.0%) | 0 (0.0%) |
| Graduate Degree | 8 (100.0%) | 0 (0.0%) |
| Total | 15 (100.0%) | 0 (0.0%) |
Employment Characteristics in Evendale
Employment by Class of Employer in Evendale
Among the 1,165 employed individuals in Evendale, private company employees (678 | 58.2%), not-for-profit organizations (198 | 17.0%), and local government employees (121 | 10.4%) make up the most common classes of employment.
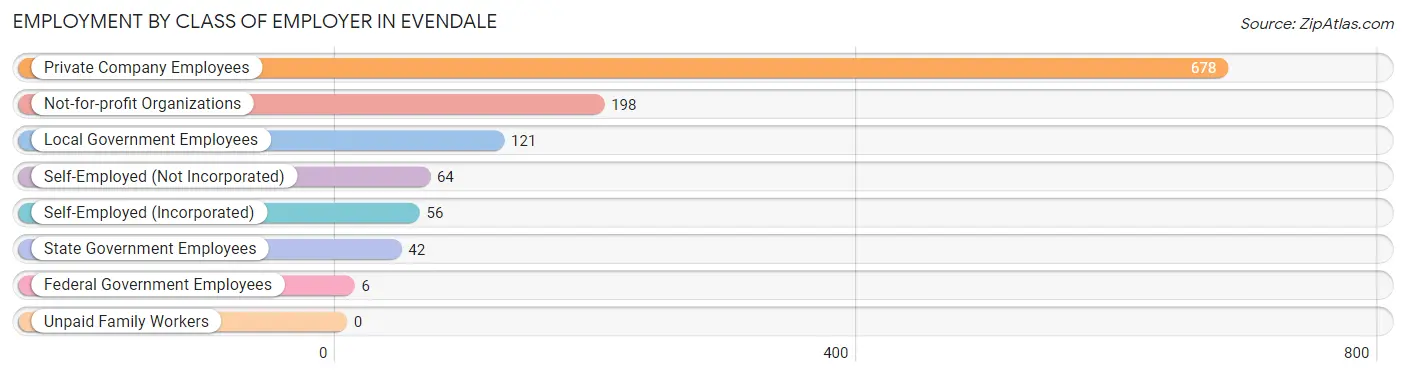
| Employer Class | # Employees | % Employees |
| Private Company Employees | 678 | 58.2% |
| Self-Employed (Incorporated) | 56 | 4.8% |
| Self-Employed (Not Incorporated) | 64 | 5.5% |
| Not-for-profit Organizations | 198 | 17.0% |
| Local Government Employees | 121 | 10.4% |
| State Government Employees | 42 | 3.6% |
| Federal Government Employees | 6 | 0.5% |
| Unpaid Family Workers | 0 | 0.0% |
| Total | 1,165 | 100.0% |
Employment Status by Age in Evendale
According to the labor force statistics for Evendale, out of the total population over 16 years of age (2,138), 56.0% or 1,197 individuals are in the labor force, with 2.2% or 26 of them unemployed. The age group with the highest labor force participation rate is 30 to 34 years, with 100.0% or 52 individuals in the labor force. Within the labor force, the 30 to 34 years age range has the highest percentage of unemployed individuals, with 19.2% or 10 of them being unemployed.
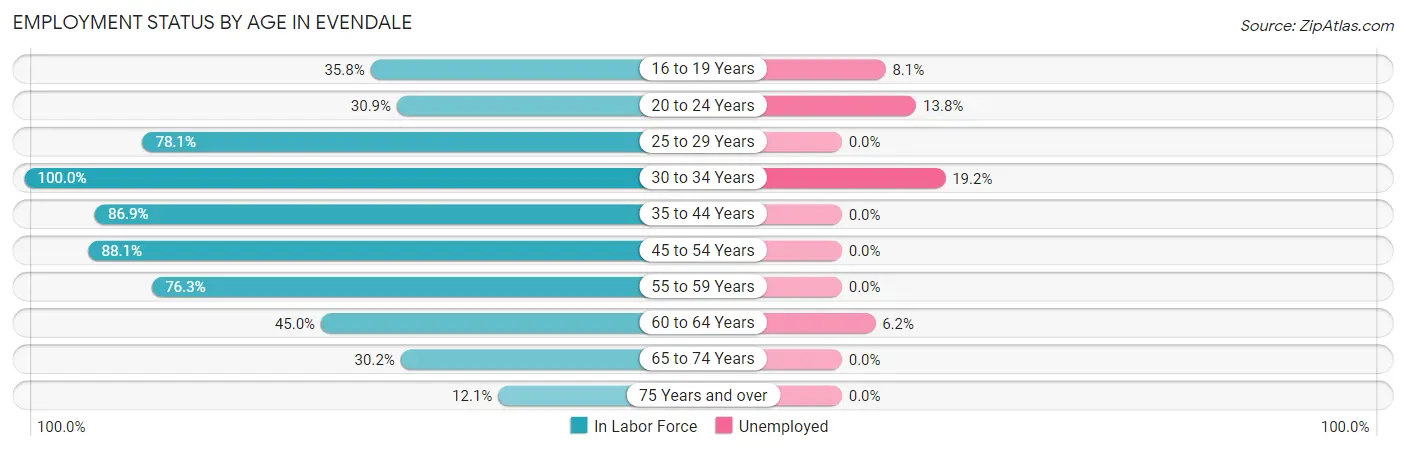
| Age Bracket | In Labor Force | Unemployed |
| 16 to 19 Years | 62 (35.8%) | 5 (8.1%) |
| 20 to 24 Years | 29 (30.9%) | 4 (13.8%) |
| 25 to 29 Years | 25 (78.1%) | 0 (0.0%) |
| 30 to 34 Years | 52 (100.0%) | 10 (19.2%) |
| 35 to 44 Years | 298 (86.9%) | 0 (0.0%) |
| 45 to 54 Years | 317 (88.1%) | 0 (0.0%) |
| 55 to 59 Years | 148 (76.3%) | 0 (0.0%) |
| 60 to 64 Years | 113 (45.0%) | 7 (6.2%) |
| 65 to 74 Years | 128 (30.2%) | 0 (0.0%) |
| 75 Years and over | 26 (12.1%) | 0 (0.0%) |
| Total | 1,197 (56.0%) | 26 (2.2%) |
Employment Status by Educational Attainment in Evendale
According to labor force statistics for Evendale, 77.4% of individuals (954) out of the total population between 25 and 64 years of age (1,232) are in the labor force, with 1.8% or 17 of them being unemployed. The group with the highest labor force participation rate are those with the educational attainment of bachelor's degree or higher, with 80.7% or 712 individuals in the labor force. Within the labor force, individuals with college / associate degree education have the highest percentage of unemployment, with 7.4% or 8 of them being unemployed.
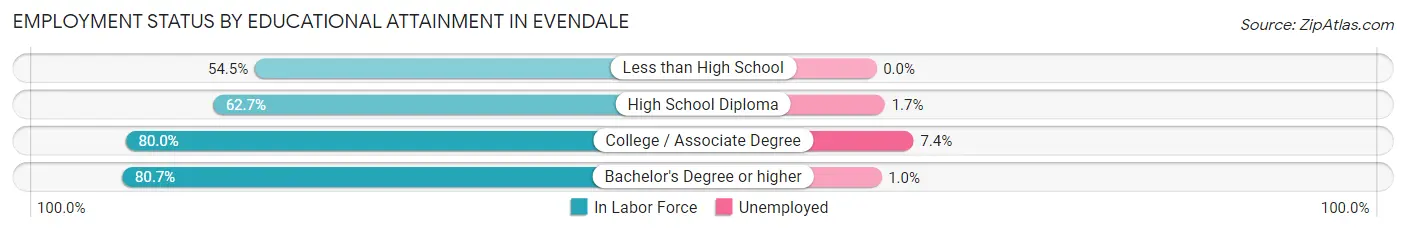
| Educational Attainment | In Labor Force | Unemployed |
| Less than High School | 12 (54.5%) | 0 (0.0%) |
| High School Diploma | 121 (62.7%) | 3 (1.7%) |
| College / Associate Degree | 108 (80.0%) | 10 (7.4%) |
| Bachelor's Degree or higher | 712 (80.7%) | 9 (1.0%) |
| Total | 954 (77.4%) | 22 (1.8%) |
Employment Occupations by Sex in Evendale
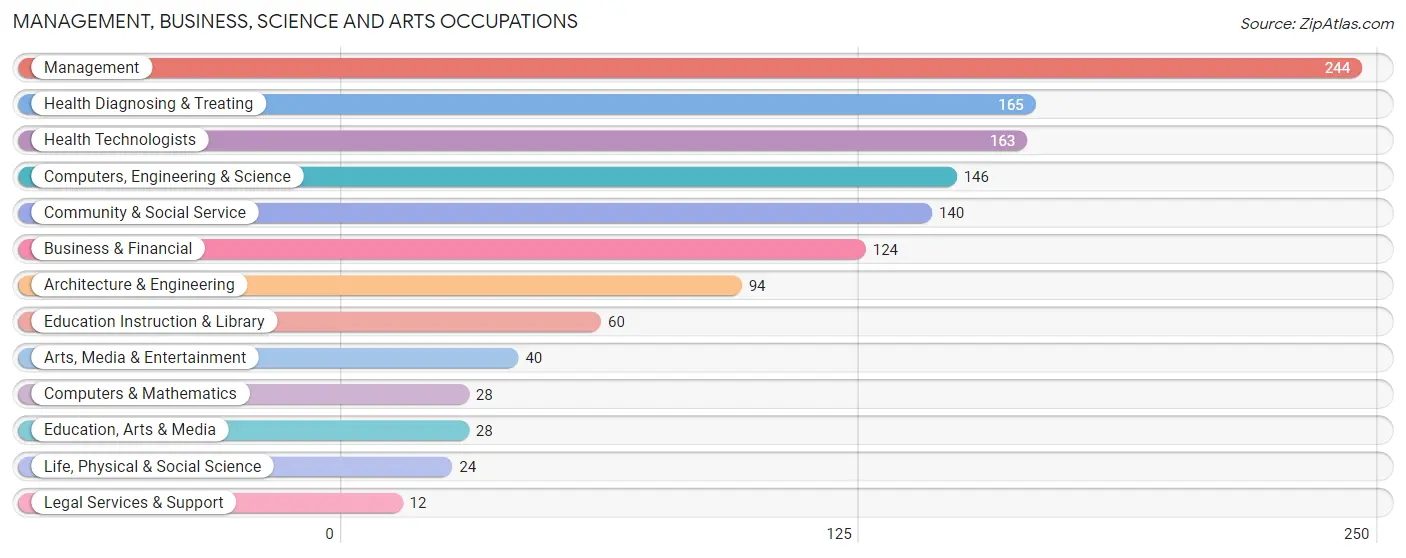
Management, Business, Science and Arts Occupations
The most common Management, Business, Science and Arts occupations in Evendale are Management (244 | 20.8%), Health Diagnosing & Treating (165 | 14.1%), Health Technologists (163 | 13.9%), Computers, Engineering & Science (146 | 12.5%), and Community & Social Service (140 | 11.9%).
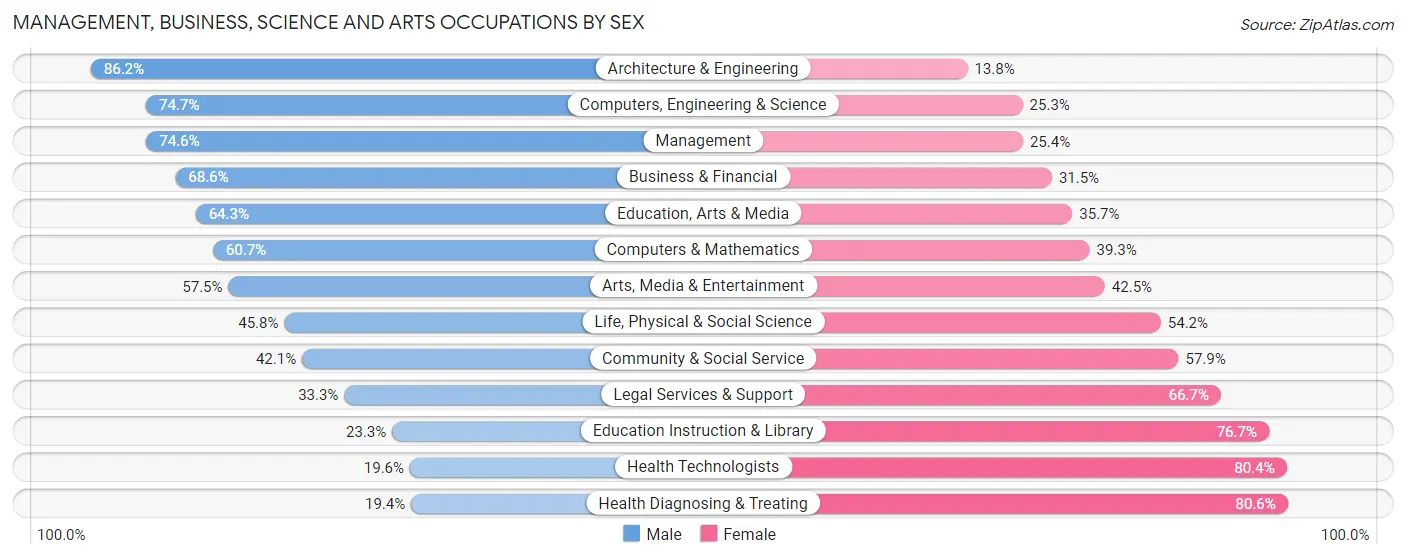
Management, Business, Science and Arts Occupations by Sex
Within the Management, Business, Science and Arts occupations in Evendale, the most male-oriented occupations are Architecture & Engineering (86.2%), Computers, Engineering & Science (74.7%), and Management (74.6%), while the most female-oriented occupations are Health Diagnosing & Treating (80.6%), Health Technologists (80.4%), and Education Instruction & Library (76.7%).
| Occupation | Male | Female |
| Management | 182 (74.6%) | 62 (25.4%) |
| Business & Financial | 85 (68.5%) | 39 (31.5%) |
| Computers, Engineering & Science | 109 (74.7%) | 37 (25.3%) |
| Computers & Mathematics | 17 (60.7%) | 11 (39.3%) |
| Architecture & Engineering | 81 (86.2%) | 13 (13.8%) |
| Life, Physical & Social Science | 11 (45.8%) | 13 (54.2%) |
| Community & Social Service | 59 (42.1%) | 81 (57.9%) |
| Education, Arts & Media | 18 (64.3%) | 10 (35.7%) |
| Legal Services & Support | 4 (33.3%) | 8 (66.7%) |
| Education Instruction & Library | 14 (23.3%) | 46 (76.7%) |
| Arts, Media & Entertainment | 23 (57.5%) | 17 (42.5%) |
| Health Diagnosing & Treating | 32 (19.4%) | 133 (80.6%) |
| Health Technologists | 32 (19.6%) | 131 (80.4%) |
| Total (Category) | 467 (57.0%) | 352 (43.0%) |
| Total (Overall) | 624 (53.2%) | 548 (46.8%) |
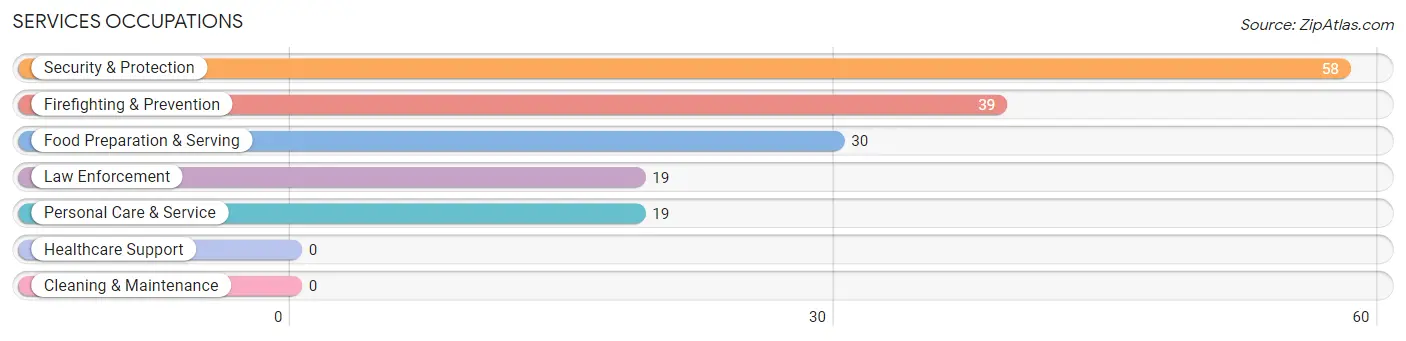
Services Occupations
The most common Services occupations in Evendale are Security & Protection (58 | 5.0%), Firefighting & Prevention (39 | 3.3%), Food Preparation & Serving (30 | 2.6%), Law Enforcement (19 | 1.6%), and Personal Care & Service (19 | 1.6%).
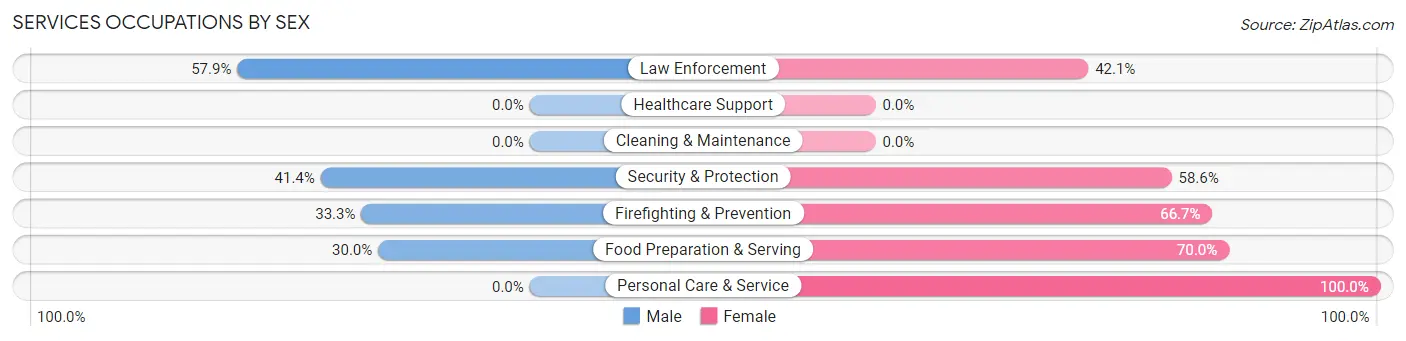
Services Occupations by Sex
Within the Services occupations in Evendale, the most male-oriented occupations are Law Enforcement (57.9%), Security & Protection (41.4%), and Firefighting & Prevention (33.3%), while the most female-oriented occupations are Personal Care & Service (100.0%), Food Preparation & Serving (70.0%), and Firefighting & Prevention (66.7%).
| Occupation | Male | Female |
| Healthcare Support | 0 (0.0%) | 0 (0.0%) |
| Security & Protection | 24 (41.4%) | 34 (58.6%) |
| Firefighting & Prevention | 13 (33.3%) | 26 (66.7%) |
| Law Enforcement | 11 (57.9%) | 8 (42.1%) |
| Food Preparation & Serving | 9 (30.0%) | 21 (70.0%) |
| Cleaning & Maintenance | 0 (0.0%) | 0 (0.0%) |
| Personal Care & Service | 0 (0.0%) | 19 (100.0%) |
| Total (Category) | 33 (30.8%) | 74 (69.2%) |
| Total (Overall) | 624 (53.2%) | 548 (46.8%) |
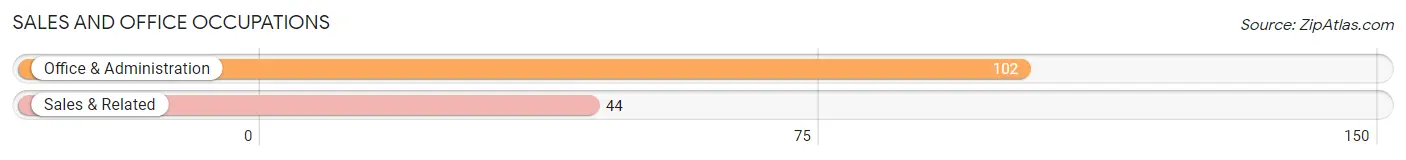
Sales and Office Occupations
The most common Sales and Office occupations in Evendale are Office & Administration (102 | 8.7%), and Sales & Related (44 | 3.7%).
Sales and Office Occupations by Sex
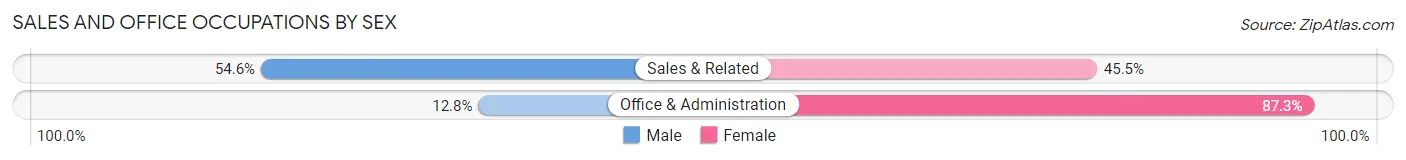
| Occupation | Male | Female |
| Sales & Related | 24 (54.5%) | 20 (45.5%) |
| Office & Administration | 13 (12.8%) | 89 (87.3%) |
| Total (Category) | 37 (25.3%) | 109 (74.7%) |
| Total (Overall) | 624 (53.2%) | 548 (46.8%) |
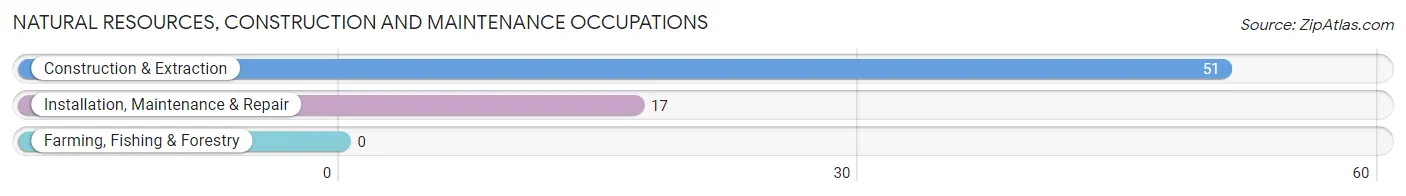
Natural Resources, Construction and Maintenance Occupations
The most common Natural Resources, Construction and Maintenance occupations in Evendale are Construction & Extraction (51 | 4.3%), and Installation, Maintenance & Repair (17 | 1.5%).
Natural Resources, Construction and Maintenance Occupations by Sex
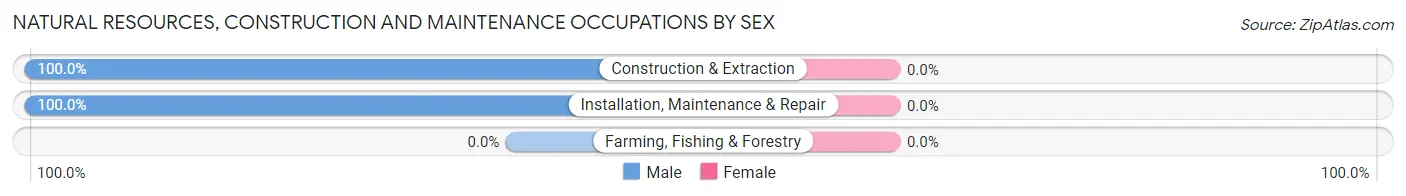
| Occupation | Male | Female |
| Farming, Fishing & Forestry | 0 (0.0%) | 0 (0.0%) |
| Construction & Extraction | 51 (100.0%) | 0 (0.0%) |
| Installation, Maintenance & Repair | 17 (100.0%) | 0 (0.0%) |
| Total (Category) | 68 (100.0%) | 0 (0.0%) |
| Total (Overall) | 624 (53.2%) | 548 (46.8%) |
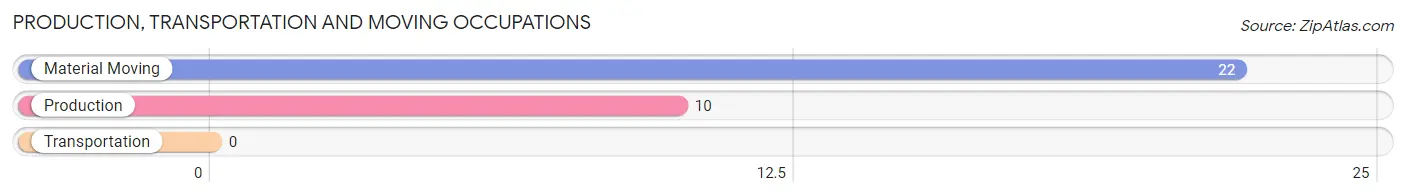
Production, Transportation and Moving Occupations
The most common Production, Transportation and Moving occupations in Evendale are Material Moving (22 | 1.9%), and Production (10 | 0.9%).
Production, Transportation and Moving Occupations by Sex
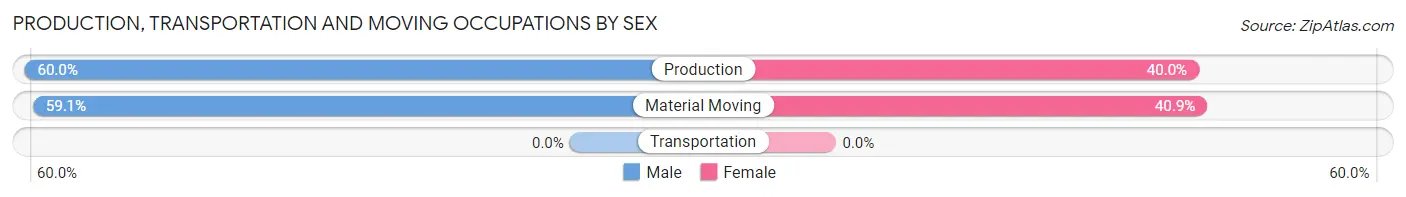
| Occupation | Male | Female |
| Production | 6 (60.0%) | 4 (40.0%) |
| Transportation | 0 (0.0%) | 0 (0.0%) |
| Material Moving | 13 (59.1%) | 9 (40.9%) |
| Total (Category) | 19 (59.4%) | 13 (40.6%) |
| Total (Overall) | 624 (53.2%) | 548 (46.8%) |
Employment Industries by Sex in Evendale
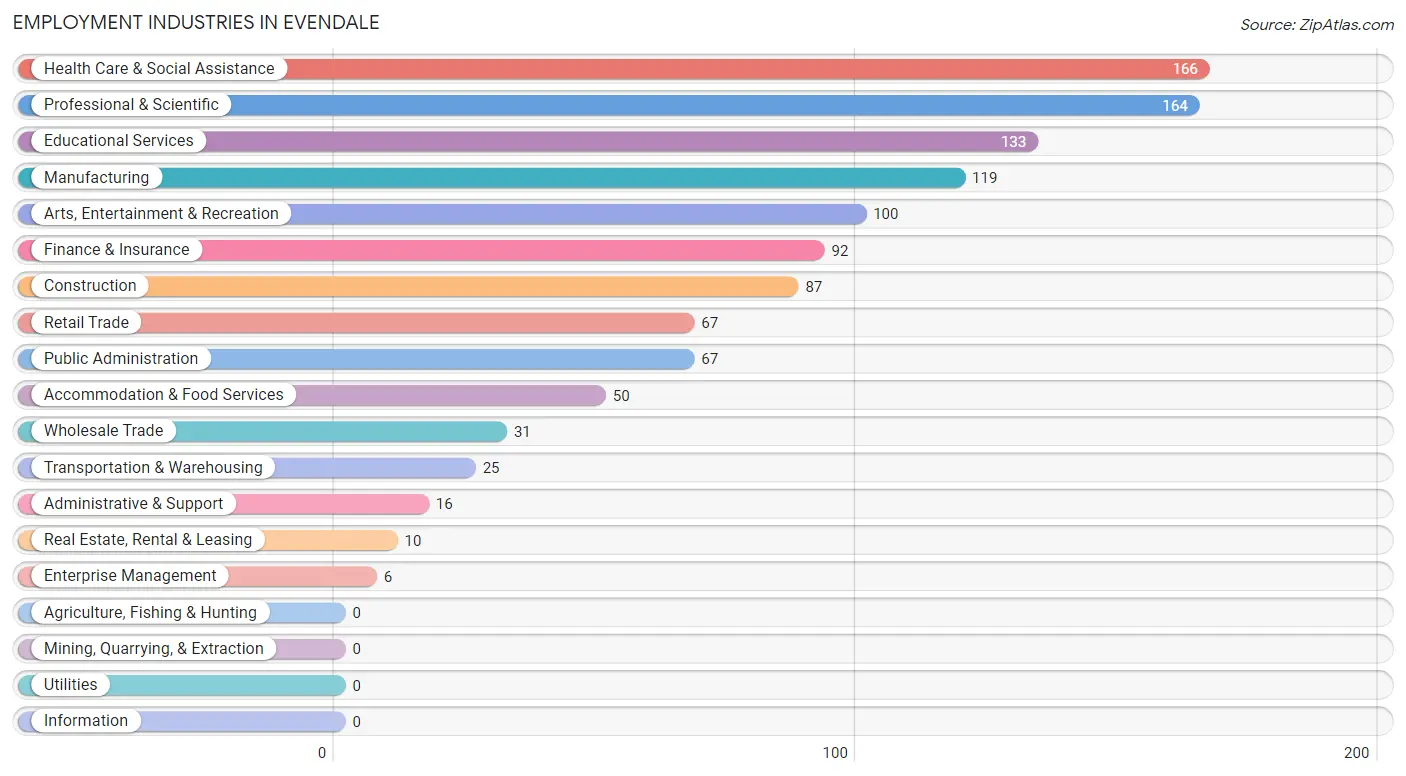
Employment Industries in Evendale
The major employment industries in Evendale include Health Care & Social Assistance (166 | 14.2%), Professional & Scientific (164 | 14.0%), Educational Services (133 | 11.4%), Manufacturing (119 | 10.2%), and Arts, Entertainment & Recreation (100 | 8.5%).
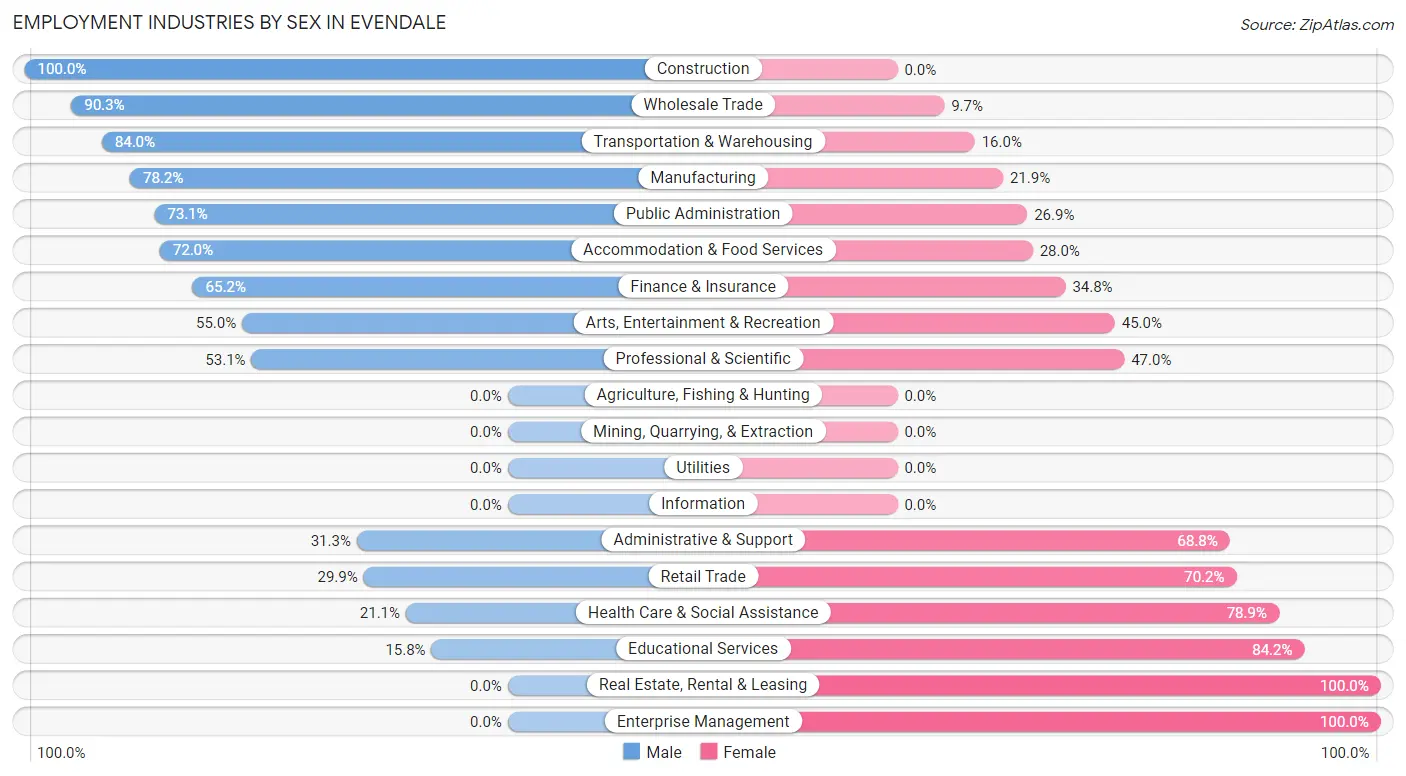
Employment Industries by Sex in Evendale
The Evendale industries that see more men than women are Construction (100.0%), Wholesale Trade (90.3%), and Transportation & Warehousing (84.0%), whereas the industries that tend to have a higher number of women are Real Estate, Rental & Leasing (100.0%), Enterprise Management (100.0%), and Educational Services (84.2%).
| Industry | Male | Female |
| Agriculture, Fishing & Hunting | 0 (0.0%) | 0 (0.0%) |
| Mining, Quarrying, & Extraction | 0 (0.0%) | 0 (0.0%) |
| Construction | 87 (100.0%) | 0 (0.0%) |
| Manufacturing | 93 (78.1%) | 26 (21.8%) |
| Wholesale Trade | 28 (90.3%) | 3 (9.7%) |
| Retail Trade | 20 (29.8%) | 47 (70.2%) |
| Transportation & Warehousing | 21 (84.0%) | 4 (16.0%) |
| Utilities | 0 (0.0%) | 0 (0.0%) |
| Information | 0 (0.0%) | 0 (0.0%) |
| Finance & Insurance | 60 (65.2%) | 32 (34.8%) |
| Real Estate, Rental & Leasing | 0 (0.0%) | 10 (100.0%) |
| Professional & Scientific | 87 (53.0%) | 77 (46.9%) |
| Enterprise Management | 0 (0.0%) | 6 (100.0%) |
| Administrative & Support | 5 (31.2%) | 11 (68.8%) |
| Educational Services | 21 (15.8%) | 112 (84.2%) |
| Health Care & Social Assistance | 35 (21.1%) | 131 (78.9%) |
| Arts, Entertainment & Recreation | 55 (55.0%) | 45 (45.0%) |
| Accommodation & Food Services | 36 (72.0%) | 14 (28.0%) |
| Public Administration | 49 (73.1%) | 18 (26.9%) |
| Total | 624 (53.2%) | 548 (46.8%) |
Education in Evendale
School Enrollment in Evendale
The most common levels of schooling among the 684 students in Evendale are high school (184 | 26.9%), elementary school (130 | 19.0%), and college / undergraduate (111 | 16.2%).
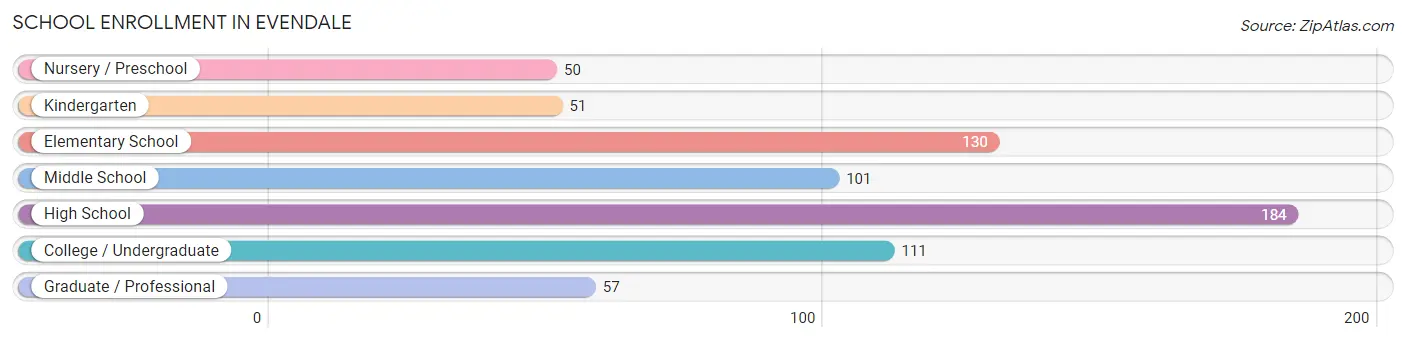
| School Level | # Students | % Students |
| Nursery / Preschool | 50 | 7.3% |
| Kindergarten | 51 | 7.5% |
| Elementary School | 130 | 19.0% |
| Middle School | 101 | 14.8% |
| High School | 184 | 26.9% |
| College / Undergraduate | 111 | 16.2% |
| Graduate / Professional | 57 | 8.3% |
| Total | 684 | 100.0% |
School Enrollment by Age by Funding Source in Evendale
Out of a total of 684 students who are enrolled in schools in Evendale, 312 (45.6%) attend a private institution, while the remaining 372 (54.4%) are enrolled in public schools. The age group of 15 to 17 year olds has the highest likelihood of being enrolled in private schools, with 84 (60.9% in the age bracket) enrolled. Conversely, the age group of 25 to 34 year olds has the lowest likelihood of being enrolled in a private school, with 16 (100.0% in the age bracket) attending a public institution.
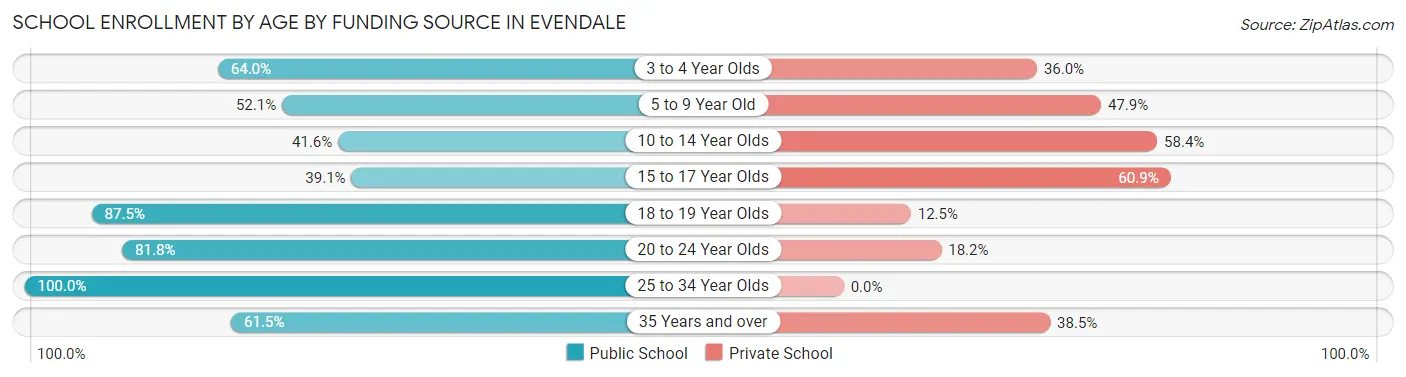
| Age Bracket | Public School | Private School |
| 3 to 4 Year Olds | 16 (64.0%) | 9 (36.0%) |
| 5 to 9 Year Old | 101 (52.1%) | 93 (47.9%) |
| 10 to 14 Year Olds | 62 (41.6%) | 87 (58.4%) |
| 15 to 17 Year Olds | 54 (39.1%) | 84 (60.9%) |
| 18 to 19 Year Olds | 56 (87.5%) | 8 (12.5%) |
| 20 to 24 Year Olds | 27 (81.8%) | 6 (18.2%) |
| 25 to 34 Year Olds | 16 (100.0%) | 0 (0.0%) |
| 35 Years and over | 40 (61.5%) | 25 (38.5%) |
| Total | 372 (54.4%) | 312 (45.6%) |
Educational Attainment by Field of Study in Evendale
Business (306 | 23.3%), science & technology (185 | 14.1%), engineering (171 | 13.0%), education (159 | 12.1%), and bio, nature & agricultural (83 | 6.3%) are the most common fields of study among 1,314 individuals in Evendale who have obtained a bachelor's degree or higher.
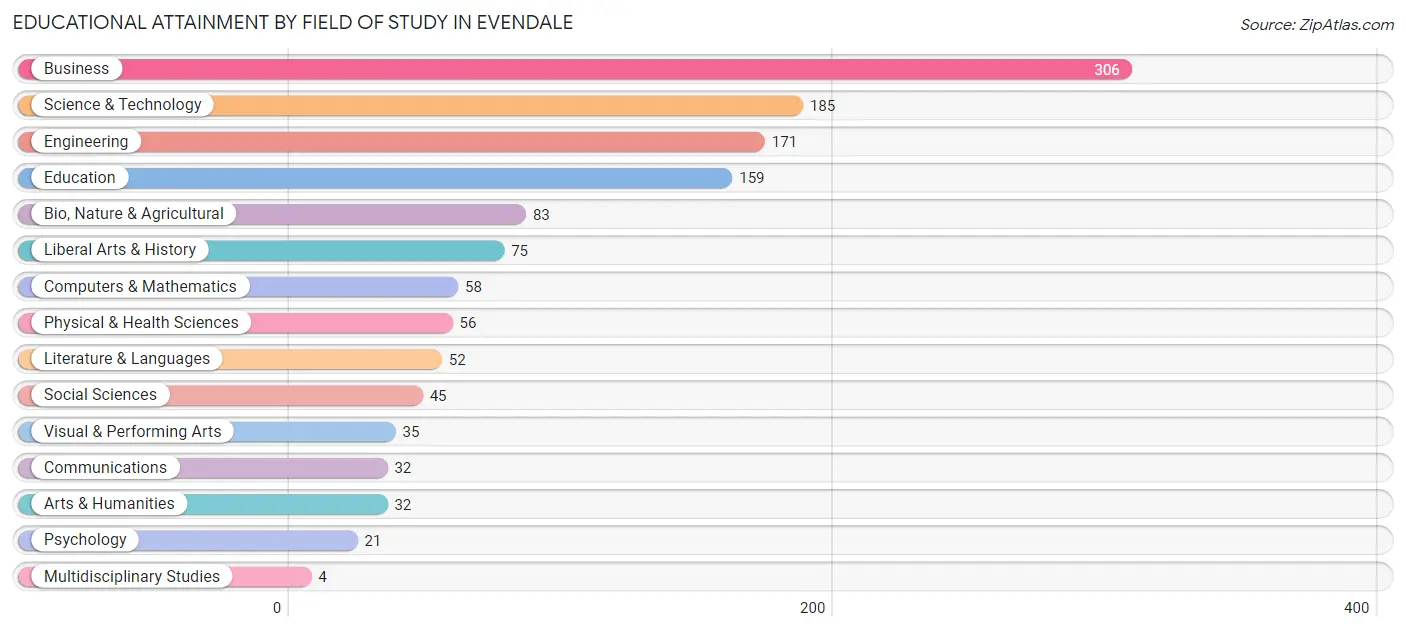
| Field of Study | # Graduates | % Graduates |
| Computers & Mathematics | 58 | 4.4% |
| Bio, Nature & Agricultural | 83 | 6.3% |
| Physical & Health Sciences | 56 | 4.3% |
| Psychology | 21 | 1.6% |
| Social Sciences | 45 | 3.4% |
| Engineering | 171 | 13.0% |
| Multidisciplinary Studies | 4 | 0.3% |
| Science & Technology | 185 | 14.1% |
| Business | 306 | 23.3% |
| Education | 159 | 12.1% |
| Literature & Languages | 52 | 4.0% |
| Liberal Arts & History | 75 | 5.7% |
| Visual & Performing Arts | 35 | 2.7% |
| Communications | 32 | 2.4% |
| Arts & Humanities | 32 | 2.4% |
| Total | 1,314 | 100.0% |
Transportation & Commute in Evendale
Vehicle Availability by Sex in Evendale
The most prevalent vehicle ownership categories in Evendale are males with 3 vehicles (221, accounting for 35.4%) and females with 3 vehicles (182, making up 40.8%).
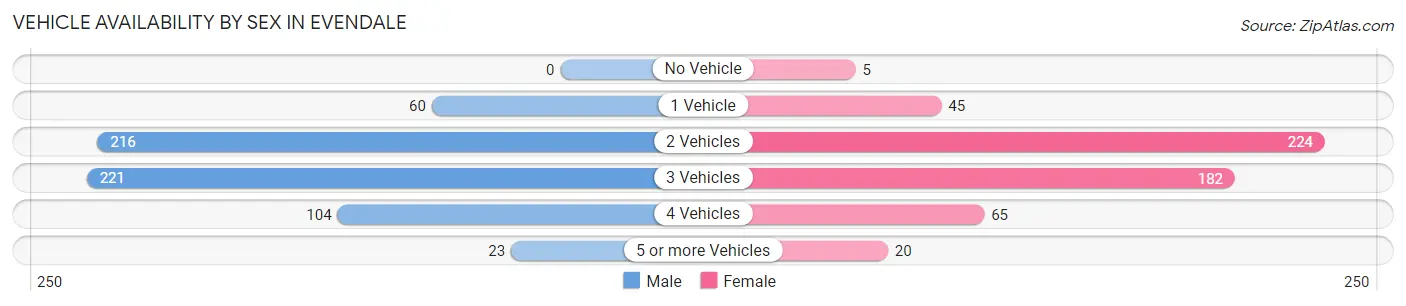
| Vehicles Available | Male | Female |
| No Vehicle | 0 (0.0%) | 5 (0.9%) |
| 1 Vehicle | 60 (9.6%) | 45 (8.3%) |
| 2 Vehicles | 216 (34.6%) | 224 (41.4%) |
| 3 Vehicles | 221 (35.4%) | 182 (33.6%) |
| 4 Vehicles | 104 (16.7%) | 65 (12.0%) |
| 5 or more Vehicles | 23 (3.7%) | 20 (3.7%) |
| Total | 624 (100.0%) | 541 (100.0%) |
Commute Time in Evendale
The most frequently occuring commute durations in Evendale are 15 to 19 minutes (189 commuters, 20.2%), 20 to 24 minutes (174 commuters, 18.6%), and 5 to 9 minutes (113 commuters, 12.1%).
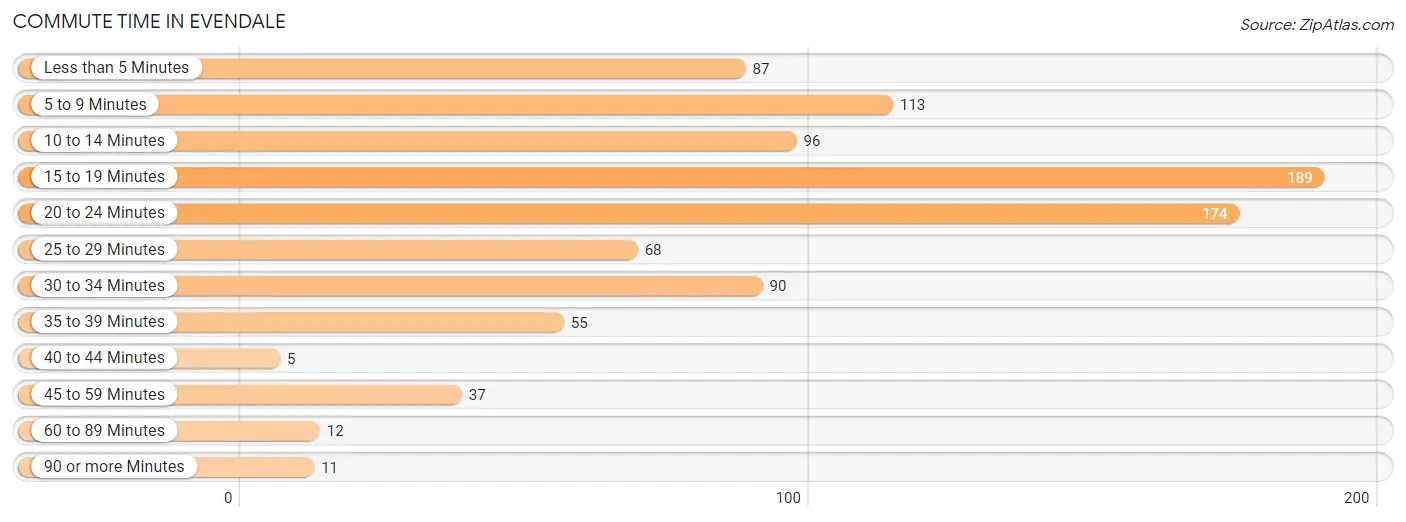
| Commute Time | # Commuters | % Commuters |
| Less than 5 Minutes | 87 | 9.3% |
| 5 to 9 Minutes | 113 | 12.1% |
| 10 to 14 Minutes | 96 | 10.2% |
| 15 to 19 Minutes | 189 | 20.2% |
| 20 to 24 Minutes | 174 | 18.6% |
| 25 to 29 Minutes | 68 | 7.3% |
| 30 to 34 Minutes | 90 | 9.6% |
| 35 to 39 Minutes | 55 | 5.9% |
| 40 to 44 Minutes | 5 | 0.5% |
| 45 to 59 Minutes | 37 | 4.0% |
| 60 to 89 Minutes | 12 | 1.3% |
| 90 or more Minutes | 11 | 1.2% |
Commute Time by Sex in Evendale
The most common commute times in Evendale are 15 to 19 minutes (117 commuters, 22.4%) for males and 5 to 9 minutes (80 commuters, 19.3%) for females.
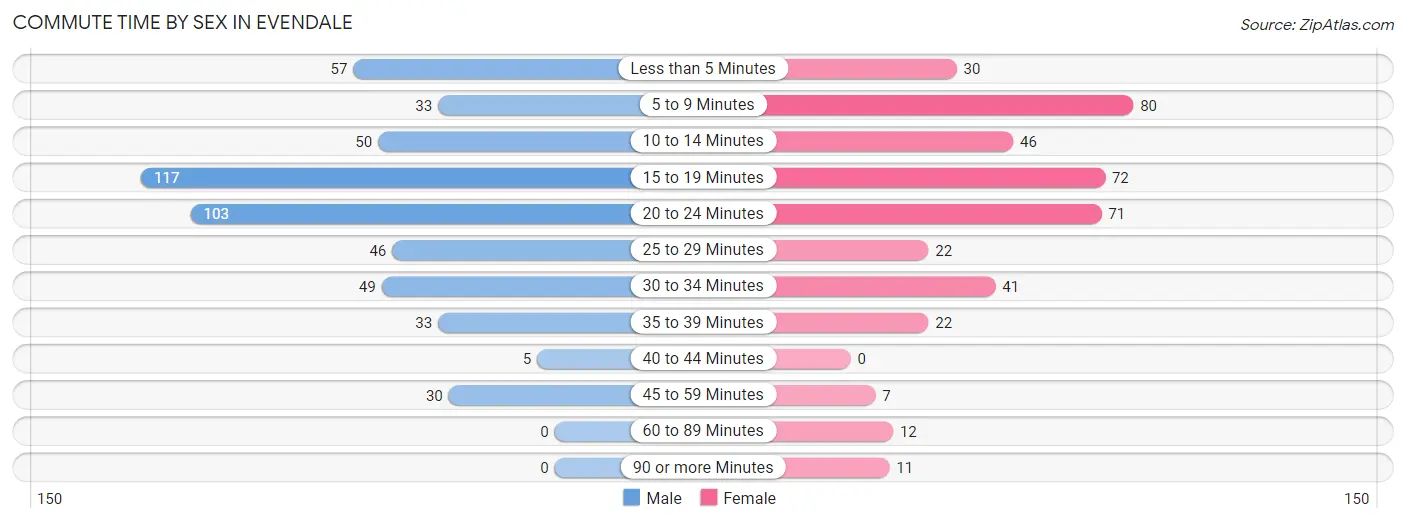
| Commute Time | Male | Female |
| Less than 5 Minutes | 57 (10.9%) | 30 (7.2%) |
| 5 to 9 Minutes | 33 (6.3%) | 80 (19.3%) |
| 10 to 14 Minutes | 50 (9.6%) | 46 (11.1%) |
| 15 to 19 Minutes | 117 (22.4%) | 72 (17.4%) |
| 20 to 24 Minutes | 103 (19.7%) | 71 (17.2%) |
| 25 to 29 Minutes | 46 (8.8%) | 22 (5.3%) |
| 30 to 34 Minutes | 49 (9.4%) | 41 (9.9%) |
| 35 to 39 Minutes | 33 (6.3%) | 22 (5.3%) |
| 40 to 44 Minutes | 5 (1.0%) | 0 (0.0%) |
| 45 to 59 Minutes | 30 (5.7%) | 7 (1.7%) |
| 60 to 89 Minutes | 0 (0.0%) | 12 (2.9%) |
| 90 or more Minutes | 0 (0.0%) | 11 (2.7%) |
Time of Departure to Work by Sex in Evendale
The most frequent times of departure to work in Evendale are 7:00 AM to 7:29 AM (106, 20.3%) for males and 7:00 AM to 7:29 AM (94, 22.7%) for females.
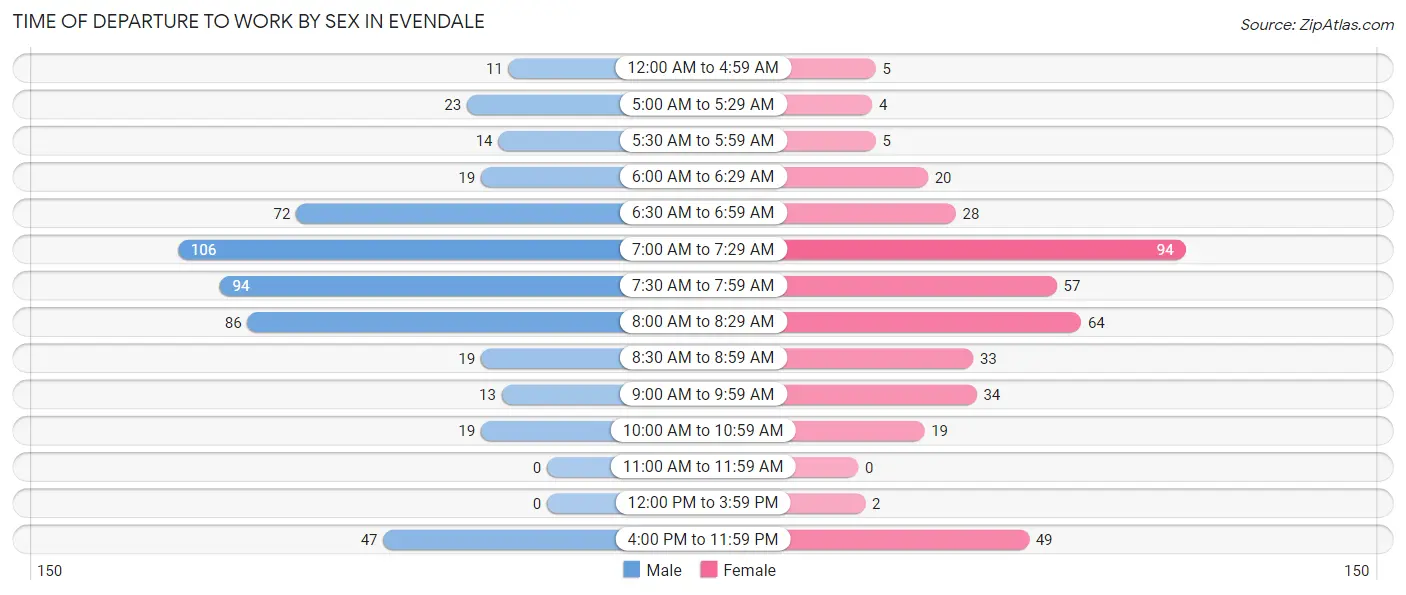
| Time of Departure | Male | Female |
| 12:00 AM to 4:59 AM | 11 (2.1%) | 5 (1.2%) |
| 5:00 AM to 5:29 AM | 23 (4.4%) | 4 (1.0%) |
| 5:30 AM to 5:59 AM | 14 (2.7%) | 5 (1.2%) |
| 6:00 AM to 6:29 AM | 19 (3.6%) | 20 (4.8%) |
| 6:30 AM to 6:59 AM | 72 (13.8%) | 28 (6.8%) |
| 7:00 AM to 7:29 AM | 106 (20.3%) | 94 (22.7%) |
| 7:30 AM to 7:59 AM | 94 (18.0%) | 57 (13.8%) |
| 8:00 AM to 8:29 AM | 86 (16.4%) | 64 (15.5%) |
| 8:30 AM to 8:59 AM | 19 (3.6%) | 33 (8.0%) |
| 9:00 AM to 9:59 AM | 13 (2.5%) | 34 (8.2%) |
| 10:00 AM to 10:59 AM | 19 (3.6%) | 19 (4.6%) |
| 11:00 AM to 11:59 AM | 0 (0.0%) | 0 (0.0%) |
| 12:00 PM to 3:59 PM | 0 (0.0%) | 2 (0.5%) |
| 4:00 PM to 11:59 PM | 47 (9.0%) | 49 (11.8%) |
| Total | 523 (100.0%) | 414 (100.0%) |
Housing Occupancy in Evendale
Occupancy by Ownership in Evendale
Of the total 947 dwellings in Evendale, owner-occupied units account for 925 (97.7%), while renter-occupied units make up 22 (2.3%).
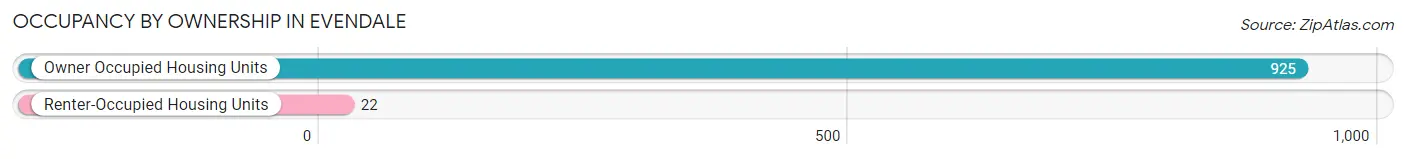
| Occupancy | # Housing Units | % Housing Units |
| Owner Occupied Housing Units | 925 | 97.7% |
| Renter-Occupied Housing Units | 22 | 2.3% |
| Total Occupied Housing Units | 947 | 100.0% |
Occupancy by Household Size in Evendale
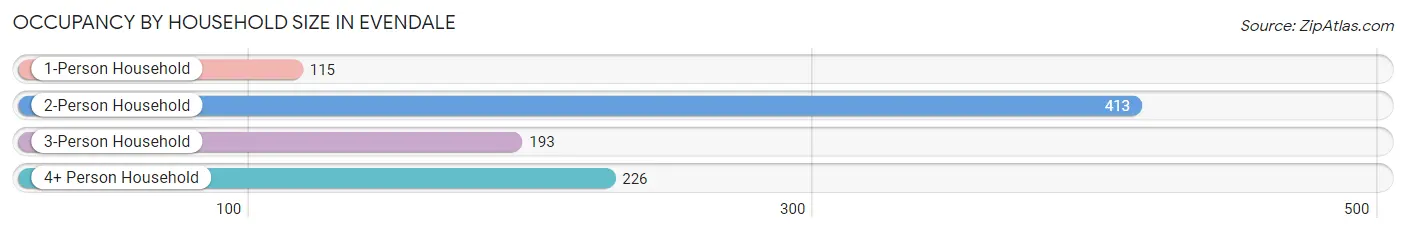
| Household Size | # Housing Units | % Housing Units |
| 1-Person Household | 115 | 12.1% |
| 2-Person Household | 413 | 43.6% |
| 3-Person Household | 193 | 20.4% |
| 4+ Person Household | 226 | 23.9% |
| Total Housing Units | 947 | 100.0% |
Occupancy by Ownership by Household Size in Evendale
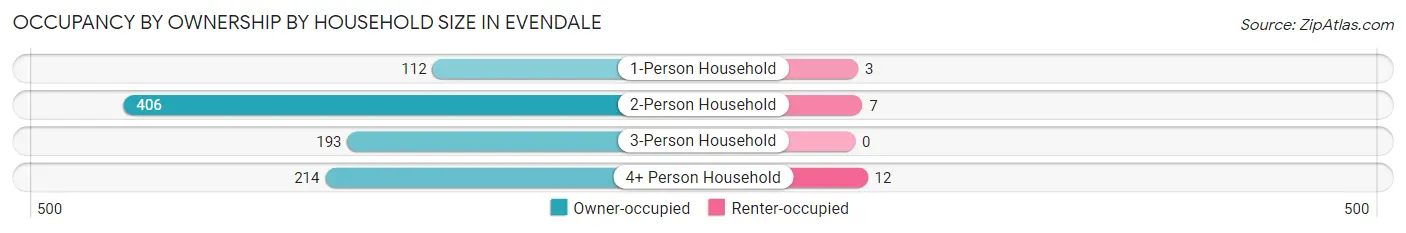
| Household Size | Owner-occupied | Renter-occupied |
| 1-Person Household | 112 (97.4%) | 3 (2.6%) |
| 2-Person Household | 406 (98.3%) | 7 (1.7%) |
| 3-Person Household | 193 (100.0%) | 0 (0.0%) |
| 4+ Person Household | 214 (94.7%) | 12 (5.3%) |
| Total Housing Units | 925 (97.7%) | 22 (2.3%) |
Occupancy by Educational Attainment in Evendale
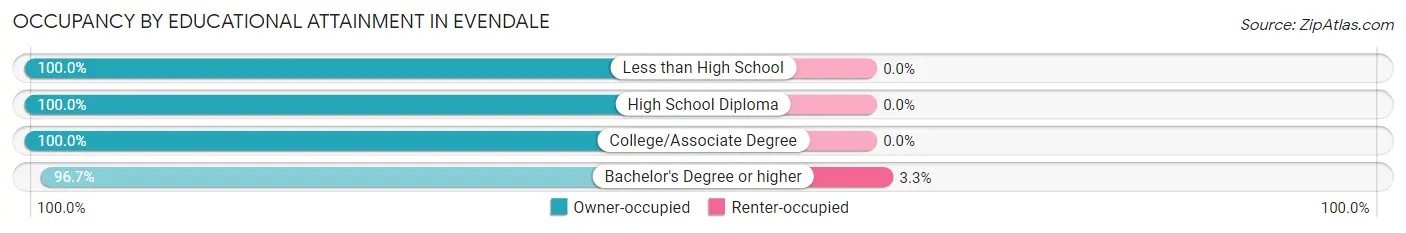
| Household Size | Owner-occupied | Renter-occupied |
| Less than High School | 22 (100.0%) | 0 (0.0%) |
| High School Diploma | 152 (100.0%) | 0 (0.0%) |
| College/Associate Degree | 101 (100.0%) | 0 (0.0%) |
| Bachelor's Degree or higher | 650 (96.7%) | 22 (3.3%) |
Occupancy by Age of Householder in Evendale
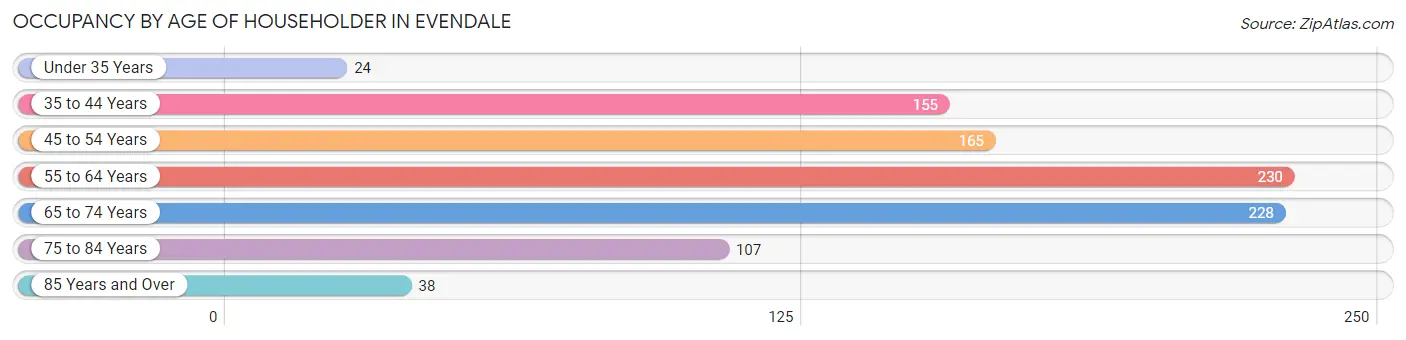
| Age Bracket | # Households | % Households |
| Under 35 Years | 24 | 2.5% |
| 35 to 44 Years | 155 | 16.4% |
| 45 to 54 Years | 165 | 17.4% |
| 55 to 64 Years | 230 | 24.3% |
| 65 to 74 Years | 228 | 24.1% |
| 75 to 84 Years | 107 | 11.3% |
| 85 Years and Over | 38 | 4.0% |
| Total | 947 | 100.0% |
Housing Finances in Evendale
Median Income by Occupancy in Evendale
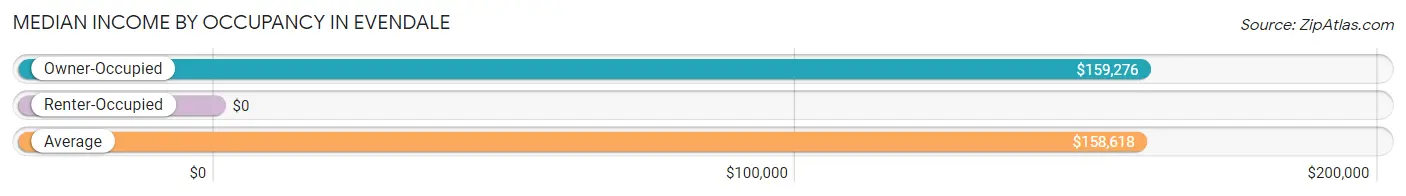
| Occupancy Type | # Households | Median Income |
| Owner-Occupied | 925 (97.7%) | $159,276 |
| Renter-Occupied | 22 (2.3%) | $0 |
| Average | 947 (100.0%) | $158,618 |
Occupancy by Householder Income Bracket in Evendale
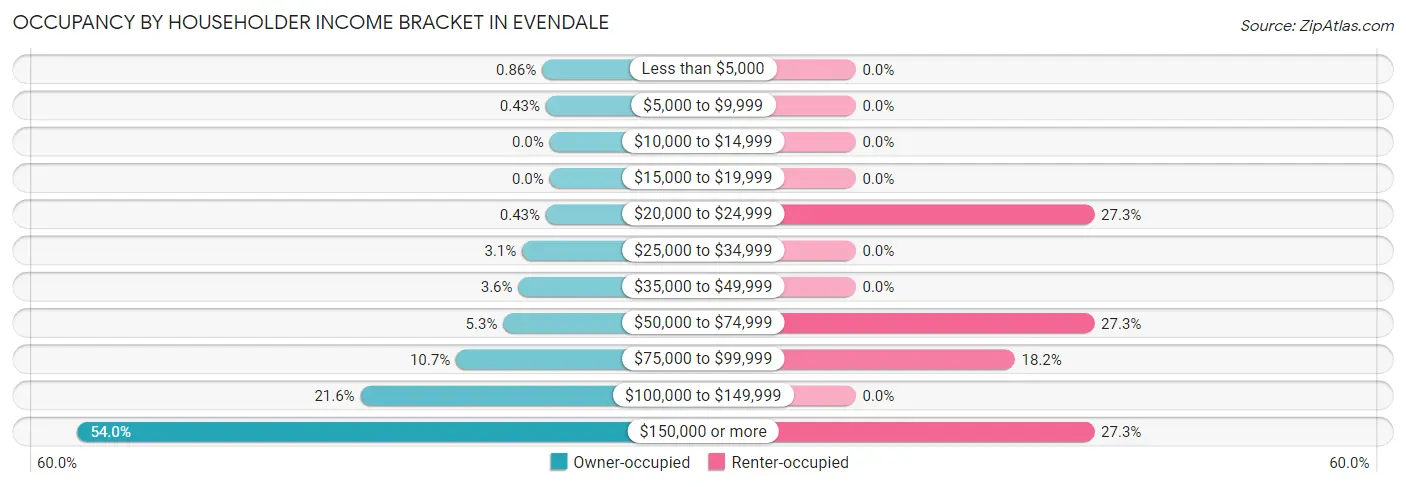
| Income Bracket | Owner-occupied | Renter-occupied |
| Less than $5,000 | 8 (0.9%) | 0 (0.0%) |
| $5,000 to $9,999 | 4 (0.4%) | 0 (0.0%) |
| $10,000 to $14,999 | 0 (0.0%) | 0 (0.0%) |
| $15,000 to $19,999 | 0 (0.0%) | 0 (0.0%) |
| $20,000 to $24,999 | 4 (0.4%) | 6 (27.3%) |
| $25,000 to $34,999 | 29 (3.1%) | 0 (0.0%) |
| $35,000 to $49,999 | 33 (3.6%) | 0 (0.0%) |
| $50,000 to $74,999 | 49 (5.3%) | 6 (27.3%) |
| $75,000 to $99,999 | 99 (10.7%) | 4 (18.2%) |
| $100,000 to $149,999 | 200 (21.6%) | 0 (0.0%) |
| $150,000 or more | 499 (53.9%) | 6 (27.3%) |
| Total | 925 (100.0%) | 22 (100.0%) |
Monthly Housing Cost Tiers in Evendale
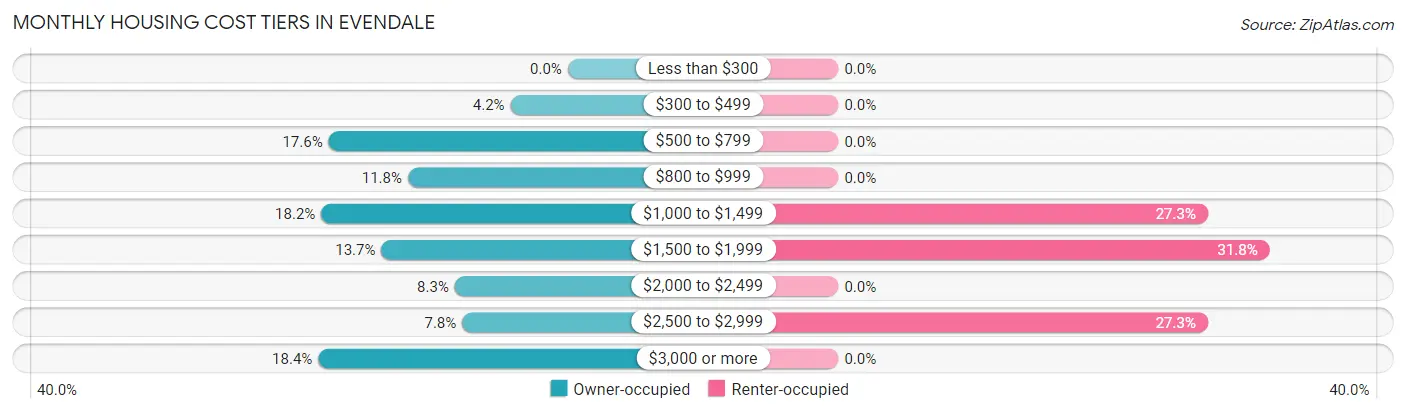
| Monthly Cost | Owner-occupied | Renter-occupied |
| Less than $300 | 0 (0.0%) | 0 (0.0%) |
| $300 to $499 | 39 (4.2%) | 0 (0.0%) |
| $500 to $799 | 163 (17.6%) | 0 (0.0%) |
| $800 to $999 | 109 (11.8%) | 0 (0.0%) |
| $1,000 to $1,499 | 168 (18.2%) | 6 (27.3%) |
| $1,500 to $1,999 | 127 (13.7%) | 7 (31.8%) |
| $2,000 to $2,499 | 77 (8.3%) | 0 (0.0%) |
| $2,500 to $2,999 | 72 (7.8%) | 6 (27.3%) |
| $3,000 or more | 170 (18.4%) | 0 (0.0%) |
| Total | 925 (100.0%) | 22 (100.0%) |
Physical Housing Characteristics in Evendale
Housing Structures in Evendale
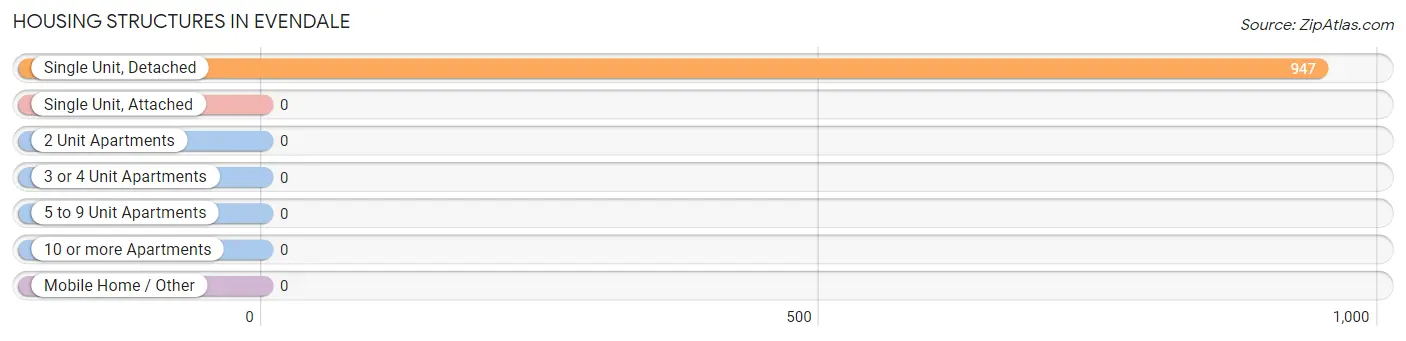
| Structure Type | # Housing Units | % Housing Units |
| Single Unit, Detached | 947 | 100.0% |
| Single Unit, Attached | 0 | 0.0% |
| 2 Unit Apartments | 0 | 0.0% |
| 3 or 4 Unit Apartments | 0 | 0.0% |
| 5 to 9 Unit Apartments | 0 | 0.0% |
| 10 or more Apartments | 0 | 0.0% |
| Mobile Home / Other | 0 | 0.0% |
| Total | 947 | 100.0% |
Housing Structures by Occupancy in Evendale
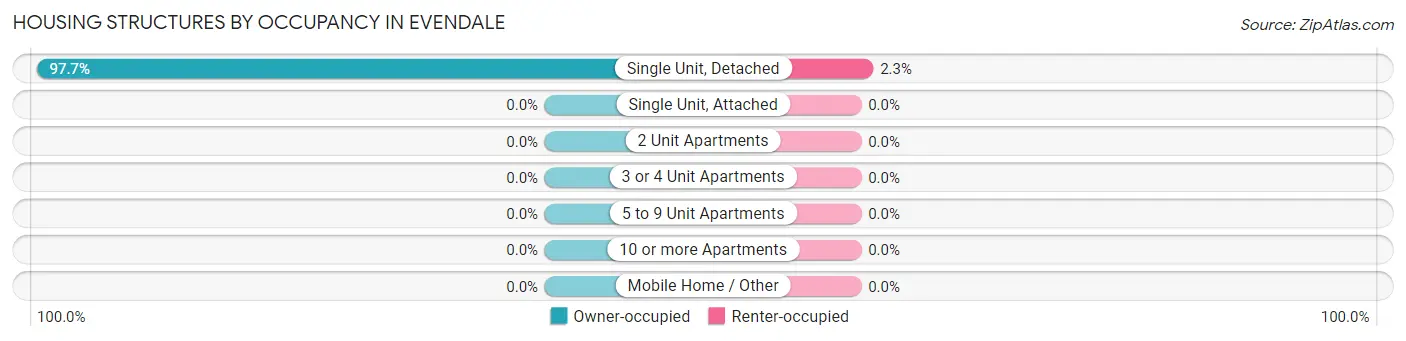
| Structure Type | Owner-occupied | Renter-occupied |
| Single Unit, Detached | 925 (97.7%) | 22 (2.3%) |
| Single Unit, Attached | 0 (0.0%) | 0 (0.0%) |
| 2 Unit Apartments | 0 (0.0%) | 0 (0.0%) |
| 3 or 4 Unit Apartments | 0 (0.0%) | 0 (0.0%) |
| 5 to 9 Unit Apartments | 0 (0.0%) | 0 (0.0%) |
| 10 or more Apartments | 0 (0.0%) | 0 (0.0%) |
| Mobile Home / Other | 0 (0.0%) | 0 (0.0%) |
| Total | 925 (97.7%) | 22 (2.3%) |
Housing Structures by Number of Rooms in Evendale
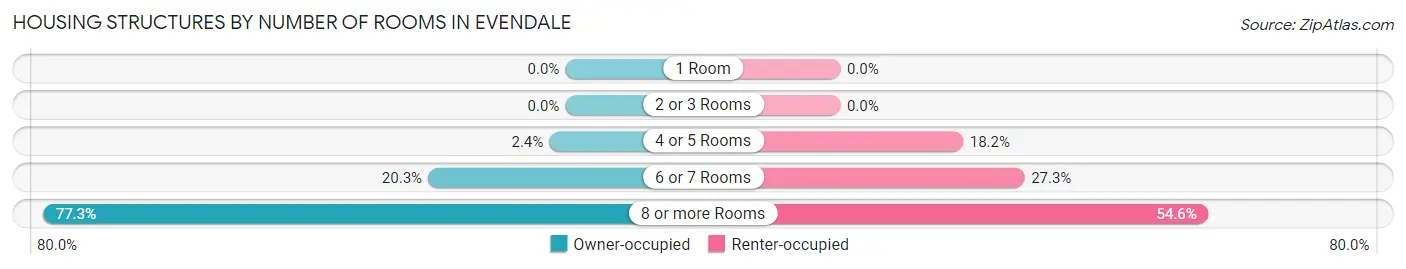
| Number of Rooms | Owner-occupied | Renter-occupied |
| 1 Room | 0 (0.0%) | 0 (0.0%) |
| 2 or 3 Rooms | 0 (0.0%) | 0 (0.0%) |
| 4 or 5 Rooms | 22 (2.4%) | 4 (18.2%) |
| 6 or 7 Rooms | 188 (20.3%) | 6 (27.3%) |
| 8 or more Rooms | 715 (77.3%) | 12 (54.5%) |
| Total | 925 (100.0%) | 22 (100.0%) |
Housing Structure by Heating Type in Evendale
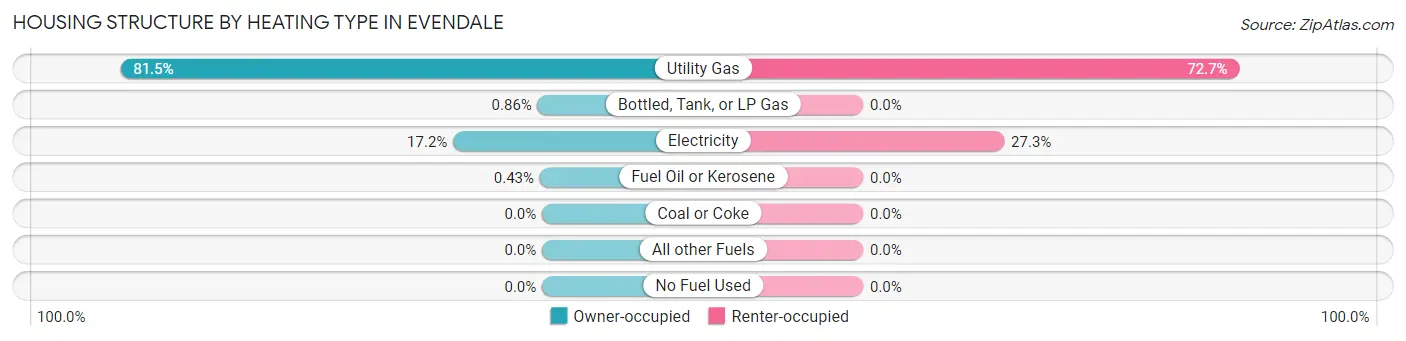
| Heating Type | Owner-occupied | Renter-occupied |
| Utility Gas | 754 (81.5%) | 16 (72.7%) |
| Bottled, Tank, or LP Gas | 8 (0.9%) | 0 (0.0%) |
| Electricity | 159 (17.2%) | 6 (27.3%) |
| Fuel Oil or Kerosene | 4 (0.4%) | 0 (0.0%) |
| Coal or Coke | 0 (0.0%) | 0 (0.0%) |
| All other Fuels | 0 (0.0%) | 0 (0.0%) |
| No Fuel Used | 0 (0.0%) | 0 (0.0%) |
| Total | 925 (100.0%) | 22 (100.0%) |
Household Vehicle Usage in Evendale
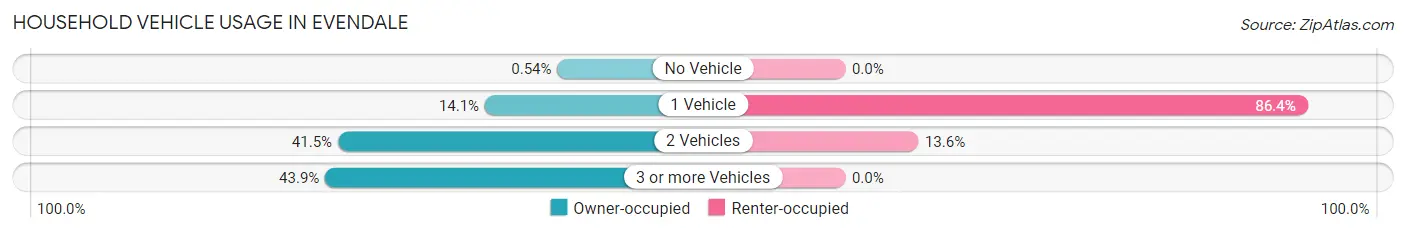
| Vehicles per Household | Owner-occupied | Renter-occupied |
| No Vehicle | 5 (0.5%) | 0 (0.0%) |
| 1 Vehicle | 130 (14.1%) | 19 (86.4%) |
| 2 Vehicles | 384 (41.5%) | 3 (13.6%) |
| 3 or more Vehicles | 406 (43.9%) | 0 (0.0%) |
| Total | 925 (100.0%) | 22 (100.0%) |
Real Estate & Mortgages in Evendale
Real Estate and Mortgage Overview in Evendale
| Characteristic | Without Mortgage | With Mortgage |
| Housing Units | 422 | 503 |
| Median Property Value | $361,300 | $405,000 |
| Median Household Income | $133,750 | $320 |
| Monthly Housing Costs | $841 | $170 |
| Real Estate Taxes | $4,974 | $9 |
Property Value by Mortgage Status in Evendale
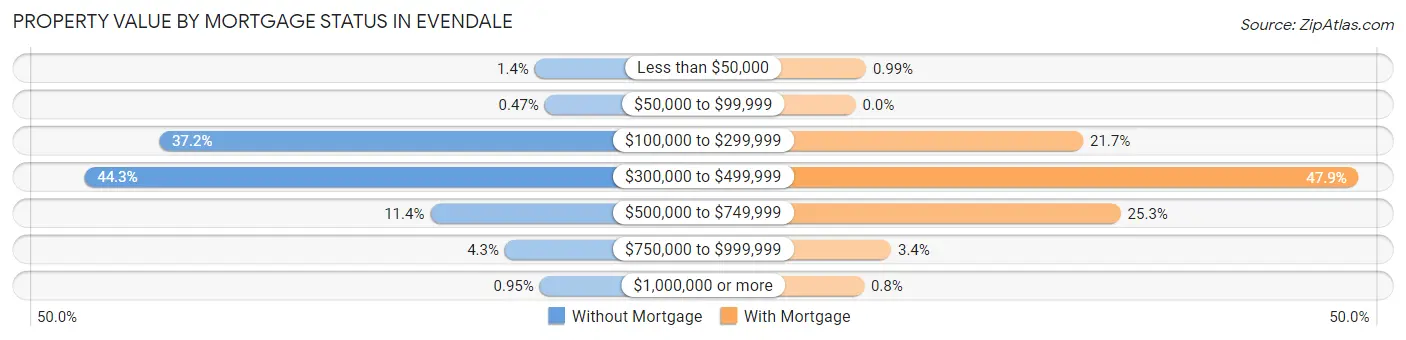
| Property Value | Without Mortgage | With Mortgage |
| Less than $50,000 | 6 (1.4%) | 5 (1.0%) |
| $50,000 to $99,999 | 2 (0.5%) | 0 (0.0%) |
| $100,000 to $299,999 | 157 (37.2%) | 109 (21.7%) |
| $300,000 to $499,999 | 187 (44.3%) | 241 (47.9%) |
| $500,000 to $749,999 | 48 (11.4%) | 127 (25.3%) |
| $750,000 to $999,999 | 18 (4.3%) | 17 (3.4%) |
| $1,000,000 or more | 4 (0.9%) | 4 (0.8%) |
| Total | 422 (100.0%) | 503 (100.0%) |
Household Income by Mortgage Status in Evendale

| Household Income | Without Mortgage | With Mortgage |
| Less than $10,000 | 8 (1.9%) | 15 (3.0%) |
| $10,000 to $24,999 | 4 (0.9%) | 4 (0.8%) |
| $25,000 to $34,999 | 17 (4.0%) | 0 (0.0%) |
| $35,000 to $49,999 | 25 (5.9%) | 12 (2.4%) |
| $50,000 to $74,999 | 37 (8.8%) | 8 (1.6%) |
| $75,000 to $99,999 | 55 (13.0%) | 12 (2.4%) |
| $100,000 to $149,999 | 97 (23.0%) | 44 (8.7%) |
| $150,000 or more | 179 (42.4%) | 103 (20.5%) |
| Total | 422 (100.0%) | 503 (100.0%) |
Property Value to Household Income Ratio in Evendale
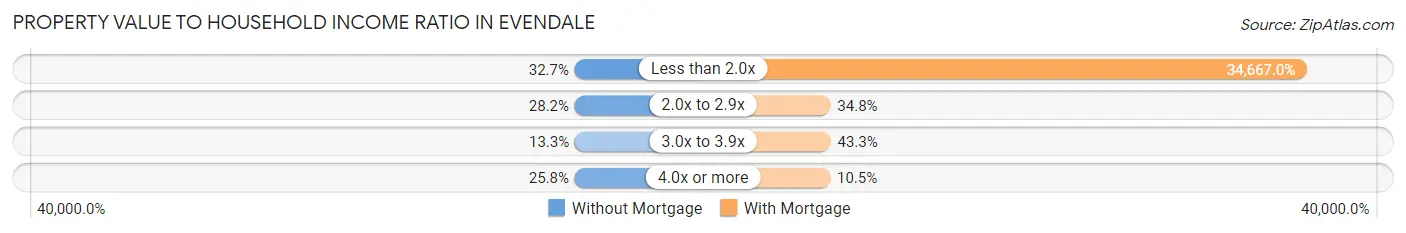
| Value-to-Income Ratio | Without Mortgage | With Mortgage |
| Less than 2.0x | 138 (32.7%) | 174,375 (34,667.0%) |
| 2.0x to 2.9x | 119 (28.2%) | 175 (34.8%) |
| 3.0x to 3.9x | 56 (13.3%) | 218 (43.3%) |
| 4.0x or more | 109 (25.8%) | 53 (10.5%) |
| Total | 422 (100.0%) | 503 (100.0%) |
Real Estate Taxes by Mortgage Status in Evendale
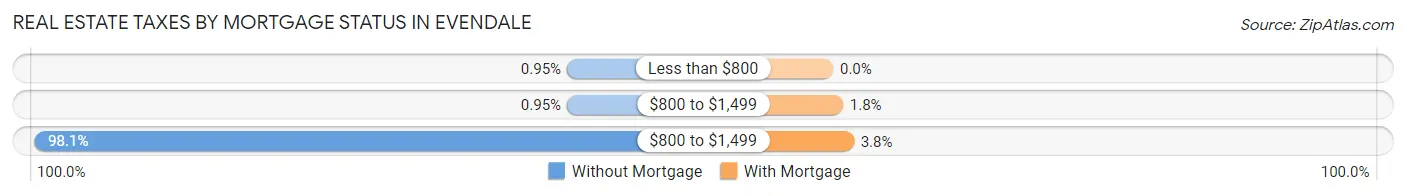
| Property Taxes | Without Mortgage | With Mortgage |
| Less than $800 | 4 (0.9%) | 0 (0.0%) |
| $800 to $1,499 | 4 (0.9%) | 9 (1.8%) |
| $800 to $1,499 | 414 (98.1%) | 19 (3.8%) |
| Total | 422 (100.0%) | 503 (100.0%) |
Health & Disability in Evendale
Health Insurance Coverage by Age in Evendale
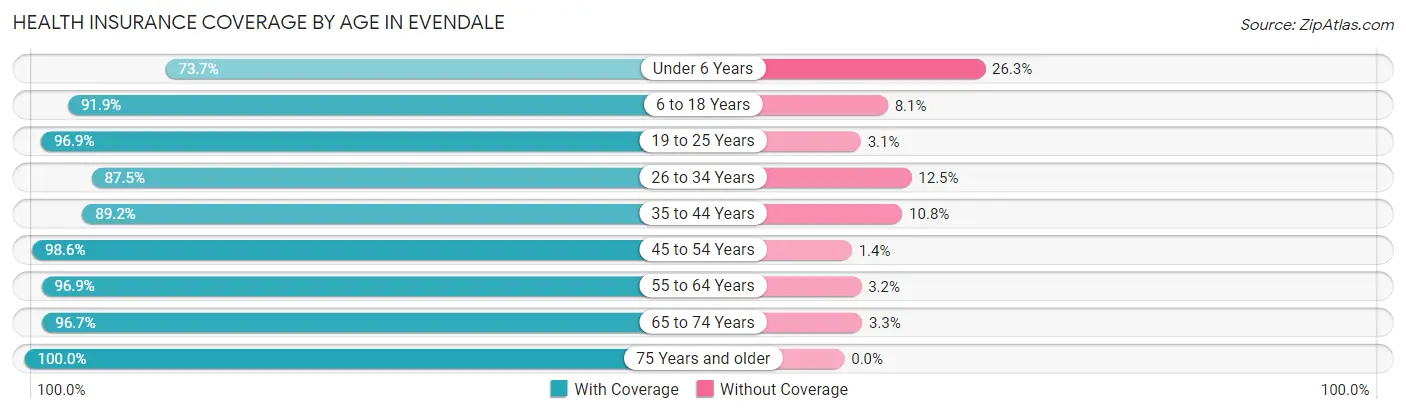
| Age Bracket | With Coverage | Without Coverage |
| Under 6 Years | 132 (73.7%) | 47 (26.3%) |
| 6 to 18 Years | 477 (91.9%) | 42 (8.1%) |
| 19 to 25 Years | 95 (96.9%) | 3 (3.1%) |
| 26 to 34 Years | 70 (87.5%) | 10 (12.5%) |
| 35 to 44 Years | 306 (89.2%) | 37 (10.8%) |
| 45 to 54 Years | 355 (98.6%) | 5 (1.4%) |
| 55 to 64 Years | 431 (96.9%) | 14 (3.2%) |
| 65 to 74 Years | 410 (96.7%) | 14 (3.3%) |
| 75 Years and older | 215 (100.0%) | 0 (0.0%) |
| Total | 2,491 (93.5%) | 172 (6.5%) |
Health Insurance Coverage by Citizenship Status in Evendale
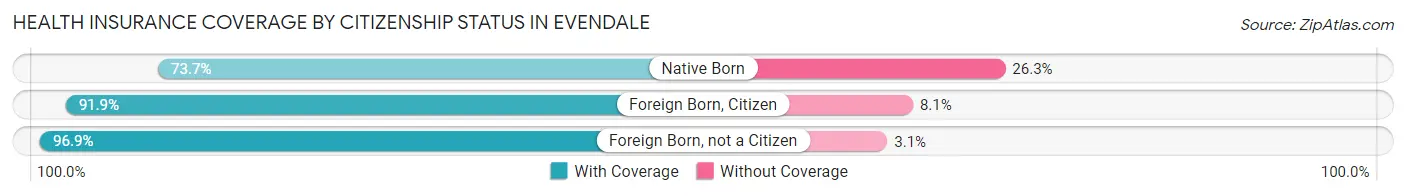
| Citizenship Status | With Coverage | Without Coverage |
| Native Born | 132 (73.7%) | 47 (26.3%) |
| Foreign Born, Citizen | 477 (91.9%) | 42 (8.1%) |
| Foreign Born, not a Citizen | 95 (96.9%) | 3 (3.1%) |
Health Insurance Coverage by Household Income in Evendale
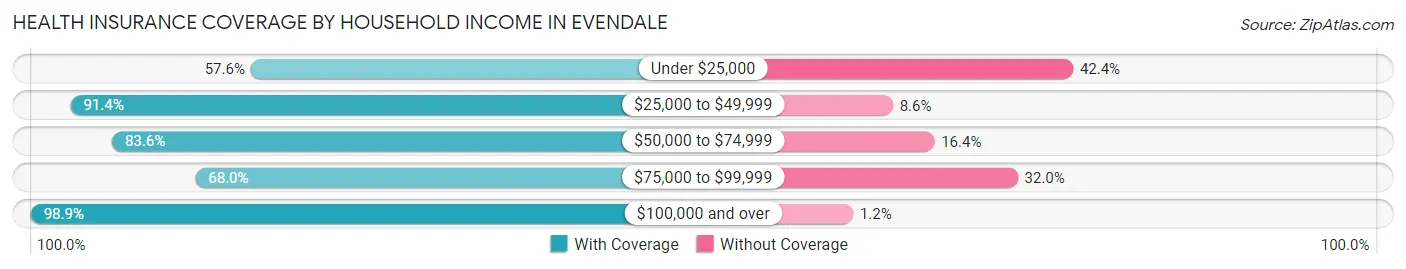
| Household Income | With Coverage | Without Coverage |
| Under $25,000 | 34 (57.6%) | 25 (42.4%) |
| $25,000 to $49,999 | 85 (91.4%) | 8 (8.6%) |
| $50,000 to $74,999 | 97 (83.6%) | 19 (16.4%) |
| $75,000 to $99,999 | 204 (68.0%) | 96 (32.0%) |
| $100,000 and over | 2,071 (98.9%) | 24 (1.1%) |
Public vs Private Health Insurance Coverage by Age in Evendale
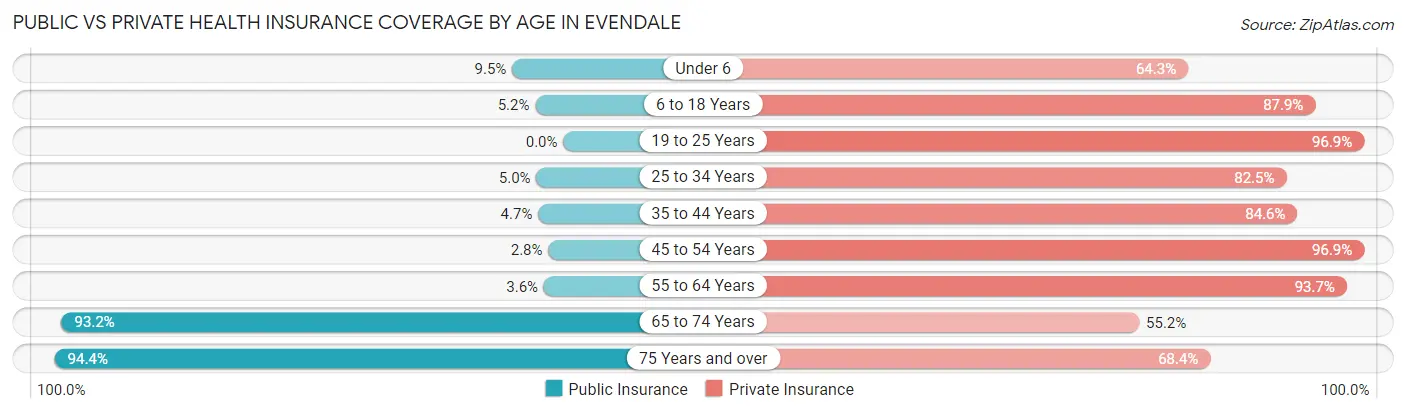
| Age Bracket | Public Insurance | Private Insurance |
| Under 6 | 17 (9.5%) | 115 (64.2%) |
| 6 to 18 Years | 27 (5.2%) | 456 (87.9%) |
| 19 to 25 Years | 0 (0.0%) | 95 (96.9%) |
| 25 to 34 Years | 4 (5.0%) | 66 (82.5%) |
| 35 to 44 Years | 16 (4.7%) | 290 (84.6%) |
| 45 to 54 Years | 10 (2.8%) | 349 (96.9%) |
| 55 to 64 Years | 16 (3.6%) | 417 (93.7%) |
| 65 to 74 Years | 395 (93.2%) | 234 (55.2%) |
| 75 Years and over | 203 (94.4%) | 147 (68.4%) |
| Total | 688 (25.8%) | 2,169 (81.5%) |
Disability Status by Sex by Age in Evendale
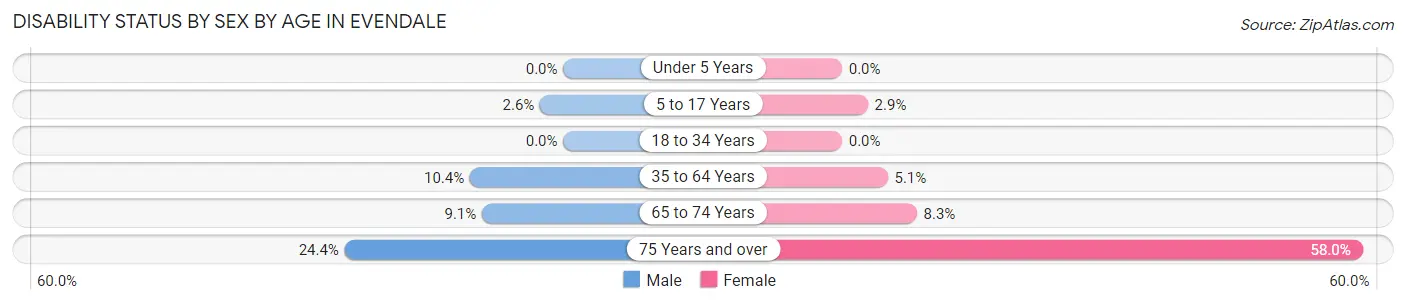
| Age Bracket | Male | Female |
| Under 5 Years | 0 (0.0%) | 0 (0.0%) |
| 5 to 17 Years | 8 (2.6%) | 6 (2.9%) |
| 18 to 34 Years | 0 (0.0%) | 0 (0.0%) |
| 35 to 64 Years | 56 (10.4%) | 31 (5.1%) |
| 65 to 74 Years | 21 (9.0%) | 16 (8.3%) |
| 75 Years and over | 28 (24.3%) | 58 (58.0%) |
Disability Class by Sex by Age in Evendale
Disability Class: Hearing Difficulty
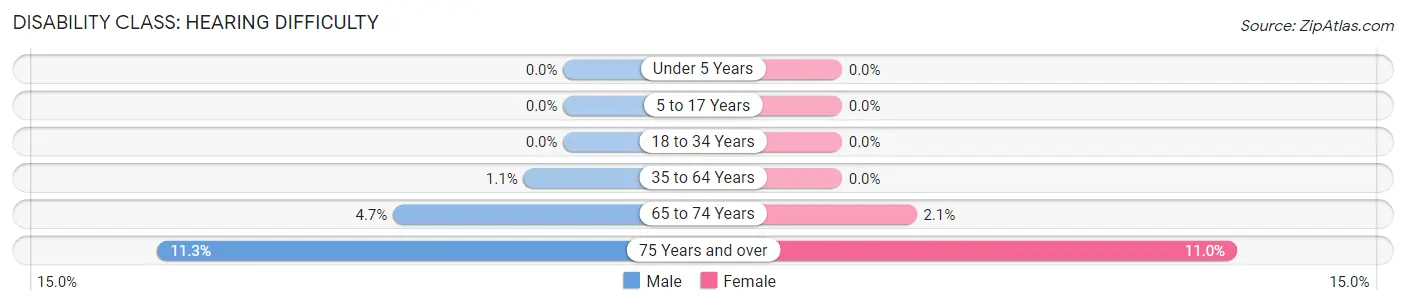
| Age Bracket | Male | Female |
| Under 5 Years | 0 (0.0%) | 0 (0.0%) |
| 5 to 17 Years | 0 (0.0%) | 0 (0.0%) |
| 18 to 34 Years | 0 (0.0%) | 0 (0.0%) |
| 35 to 64 Years | 6 (1.1%) | 0 (0.0%) |
| 65 to 74 Years | 11 (4.7%) | 4 (2.1%) |
| 75 Years and over | 13 (11.3%) | 11 (11.0%) |
Disability Class: Vision Difficulty
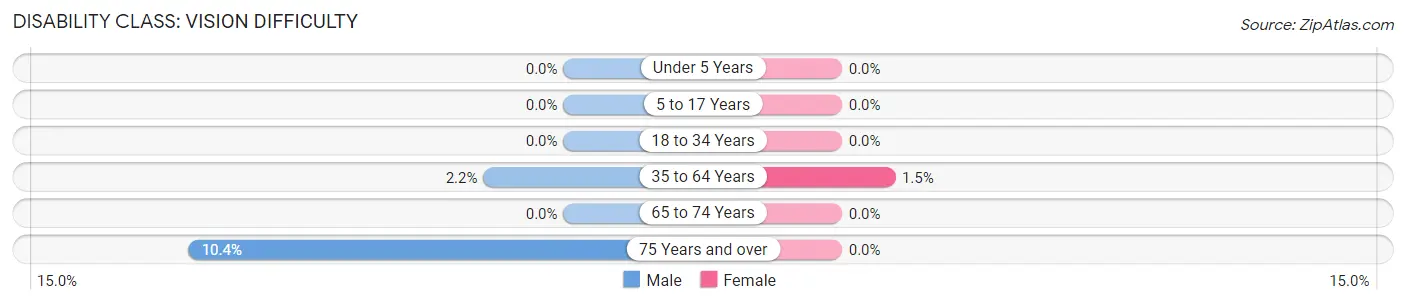
| Age Bracket | Male | Female |
| Under 5 Years | 0 (0.0%) | 0 (0.0%) |
| 5 to 17 Years | 0 (0.0%) | 0 (0.0%) |
| 18 to 34 Years | 0 (0.0%) | 0 (0.0%) |
| 35 to 64 Years | 12 (2.2%) | 9 (1.5%) |
| 65 to 74 Years | 0 (0.0%) | 0 (0.0%) |
| 75 Years and over | 12 (10.4%) | 0 (0.0%) |
Disability Class: Cognitive Difficulty
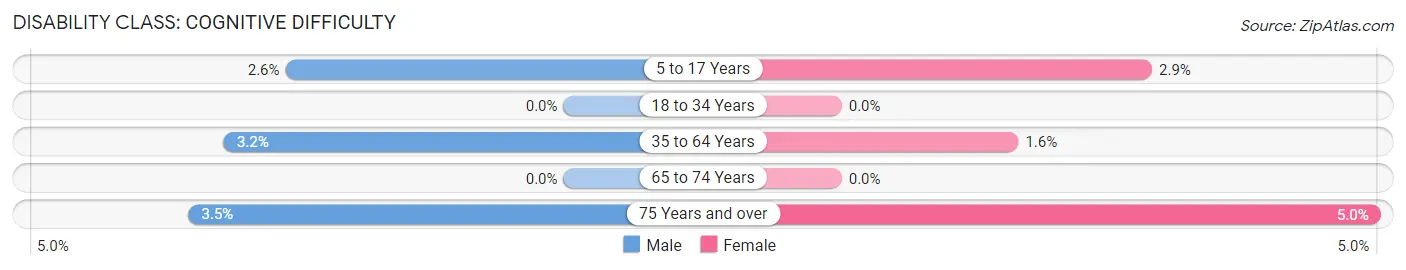
| Age Bracket | Male | Female |
| 5 to 17 Years | 8 (2.6%) | 6 (2.9%) |
| 18 to 34 Years | 0 (0.0%) | 0 (0.0%) |
| 35 to 64 Years | 17 (3.2%) | 10 (1.6%) |
| 65 to 74 Years | 0 (0.0%) | 0 (0.0%) |
| 75 Years and over | 4 (3.5%) | 5 (5.0%) |
Disability Class: Ambulatory Difficulty
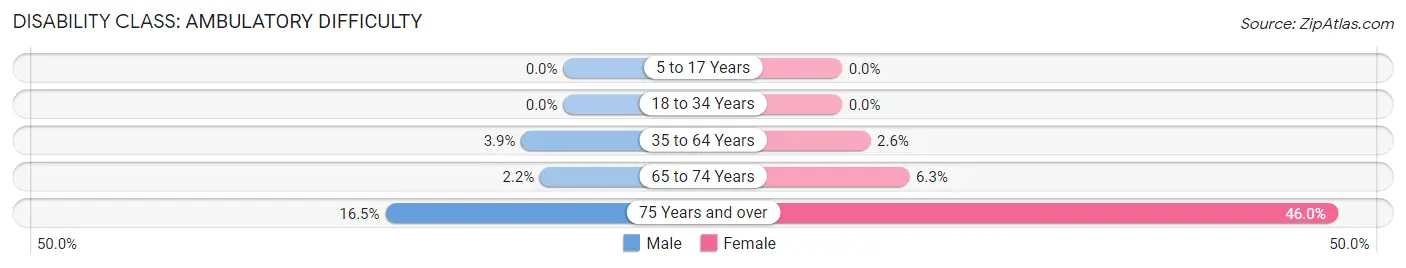
| Age Bracket | Male | Female |
| 5 to 17 Years | 0 (0.0%) | 0 (0.0%) |
| 18 to 34 Years | 0 (0.0%) | 0 (0.0%) |
| 35 to 64 Years | 21 (3.9%) | 16 (2.6%) |
| 65 to 74 Years | 5 (2.2%) | 12 (6.2%) |
| 75 Years and over | 19 (16.5%) | 46 (46.0%) |
Disability Class: Self-Care Difficulty
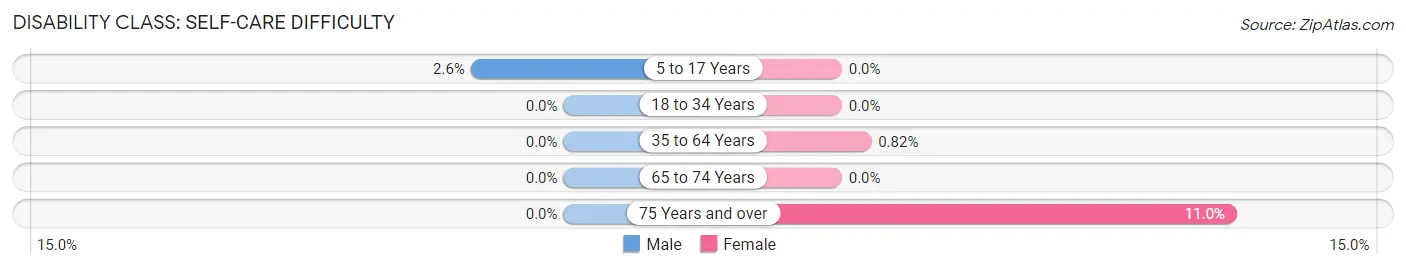
| Age Bracket | Male | Female |
| 5 to 17 Years | 8 (2.6%) | 0 (0.0%) |
| 18 to 34 Years | 0 (0.0%) | 0 (0.0%) |
| 35 to 64 Years | 0 (0.0%) | 5 (0.8%) |
| 65 to 74 Years | 0 (0.0%) | 0 (0.0%) |
| 75 Years and over | 0 (0.0%) | 11 (11.0%) |
Technology Access in Evendale
Computing Device Access in Evendale
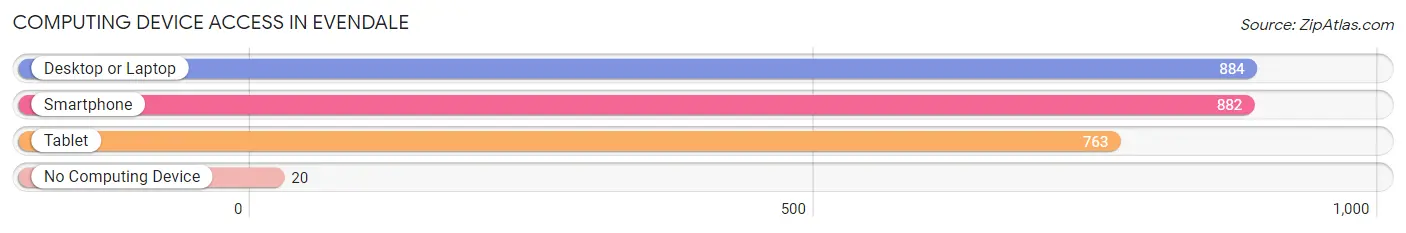
| Device Type | # Households | % Households |
| Desktop or Laptop | 884 | 93.3% |
| Smartphone | 882 | 93.1% |
| Tablet | 763 | 80.6% |
| No Computing Device | 20 | 2.1% |
| Total | 947 | 100.0% |
Internet Access in Evendale
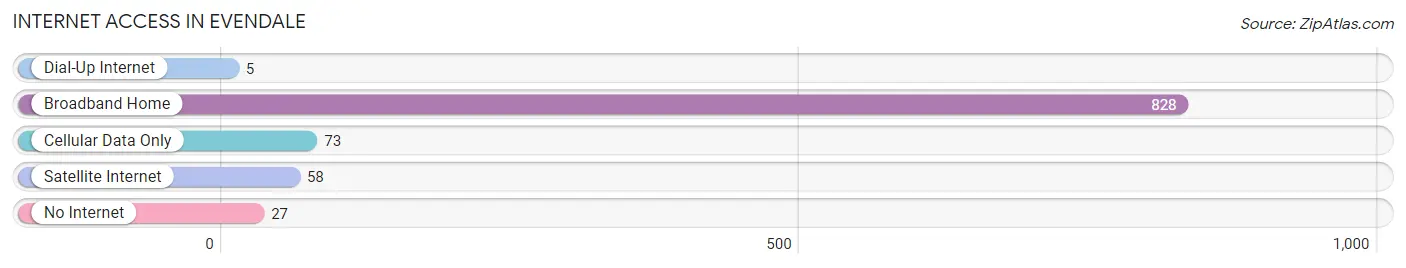
| Internet Type | # Households | % Households |
| Dial-Up Internet | 5 | 0.5% |
| Broadband Home | 828 | 87.4% |
| Cellular Data Only | 73 | 7.7% |
| Satellite Internet | 58 | 6.1% |
| No Internet | 27 | 2.9% |
| Total | 947 | 100.0% |
Evendale Summary
Evendale, Ohio is a small village located in Hamilton County, Ohio. It is situated just north of Cincinnati and is part of the Cincinnati metropolitan area. The village has a population of approximately 2,500 people and covers an area of 1.2 square miles.
History
Evendale was founded in 1817 by a group of settlers from Pennsylvania. The village was originally known as “Evansdale” after the first settler, John Evans. The village was incorporated in 1867 and the name was changed to “Evendale”.
The village was originally a farming community and the main crops were corn, wheat, and oats. In the late 19th century, the village began to grow and develop as a residential community. The village was home to several factories, including a paper mill, a brickyard, and a furniture factory.
In the early 20th century, the village began to attract more businesses and industries. The village was home to several large companies, including General Electric, Procter & Gamble, and the Cincinnati Milling Machine Company.
Geography
Evendale is located in Hamilton County, Ohio. It is situated just north of Cincinnati and is part of the Cincinnati metropolitan area. The village is located on the banks of the Little Miami River and is surrounded by rolling hills and wooded areas.
The village has a total area of 1.2 square miles, all of which is land. The village is located at an elevation of 845 feet above sea level.
Economy
Evendale’s economy is largely based on manufacturing and retail. The village is home to several large companies, including General Electric, Procter & Gamble, and the Cincinnati Milling Machine Company.
The village is also home to several small businesses, including restaurants, shops, and service providers. The village is also home to several parks and recreational facilities, including the Evendale Recreation Center and the Evendale Community Park.
Demographics
As of the 2010 census, the village had a population of 2,500 people. The racial makeup of the village was 94.2% White, 2.2% African American, 0.4% Native American, 0.8% Asian, 0.2% from other races, and 2.4% from two or more races. Hispanic or Latino of any race were 1.2% of the population.
The median income for a household in the village was $60,000, and the median income for a family was $68,000. The per capita income for the village was $27,000. About 4.2% of families and 5.2% of the population were below the poverty line, including 6.2% of those under age 18 and 4.2% of those age 65 or over.
Evendale is a small village with a rich history and a diverse economy. The village is home to several large companies and small businesses, and is a popular destination for outdoor recreation. The village has a population of approximately 2,500 people and covers an area of 1.2 square miles.
Common Questions
What is Per Capita Income in Evendale?
Per Capita income in Evendale is $68,371.
What is the Median Family Income in Evendale?
Median Family Income in Evendale is $168,750.
What is the Median Household income in Evendale?
Median Household Income in Evendale is $158,618.
What is Income or Wage Gap in Evendale?
Income or Wage Gap in Evendale is 49.1%.
Women in Evendale earn 50.9 cents for every dollar earned by a man.
What is Inequality or Gini Index in Evendale?
Inequality or Gini Index in Evendale is 0.39.
What is the Total Population of Evendale?
Total Population of Evendale is 2,663.
What is the Total Male Population of Evendale?
Total Male Population of Evendale is 1,315.
What is the Total Female Population of Evendale?
Total Female Population of Evendale is 1,348.
What is the Ratio of Males per 100 Females in Evendale?
There are 97.55 Males per 100 Females in Evendale.
What is the Ratio of Females per 100 Males in Evendale?
There are 102.51 Females per 100 Males in Evendale.
What is the Median Population Age in Evendale?
Median Population Age in Evendale is 47.4 Years.
What is the Average Family Size in Evendale
Average Family Size in Evendale is 3.0 People.
What is the Average Household Size in Evendale
Average Household Size in Evendale is 2.8 People.
How Large is the Labor Force in Evendale?
There are 1,197 People in the Labor Forcein in Evendale.
What is the Percentage of People in the Labor Force in Evendale?
56.0% of People are in the Labor Force in Evendale.
What is the Unemployment Rate in Evendale?
Unemployment Rate in Evendale is 2.2%.