Cities with the Highest Percentage of Yugoslavian Population in Ohio
RELATED REPORTS & OPTIONS
Yugoslavian
Ohio
Compare Cities
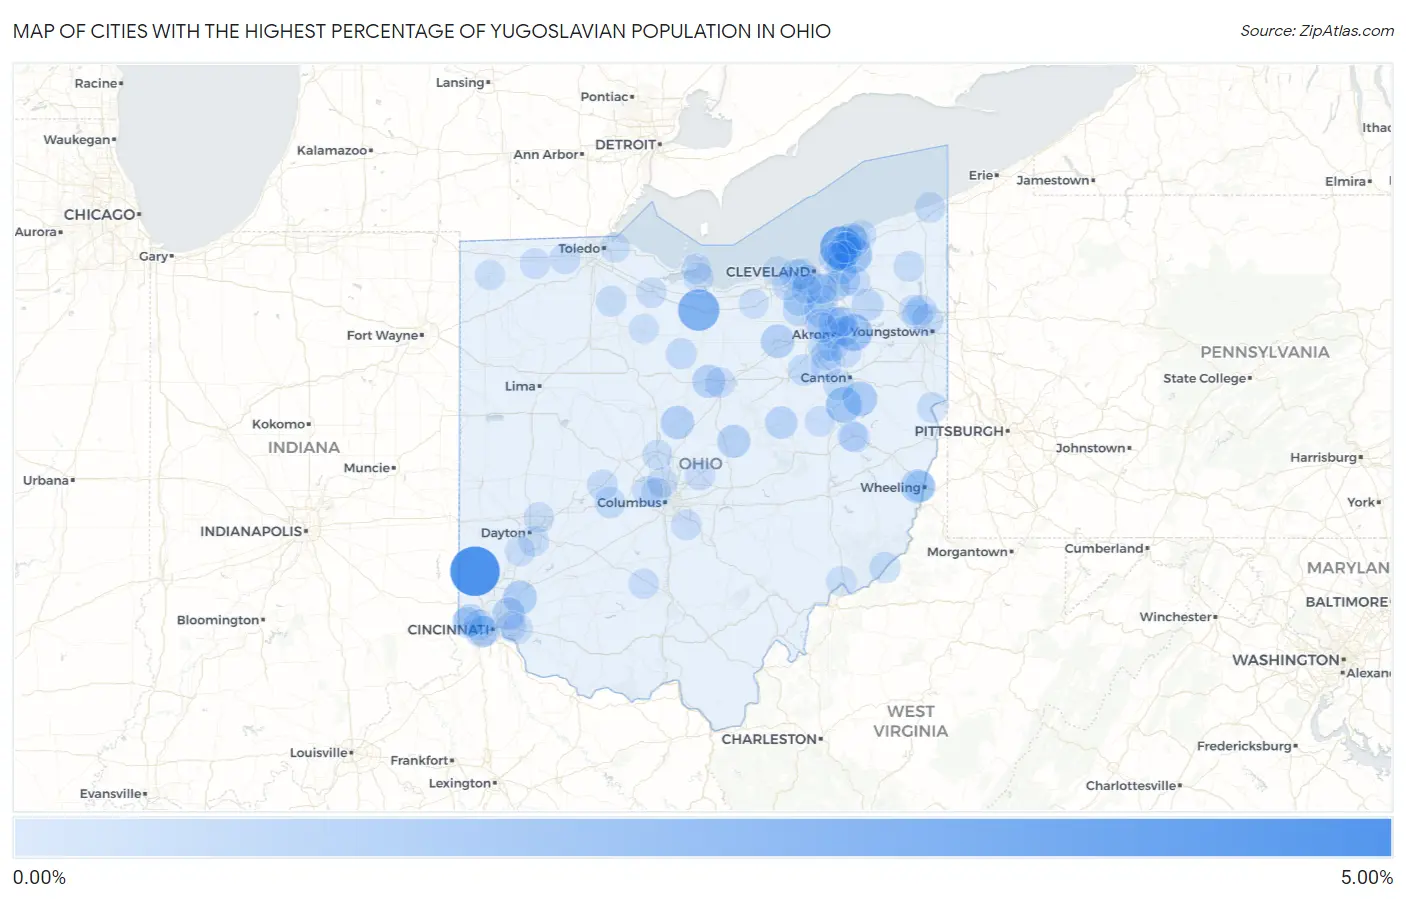
Map of Cities with the Highest Percentage of Yugoslavian Population in Ohio
0.00%
5.00%
Cities with the Highest Percentage of Yugoslavian Population in Ohio
| City | Yugoslavian | vs State | vs National | |
| 1. | Darrtown | 4.86% | 0.062%(+4.80)#1 | 0.067%(+4.79)#39 |
| 2. | Lakeline | 3.03% | 0.062%(+2.97)#2 | 0.067%(+2.96)#73 |
| 3. | Monroeville | 2.81% | 0.062%(+2.75)#3 | 0.067%(+2.74)#77 |
| 4. | Brimfield | 1.72% | 0.062%(+1.65)#4 | 0.067%(+1.65)#157 |
| 5. | Kirtland | 1.63% | 0.062%(+1.57)#5 | 0.067%(+1.57)#168 |
| 6. | Zoar | 1.46% | 0.062%(+1.39)#6 | 0.067%(+1.39)#184 |
| 7. | Pekin | 1.14% | 0.062%(+1.07)#7 | 0.067%(+1.07)#240 |
| 8. | Magnolia | 1.11% | 0.062%(+1.05)#8 | 0.067%(+1.04)#248 |
| 9. | Wolfhurst | 1.01% | 0.062%(+0.946)#9 | 0.067%(+0.941)#278 |
| 10. | Landen | 0.98% | 0.062%(+0.920)#10 | 0.067%(+0.915)#291 |
| 11. | Cardington | 0.88% | 0.062%(+0.821)#11 | 0.067%(+0.817)#332 |
| 12. | Lodi | 0.87% | 0.062%(+0.806)#12 | 0.067%(+0.802)#342 |
| 13. | Gambier | 0.80% | 0.062%(+0.738)#13 | 0.067%(+0.733)#379 |
| 14. | Ontario | 0.80% | 0.062%(+0.736)#14 | 0.067%(+0.731)#383 |
| 15. | Kenwood | 0.72% | 0.062%(+0.662)#15 | 0.067%(+0.657)#424 |
| 16. | Delhi Hills | 0.65% | 0.062%(+0.585)#16 | 0.067%(+0.581)#472 |
| 17. | Killbuck | 0.64% | 0.062%(+0.579)#17 | 0.067%(+0.574)#477 |
| 18. | Moreland Hills | 0.64% | 0.062%(+0.577)#18 | 0.067%(+0.573)#479 |
| 19. | Mentor | 0.59% | 0.062%(+0.528)#19 | 0.067%(+0.523)#524 |
| 20. | Miami Heights | 0.55% | 0.062%(+0.483)#20 | 0.067%(+0.479)#567 |
| 21. | Mantua | 0.52% | 0.062%(+0.459)#21 | 0.067%(+0.455)#597 |
| 22. | Brunswick | 0.52% | 0.062%(+0.459)#22 | 0.067%(+0.455)#598 |
| 23. | Wickliffe | 0.47% | 0.062%(+0.412)#23 | 0.067%(+0.407)#651 |
| 24. | Richfield | 0.46% | 0.062%(+0.395)#24 | 0.067%(+0.391)#673 |
| 25. | Rocky River | 0.45% | 0.062%(+0.393)#25 | 0.067%(+0.388)#674 |
| 26. | Strongsville | 0.44% | 0.062%(+0.373)#26 | 0.067%(+0.369)#703 |
| 27. | Seven Hills | 0.40% | 0.062%(+0.340)#27 | 0.067%(+0.336)#759 |
| 28. | Mentor On The Lake | 0.39% | 0.062%(+0.329)#28 | 0.067%(+0.325)#779 |
| 29. | Mayfield Heights | 0.38% | 0.062%(+0.316)#29 | 0.067%(+0.311)#802 |
| 30. | Barberton | 0.37% | 0.062%(+0.311)#30 | 0.067%(+0.307)#810 |
| 31. | Choctaw Lake | 0.37% | 0.062%(+0.305)#31 | 0.067%(+0.300)#822 |
| 32. | Orrville | 0.36% | 0.062%(+0.299)#32 | 0.067%(+0.295)#835 |
| 33. | Girard | 0.36% | 0.062%(+0.293)#33 | 0.067%(+0.289)#851 |
| 34. | Matamoras | 0.35% | 0.062%(+0.285)#34 | 0.067%(+0.280)#870 |
| 35. | Covedale | 0.34% | 0.062%(+0.280)#35 | 0.067%(+0.276)#879 |
| 36. | New Washington | 0.33% | 0.062%(+0.271)#36 | 0.067%(+0.267)#900 |
| 37. | Eastlake | 0.32% | 0.062%(+0.256)#37 | 0.067%(+0.251)#933 |
| 38. | Brecksville | 0.32% | 0.062%(+0.254)#38 | 0.067%(+0.249)#941 |
| 39. | Delshire | 0.31% | 0.062%(+0.246)#39 | 0.067%(+0.241)#960 |
| 40. | Brookside | 0.30% | 0.062%(+0.239)#40 | 0.067%(+0.234)#974 |
| 41. | North Bend | 0.30% | 0.062%(+0.236)#41 | 0.067%(+0.232)#982 |
| 42. | Richville | 0.30% | 0.062%(+0.236)#42 | 0.067%(+0.231)#984 |
| 43. | Wellsville | 0.29% | 0.062%(+0.227)#43 | 0.067%(+0.223)#1,008 |
| 44. | Canal Fulton | 0.28% | 0.062%(+0.220)#44 | 0.067%(+0.216)#1,033 |
| 45. | Wayne | 0.28% | 0.062%(+0.216)#45 | 0.067%(+0.212)#1,043 |
| 46. | Mechanicsburg | 0.27% | 0.062%(+0.207)#46 | 0.067%(+0.202)#1,063 |
| 47. | Swanton | 0.27% | 0.062%(+0.204)#47 | 0.067%(+0.200)#1,076 |
| 48. | Lakewood | 0.26% | 0.062%(+0.201)#48 | 0.067%(+0.196)#1,088 |
| 49. | Willoughby | 0.25% | 0.062%(+0.190)#49 | 0.067%(+0.185)#1,113 |
| 50. | Akron | 0.25% | 0.062%(+0.188)#50 | 0.067%(+0.184)#1,120 |
| 51. | North Olmsted | 0.24% | 0.062%(+0.177)#51 | 0.067%(+0.172)#1,164 |
| 52. | New Franklin | 0.23% | 0.062%(+0.169)#52 | 0.067%(+0.164)#1,190 |
| 53. | Silver Lake | 0.23% | 0.062%(+0.167)#53 | 0.067%(+0.162)#1,195 |
| 54. | Hilliard | 0.23% | 0.062%(+0.165)#54 | 0.067%(+0.161)#1,199 |
| 55. | Montrose Ghent | 0.22% | 0.062%(+0.160)#55 | 0.067%(+0.156)#1,213 |
| 56. | Brooklyn | 0.22% | 0.062%(+0.160)#56 | 0.067%(+0.156)#1,214 |
| 57. | Orwell | 0.22% | 0.062%(+0.160)#57 | 0.067%(+0.155)#1,216 |
| 58. | North Kingsville | 0.22% | 0.062%(+0.156)#58 | 0.067%(+0.152)#1,229 |
| 59. | Portage Lakes | 0.22% | 0.062%(+0.156)#59 | 0.067%(+0.151)#1,231 |
| 60. | Fremont | 0.21% | 0.062%(+0.152)#60 | 0.067%(+0.147)#1,249 |
| 61. | Johnstown | 0.21% | 0.062%(+0.150)#61 | 0.067%(+0.146)#1,255 |
| 62. | Mansfield | 0.21% | 0.062%(+0.150)#62 | 0.067%(+0.146)#1,256 |
| 63. | Willoughby Hills | 0.21% | 0.062%(+0.149)#63 | 0.067%(+0.144)#1,263 |
| 64. | Bedford Heights | 0.21% | 0.062%(+0.148)#64 | 0.067%(+0.144)#1,266 |
| 65. | Sugarcreek | 0.21% | 0.062%(+0.146)#65 | 0.067%(+0.142)#1,271 |
| 66. | Lithopolis | 0.21% | 0.062%(+0.146)#66 | 0.067%(+0.142)#1,272 |
| 67. | Marblehead | 0.21% | 0.062%(+0.146)#67 | 0.067%(+0.141)#1,273 |
| 68. | Kettering | 0.21% | 0.062%(+0.144)#68 | 0.067%(+0.140)#1,283 |
| 69. | Cuyahoga Falls | 0.20% | 0.062%(+0.142)#69 | 0.067%(+0.138)#1,291 |
| 70. | Bolindale | 0.20% | 0.062%(+0.137)#70 | 0.067%(+0.133)#1,311 |
| 71. | Howland Center | 0.19% | 0.062%(+0.129)#71 | 0.067%(+0.125)#1,342 |
| 72. | Dennison | 0.19% | 0.062%(+0.126)#72 | 0.067%(+0.122)#1,359 |
| 73. | Mount Carmel | 0.18% | 0.062%(+0.121)#73 | 0.067%(+0.116)#1,382 |
| 74. | Reedurban | 0.18% | 0.062%(+0.120)#74 | 0.067%(+0.116)#1,385 |
| 75. | Wauseon | 0.18% | 0.062%(+0.116)#75 | 0.067%(+0.112)#1,406 |
| 76. | Huber Heights | 0.17% | 0.062%(+0.112)#76 | 0.067%(+0.108)#1,428 |
| 77. | Frankfort | 0.16% | 0.062%(+0.100)#77 | 0.067%(+0.096)#1,490 |
| 78. | Miamisburg | 0.16% | 0.062%(+0.099)#78 | 0.067%(+0.094)#1,500 |
| 79. | Euclid | 0.16% | 0.062%(+0.096)#79 | 0.067%(+0.092)#1,513 |
| 80. | Warren | 0.16% | 0.062%(+0.094)#80 | 0.067%(+0.089)#1,531 |
| 81. | Sandusky | 0.15% | 0.062%(+0.090)#81 | 0.067%(+0.086)#1,551 |
| 82. | Tallmadge | 0.15% | 0.062%(+0.090)#82 | 0.067%(+0.086)#1,554 |
| 83. | South Russell | 0.15% | 0.062%(+0.089)#83 | 0.067%(+0.085)#1,556 |
| 84. | Newtown | 0.15% | 0.062%(+0.087)#84 | 0.067%(+0.082)#1,561 |
| 85. | Grand River | 0.15% | 0.062%(+0.086)#85 | 0.067%(+0.081)#1,568 |
| 86. | Worthington | 0.15% | 0.062%(+0.085)#86 | 0.067%(+0.080)#1,577 |
| 87. | Uniontown | 0.14% | 0.062%(+0.082)#87 | 0.067%(+0.077)#1,599 |
| 88. | Delaware | 0.14% | 0.062%(+0.081)#88 | 0.067%(+0.077)#1,606 |
| 89. | Avon Lake | 0.13% | 0.062%(+0.073)#89 | 0.067%(+0.068)#1,653 |
| 90. | Marietta | 0.13% | 0.062%(+0.073)#90 | 0.067%(+0.068)#1,655 |
| 91. | Upper Arlington | 0.13% | 0.062%(+0.069)#91 | 0.067%(+0.065)#1,674 |
| 92. | Fairlawn | 0.13% | 0.062%(+0.068)#92 | 0.067%(+0.063)#1,687 |
| 93. | Bryan | 0.13% | 0.062%(+0.065)#93 | 0.067%(+0.060)#1,702 |
| 94. | Stow | 0.12% | 0.062%(+0.060)#94 | 0.067%(+0.055)#1,735 |
| 95. | Oregon | 0.12% | 0.062%(+0.059)#95 | 0.067%(+0.054)#1,739 |
| 96. | Uhrichsville | 0.11% | 0.062%(+0.053)#96 | 0.067%(+0.048)#1,788 |
| 97. | Tiffin | 0.11% | 0.062%(+0.044)#97 | 0.067%(+0.040)#1,848 |
| 98. | Valley View | 0.10% | 0.062%(+0.043)#98 | 0.067%(+0.038)#1,859 |
| 99. | Parma Heights | 0.10% | 0.062%(+0.039)#99 | 0.067%(+0.035)#1,887 |
| 100. | Oberlin | 0.098% | 0.062%(+0.036)#100 | 0.067%(+0.031)#1,921 |
Common Questions
What are the Top 10 Cities with the Highest Percentage of Yugoslavian Population in Ohio?
Top 10 Cities with the Highest Percentage of Yugoslavian Population in Ohio are:
#1
4.86%
#2
3.03%
#3
2.81%
#4
1.72%
#5
1.63%
#6
1.46%
#7
1.11%
#8
1.01%
#9
0.98%
#10
0.88%
What city has the Highest Percentage of Yugoslavian Population in Ohio?
Darrtown has the Highest Percentage of Yugoslavian Population in Ohio with 4.86%.
What is the Percentage of Yugoslavian Population in the State of Ohio?
Percentage of Yugoslavian Population in Ohio is 0.062%.
What is the Percentage of Yugoslavian Population in the United States?
Percentage of Yugoslavian Population in the United States is 0.067%.