Cities with the Highest Percentage of Self-Employed / Incorporated in Ohio
RELATED REPORTS & OPTIONS
Self-Employed / Incorporated
Ohio
Compare Cities
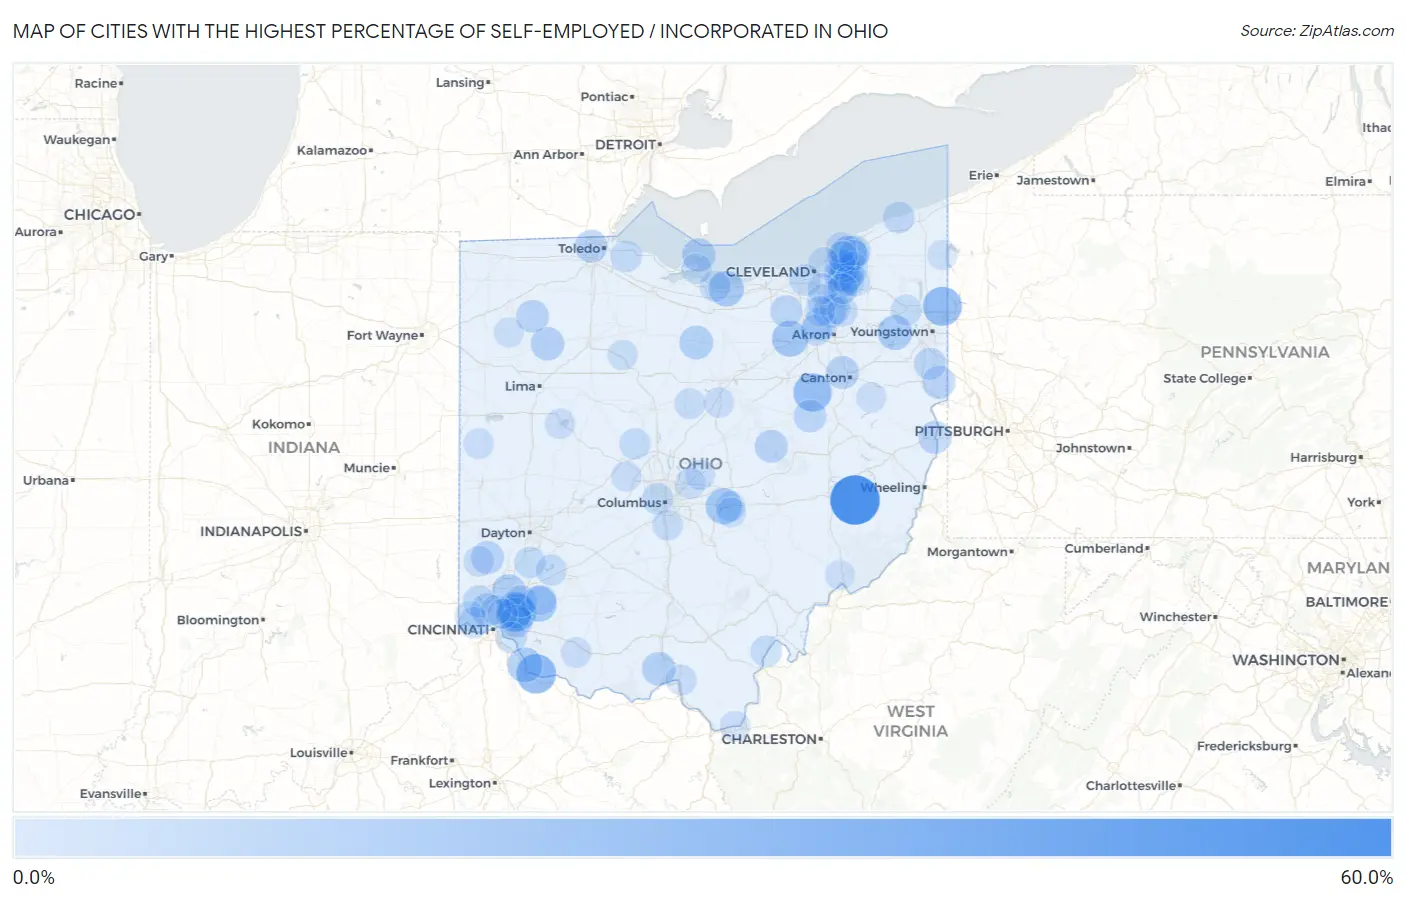
Map of Cities with the Highest Percentage of Self-Employed / Incorporated in Ohio
0.0%
60.0%
Cities with the Highest Percentage of Self-Employed / Incorporated in Ohio
| City | % Self-Employed / Incorporated | vs State | vs National | |
| 1. | Salesville | 53.1% | 3.0%(+50.1)#1 | 3.8%(+49.3)#77 |
| 2. | Chilo | 28.6% | 3.0%(+25.5)#2 | 3.8%(+24.8)#285 |
| 3. | Yankee Lake | 27.3% | 3.0%(+24.2)#3 | 3.8%(+23.5)#318 |
| 4. | Mount Eaton | 25.6% | 3.0%(+22.6)#4 | 3.8%(+21.8)#363 |
| 5. | Miamiville | 24.1% | 3.0%(+21.0)#5 | 3.8%(+20.3)#412 |
| 6. | Waite Hill | 20.8% | 3.0%(+17.8)#6 | 3.8%(+17.0)#559 |
| 7. | Buckeye Lake | 20.8% | 3.0%(+17.8)#7 | 3.8%(+17.0)#561 |
| 8. | Remington | 20.6% | 3.0%(+17.6)#8 | 3.8%(+16.8)#572 |
| 9. | Gloria Glens Park | 20.4% | 3.0%(+17.4)#9 | 3.8%(+16.6)#587 |
| 10. | Pleasant Plain | 19.6% | 3.0%(+16.6)#10 | 3.8%(+15.8)#651 |
| 11. | Sharon Center | 19.3% | 3.0%(+16.2)#11 | 3.8%(+15.4)#675 |
| 12. | Mitiwanga | 18.9% | 3.0%(+15.9)#12 | 3.8%(+15.1)#705 |
| 13. | Moscow | 18.2% | 3.0%(+15.2)#13 | 3.8%(+14.4)#773 |
| 14. | Hunting Valley | 17.7% | 3.0%(+14.7)#14 | 3.8%(+13.9)#803 |
| 15. | Lake Milton | 17.4% | 3.0%(+14.4)#15 | 3.8%(+13.6)#824 |
| 16. | The Village Of Indian Hill | 16.4% | 3.0%(+13.4)#16 | 3.8%(+12.6)#910 |
| 17. | Wetherington | 15.9% | 3.0%(+12.9)#17 | 3.8%(+12.1)#953 |
| 18. | Celeryville | 15.2% | 3.0%(+12.2)#18 | 3.8%(+11.4)#1,045 |
| 19. | Mcdermott | 14.6% | 3.0%(+11.6)#19 | 3.8%(+10.8)#1,127 |
| 20. | Ottawa | 14.5% | 3.0%(+11.5)#20 | 3.8%(+10.7)#1,141 |
| 21. | Kelleys Island | 14.5% | 3.0%(+11.4)#21 | 3.8%(+10.6)#1,154 |
| 22. | Skyline Acres | 14.0% | 3.0%(+11.0)#22 | 3.8%(+10.2)#1,226 |
| 23. | West Elkton | 13.6% | 3.0%(+10.5)#23 | 3.8%(+9.74)#1,313 |
| 24. | Hills And Dales | 13.5% | 3.0%(+10.5)#24 | 3.8%(+9.67)#1,328 |
| 25. | Peninsula | 13.5% | 3.0%(+10.4)#25 | 3.8%(+9.64)#1,334 |
| 26. | Lake Tomahawk | 13.4% | 3.0%(+10.4)#26 | 3.8%(+9.59)#1,341 |
| 27. | Nellie | 13.3% | 3.0%(+10.3)#27 | 3.8%(+9.52)#1,353 |
| 28. | Montrose Ghent | 13.2% | 3.0%(+10.1)#28 | 3.8%(+9.36)#1,395 |
| 29. | Ottawa Hills | 13.2% | 3.0%(+10.1)#29 | 3.8%(+9.34)#1,403 |
| 30. | Pottery Addition | 13.0% | 3.0%(+9.96)#30 | 3.8%(+9.17)#1,427 |
| 31. | Moreland Hills | 12.9% | 3.0%(+9.91)#31 | 3.8%(+9.12)#1,435 |
| 32. | New Bavaria | 12.9% | 3.0%(+9.87)#32 | 3.8%(+9.09)#1,447 |
| 33. | Walnut Creek | 12.4% | 3.0%(+9.37)#33 | 3.8%(+8.58)#1,561 |
| 34. | Terrace Park | 12.3% | 3.0%(+9.23)#34 | 3.8%(+8.45)#1,587 |
| 35. | Pepper Pike | 11.6% | 3.0%(+8.60)#35 | 3.8%(+7.81)#1,755 |
| 36. | Pekin | 11.6% | 3.0%(+8.56)#36 | 3.8%(+7.77)#1,770 |
| 37. | Columbiana | 11.6% | 3.0%(+8.54)#37 | 3.8%(+7.75)#1,775 |
| 38. | Valley City | 11.2% | 3.0%(+8.18)#38 | 3.8%(+7.39)#1,870 |
| 39. | Maria Stein | 11.0% | 3.0%(+8.00)#39 | 3.8%(+7.21)#1,929 |
| 40. | Loveland Park | 10.9% | 3.0%(+7.92)#40 | 3.8%(+7.13)#1,957 |
| 41. | Gates Mills | 10.7% | 3.0%(+7.65)#41 | 3.8%(+6.86)#2,036 |
| 42. | Dunlap | 10.6% | 3.0%(+7.61)#42 | 3.8%(+6.82)#2,057 |
| 43. | Middlebranch | 10.5% | 3.0%(+7.49)#43 | 3.8%(+6.70)#2,099 |
| 44. | Kirtland Hills | 10.4% | 3.0%(+7.41)#44 | 3.8%(+6.63)#2,124 |
| 45. | Geneva On The Lake | 10.4% | 3.0%(+7.37)#45 | 3.8%(+6.58)#2,145 |
| 46. | Marble Cliff | 10.3% | 3.0%(+7.30)#46 | 3.8%(+6.51)#2,163 |
| 47. | Linndale | 10.2% | 3.0%(+7.21)#47 | 3.8%(+6.42)#2,189 |
| 48. | Chesterland | 10.0% | 3.0%(+7.01)#48 | 3.8%(+6.22)#2,261 |
| 49. | Pigeon Creek | 10.0% | 3.0%(+7.00)#49 | 3.8%(+6.21)#2,268 |
| 50. | Cheshire | 10.0% | 3.0%(+6.97)#50 | 3.8%(+6.18)#2,287 |
| 51. | Coldstream | 9.9% | 3.0%(+6.89)#51 | 3.8%(+6.10)#2,328 |
| 52. | Newport Cdp Shelby County | 9.9% | 3.0%(+6.86)#52 | 3.8%(+6.07)#2,338 |
| 53. | Five Points | 9.9% | 3.0%(+6.84)#53 | 3.8%(+6.05)#2,345 |
| 54. | Williston | 9.8% | 3.0%(+6.75)#54 | 3.8%(+5.97)#2,380 |
| 55. | Saybrook-On-The-Lake | 9.5% | 3.0%(+6.42)#55 | 3.8%(+5.64)#2,498 |
| 56. | Mack | 9.4% | 3.0%(+6.39)#56 | 3.8%(+5.60)#2,512 |
| 57. | Leavittsburg | 9.4% | 3.0%(+6.37)#57 | 3.8%(+5.58)#2,521 |
| 58. | Magnetic Springs | 9.4% | 3.0%(+6.35)#58 | 3.8%(+5.56)#2,531 |
| 59. | Harveysburg | 9.2% | 3.0%(+6.18)#59 | 3.8%(+5.39)#2,596 |
| 60. | Huron | 9.0% | 3.0%(+5.96)#60 | 3.8%(+5.17)#2,722 |
| 61. | New Springfield | 8.8% | 3.0%(+5.77)#61 | 3.8%(+4.99)#2,824 |
| 62. | Candlewood Lake | 8.8% | 3.0%(+5.74)#62 | 3.8%(+4.95)#2,841 |
| 63. | Highland Heights | 8.6% | 3.0%(+5.55)#63 | 3.8%(+4.76)#2,934 |
| 64. | Glenwillow | 8.4% | 3.0%(+5.41)#64 | 3.8%(+4.62)#3,028 |
| 65. | Brecksville | 8.4% | 3.0%(+5.40)#65 | 3.8%(+4.61)#3,031 |
| 66. | Lockbourne | 8.3% | 3.0%(+5.31)#66 | 3.8%(+4.52)#3,094 |
| 67. | Sciotodale | 8.3% | 3.0%(+5.26)#67 | 3.8%(+4.47)#3,131 |
| 68. | Somerville | 8.3% | 3.0%(+5.24)#68 | 3.8%(+4.45)#3,154 |
| 69. | Lakeline | 8.3% | 3.0%(+5.23)#69 | 3.8%(+4.44)#3,162 |
| 70. | Boston Heights | 8.1% | 3.0%(+5.08)#70 | 3.8%(+4.30)#3,260 |
| 71. | Chagrin Falls | 8.1% | 3.0%(+5.04)#71 | 3.8%(+4.25)#3,287 |
| 72. | Bratenahl | 8.1% | 3.0%(+5.03)#72 | 3.8%(+4.25)#3,296 |
| 73. | Lake Waynoka | 8.0% | 3.0%(+5.00)#73 | 3.8%(+4.21)#3,323 |
| 74. | Burkettsville | 8.0% | 3.0%(+5.00)#74 | 3.8%(+4.21)#3,325 |
| 75. | Proctorville | 8.0% | 3.0%(+4.99)#75 | 3.8%(+4.20)#3,328 |
| 76. | Valley View | 8.0% | 3.0%(+4.99)#76 | 3.8%(+4.20)#3,329 |
| 77. | Grandview | 8.0% | 3.0%(+4.97)#77 | 3.8%(+4.18)#3,334 |
| 78. | Unionville Center | 8.0% | 3.0%(+4.94)#78 | 3.8%(+4.15)#3,362 |
| 79. | New Albany | 8.0% | 3.0%(+4.93)#79 | 3.8%(+4.14)#3,368 |
| 80. | Kirtland | 7.9% | 3.0%(+4.87)#80 | 3.8%(+4.09)#3,399 |
| 81. | Hudson | 7.9% | 3.0%(+4.83)#81 | 3.8%(+4.05)#3,433 |
| 82. | Johnstown | 7.8% | 3.0%(+4.77)#82 | 3.8%(+3.98)#3,496 |
| 83. | Richfield | 7.8% | 3.0%(+4.76)#83 | 3.8%(+3.97)#3,501 |
| 84. | Harbor Hills | 7.8% | 3.0%(+4.72)#84 | 3.8%(+3.93)#3,524 |
| 85. | South Russell | 7.7% | 3.0%(+4.64)#85 | 3.8%(+3.86)#3,599 |
| 86. | Marblehead | 7.7% | 3.0%(+4.64)#86 | 3.8%(+3.85)#3,604 |
| 87. | Lakeview | 7.7% | 3.0%(+4.63)#87 | 3.8%(+3.84)#3,609 |
| 88. | Willoughby Hills | 7.6% | 3.0%(+4.61)#88 | 3.8%(+3.83)#3,622 |
| 89. | Bellville | 7.6% | 3.0%(+4.59)#89 | 3.8%(+3.80)#3,646 |
| 90. | Butlerville | 7.5% | 3.0%(+4.50)#90 | 3.8%(+3.71)#3,715 |
| 91. | Solon | 7.4% | 3.0%(+4.37)#91 | 3.8%(+3.58)#3,825 |
| 92. | Carey | 7.3% | 3.0%(+4.28)#92 | 3.8%(+3.49)#3,904 |
| 93. | Wyoming | 7.3% | 3.0%(+4.26)#93 | 3.8%(+3.47)#3,918 |
| 94. | Lake Mohawk | 7.3% | 3.0%(+4.25)#94 | 3.8%(+3.46)#3,929 |
| 95. | Oakwood | 7.2% | 3.0%(+4.16)#95 | 3.8%(+3.37)#4,009 |
| 96. | Amberley | 7.2% | 3.0%(+4.13)#96 | 3.8%(+3.34)#4,032 |
| 97. | North Lima | 7.1% | 3.0%(+4.04)#97 | 3.8%(+3.25)#4,109 |
| 98. | Thornville | 7.1% | 3.0%(+4.03)#98 | 3.8%(+3.24)#4,116 |
| 99. | Devola | 7.0% | 3.0%(+3.95)#99 | 3.8%(+3.16)#4,192 |
| 100. | Andover | 6.9% | 3.0%(+3.87)#100 | 3.8%(+3.08)#4,266 |
Common Questions
What are the Top 10 Cities with the Highest Percentage of Self-Employed / Incorporated in Ohio?
Top 10 Cities with the Highest Percentage of Self-Employed / Incorporated in Ohio are:
#1
53.1%
#2
28.6%
#3
27.3%
#4
25.6%
#5
24.1%
#6
20.8%
#7
20.8%
#8
20.6%
#9
20.4%
#10
19.6%
What city has the Highest Percentage of Self-Employed / Incorporated in Ohio?
Salesville has the Highest Percentage of Self-Employed / Incorporated in Ohio with 53.1%.
What is the Percentage of Self-Employed / Incorporated in the State of Ohio?
Percentage of Self-Employed / Incorporated in Ohio is 3.0%.
What is the Percentage of Self-Employed / Incorporated in the United States?
Percentage of Self-Employed / Incorporated in the United States is 3.8%.