Woodlawn, OH Map & Demographics
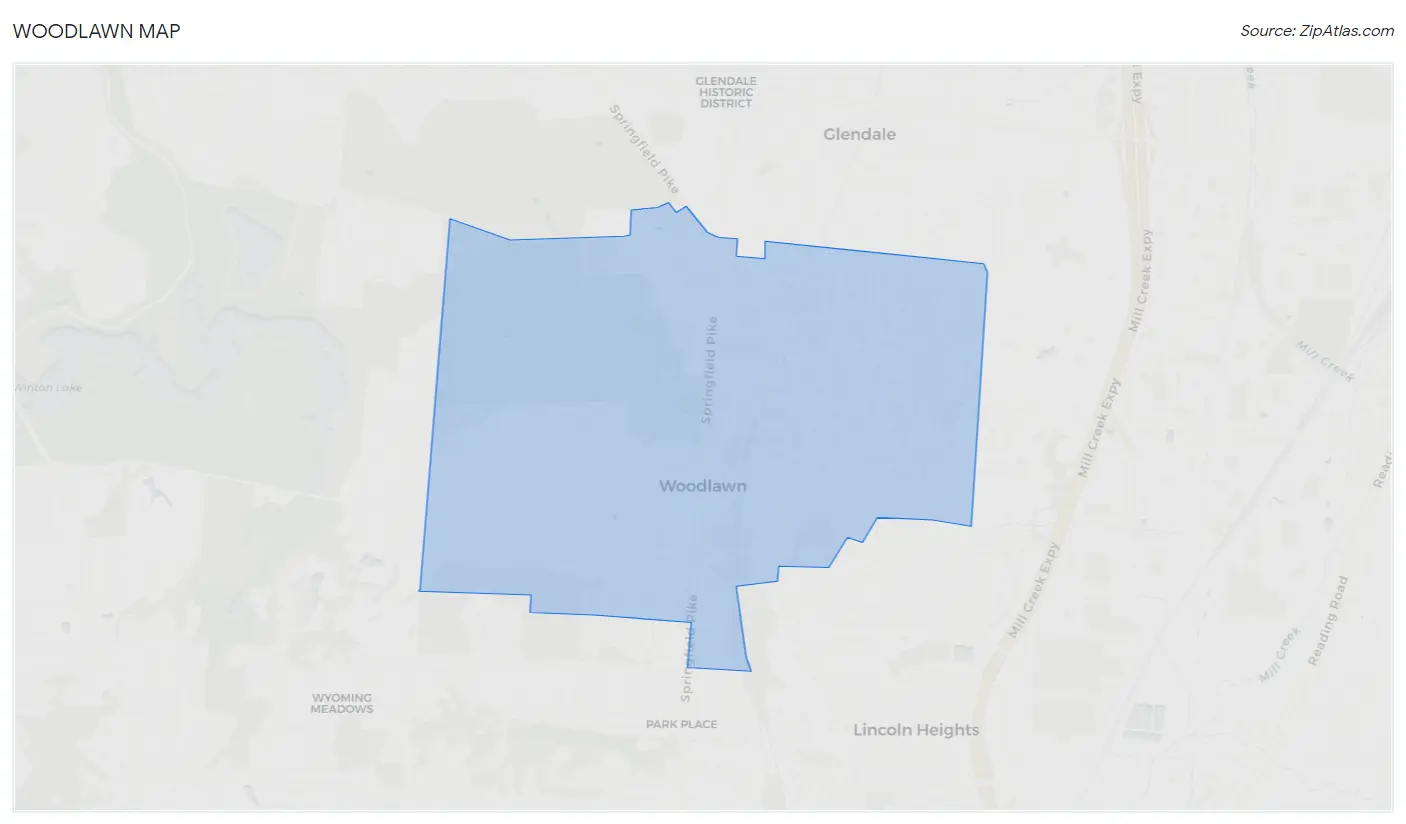
Woodlawn Map
Woodlawn Overview
$32,732
PER CAPITA INCOME
$66,750
AVG FAMILY INCOME
$59,977
AVG HOUSEHOLD INCOME
3.3%
WAGE / INCOME GAP [ % ]
96.7¢/ $1
WAGE / INCOME GAP [ $ ]
0.37
INEQUALITY / GINI INDEX
3,862
TOTAL POPULATION
1,541
MALE POPULATION
2,321
FEMALE POPULATION
66.39
MALES / 100 FEMALES
150.62
FEMALES / 100 MALES
39.7
MEDIAN AGE
3.1
AVG FAMILY SIZE
2.1
AVG HOUSEHOLD SIZE
2,268
LABOR FORCE [ PEOPLE ]
70.0%
PERCENT IN LABOR FORCE
3.0%
UNEMPLOYMENT RATE
Income in Woodlawn
Income Overview in Woodlawn
Per Capita Income in Woodlawn is $32,732, while median incomes of families and households are $66,750 and $59,977 respectively.
| Characteristic | Number | Measure |
| Per Capita Income | 3,862 | $32,732 |
| Median Family Income | 813 | $66,750 |
| Mean Family Income | 813 | $71,938 |
| Median Household Income | 1,758 | $59,977 |
| Mean Household Income | 1,758 | $69,318 |
| Income Deficit | 813 | $0 |
| Wage / Income Gap (%) | 3,862 | 3.32% |
| Wage / Income Gap ($) | 3,862 | 96.68¢ per $1 |
| Gini / Inequality Index | 3,862 | 0.37 |
Earnings by Sex in Woodlawn
Average Earnings in Woodlawn are $36,532, $36,981 for men and $35,754 for women, a difference of 3.3%.
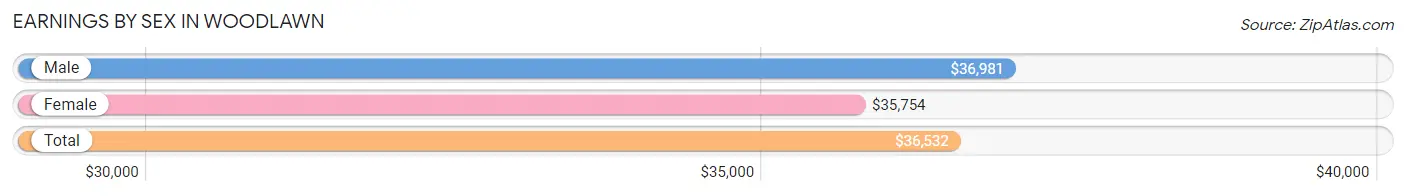
| Sex | Number | Average Earnings |
| Male | 1,095 (47.6%) | $36,981 |
| Female | 1,207 (52.4%) | $35,754 |
| Total | 2,302 (100.0%) | $36,532 |
Earnings by Sex by Income Bracket in Woodlawn
The most common earnings brackets in Woodlawn are $25,000 to $29,999 for men (147 | 13.4%) and $55,000 to $64,999 for women (130 | 10.8%).
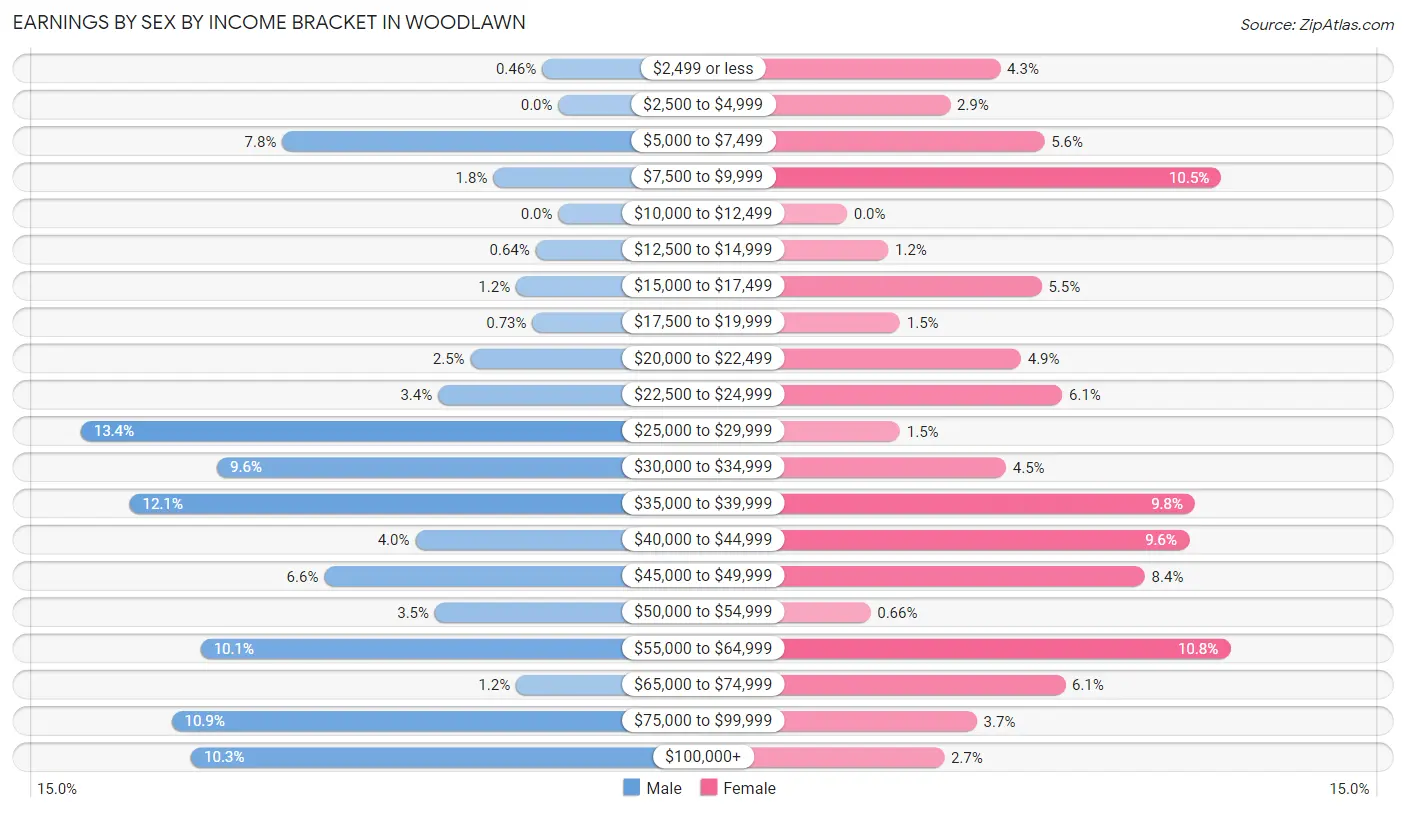
| Income | Male | Female |
| $2,499 or less | 5 (0.5%) | 52 (4.3%) |
| $2,500 to $4,999 | 0 (0.0%) | 35 (2.9%) |
| $5,000 to $7,499 | 85 (7.8%) | 67 (5.6%) |
| $7,500 to $9,999 | 20 (1.8%) | 127 (10.5%) |
| $10,000 to $12,499 | 0 (0.0%) | 0 (0.0%) |
| $12,500 to $14,999 | 7 (0.6%) | 14 (1.2%) |
| $15,000 to $17,499 | 13 (1.2%) | 66 (5.5%) |
| $17,500 to $19,999 | 8 (0.7%) | 18 (1.5%) |
| $20,000 to $22,499 | 27 (2.5%) | 59 (4.9%) |
| $22,500 to $24,999 | 37 (3.4%) | 73 (6.0%) |
| $25,000 to $29,999 | 147 (13.4%) | 18 (1.5%) |
| $30,000 to $34,999 | 105 (9.6%) | 54 (4.5%) |
| $35,000 to $39,999 | 132 (12.0%) | 118 (9.8%) |
| $40,000 to $44,999 | 44 (4.0%) | 116 (9.6%) |
| $45,000 to $49,999 | 72 (6.6%) | 101 (8.4%) |
| $50,000 to $54,999 | 38 (3.5%) | 8 (0.7%) |
| $55,000 to $64,999 | 110 (10.1%) | 130 (10.8%) |
| $65,000 to $74,999 | 13 (1.2%) | 74 (6.1%) |
| $75,000 to $99,999 | 119 (10.9%) | 44 (3.6%) |
| $100,000+ | 113 (10.3%) | 33 (2.7%) |
| Total | 1,095 (100.0%) | 1,207 (100.0%) |
Earnings by Sex by Educational Attainment in Woodlawn
Average earnings in Woodlawn are $41,318 for men and $39,150 for women, a difference of 5.2%. Men with an educational attainment of graduate degree enjoy the highest average annual earnings of $93,017, while those with high school diploma education earn the least with $34,423. Women with an educational attainment of bachelor's degree earn the most with the average annual earnings of $57,977, while those with college or associate's degree education have the smallest earnings of $35,859.
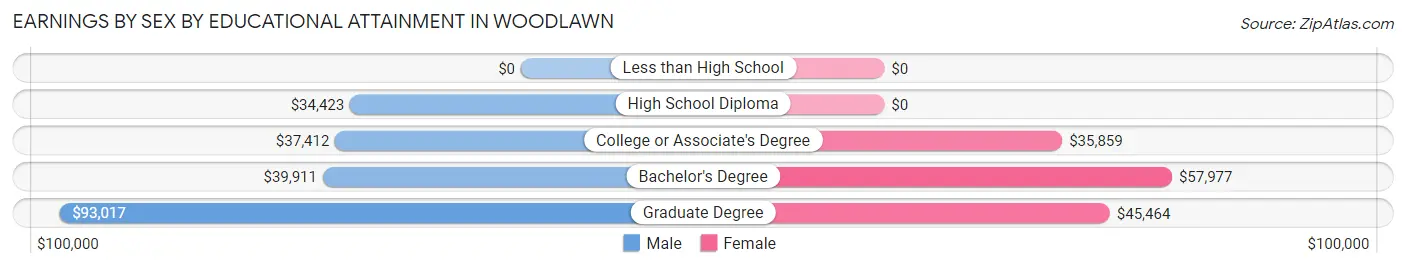
| Educational Attainment | Male Income | Female Income |
| Less than High School | - | - |
| High School Diploma | $34,423 | $0 |
| College or Associate's Degree | $37,412 | $35,859 |
| Bachelor's Degree | $39,911 | $57,977 |
| Graduate Degree | $93,017 | $45,464 |
| Total | $41,318 | $39,150 |
Family Income in Woodlawn
Family Income Brackets in Woodlawn
According to the Woodlawn family income data, there are 181 families falling into the $75,000 to $99,999 income range, which is the most common income bracket and makes up 22.3% of all families.
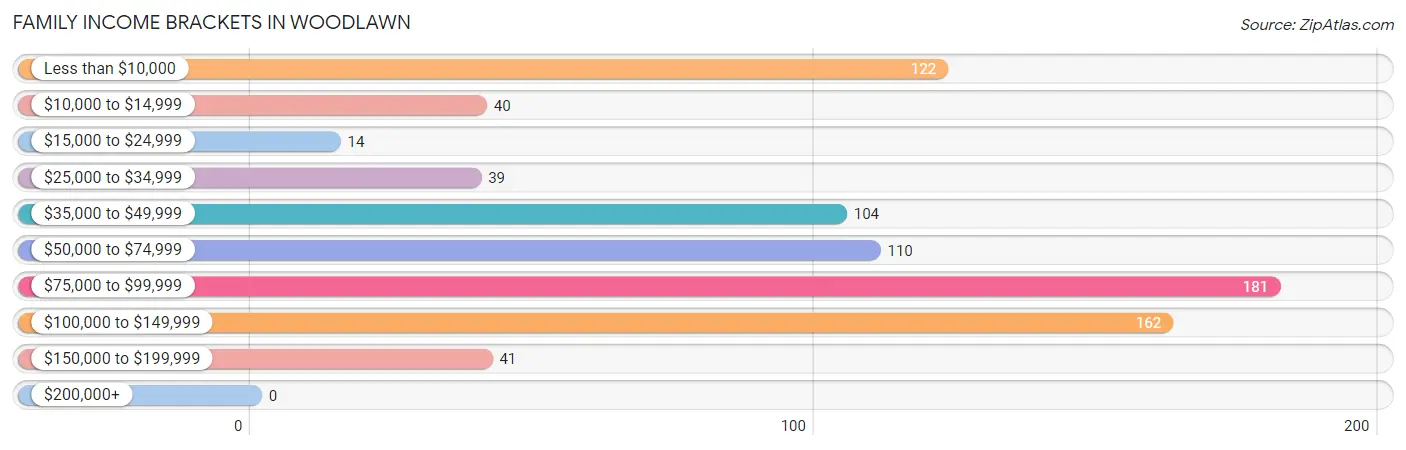
| Income Bracket | # Families | % Families |
| Less than $10,000 | 122 | 15.0% |
| $10,000 to $14,999 | 40 | 4.9% |
| $15,000 to $24,999 | 14 | 1.7% |
| $25,000 to $34,999 | 39 | 4.8% |
| $35,000 to $49,999 | 104 | 12.8% |
| $50,000 to $74,999 | 110 | 13.5% |
| $75,000 to $99,999 | 181 | 22.3% |
| $100,000 to $149,999 | 162 | 19.9% |
| $150,000 to $199,999 | 41 | 5.0% |
| $200,000+ | 0 | 0.0% |
Family Income by Famaliy Size in Woodlawn
5-person families (123 | 15.1%) account for the highest median family income in Woodlawn with $96,820 per family, while 2-person families (354 | 43.5%) have the highest median income of $37,143 per family member.
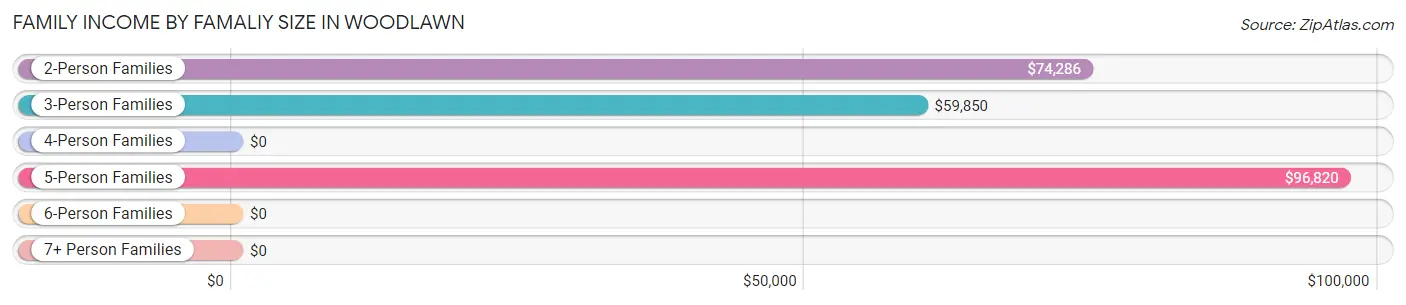
| Income Bracket | # Families | Median Income |
| 2-Person Families | 354 (43.5%) | $74,286 |
| 3-Person Families | 195 (24.0%) | $59,850 |
| 4-Person Families | 141 (17.3%) | $0 |
| 5-Person Families | 123 (15.1%) | $96,820 |
| 6-Person Families | 0 (0.0%) | $0 |
| 7+ Person Families | 0 (0.0%) | $0 |
| Total | 813 (100.0%) | $66,750 |
Family Income by Number of Earners in Woodlawn
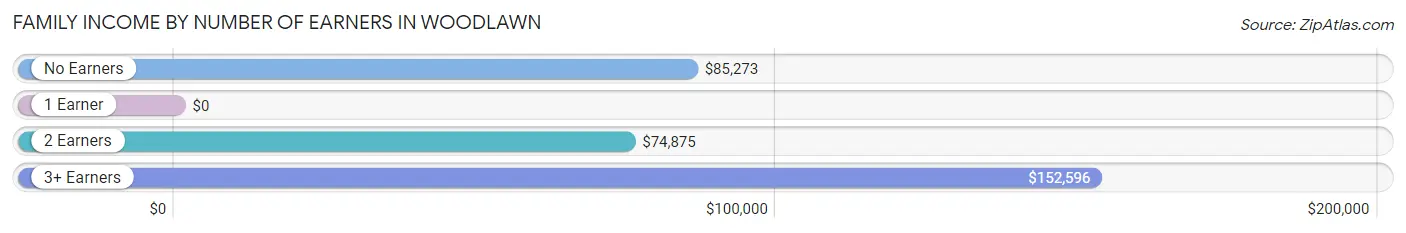
| Number of Earners | # Families | Median Income |
| No Earners | 77 (9.5%) | $85,273 |
| 1 Earner | 238 (29.3%) | $0 |
| 2 Earners | 453 (55.7%) | $74,875 |
| 3+ Earners | 45 (5.5%) | $152,596 |
| Total | 813 (100.0%) | $66,750 |
Household Income in Woodlawn
Household Income Brackets in Woodlawn
With 415 households falling in the category, the $50,000 to $74,999 income range is the most frequent in Woodlawn, accounting for 23.6% of all households. In contrast, only 11 households (0.6%) fall into the $200,000+ income bracket, making it the least populous group.
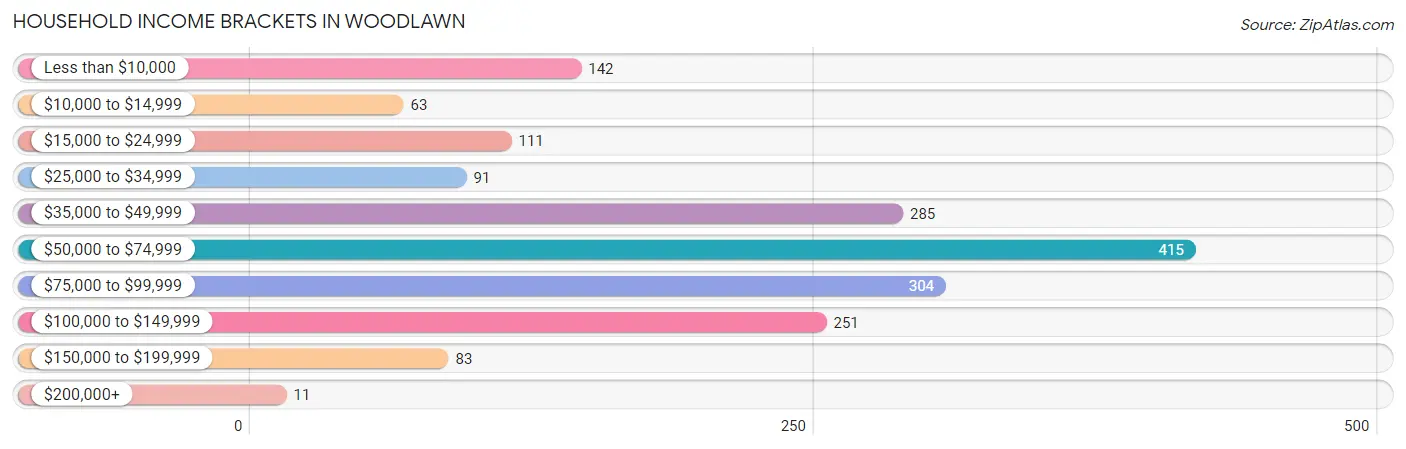
| Income Bracket | # Households | % Households |
| Less than $10,000 | 142 | 8.1% |
| $10,000 to $14,999 | 63 | 3.6% |
| $15,000 to $24,999 | 111 | 6.3% |
| $25,000 to $34,999 | 91 | 5.2% |
| $35,000 to $49,999 | 285 | 16.2% |
| $50,000 to $74,999 | 415 | 23.6% |
| $75,000 to $99,999 | 304 | 17.3% |
| $100,000 to $149,999 | 251 | 14.3% |
| $150,000 to $199,999 | 83 | 4.7% |
| $200,000+ | 11 | 0.6% |
Household Income by Householder Age in Woodlawn
The median household income in Woodlawn is $59,977, with the highest median household income of $66,953 found in the 45 to 64 years age bracket for the primary householder. A total of 504 households (28.7%) fall into this category. Meanwhile, the 65+ years age bracket for the primary householder has the lowest median household income of $52,530, with 527 households (30.0%) in this group.
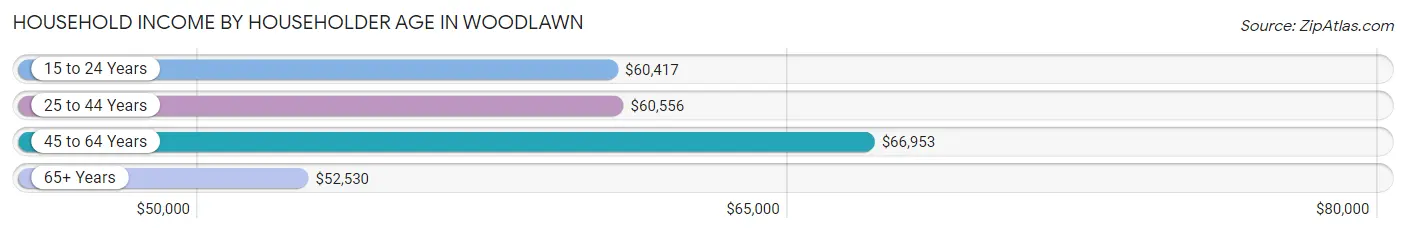
| Income Bracket | # Households | Median Income |
| 15 to 24 Years | 49 (2.8%) | $60,417 |
| 25 to 44 Years | 678 (38.6%) | $60,556 |
| 45 to 64 Years | 504 (28.7%) | $66,953 |
| 65+ Years | 527 (30.0%) | $52,530 |
| Total | 1,758 (100.0%) | $59,977 |
Poverty in Woodlawn
Income Below Poverty by Sex and Age in Woodlawn
With 6.9% poverty level for males and 24.2% for females among the residents of Woodlawn, 6 to 11 year old males and 15 year old females are the most vulnerable to poverty, with 48 males (35.6%) and 79 females (100.0%) in their respective age groups living below the poverty level.
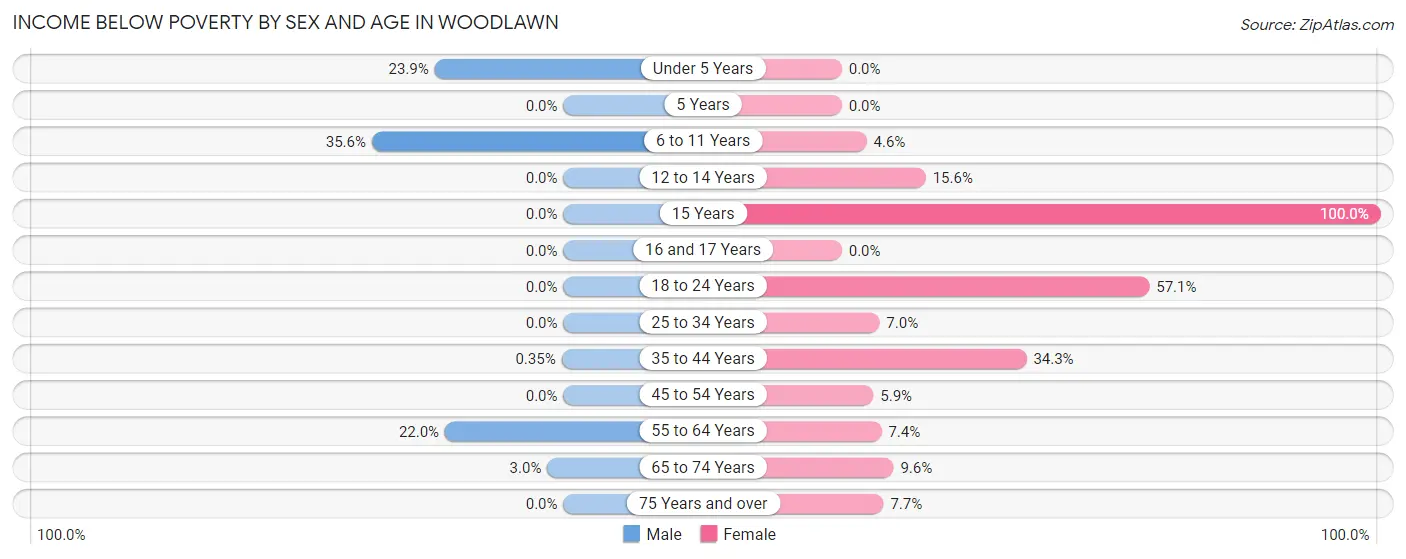
| Age Bracket | Male | Female |
| Under 5 Years | 11 (23.9%) | 0 (0.0%) |
| 5 Years | 0 (0.0%) | 0 (0.0%) |
| 6 to 11 Years | 48 (35.6%) | 11 (4.6%) |
| 12 to 14 Years | 0 (0.0%) | 12 (15.6%) |
| 15 Years | 0 (0.0%) | 79 (100.0%) |
| 16 and 17 Years | 0 (0.0%) | 0 (0.0%) |
| 18 to 24 Years | 0 (0.0%) | 242 (57.1%) |
| 25 to 34 Years | 0 (0.0%) | 12 (7.0%) |
| 35 to 44 Years | 1 (0.4%) | 122 (34.3%) |
| 45 to 54 Years | 0 (0.0%) | 16 (5.9%) |
| 55 to 64 Years | 40 (22.0%) | 14 (7.4%) |
| 65 to 74 Years | 4 (3.0%) | 21 (9.6%) |
| 75 Years and over | 0 (0.0%) | 12 (7.7%) |
| Total | 104 (6.9%) | 541 (24.2%) |
Income Above Poverty by Sex and Age in Woodlawn
According to the poverty statistics in Woodlawn, males aged 5 years and females aged under 5 years are the age groups that are most secure financially, with 100.0% of males and 100.0% of females in these age groups living above the poverty line.
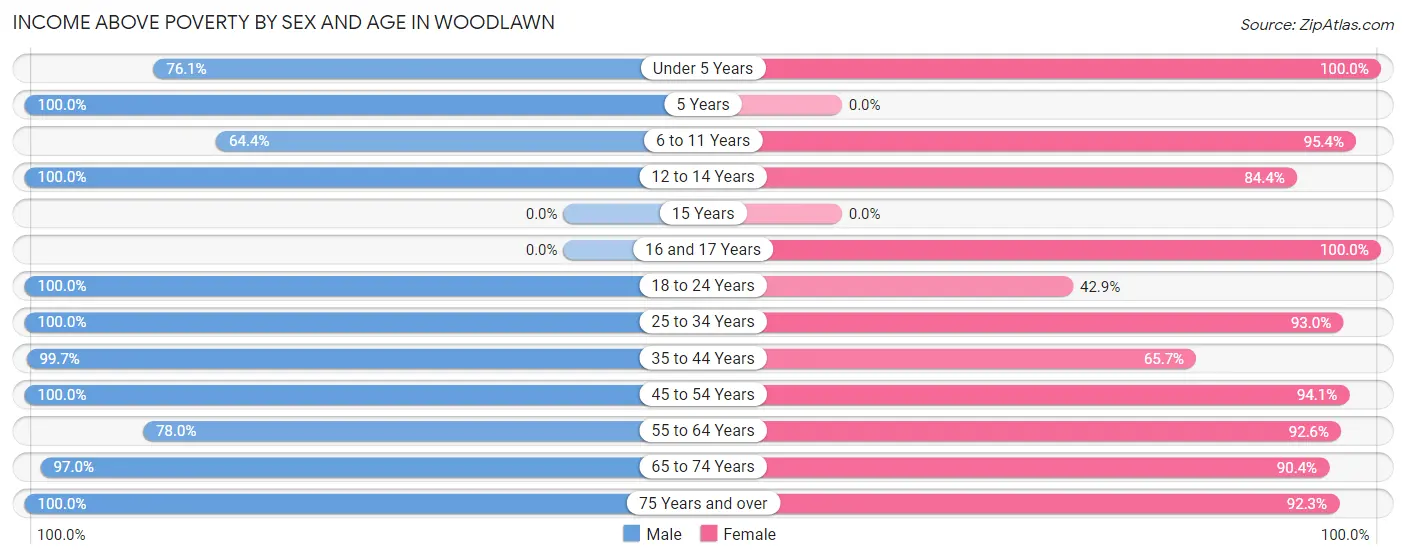
| Age Bracket | Male | Female |
| Under 5 Years | 35 (76.1%) | 14 (100.0%) |
| 5 Years | 8 (100.0%) | 0 (0.0%) |
| 6 to 11 Years | 87 (64.4%) | 228 (95.4%) |
| 12 to 14 Years | 24 (100.0%) | 65 (84.4%) |
| 15 Years | 0 (0.0%) | 0 (0.0%) |
| 16 and 17 Years | 0 (0.0%) | 41 (100.0%) |
| 18 to 24 Years | 161 (100.0%) | 182 (42.9%) |
| 25 to 34 Years | 226 (100.0%) | 160 (93.0%) |
| 35 to 44 Years | 281 (99.7%) | 234 (65.7%) |
| 45 to 54 Years | 236 (100.0%) | 257 (94.1%) |
| 55 to 64 Years | 142 (78.0%) | 176 (92.6%) |
| 65 to 74 Years | 130 (97.0%) | 198 (90.4%) |
| 75 Years and over | 74 (100.0%) | 143 (92.3%) |
| Total | 1,404 (93.1%) | 1,698 (75.8%) |
Income Below Poverty Among Married-Couple Families in Woodlawn
The poverty statistics for married-couple families in Woodlawn show that 6.6% or 30 of the total 457 families live below the poverty line. Families with 1 or 2 children have the highest poverty rate of 24.2%, comprising of 16 families. On the other hand, families with 3 or 4 children have the lowest poverty rate of 0.0%, which includes 0 families.
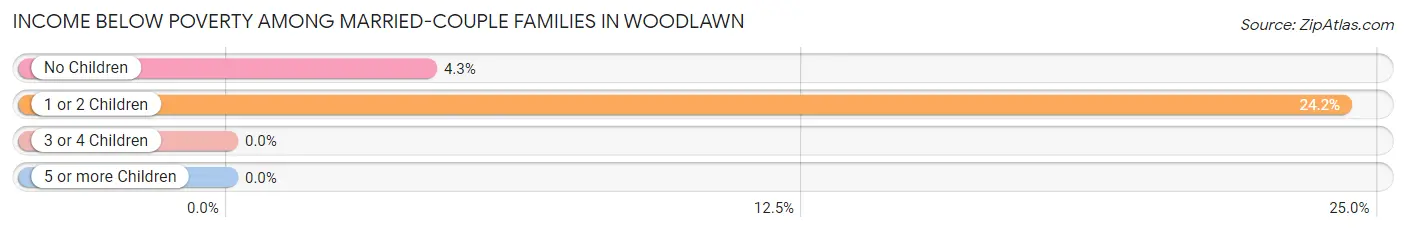
| Children | Above Poverty | Below Poverty |
| No Children | 309 (95.7%) | 14 (4.3%) |
| 1 or 2 Children | 50 (75.8%) | 16 (24.2%) |
| 3 or 4 Children | 68 (100.0%) | 0 (0.0%) |
| 5 or more Children | 0 (0.0%) | 0 (0.0%) |
| Total | 427 (93.4%) | 30 (6.6%) |
Income Below Poverty Among Single-Parent Households in Woodlawn
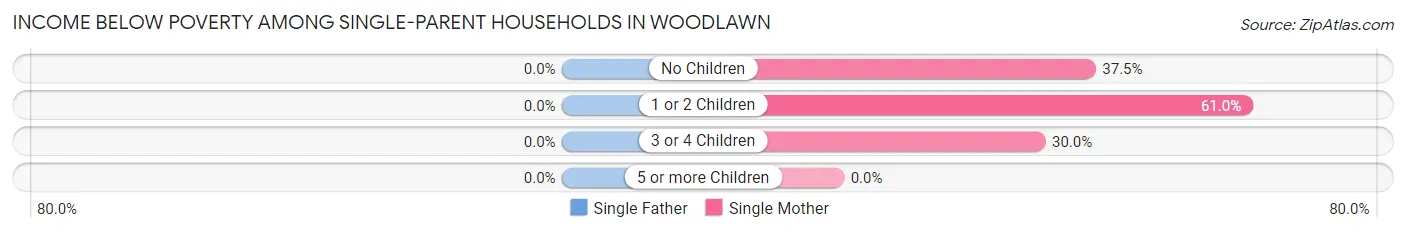
| Children | Single Father | Single Mother |
| No Children | 0 (0.0%) | 12 (37.5%) |
| 1 or 2 Children | 0 (0.0%) | 122 (61.0%) |
| 3 or 4 Children | 0 (0.0%) | 12 (30.0%) |
| 5 or more Children | 0 (0.0%) | 0 (0.0%) |
| Total | 0 (0.0%) | 146 (53.7%) |
Income Below Poverty Among Married-Couple vs Single-Parent Households in Woodlawn
The poverty data for Woodlawn shows that 30 of the married-couple family households (6.6%) and 146 of the single-parent households (41.0%) are living below the poverty level. Within the married-couple family households, those with 1 or 2 children have the highest poverty rate, with 16 households (24.2%) falling below the poverty line. Among the single-parent households, those with 1 or 2 children have the highest poverty rate, with 122 household (48.0%) living below poverty.
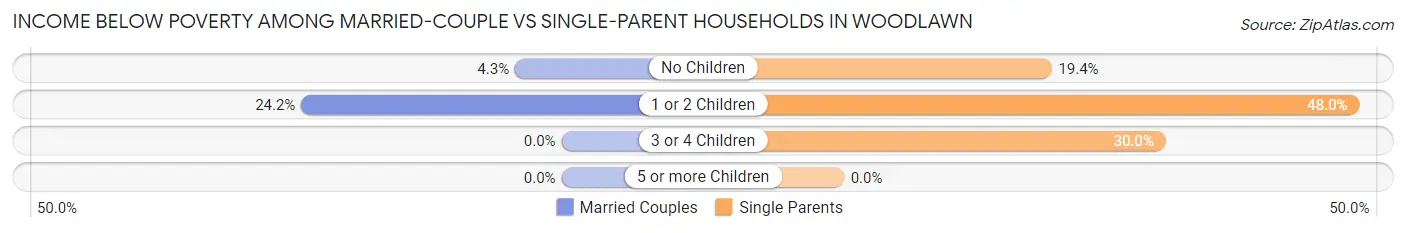
| Children | Married-Couple Families | Single-Parent Households |
| No Children | 14 (4.3%) | 12 (19.4%) |
| 1 or 2 Children | 16 (24.2%) | 122 (48.0%) |
| 3 or 4 Children | 0 (0.0%) | 12 (30.0%) |
| 5 or more Children | 0 (0.0%) | 0 (0.0%) |
| Total | 30 (6.6%) | 146 (41.0%) |
Race in Woodlawn
The most populous races in Woodlawn are Black / African American (2,257 | 58.4%), White / Caucasian (1,237 | 32.0%), and Two or more Races (239 | 6.2%).
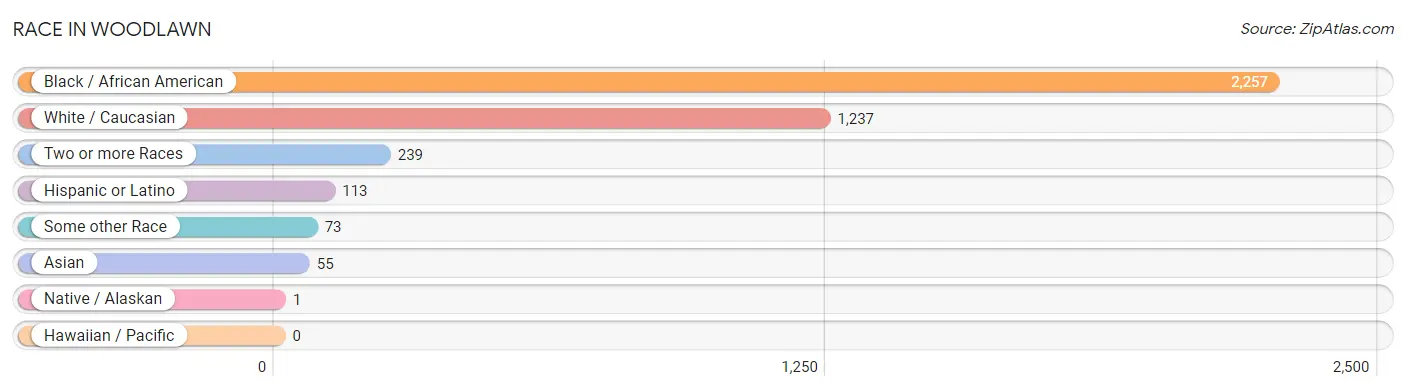
| Race | # Population | % Population |
| Asian | 55 | 1.4% |
| Black / African American | 2,257 | 58.4% |
| Hawaiian / Pacific | 0 | 0.0% |
| Hispanic or Latino | 113 | 2.9% |
| Native / Alaskan | 1 | 0.0% |
| White / Caucasian | 1,237 | 32.0% |
| Two or more Races | 239 | 6.2% |
| Some other Race | 73 | 1.9% |
| Total | 3,862 | 100.0% |
Ancestry in Woodlawn
The most populous ancestries reported in Woodlawn are American (584 | 15.1%), German (453 | 11.7%), Irish (230 | 6.0%), English (82 | 2.1%), and Italian (63 | 1.6%), together accounting for 36.6% of all Woodlawn residents.
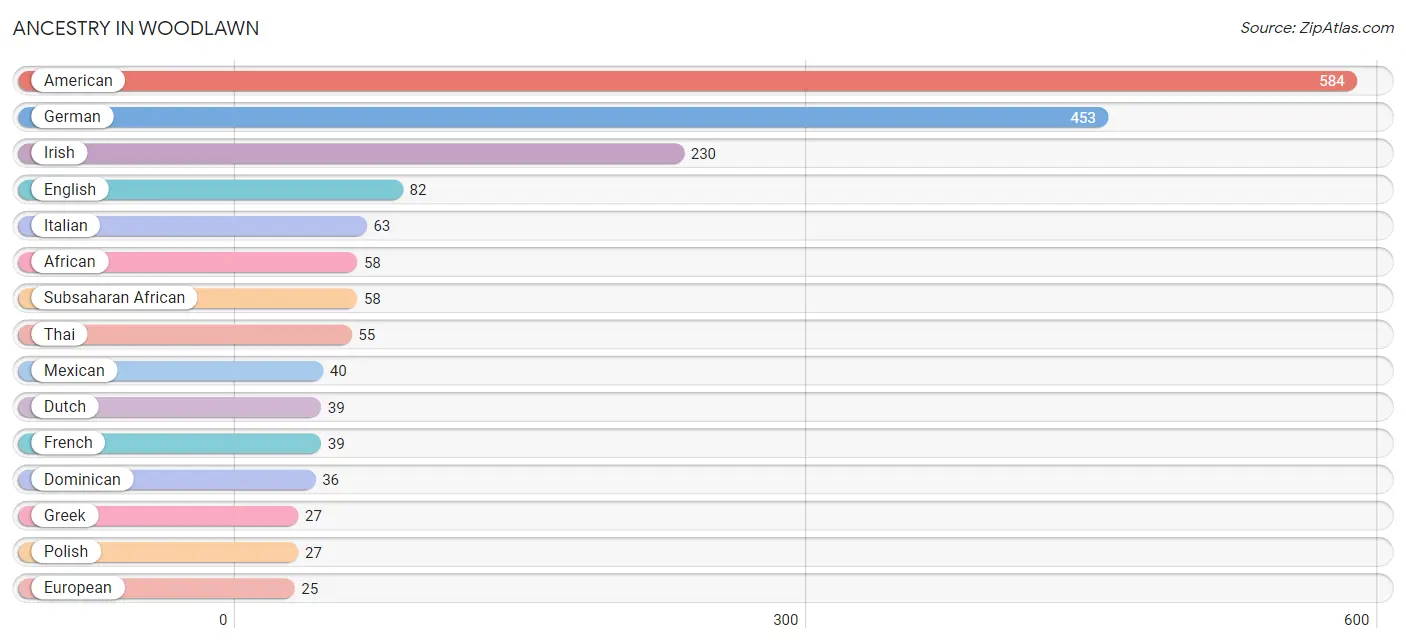
| Ancestry | # Population | % Population |
| African | 58 | 1.5% |
| American | 584 | 15.1% |
| Arab | 15 | 0.4% |
| Czech | 10 | 0.3% |
| Dominican | 36 | 0.9% |
| Dutch | 39 | 1.0% |
| English | 82 | 2.1% |
| European | 25 | 0.6% |
| French | 39 | 1.0% |
| German | 453 | 11.7% |
| Greek | 27 | 0.7% |
| Hungarian | 1 | 0.0% |
| Irish | 230 | 6.0% |
| Italian | 63 | 1.6% |
| Jamaican | 10 | 0.3% |
| Mexican | 40 | 1.0% |
| Moroccan | 15 | 0.4% |
| Norwegian | 5 | 0.1% |
| Polish | 27 | 0.7% |
| Scotch-Irish | 12 | 0.3% |
| Scottish | 20 | 0.5% |
| Spaniard | 4 | 0.1% |
| Subsaharan African | 58 | 1.5% |
| Swedish | 14 | 0.4% |
| Swiss | 11 | 0.3% |
| Thai | 55 | 1.4% | View All 26 Rows |
Immigrants in Woodlawn
The most numerous immigrant groups reported in Woodlawn came from Latin America (70 | 1.8%), Asia (55 | 1.4%), India (55 | 1.4%), South Central Asia (55 | 1.4%), and Caribbean (46 | 1.2%), together accounting for 7.3% of all Woodlawn residents.
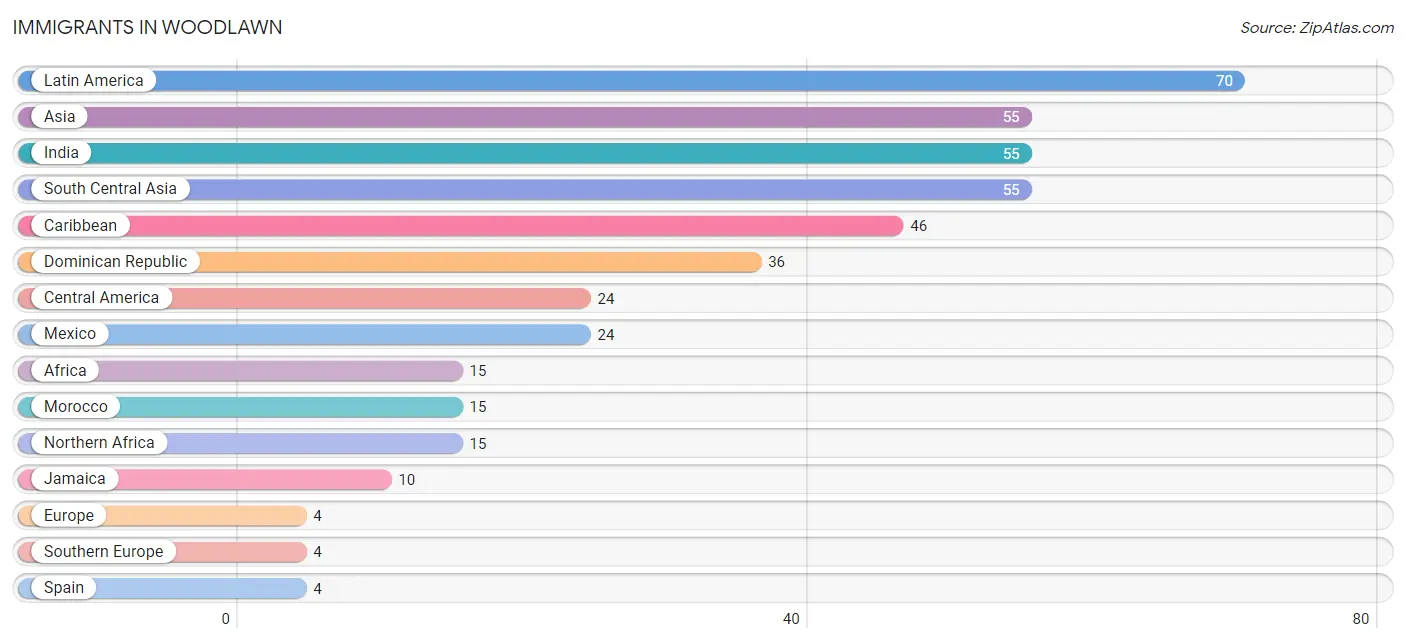
| Immigration Origin | # Population | % Population |
| Africa | 15 | 0.4% |
| Asia | 55 | 1.4% |
| Caribbean | 46 | 1.2% |
| Central America | 24 | 0.6% |
| Dominican Republic | 36 | 0.9% |
| Europe | 4 | 0.1% |
| India | 55 | 1.4% |
| Jamaica | 10 | 0.3% |
| Latin America | 70 | 1.8% |
| Mexico | 24 | 0.6% |
| Morocco | 15 | 0.4% |
| Northern Africa | 15 | 0.4% |
| South Central Asia | 55 | 1.4% |
| Southern Europe | 4 | 0.1% |
| Spain | 4 | 0.1% | View All 15 Rows |
Sex and Age in Woodlawn
Sex and Age in Woodlawn
The most populous age groups in Woodlawn are 50 to 54 Years (187 | 12.1%) for men and 20 to 24 Years (290 | 12.5%) for women.
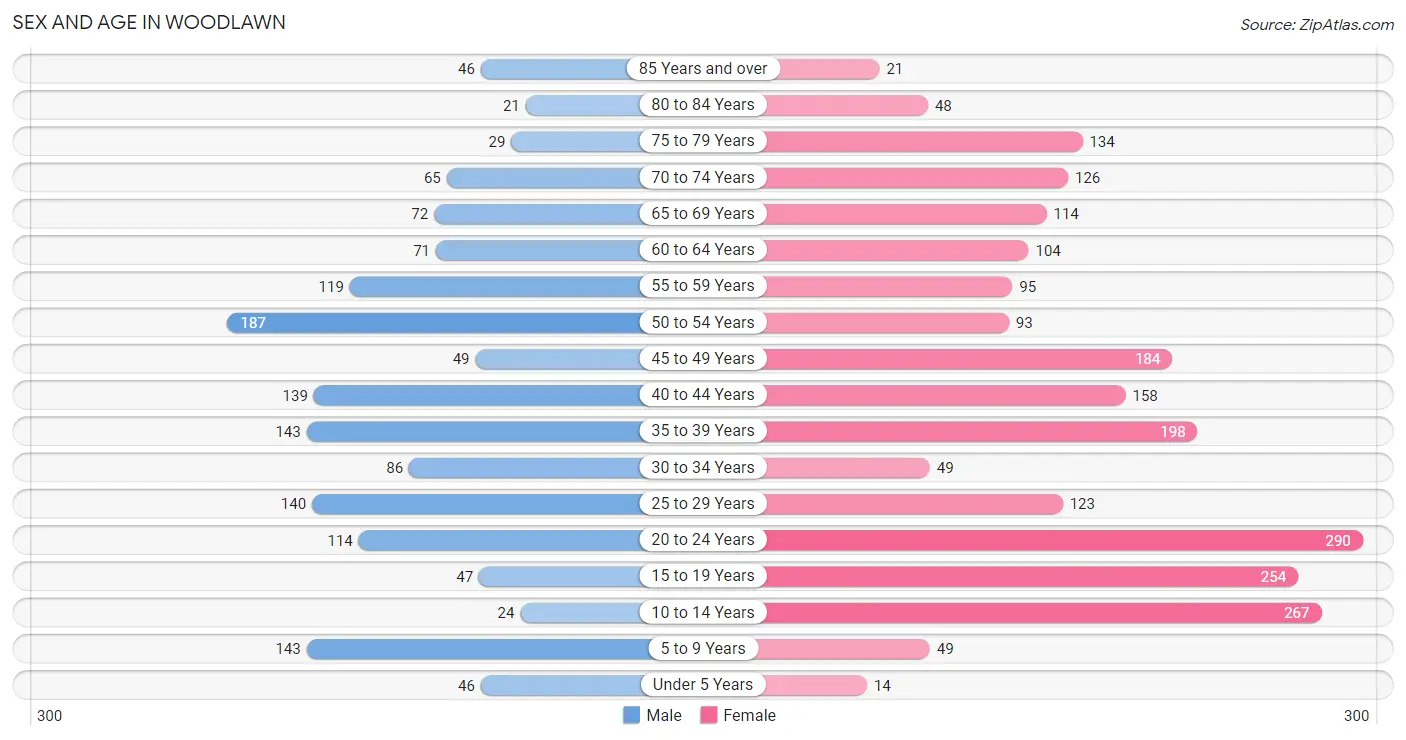
| Age Bracket | Male | Female |
| Under 5 Years | 46 (3.0%) | 14 (0.6%) |
| 5 to 9 Years | 143 (9.3%) | 49 (2.1%) |
| 10 to 14 Years | 24 (1.6%) | 267 (11.5%) |
| 15 to 19 Years | 47 (3.0%) | 254 (10.9%) |
| 20 to 24 Years | 114 (7.4%) | 290 (12.5%) |
| 25 to 29 Years | 140 (9.1%) | 123 (5.3%) |
| 30 to 34 Years | 86 (5.6%) | 49 (2.1%) |
| 35 to 39 Years | 143 (9.3%) | 198 (8.5%) |
| 40 to 44 Years | 139 (9.0%) | 158 (6.8%) |
| 45 to 49 Years | 49 (3.2%) | 184 (7.9%) |
| 50 to 54 Years | 187 (12.1%) | 93 (4.0%) |
| 55 to 59 Years | 119 (7.7%) | 95 (4.1%) |
| 60 to 64 Years | 71 (4.6%) | 104 (4.5%) |
| 65 to 69 Years | 72 (4.7%) | 114 (4.9%) |
| 70 to 74 Years | 65 (4.2%) | 126 (5.4%) |
| 75 to 79 Years | 29 (1.9%) | 134 (5.8%) |
| 80 to 84 Years | 21 (1.4%) | 48 (2.1%) |
| 85 Years and over | 46 (3.0%) | 21 (0.9%) |
| Total | 1,541 (100.0%) | 2,321 (100.0%) |
Families and Households in Woodlawn
Median Family Size in Woodlawn
The median family size in Woodlawn is 3.06 persons per family, with single female/mother families (272 | 33.5%) accounting for the largest median family size of 3.59 persons per family. On the other hand, single male/father families (84 | 10.3%) represent the smallest median family size with 2.60 persons per family.
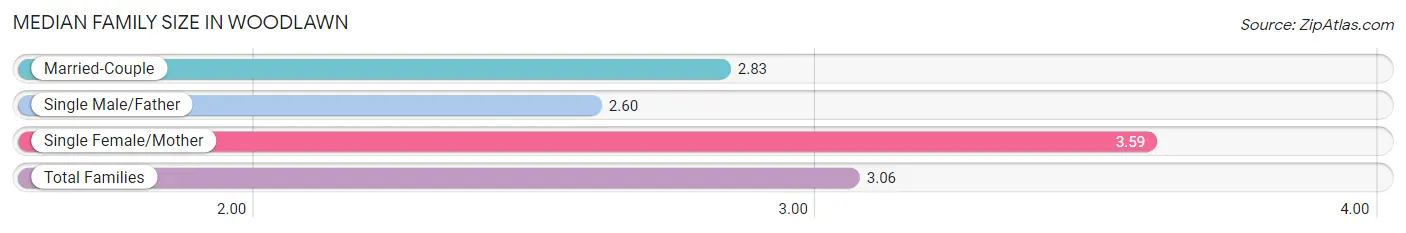
| Family Type | # Families | Family Size |
| Married-Couple | 457 (56.2%) | 2.83 |
| Single Male/Father | 84 (10.3%) | 2.60 |
| Single Female/Mother | 272 (33.5%) | 3.59 |
| Total Families | 813 (100.0%) | 3.06 |
Median Household Size in Woodlawn
The median household size in Woodlawn is 2.12 persons per household, with single female/mother households (272 | 15.5%) accounting for the largest median household size of 4.12 persons per household. non-family households (945 | 53.7%) represent the smallest median household size with 1.16 persons per household.
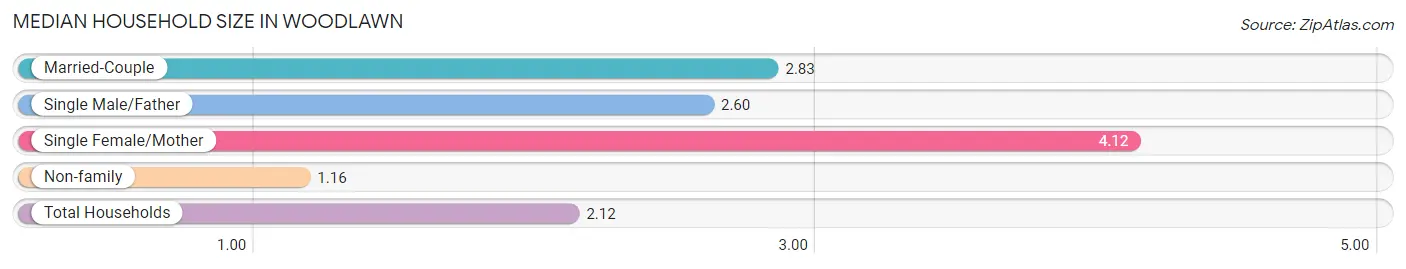
| Household Type | # Households | Household Size |
| Married-Couple | 457 (26.0%) | 2.83 |
| Single Male/Father | 84 (4.8%) | 2.60 |
| Single Female/Mother | 272 (15.5%) | 4.12 |
| Non-family | 945 (53.7%) | 1.16 |
| Total Households | 1,758 (100.0%) | 2.12 |
Household Size by Marriage Status in Woodlawn
Out of a total of 1,758 households in Woodlawn, 813 (46.3%) are family households, while 945 (53.7%) are nonfamily households. The most numerous type of family households are 2-person households, comprising 354, and the most common type of nonfamily households are 1-person households, comprising 833.
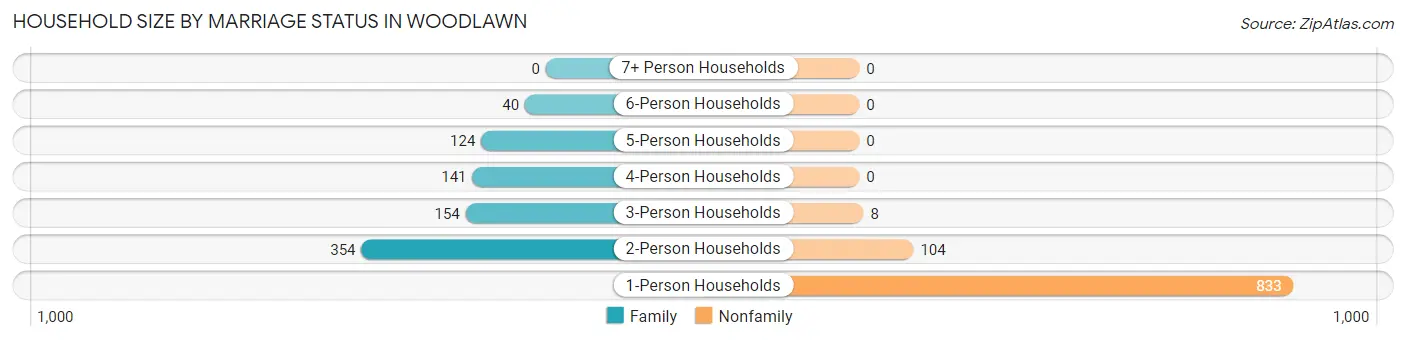
| Household Size | Family Households | Nonfamily Households |
| 1-Person Households | - | 833 (47.4%) |
| 2-Person Households | 354 (20.1%) | 104 (5.9%) |
| 3-Person Households | 154 (8.8%) | 8 (0.5%) |
| 4-Person Households | 141 (8.0%) | 0 (0.0%) |
| 5-Person Households | 124 (7.0%) | 0 (0.0%) |
| 6-Person Households | 40 (2.3%) | 0 (0.0%) |
| 7+ Person Households | 0 (0.0%) | 0 (0.0%) |
| Total | 813 (46.3%) | 945 (53.7%) |
Female Fertility in Woodlawn
Fertility by Age in Woodlawn
Average fertility rate in Woodlawn is 15.0 births per 1,000 women. Women in the age bracket of 20 to 34 years have the highest fertility rate with 19.0 births per 1,000 women. Women in the age bracket of 35 to 50 years acount for 52.6% of all women with births.
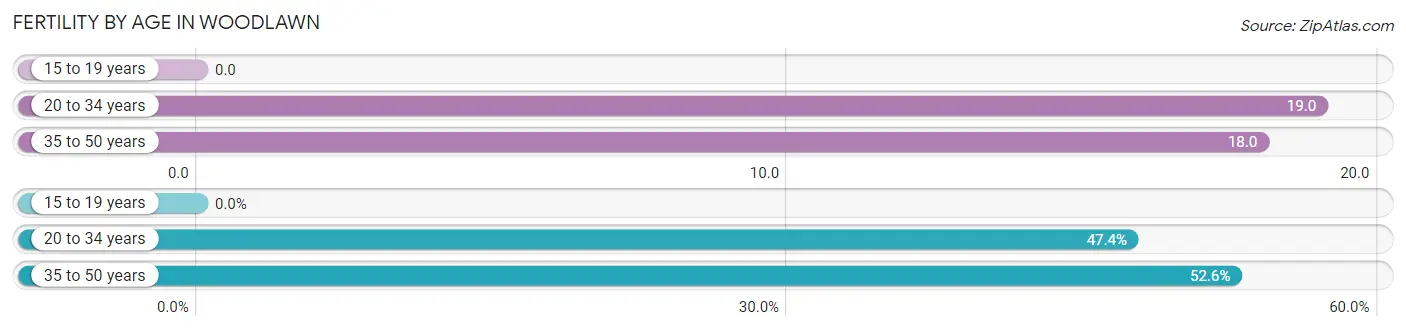
| Age Bracket | Women with Births | Births / 1,000 Women |
| 15 to 19 years | 0 (0.0%) | 0.0 |
| 20 to 34 years | 9 (47.4%) | 19.0 |
| 35 to 50 years | 10 (52.6%) | 18.0 |
| Total | 19 (100.0%) | 15.0 |
Fertility by Age by Marriage Status in Woodlawn
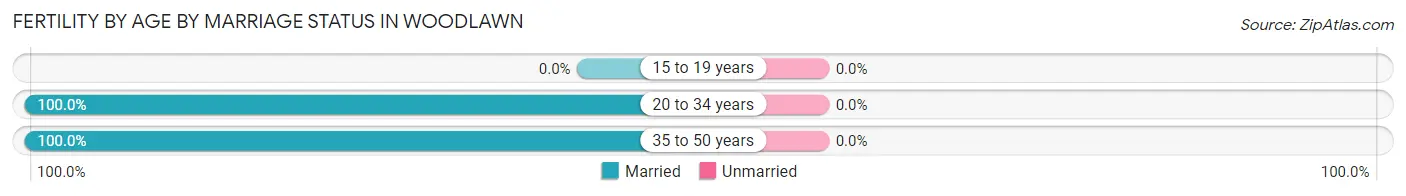
| Age Bracket | Married | Unmarried |
| 15 to 19 years | 0 (0.0%) | 0 (0.0%) |
| 20 to 34 years | 9 (100.0%) | 0 (0.0%) |
| 35 to 50 years | 10 (100.0%) | 0 (0.0%) |
| Total | 19 (100.0%) | 0 (0.0%) |
Fertility by Education in Woodlawn
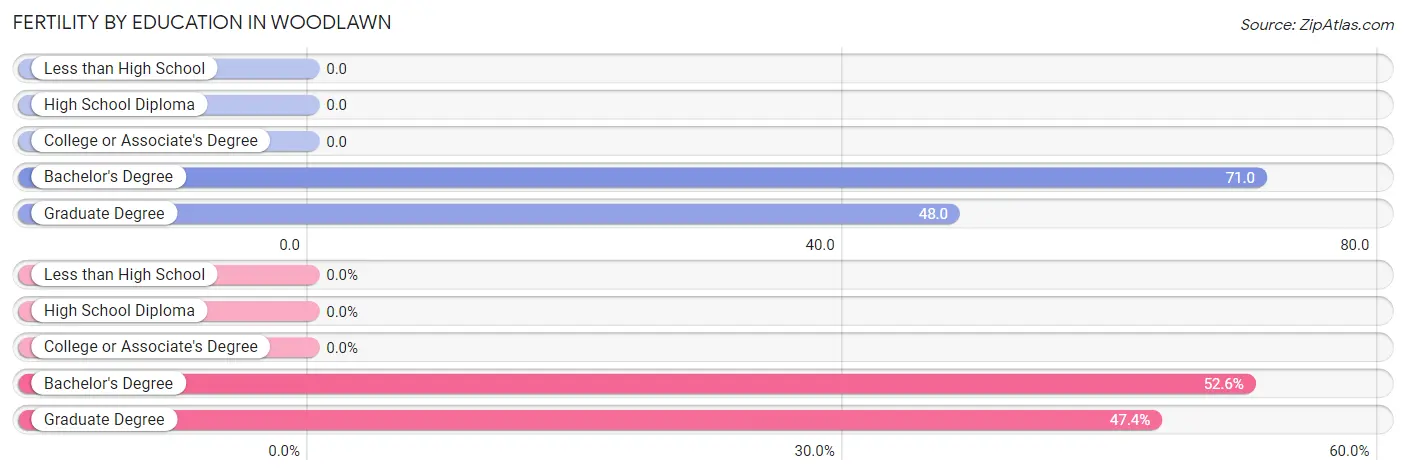
| Educational Attainment | Women with Births | Births / 1,000 Women |
| Less than High School | 0 (0.0%) | 0.0 |
| High School Diploma | 0 (0.0%) | 0.0 |
| College or Associate's Degree | 0 (0.0%) | 0.0 |
| Bachelor's Degree | 10 (52.6%) | 71.0 |
| Graduate Degree | 9 (47.4%) | 48.0 |
| Total | 19 (100.0%) | 15.0 |
Fertility by Education by Marriage Status in Woodlawn
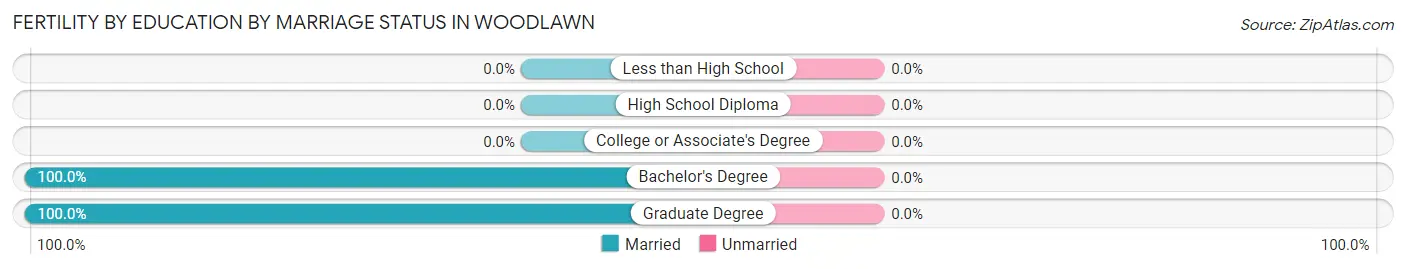
| Educational Attainment | Married | Unmarried |
| Less than High School | 0 (0.0%) | 0 (0.0%) |
| High School Diploma | 0 (0.0%) | 0 (0.0%) |
| College or Associate's Degree | 0 (0.0%) | 0 (0.0%) |
| Bachelor's Degree | 10 (100.0%) | 0 (0.0%) |
| Graduate Degree | 9 (100.0%) | 0 (0.0%) |
| Total | 19 (100.0%) | 0 (0.0%) |
Employment Characteristics in Woodlawn
Employment by Class of Employer in Woodlawn
Among the 2,194 employed individuals in Woodlawn, private company employees (1,548 | 70.6%), not-for-profit organizations (281 | 12.8%), and local government employees (222 | 10.1%) make up the most common classes of employment.
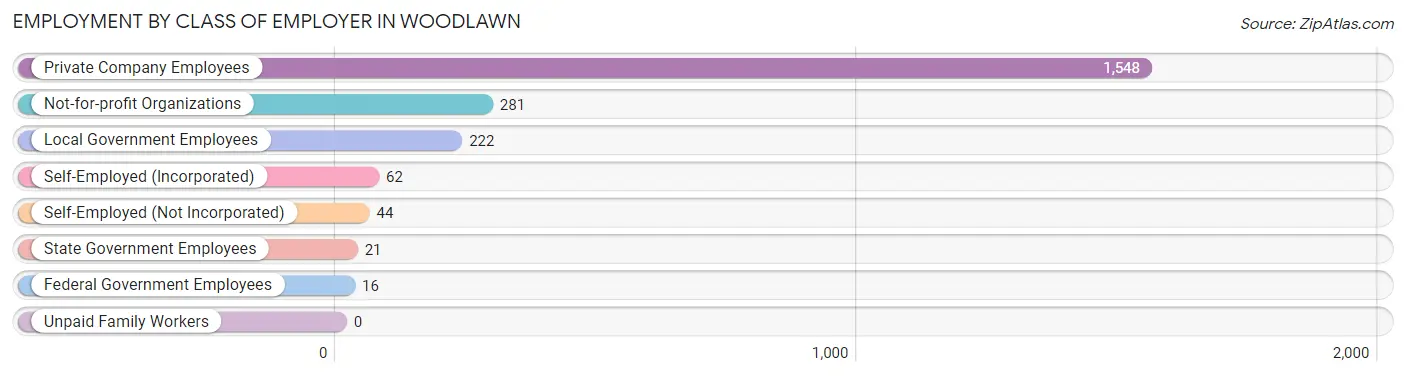
| Employer Class | # Employees | % Employees |
| Private Company Employees | 1,548 | 70.6% |
| Self-Employed (Incorporated) | 62 | 2.8% |
| Self-Employed (Not Incorporated) | 44 | 2.0% |
| Not-for-profit Organizations | 281 | 12.8% |
| Local Government Employees | 222 | 10.1% |
| State Government Employees | 21 | 1.0% |
| Federal Government Employees | 16 | 0.7% |
| Unpaid Family Workers | 0 | 0.0% |
| Total | 2,194 | 100.0% |
Employment Status by Age in Woodlawn
According to the labor force statistics for Woodlawn, out of the total population over 16 years of age (3,240), 70.0% or 2,268 individuals are in the labor force, with 3.0% or 68 of them unemployed. The age group with the highest labor force participation rate is 25 to 29 years, with 100.0% or 263 individuals in the labor force. Within the labor force, the 75 years and over age range has the highest percentage of unemployed individuals, with 60.0% or 15 of them being unemployed.
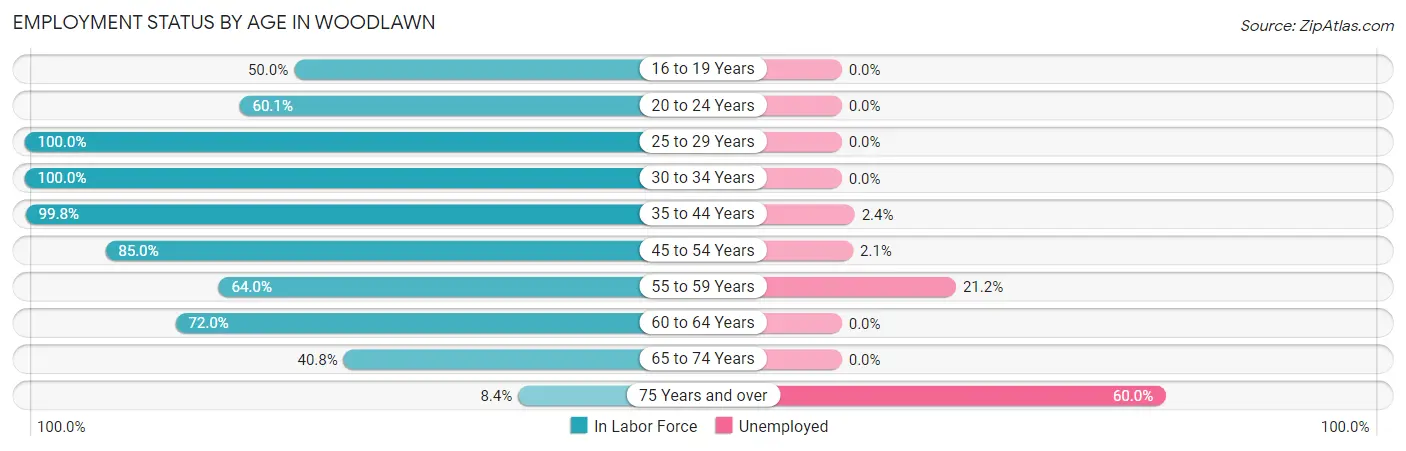
| Age Bracket | In Labor Force | Unemployed |
| 16 to 19 Years | 111 (50.0%) | 0 (0.0%) |
| 20 to 24 Years | 243 (60.1%) | 0 (0.0%) |
| 25 to 29 Years | 263 (100.0%) | 0 (0.0%) |
| 30 to 34 Years | 135 (100.0%) | 0 (0.0%) |
| 35 to 44 Years | 637 (99.8%) | 15 (2.4%) |
| 45 to 54 Years | 436 (85.0%) | 9 (2.1%) |
| 55 to 59 Years | 137 (64.0%) | 29 (21.2%) |
| 60 to 64 Years | 126 (72.0%) | 0 (0.0%) |
| 65 to 74 Years | 154 (40.8%) | 0 (0.0%) |
| 75 Years and over | 25 (8.4%) | 15 (60.0%) |
| Total | 2,268 (70.0%) | 68 (3.0%) |
Employment Status by Educational Attainment in Woodlawn
According to labor force statistics for Woodlawn, 89.5% of individuals (1,735) out of the total population between 25 and 64 years of age (1,938) are in the labor force, with 3.1% or 54 of them being unemployed. The group with the highest labor force participation rate are those with the educational attainment of bachelor's degree or higher, with 100.0% or 722 individuals in the labor force. Within the labor force, individuals with less than high school education have the highest percentage of unemployment, with 32.6% or 15 of them being unemployed.
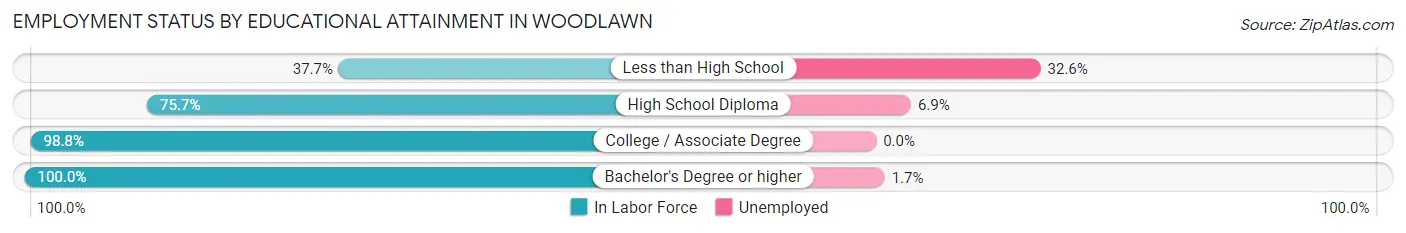
| Educational Attainment | In Labor Force | Unemployed |
| Less than High School | 46 (37.7%) | 40 (32.6%) |
| High School Diploma | 376 (75.7%) | 34 (6.9%) |
| College / Associate Degree | 590 (98.8%) | 0 (0.0%) |
| Bachelor's Degree or higher | 722 (100.0%) | 12 (1.7%) |
| Total | 1,735 (89.5%) | 60 (3.1%) |
Employment Occupations by Sex in Woodlawn
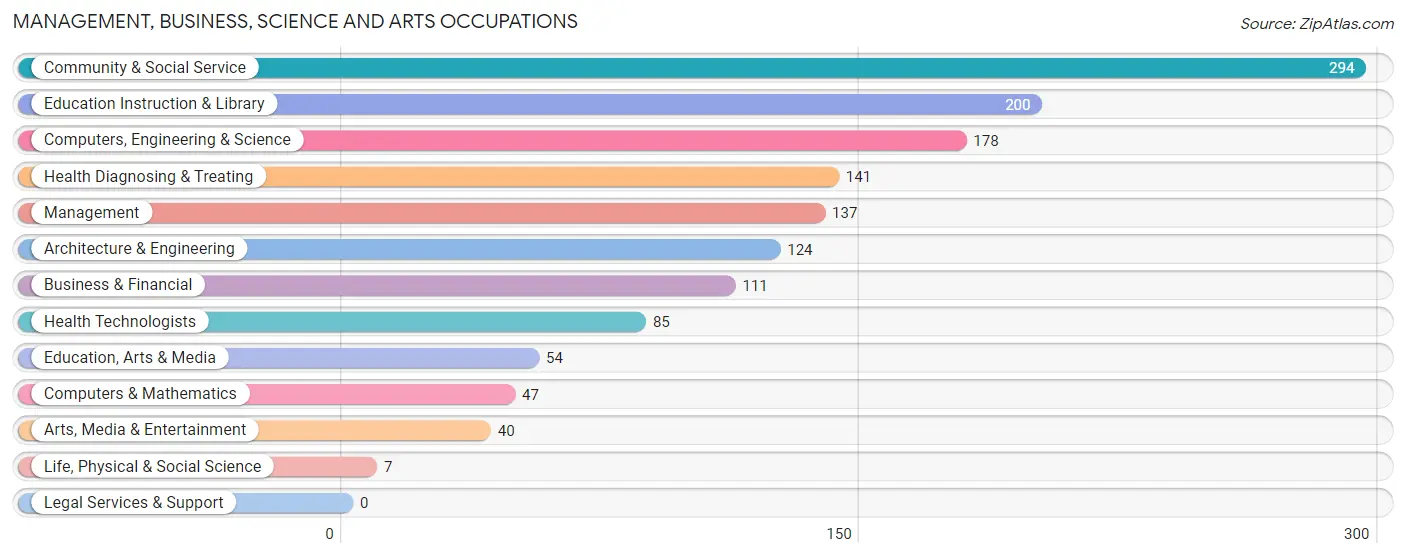
Management, Business, Science and Arts Occupations
The most common Management, Business, Science and Arts occupations in Woodlawn are Community & Social Service (294 | 13.4%), Education Instruction & Library (200 | 9.1%), Computers, Engineering & Science (178 | 8.1%), Health Diagnosing & Treating (141 | 6.4%), and Management (137 | 6.2%).
Management, Business, Science and Arts Occupations by Sex
Within the Management, Business, Science and Arts occupations in Woodlawn, the most male-oriented occupations are Computers & Mathematics (100.0%), Life, Physical & Social Science (100.0%), and Computers, Engineering & Science (74.7%), while the most female-oriented occupations are Arts, Media & Entertainment (100.0%), Health Diagnosing & Treating (79.4%), and Health Technologists (77.6%).
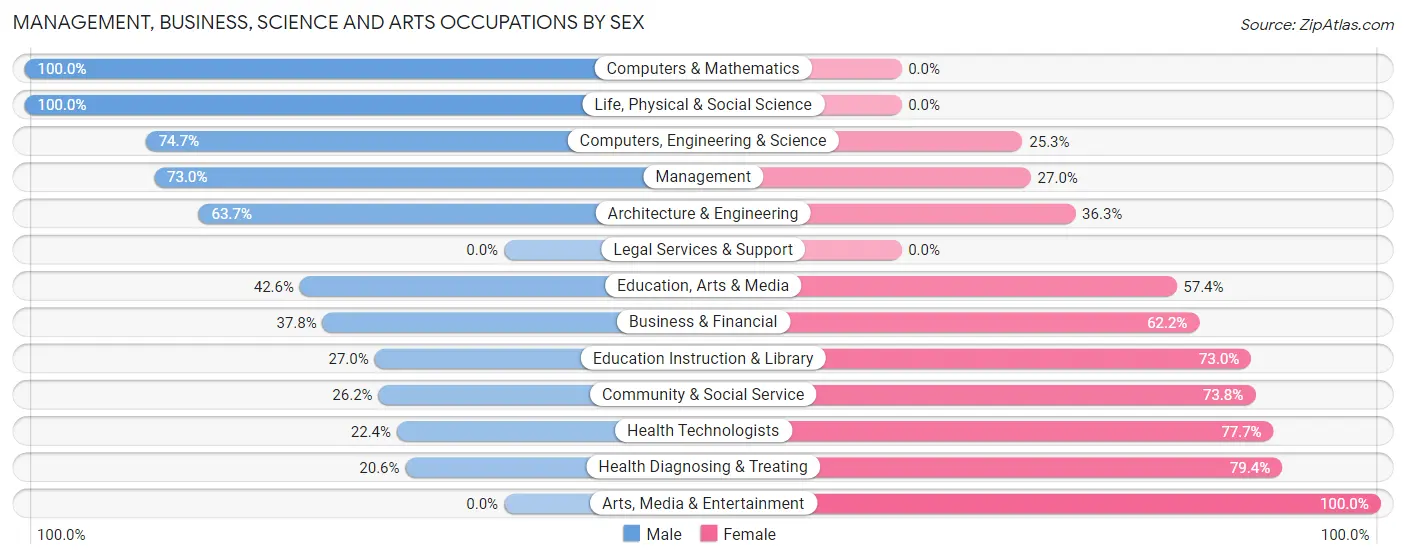
| Occupation | Male | Female |
| Management | 100 (73.0%) | 37 (27.0%) |
| Business & Financial | 42 (37.8%) | 69 (62.2%) |
| Computers, Engineering & Science | 133 (74.7%) | 45 (25.3%) |
| Computers & Mathematics | 47 (100.0%) | 0 (0.0%) |
| Architecture & Engineering | 79 (63.7%) | 45 (36.3%) |
| Life, Physical & Social Science | 7 (100.0%) | 0 (0.0%) |
| Community & Social Service | 77 (26.2%) | 217 (73.8%) |
| Education, Arts & Media | 23 (42.6%) | 31 (57.4%) |
| Legal Services & Support | 0 (0.0%) | 0 (0.0%) |
| Education Instruction & Library | 54 (27.0%) | 146 (73.0%) |
| Arts, Media & Entertainment | 0 (0.0%) | 40 (100.0%) |
| Health Diagnosing & Treating | 29 (20.6%) | 112 (79.4%) |
| Health Technologists | 19 (22.4%) | 66 (77.6%) |
| Total (Category) | 381 (44.3%) | 480 (55.7%) |
| Total (Overall) | 1,008 (45.8%) | 1,191 (54.2%) |
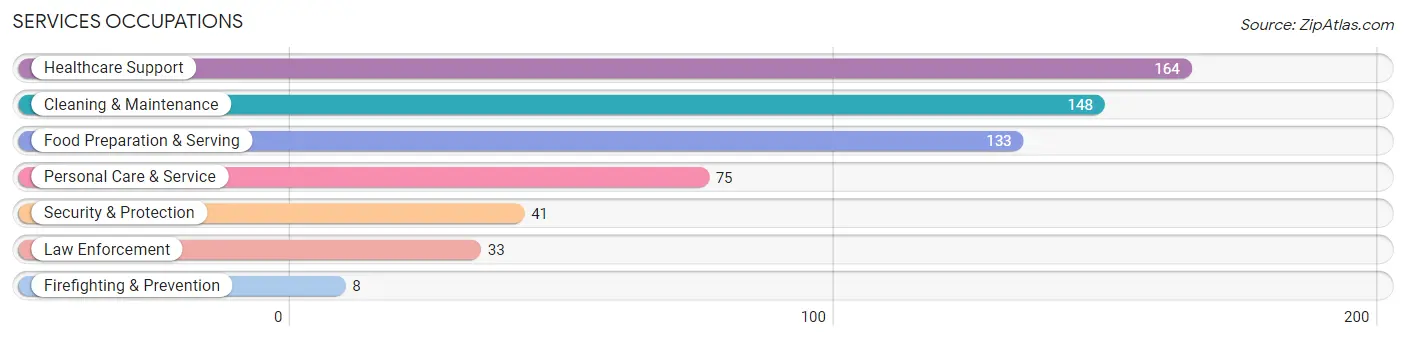
Services Occupations
The most common Services occupations in Woodlawn are Healthcare Support (164 | 7.5%), Cleaning & Maintenance (148 | 6.7%), Food Preparation & Serving (133 | 6.0%), Personal Care & Service (75 | 3.4%), and Security & Protection (41 | 1.9%).
Services Occupations by Sex
Within the Services occupations in Woodlawn, the most male-oriented occupations are Firefighting & Prevention (100.0%), Personal Care & Service (72.0%), and Cleaning & Maintenance (62.8%), while the most female-oriented occupations are Healthcare Support (100.0%), Law Enforcement (100.0%), and Security & Protection (80.5%).
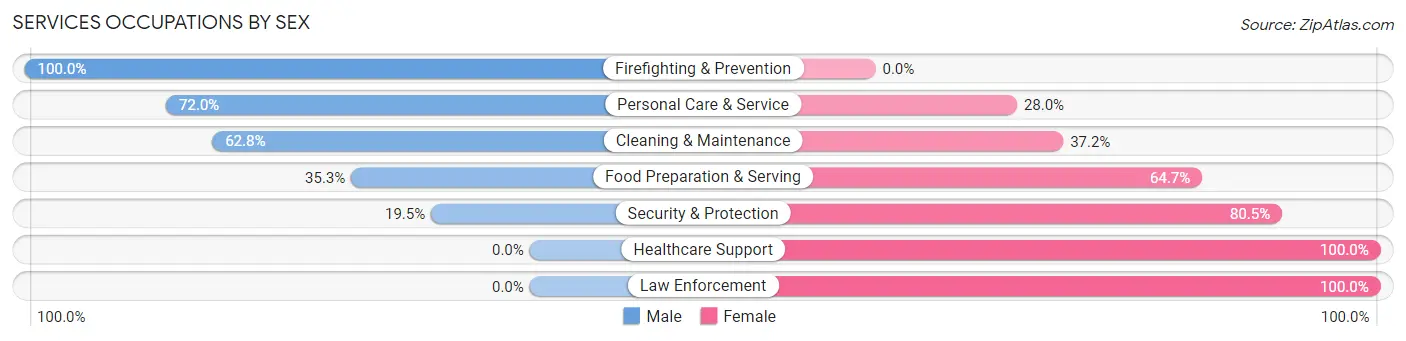
| Occupation | Male | Female |
| Healthcare Support | 0 (0.0%) | 164 (100.0%) |
| Security & Protection | 8 (19.5%) | 33 (80.5%) |
| Firefighting & Prevention | 8 (100.0%) | 0 (0.0%) |
| Law Enforcement | 0 (0.0%) | 33 (100.0%) |
| Food Preparation & Serving | 47 (35.3%) | 86 (64.7%) |
| Cleaning & Maintenance | 93 (62.8%) | 55 (37.2%) |
| Personal Care & Service | 54 (72.0%) | 21 (28.0%) |
| Total (Category) | 202 (36.0%) | 359 (64.0%) |
| Total (Overall) | 1,008 (45.8%) | 1,191 (54.2%) |
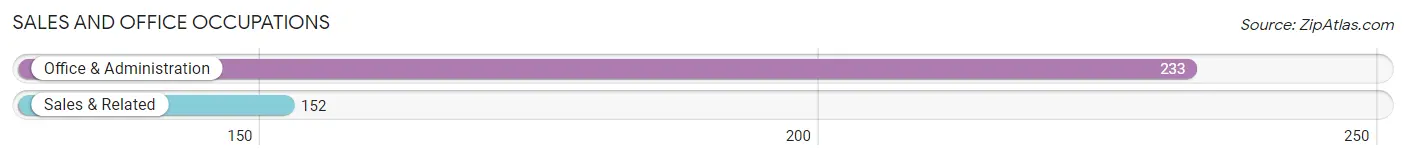
Sales and Office Occupations
The most common Sales and Office occupations in Woodlawn are Office & Administration (233 | 10.6%), and Sales & Related (152 | 6.9%).
Sales and Office Occupations by Sex
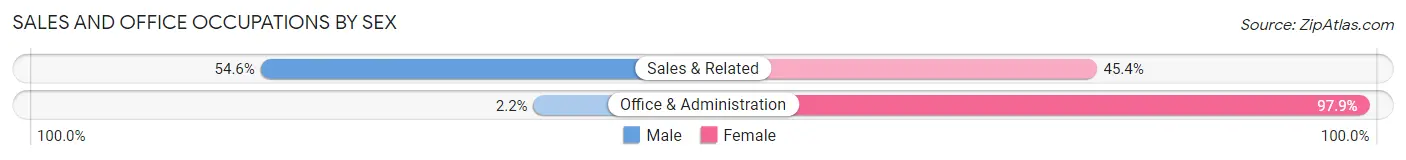
| Occupation | Male | Female |
| Sales & Related | 83 (54.6%) | 69 (45.4%) |
| Office & Administration | 5 (2.1%) | 228 (97.9%) |
| Total (Category) | 88 (22.9%) | 297 (77.1%) |
| Total (Overall) | 1,008 (45.8%) | 1,191 (54.2%) |
Natural Resources, Construction and Maintenance Occupations
The most common Natural Resources, Construction and Maintenance occupations in Woodlawn are Installation, Maintenance & Repair (46 | 2.1%), Construction & Extraction (13 | 0.6%), and Farming, Fishing & Forestry (1 | 0.1%).
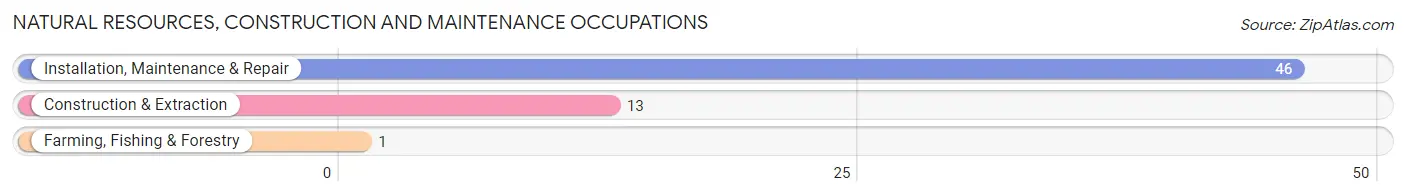
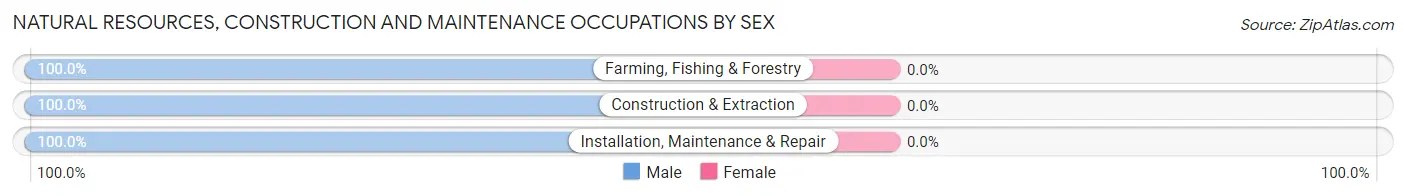
Natural Resources, Construction and Maintenance Occupations by Sex
| Occupation | Male | Female |
| Farming, Fishing & Forestry | 1 (100.0%) | 0 (0.0%) |
| Construction & Extraction | 13 (100.0%) | 0 (0.0%) |
| Installation, Maintenance & Repair | 46 (100.0%) | 0 (0.0%) |
| Total (Category) | 60 (100.0%) | 0 (0.0%) |
| Total (Overall) | 1,008 (45.8%) | 1,191 (54.2%) |
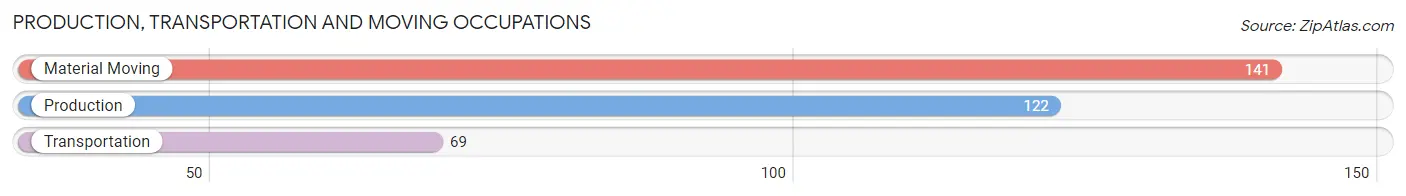
Production, Transportation and Moving Occupations
The most common Production, Transportation and Moving occupations in Woodlawn are Material Moving (141 | 6.4%), Production (122 | 5.6%), and Transportation (69 | 3.1%).
Production, Transportation and Moving Occupations by Sex
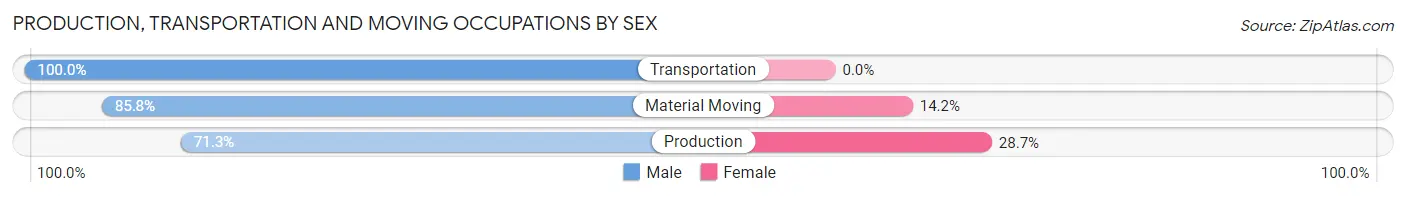
| Occupation | Male | Female |
| Production | 87 (71.3%) | 35 (28.7%) |
| Transportation | 69 (100.0%) | 0 (0.0%) |
| Material Moving | 121 (85.8%) | 20 (14.2%) |
| Total (Category) | 277 (83.4%) | 55 (16.6%) |
| Total (Overall) | 1,008 (45.8%) | 1,191 (54.2%) |
Employment Industries by Sex in Woodlawn
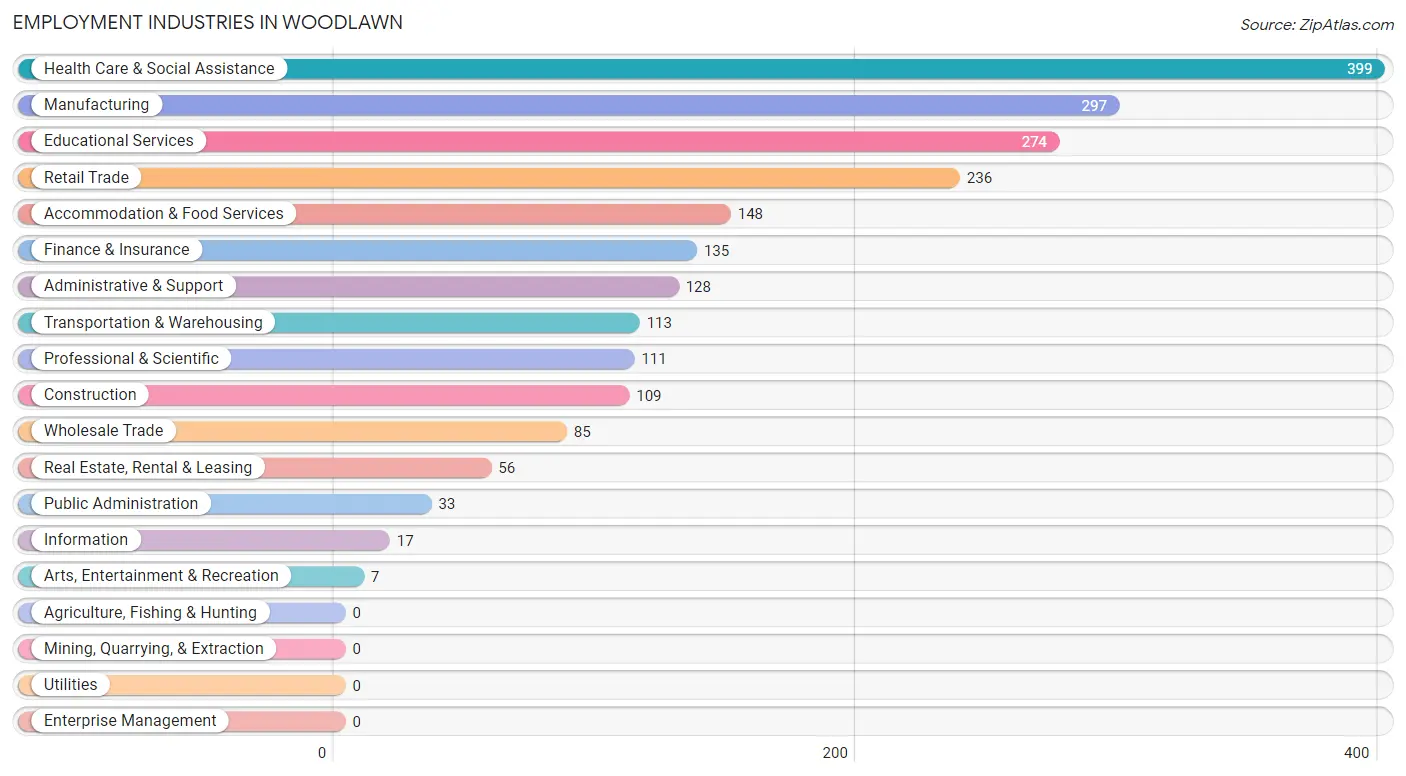
Employment Industries in Woodlawn
The major employment industries in Woodlawn include Health Care & Social Assistance (399 | 18.1%), Manufacturing (297 | 13.5%), Educational Services (274 | 12.5%), Retail Trade (236 | 10.7%), and Accommodation & Food Services (148 | 6.7%).
Employment Industries by Sex in Woodlawn
The Woodlawn industries that see more men than women are Real Estate, Rental & Leasing (100.0%), Arts, Entertainment & Recreation (100.0%), and Construction (76.1%), whereas the industries that tend to have a higher number of women are Information (100.0%), Public Administration (100.0%), and Finance & Insurance (88.9%).
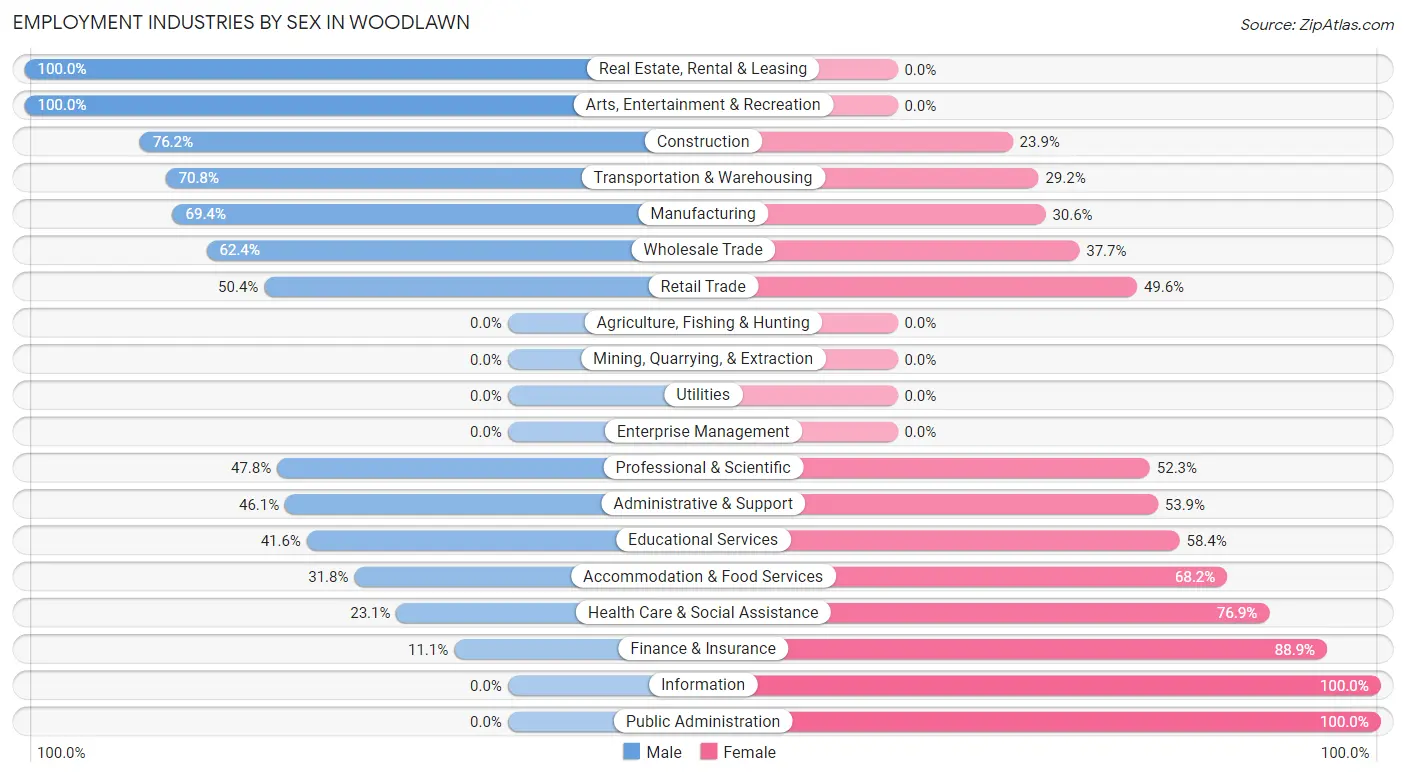
| Industry | Male | Female |
| Agriculture, Fishing & Hunting | 0 (0.0%) | 0 (0.0%) |
| Mining, Quarrying, & Extraction | 0 (0.0%) | 0 (0.0%) |
| Construction | 83 (76.1%) | 26 (23.8%) |
| Manufacturing | 206 (69.4%) | 91 (30.6%) |
| Wholesale Trade | 53 (62.4%) | 32 (37.7%) |
| Retail Trade | 119 (50.4%) | 117 (49.6%) |
| Transportation & Warehousing | 80 (70.8%) | 33 (29.2%) |
| Utilities | 0 (0.0%) | 0 (0.0%) |
| Information | 0 (0.0%) | 17 (100.0%) |
| Finance & Insurance | 15 (11.1%) | 120 (88.9%) |
| Real Estate, Rental & Leasing | 56 (100.0%) | 0 (0.0%) |
| Professional & Scientific | 53 (47.7%) | 58 (52.2%) |
| Enterprise Management | 0 (0.0%) | 0 (0.0%) |
| Administrative & Support | 59 (46.1%) | 69 (53.9%) |
| Educational Services | 114 (41.6%) | 160 (58.4%) |
| Health Care & Social Assistance | 92 (23.1%) | 307 (76.9%) |
| Arts, Entertainment & Recreation | 7 (100.0%) | 0 (0.0%) |
| Accommodation & Food Services | 47 (31.8%) | 101 (68.2%) |
| Public Administration | 0 (0.0%) | 33 (100.0%) |
| Total | 1,008 (45.8%) | 1,191 (54.2%) |
Education in Woodlawn
School Enrollment in Woodlawn
The most common levels of schooling among the 772 students in Woodlawn are elementary school (198 | 25.7%), college / undergraduate (185 | 24.0%), and middle school (114 | 14.8%).
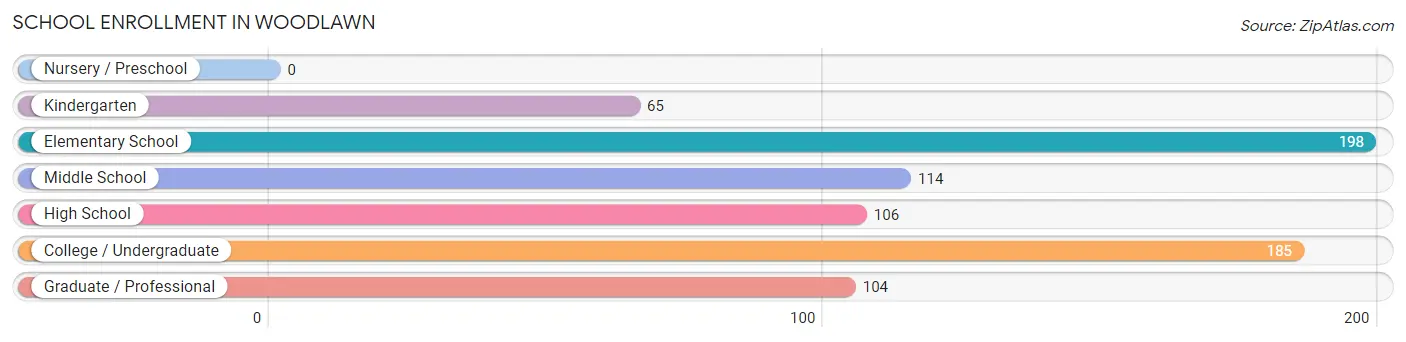
| School Level | # Students | % Students |
| Nursery / Preschool | 0 | 0.0% |
| Kindergarten | 65 | 8.4% |
| Elementary School | 198 | 25.7% |
| Middle School | 114 | 14.8% |
| High School | 106 | 13.7% |
| College / Undergraduate | 185 | 24.0% |
| Graduate / Professional | 104 | 13.5% |
| Total | 772 | 100.0% |
School Enrollment by Age by Funding Source in Woodlawn
Out of a total of 772 students who are enrolled in schools in Woodlawn, 103 (13.3%) attend a private institution, while the remaining 669 (86.7%) are enrolled in public schools. The age group of 25 to 34 year olds has the highest likelihood of being enrolled in private schools, with 39 (60.9% in the age bracket) enrolled. Conversely, the age group of 10 to 14 year olds has the lowest likelihood of being enrolled in a private school, with 278 (100.0% in the age bracket) attending a public institution.
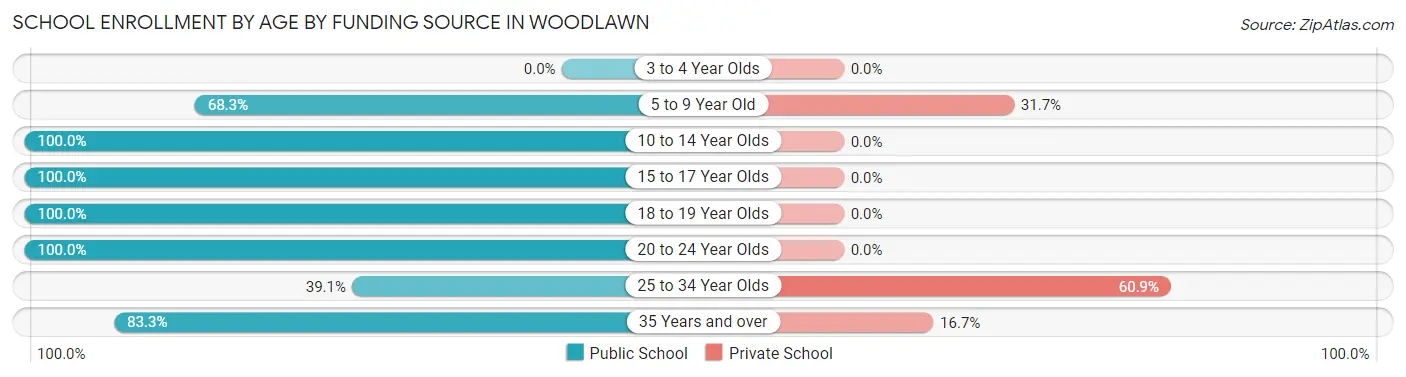
| Age Bracket | Public School | Private School |
| 3 to 4 Year Olds | 0 (0.0%) | 0 (0.0%) |
| 5 to 9 Year Old | 112 (68.3%) | 52 (31.7%) |
| 10 to 14 Year Olds | 278 (100.0%) | 0 (0.0%) |
| 15 to 17 Year Olds | 41 (100.0%) | 0 (0.0%) |
| 18 to 19 Year Olds | 45 (100.0%) | 0 (0.0%) |
| 20 to 24 Year Olds | 108 (100.0%) | 0 (0.0%) |
| 25 to 34 Year Olds | 25 (39.1%) | 39 (60.9%) |
| 35 Years and over | 60 (83.3%) | 12 (16.7%) |
| Total | 669 (86.7%) | 103 (13.3%) |
Educational Attainment by Field of Study in Woodlawn
Business (219 | 23.1%), psychology (109 | 11.5%), engineering (108 | 11.4%), science & technology (103 | 10.8%), and education (100 | 10.5%) are the most common fields of study among 949 individuals in Woodlawn who have obtained a bachelor's degree or higher.
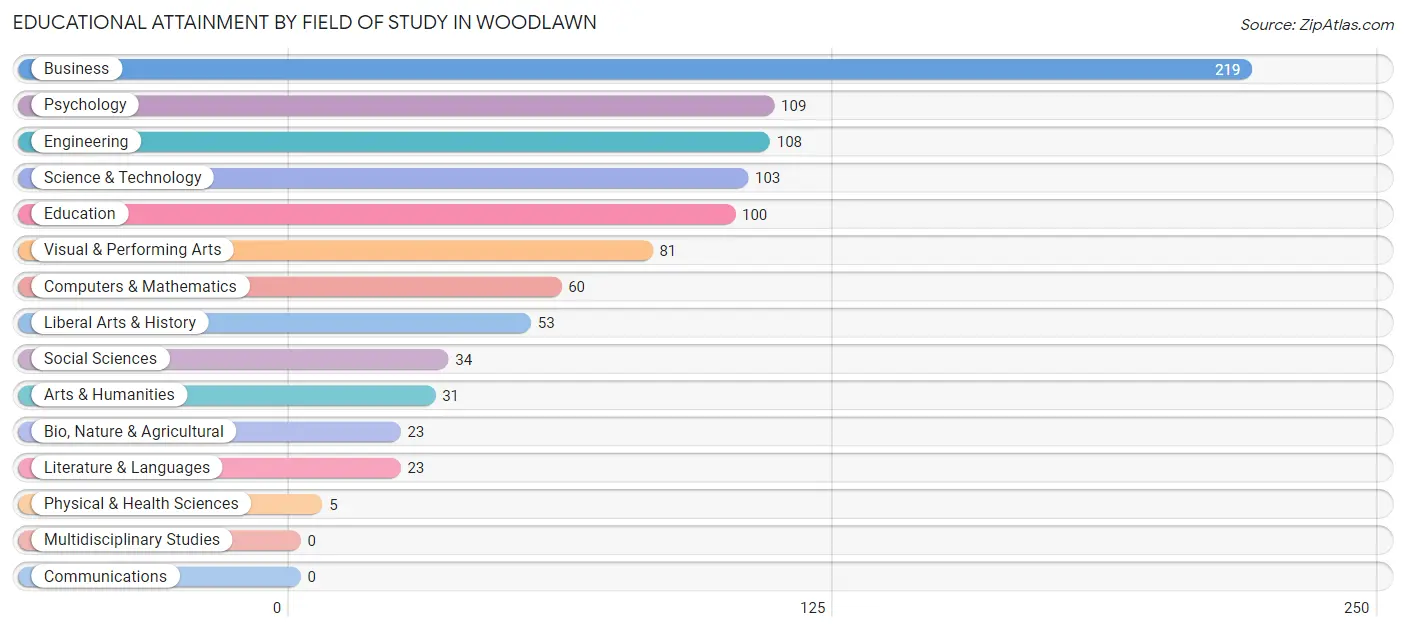
| Field of Study | # Graduates | % Graduates |
| Computers & Mathematics | 60 | 6.3% |
| Bio, Nature & Agricultural | 23 | 2.4% |
| Physical & Health Sciences | 5 | 0.5% |
| Psychology | 109 | 11.5% |
| Social Sciences | 34 | 3.6% |
| Engineering | 108 | 11.4% |
| Multidisciplinary Studies | 0 | 0.0% |
| Science & Technology | 103 | 10.8% |
| Business | 219 | 23.1% |
| Education | 100 | 10.5% |
| Literature & Languages | 23 | 2.4% |
| Liberal Arts & History | 53 | 5.6% |
| Visual & Performing Arts | 81 | 8.5% |
| Communications | 0 | 0.0% |
| Arts & Humanities | 31 | 3.3% |
| Total | 949 | 100.0% |
Transportation & Commute in Woodlawn
Vehicle Availability by Sex in Woodlawn
The most prevalent vehicle ownership categories in Woodlawn are males with 1 vehicle (323, accounting for 32.3%) and females with 1 vehicle (483, making up 27.2%).
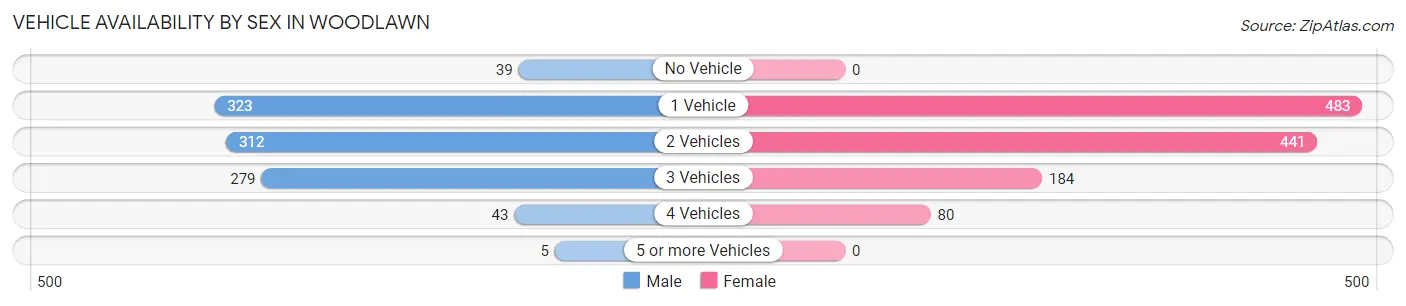
| Vehicles Available | Male | Female |
| No Vehicle | 39 (3.9%) | 0 (0.0%) |
| 1 Vehicle | 323 (32.3%) | 483 (40.7%) |
| 2 Vehicles | 312 (31.2%) | 441 (37.1%) |
| 3 Vehicles | 279 (27.9%) | 184 (15.5%) |
| 4 Vehicles | 43 (4.3%) | 80 (6.7%) |
| 5 or more Vehicles | 5 (0.5%) | 0 (0.0%) |
| Total | 1,001 (100.0%) | 1,188 (100.0%) |
Commute Time in Woodlawn
The most frequently occuring commute durations in Woodlawn are 15 to 19 minutes (442 commuters, 23.2%), 10 to 14 minutes (391 commuters, 20.5%), and 30 to 34 minutes (351 commuters, 18.4%).
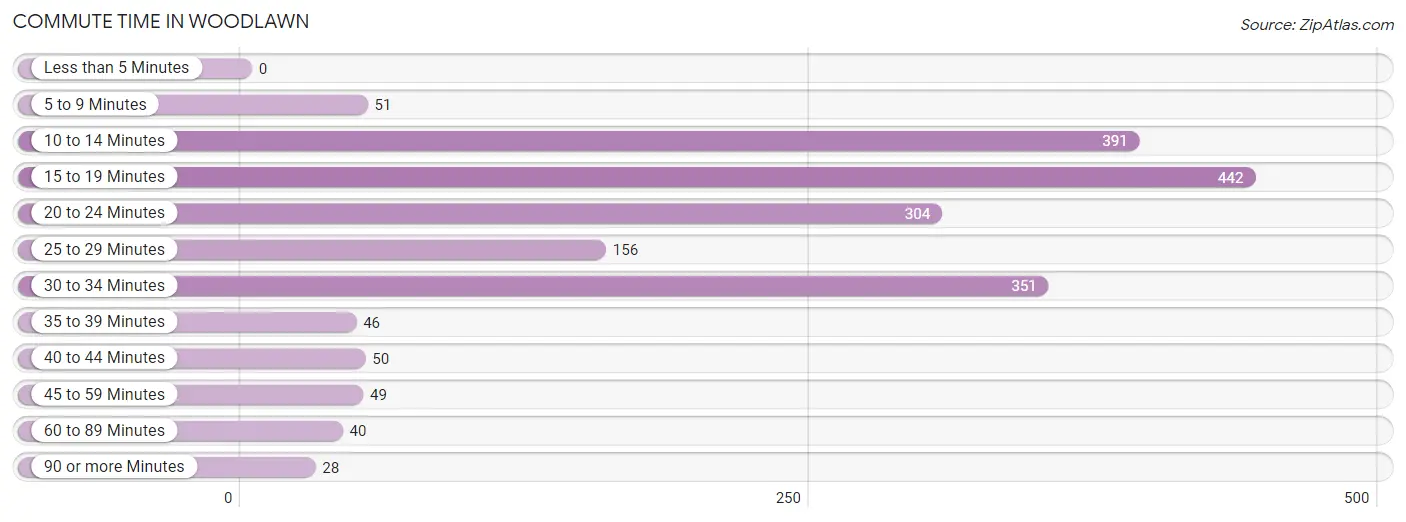
| Commute Time | # Commuters | % Commuters |
| Less than 5 Minutes | 0 | 0.0% |
| 5 to 9 Minutes | 51 | 2.7% |
| 10 to 14 Minutes | 391 | 20.5% |
| 15 to 19 Minutes | 442 | 23.2% |
| 20 to 24 Minutes | 304 | 15.9% |
| 25 to 29 Minutes | 156 | 8.2% |
| 30 to 34 Minutes | 351 | 18.4% |
| 35 to 39 Minutes | 46 | 2.4% |
| 40 to 44 Minutes | 50 | 2.6% |
| 45 to 59 Minutes | 49 | 2.6% |
| 60 to 89 Minutes | 40 | 2.1% |
| 90 or more Minutes | 28 | 1.5% |
Commute Time by Sex in Woodlawn
The most common commute times in Woodlawn are 10 to 14 minutes (194 commuters, 24.1%) for males and 15 to 19 minutes (270 commuters, 24.5%) for females.
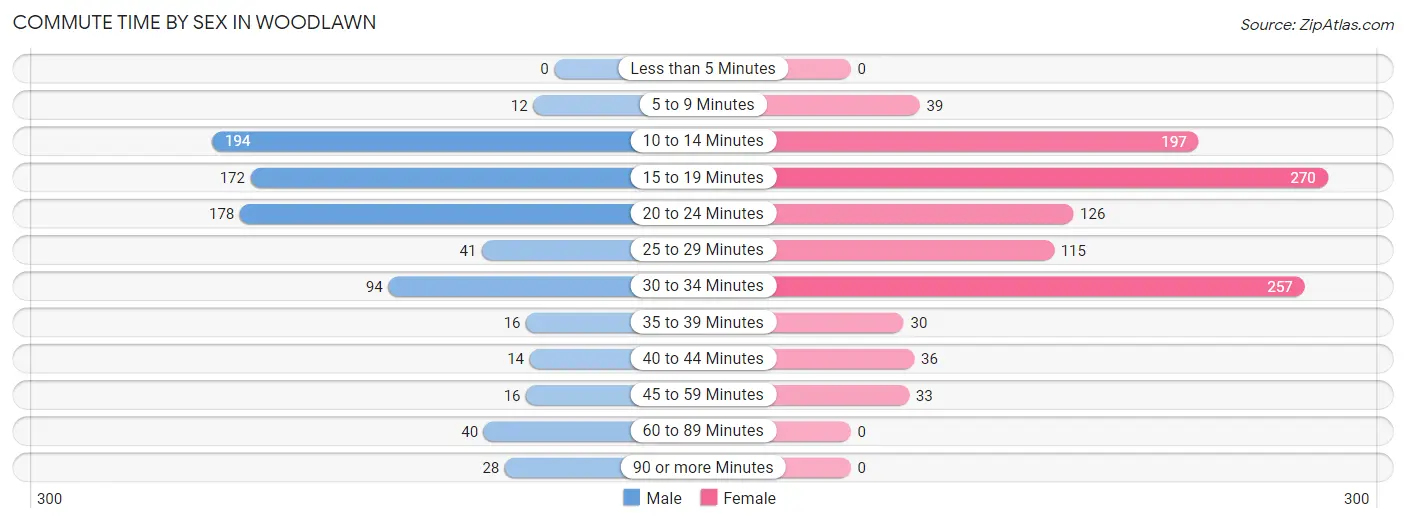
| Commute Time | Male | Female |
| Less than 5 Minutes | 0 (0.0%) | 0 (0.0%) |
| 5 to 9 Minutes | 12 (1.5%) | 39 (3.5%) |
| 10 to 14 Minutes | 194 (24.1%) | 197 (17.9%) |
| 15 to 19 Minutes | 172 (21.4%) | 270 (24.5%) |
| 20 to 24 Minutes | 178 (22.1%) | 126 (11.4%) |
| 25 to 29 Minutes | 41 (5.1%) | 115 (10.4%) |
| 30 to 34 Minutes | 94 (11.7%) | 257 (23.3%) |
| 35 to 39 Minutes | 16 (2.0%) | 30 (2.7%) |
| 40 to 44 Minutes | 14 (1.7%) | 36 (3.3%) |
| 45 to 59 Minutes | 16 (2.0%) | 33 (3.0%) |
| 60 to 89 Minutes | 40 (5.0%) | 0 (0.0%) |
| 90 or more Minutes | 28 (3.5%) | 0 (0.0%) |
Time of Departure to Work by Sex in Woodlawn
The most frequent times of departure to work in Woodlawn are 6:00 AM to 6:29 AM (146, 18.1%) for males and 8:00 AM to 8:29 AM (237, 21.5%) for females.
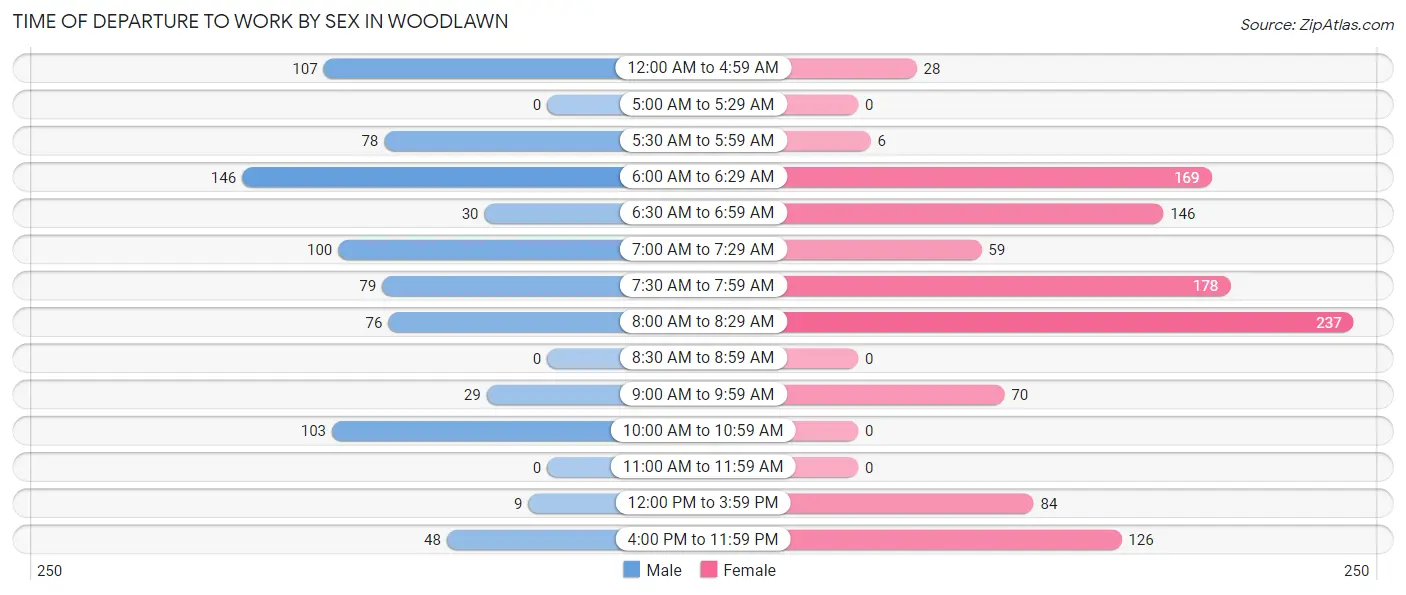
| Time of Departure | Male | Female |
| 12:00 AM to 4:59 AM | 107 (13.3%) | 28 (2.5%) |
| 5:00 AM to 5:29 AM | 0 (0.0%) | 0 (0.0%) |
| 5:30 AM to 5:59 AM | 78 (9.7%) | 6 (0.5%) |
| 6:00 AM to 6:29 AM | 146 (18.1%) | 169 (15.3%) |
| 6:30 AM to 6:59 AM | 30 (3.7%) | 146 (13.2%) |
| 7:00 AM to 7:29 AM | 100 (12.4%) | 59 (5.3%) |
| 7:30 AM to 7:59 AM | 79 (9.8%) | 178 (16.1%) |
| 8:00 AM to 8:29 AM | 76 (9.4%) | 237 (21.5%) |
| 8:30 AM to 8:59 AM | 0 (0.0%) | 0 (0.0%) |
| 9:00 AM to 9:59 AM | 29 (3.6%) | 70 (6.4%) |
| 10:00 AM to 10:59 AM | 103 (12.8%) | 0 (0.0%) |
| 11:00 AM to 11:59 AM | 0 (0.0%) | 0 (0.0%) |
| 12:00 PM to 3:59 PM | 9 (1.1%) | 84 (7.6%) |
| 4:00 PM to 11:59 PM | 48 (6.0%) | 126 (11.4%) |
| Total | 805 (100.0%) | 1,103 (100.0%) |
Housing Occupancy in Woodlawn
Occupancy by Ownership in Woodlawn
Of the total 1,758 dwellings in Woodlawn, owner-occupied units account for 651 (37.0%), while renter-occupied units make up 1,107 (63.0%).
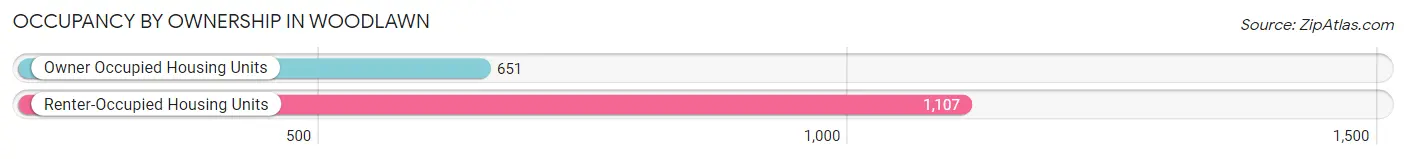
| Occupancy | # Housing Units | % Housing Units |
| Owner Occupied Housing Units | 651 | 37.0% |
| Renter-Occupied Housing Units | 1,107 | 63.0% |
| Total Occupied Housing Units | 1,758 | 100.0% |
Occupancy by Household Size in Woodlawn
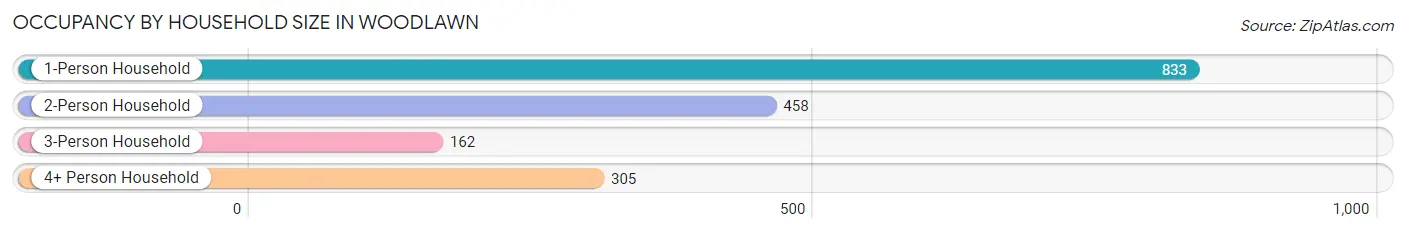
| Household Size | # Housing Units | % Housing Units |
| 1-Person Household | 833 | 47.4% |
| 2-Person Household | 458 | 26.1% |
| 3-Person Household | 162 | 9.2% |
| 4+ Person Household | 305 | 17.3% |
| Total Housing Units | 1,758 | 100.0% |
Occupancy by Ownership by Household Size in Woodlawn
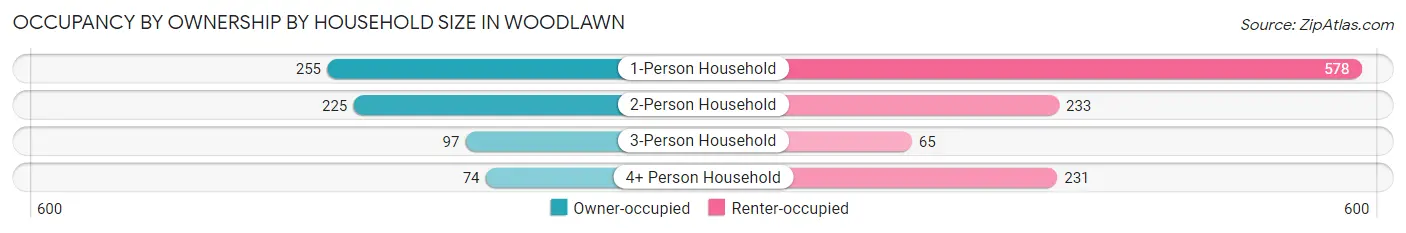
| Household Size | Owner-occupied | Renter-occupied |
| 1-Person Household | 255 (30.6%) | 578 (69.4%) |
| 2-Person Household | 225 (49.1%) | 233 (50.9%) |
| 3-Person Household | 97 (59.9%) | 65 (40.1%) |
| 4+ Person Household | 74 (24.3%) | 231 (75.7%) |
| Total Housing Units | 651 (37.0%) | 1,107 (63.0%) |
Occupancy by Educational Attainment in Woodlawn
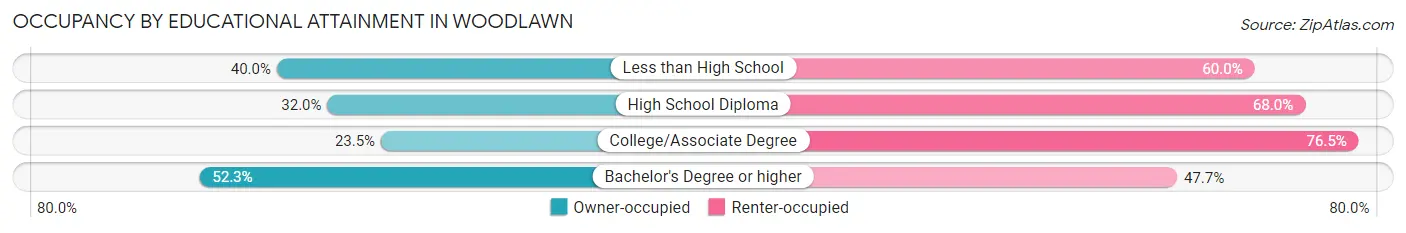
| Household Size | Owner-occupied | Renter-occupied |
| Less than High School | 42 (40.0%) | 63 (60.0%) |
| High School Diploma | 118 (32.0%) | 251 (68.0%) |
| College/Associate Degree | 147 (23.5%) | 479 (76.5%) |
| Bachelor's Degree or higher | 344 (52.3%) | 314 (47.7%) |
Occupancy by Age of Householder in Woodlawn
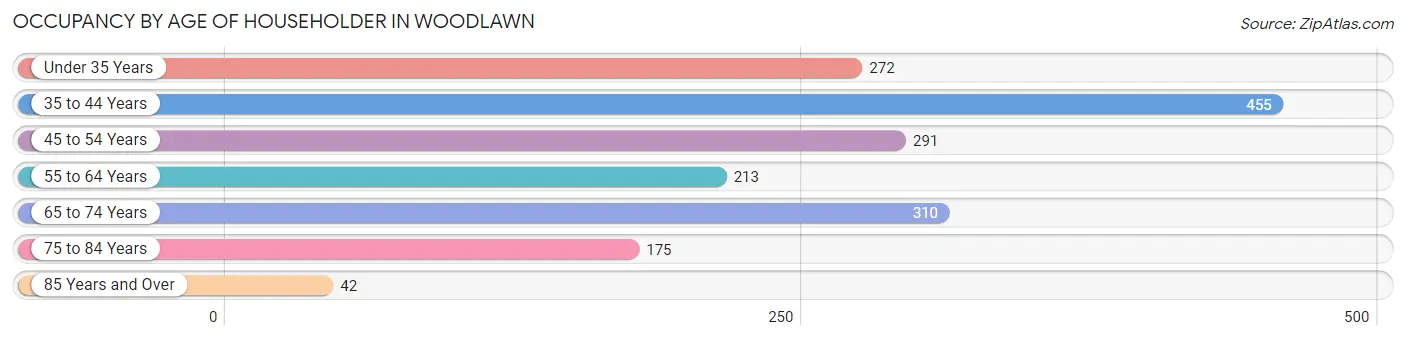
| Age Bracket | # Households | % Households |
| Under 35 Years | 272 | 15.5% |
| 35 to 44 Years | 455 | 25.9% |
| 45 to 54 Years | 291 | 16.6% |
| 55 to 64 Years | 213 | 12.1% |
| 65 to 74 Years | 310 | 17.6% |
| 75 to 84 Years | 175 | 10.0% |
| 85 Years and Over | 42 | 2.4% |
| Total | 1,758 | 100.0% |
Housing Finances in Woodlawn
Median Income by Occupancy in Woodlawn
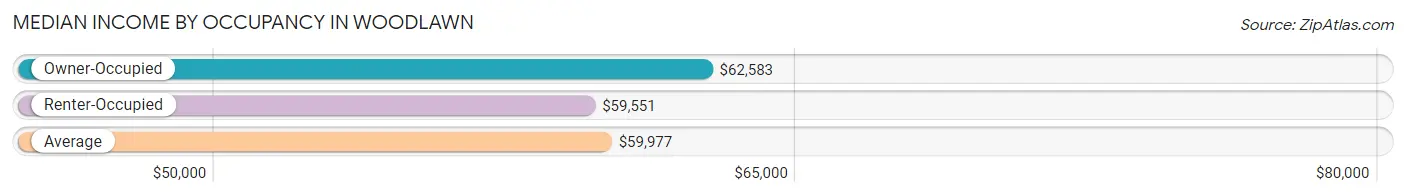
| Occupancy Type | # Households | Median Income |
| Owner-Occupied | 651 (37.0%) | $62,583 |
| Renter-Occupied | 1,107 (63.0%) | $59,551 |
| Average | 1,758 (100.0%) | $59,977 |
Occupancy by Householder Income Bracket in Woodlawn
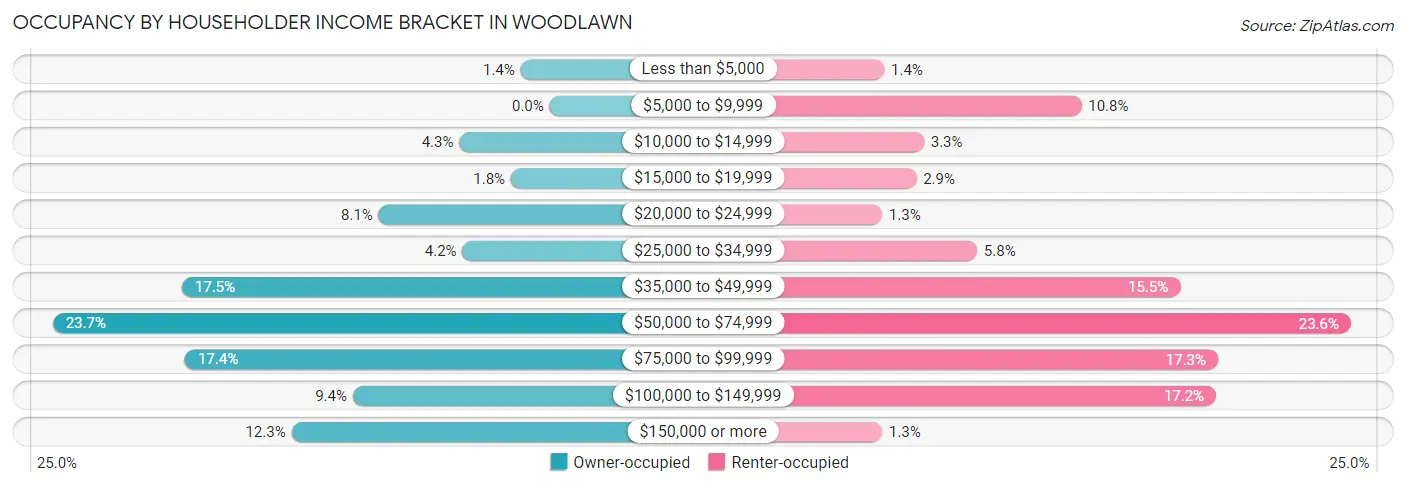
| Income Bracket | Owner-occupied | Renter-occupied |
| Less than $5,000 | 9 (1.4%) | 15 (1.4%) |
| $5,000 to $9,999 | 0 (0.0%) | 119 (10.7%) |
| $10,000 to $14,999 | 28 (4.3%) | 36 (3.3%) |
| $15,000 to $19,999 | 12 (1.8%) | 32 (2.9%) |
| $20,000 to $24,999 | 53 (8.1%) | 14 (1.3%) |
| $25,000 to $34,999 | 27 (4.2%) | 64 (5.8%) |
| $35,000 to $49,999 | 114 (17.5%) | 171 (15.4%) |
| $50,000 to $74,999 | 154 (23.7%) | 261 (23.6%) |
| $75,000 to $99,999 | 113 (17.4%) | 191 (17.2%) |
| $100,000 to $149,999 | 61 (9.4%) | 190 (17.2%) |
| $150,000 or more | 80 (12.3%) | 14 (1.3%) |
| Total | 651 (100.0%) | 1,107 (100.0%) |
Monthly Housing Cost Tiers in Woodlawn
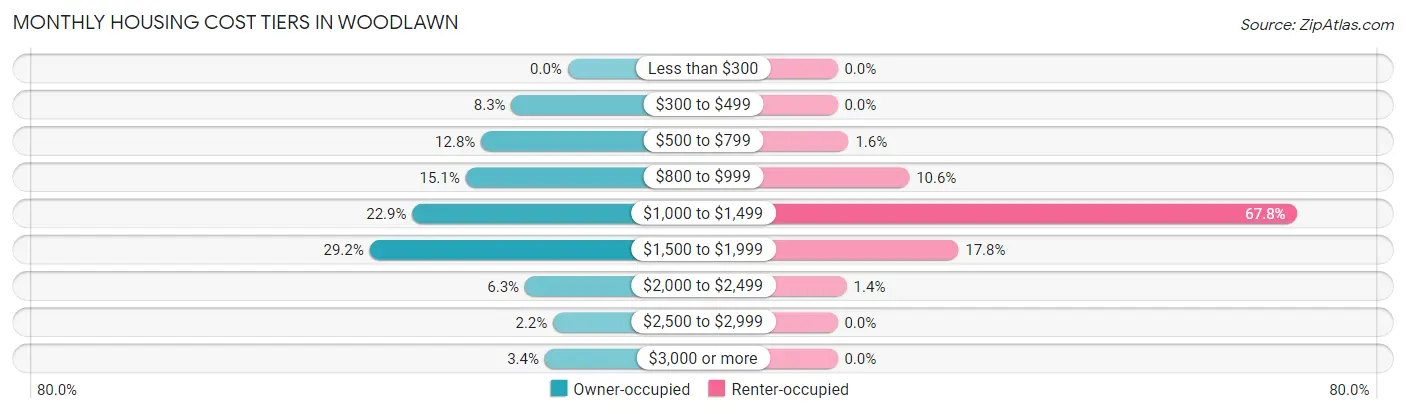
| Monthly Cost | Owner-occupied | Renter-occupied |
| Less than $300 | 0 (0.0%) | 0 (0.0%) |
| $300 to $499 | 54 (8.3%) | 0 (0.0%) |
| $500 to $799 | 83 (12.8%) | 18 (1.6%) |
| $800 to $999 | 98 (15.0%) | 117 (10.6%) |
| $1,000 to $1,499 | 149 (22.9%) | 750 (67.7%) |
| $1,500 to $1,999 | 190 (29.2%) | 197 (17.8%) |
| $2,000 to $2,499 | 41 (6.3%) | 15 (1.4%) |
| $2,500 to $2,999 | 14 (2.1%) | 0 (0.0%) |
| $3,000 or more | 22 (3.4%) | 0 (0.0%) |
| Total | 651 (100.0%) | 1,107 (100.0%) |
Physical Housing Characteristics in Woodlawn
Housing Structures in Woodlawn
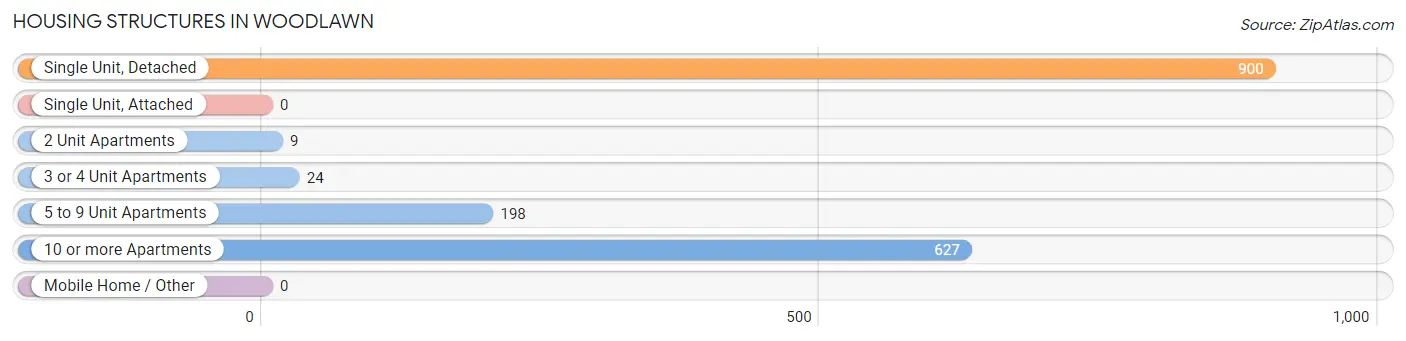
| Structure Type | # Housing Units | % Housing Units |
| Single Unit, Detached | 900 | 51.2% |
| Single Unit, Attached | 0 | 0.0% |
| 2 Unit Apartments | 9 | 0.5% |
| 3 or 4 Unit Apartments | 24 | 1.4% |
| 5 to 9 Unit Apartments | 198 | 11.3% |
| 10 or more Apartments | 627 | 35.7% |
| Mobile Home / Other | 0 | 0.0% |
| Total | 1,758 | 100.0% |
Housing Structures by Occupancy in Woodlawn
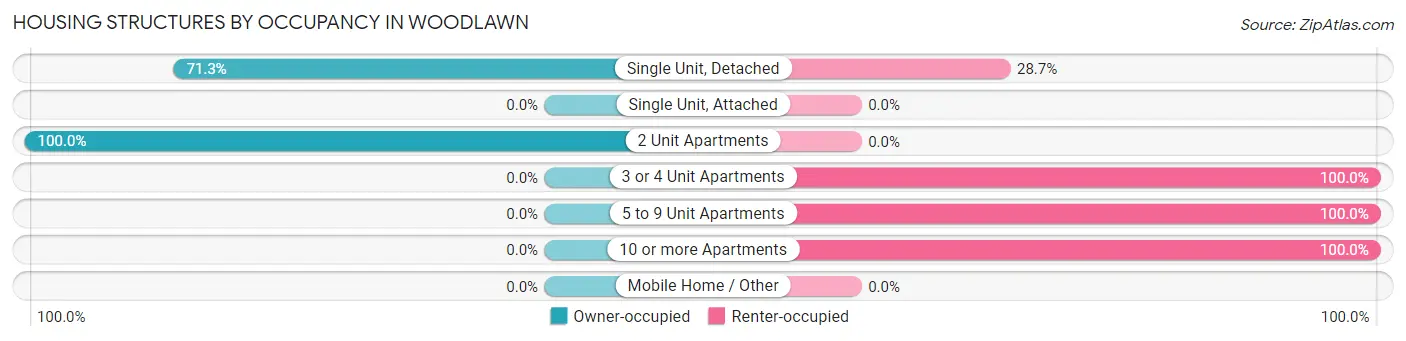
| Structure Type | Owner-occupied | Renter-occupied |
| Single Unit, Detached | 642 (71.3%) | 258 (28.7%) |
| Single Unit, Attached | 0 (0.0%) | 0 (0.0%) |
| 2 Unit Apartments | 9 (100.0%) | 0 (0.0%) |
| 3 or 4 Unit Apartments | 0 (0.0%) | 24 (100.0%) |
| 5 to 9 Unit Apartments | 0 (0.0%) | 198 (100.0%) |
| 10 or more Apartments | 0 (0.0%) | 627 (100.0%) |
| Mobile Home / Other | 0 (0.0%) | 0 (0.0%) |
| Total | 651 (37.0%) | 1,107 (63.0%) |
Housing Structures by Number of Rooms in Woodlawn
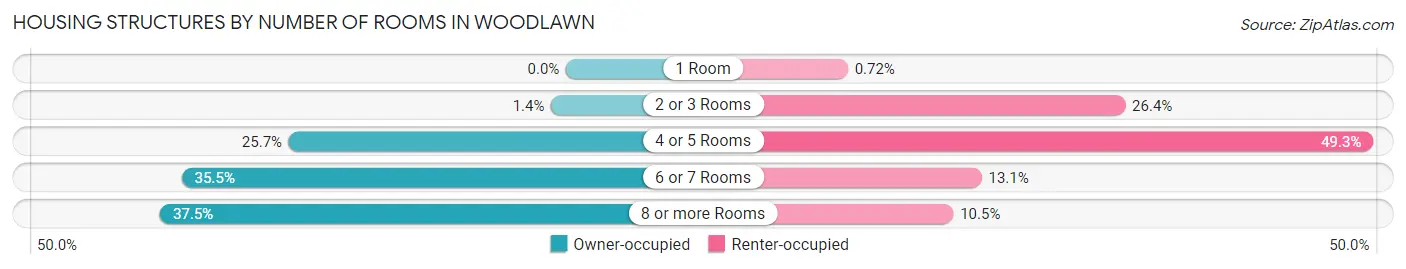
| Number of Rooms | Owner-occupied | Renter-occupied |
| 1 Room | 0 (0.0%) | 8 (0.7%) |
| 2 or 3 Rooms | 9 (1.4%) | 292 (26.4%) |
| 4 or 5 Rooms | 167 (25.7%) | 546 (49.3%) |
| 6 or 7 Rooms | 231 (35.5%) | 145 (13.1%) |
| 8 or more Rooms | 244 (37.5%) | 116 (10.5%) |
| Total | 651 (100.0%) | 1,107 (100.0%) |
Housing Structure by Heating Type in Woodlawn
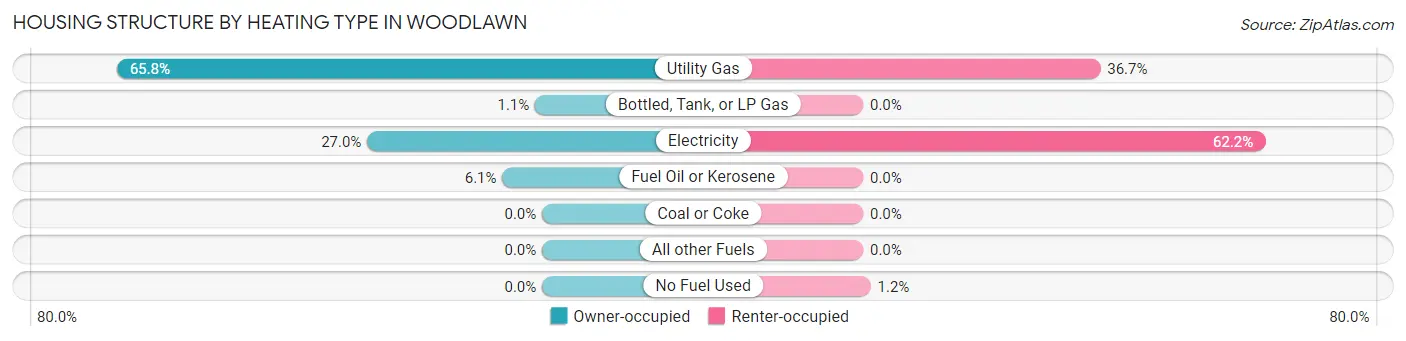
| Heating Type | Owner-occupied | Renter-occupied |
| Utility Gas | 428 (65.7%) | 406 (36.7%) |
| Bottled, Tank, or LP Gas | 7 (1.1%) | 0 (0.0%) |
| Electricity | 176 (27.0%) | 688 (62.2%) |
| Fuel Oil or Kerosene | 40 (6.1%) | 0 (0.0%) |
| Coal or Coke | 0 (0.0%) | 0 (0.0%) |
| All other Fuels | 0 (0.0%) | 0 (0.0%) |
| No Fuel Used | 0 (0.0%) | 13 (1.2%) |
| Total | 651 (100.0%) | 1,107 (100.0%) |
Household Vehicle Usage in Woodlawn
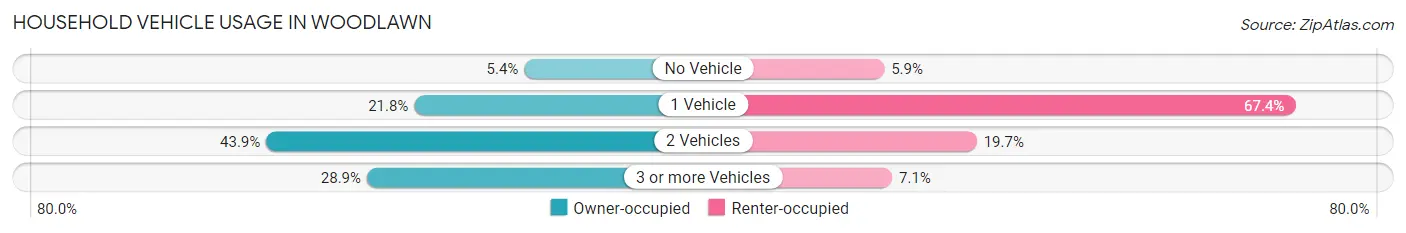
| Vehicles per Household | Owner-occupied | Renter-occupied |
| No Vehicle | 35 (5.4%) | 65 (5.9%) |
| 1 Vehicle | 142 (21.8%) | 746 (67.4%) |
| 2 Vehicles | 286 (43.9%) | 218 (19.7%) |
| 3 or more Vehicles | 188 (28.9%) | 78 (7.0%) |
| Total | 651 (100.0%) | 1,107 (100.0%) |
Real Estate & Mortgages in Woodlawn
Real Estate and Mortgage Overview in Woodlawn
| Characteristic | Without Mortgage | With Mortgage |
| Housing Units | 113 | 538 |
| Median Property Value | $86,500 | $174,300 |
| Median Household Income | $46,250 | $80 |
| Monthly Housing Costs | $505 | $22 |
| Real Estate Taxes | $2,113 | $9 |
Property Value by Mortgage Status in Woodlawn
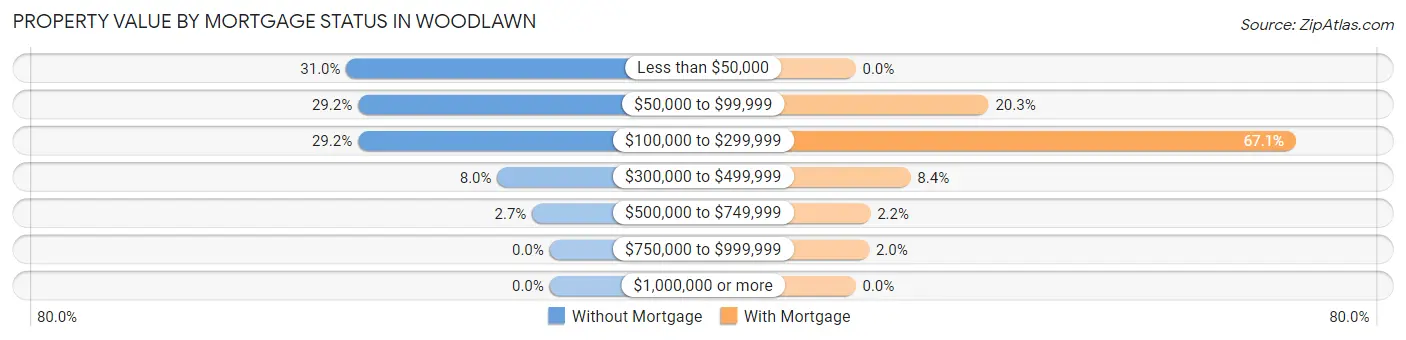
| Property Value | Without Mortgage | With Mortgage |
| Less than $50,000 | 35 (31.0%) | 0 (0.0%) |
| $50,000 to $99,999 | 33 (29.2%) | 109 (20.3%) |
| $100,000 to $299,999 | 33 (29.2%) | 361 (67.1%) |
| $300,000 to $499,999 | 9 (8.0%) | 45 (8.4%) |
| $500,000 to $749,999 | 3 (2.6%) | 12 (2.2%) |
| $750,000 to $999,999 | 0 (0.0%) | 11 (2.0%) |
| $1,000,000 or more | 0 (0.0%) | 0 (0.0%) |
| Total | 113 (100.0%) | 538 (100.0%) |
Household Income by Mortgage Status in Woodlawn
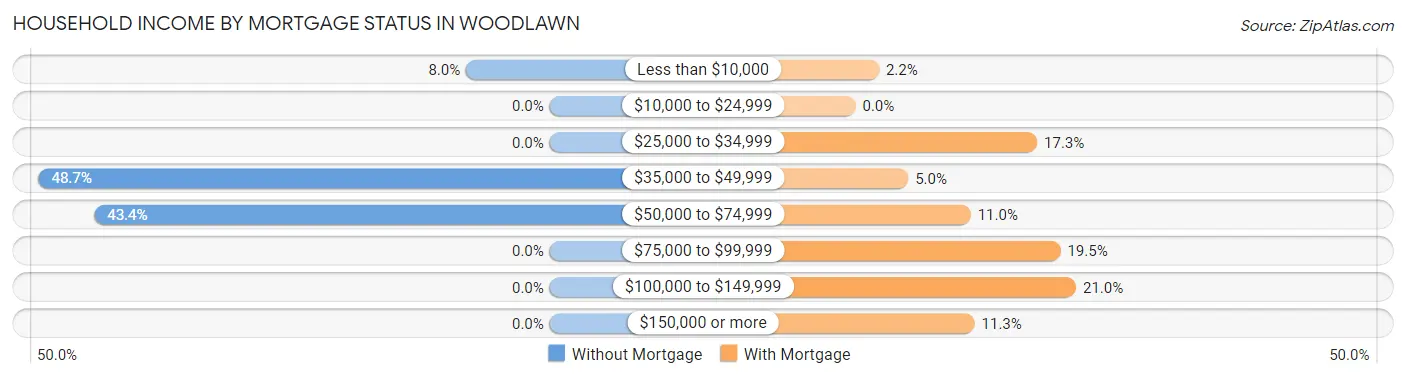
| Household Income | Without Mortgage | With Mortgage |
| Less than $10,000 | 9 (8.0%) | 12 (2.2%) |
| $10,000 to $24,999 | 0 (0.0%) | 0 (0.0%) |
| $25,000 to $34,999 | 0 (0.0%) | 93 (17.3%) |
| $35,000 to $49,999 | 55 (48.7%) | 27 (5.0%) |
| $50,000 to $74,999 | 49 (43.4%) | 59 (11.0%) |
| $75,000 to $99,999 | 0 (0.0%) | 105 (19.5%) |
| $100,000 to $149,999 | 0 (0.0%) | 113 (21.0%) |
| $150,000 or more | 0 (0.0%) | 61 (11.3%) |
| Total | 113 (100.0%) | 538 (100.0%) |
Property Value to Household Income Ratio in Woodlawn
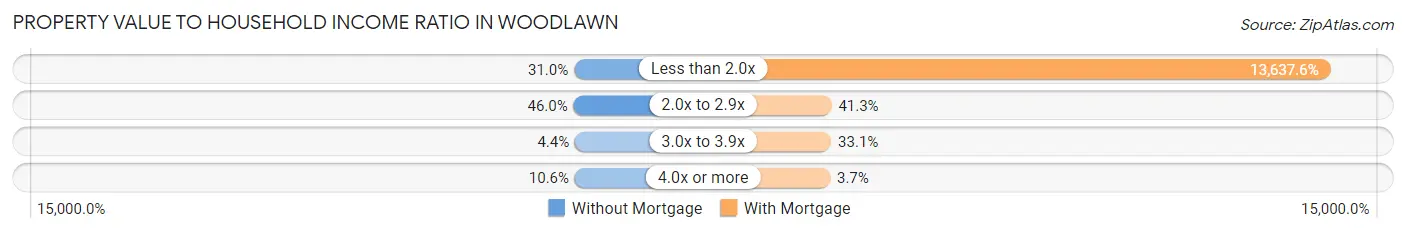
| Value-to-Income Ratio | Without Mortgage | With Mortgage |
| Less than 2.0x | 35 (31.0%) | 73,370 (13,637.5%) |
| 2.0x to 2.9x | 52 (46.0%) | 222 (41.3%) |
| 3.0x to 3.9x | 5 (4.4%) | 178 (33.1%) |
| 4.0x or more | 12 (10.6%) | 20 (3.7%) |
| Total | 113 (100.0%) | 538 (100.0%) |
Real Estate Taxes by Mortgage Status in Woodlawn
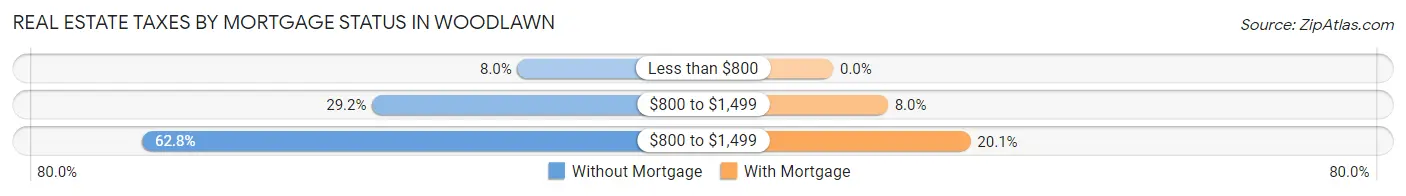
| Property Taxes | Without Mortgage | With Mortgage |
| Less than $800 | 9 (8.0%) | 0 (0.0%) |
| $800 to $1,499 | 33 (29.2%) | 43 (8.0%) |
| $800 to $1,499 | 71 (62.8%) | 108 (20.1%) |
| Total | 113 (100.0%) | 538 (100.0%) |
Health & Disability in Woodlawn
Health Insurance Coverage by Age in Woodlawn
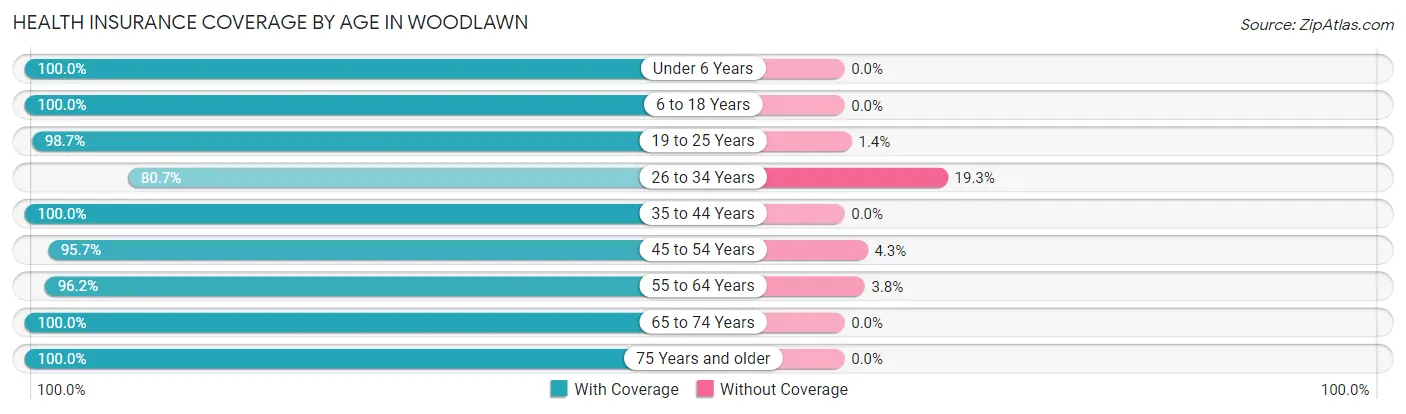
| Age Bracket | With Coverage | Without Coverage |
| Under 6 Years | 68 (100.0%) | 0 (0.0%) |
| 6 to 18 Years | 709 (100.0%) | 0 (0.0%) |
| 19 to 25 Years | 586 (98.7%) | 8 (1.3%) |
| 26 to 34 Years | 222 (80.7%) | 53 (19.3%) |
| 35 to 44 Years | 638 (100.0%) | 0 (0.0%) |
| 45 to 54 Years | 487 (95.7%) | 22 (4.3%) |
| 55 to 64 Years | 358 (96.2%) | 14 (3.8%) |
| 65 to 74 Years | 353 (100.0%) | 0 (0.0%) |
| 75 Years and older | 229 (100.0%) | 0 (0.0%) |
| Total | 3,650 (97.4%) | 97 (2.6%) |
Health Insurance Coverage by Citizenship Status in Woodlawn
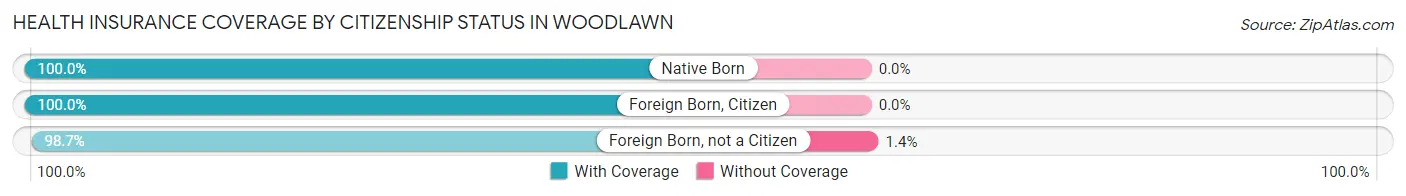
| Citizenship Status | With Coverage | Without Coverage |
| Native Born | 68 (100.0%) | 0 (0.0%) |
| Foreign Born, Citizen | 709 (100.0%) | 0 (0.0%) |
| Foreign Born, not a Citizen | 586 (98.7%) | 8 (1.3%) |
Health Insurance Coverage by Household Income in Woodlawn
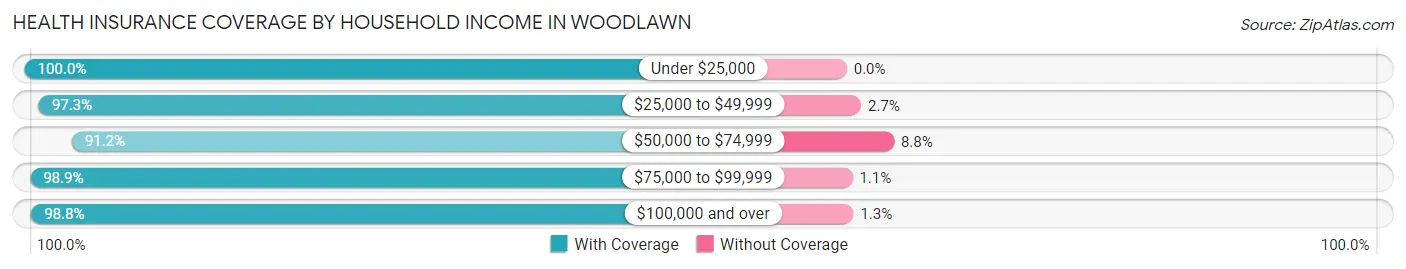
| Household Income | With Coverage | Without Coverage |
| Under $25,000 | 708 (100.0%) | 0 (0.0%) |
| $25,000 to $49,999 | 508 (97.3%) | 14 (2.7%) |
| $50,000 to $74,999 | 640 (91.2%) | 62 (8.8%) |
| $75,000 to $99,999 | 746 (98.9%) | 8 (1.1%) |
| $100,000 and over | 1,029 (98.8%) | 13 (1.3%) |
Public vs Private Health Insurance Coverage by Age in Woodlawn
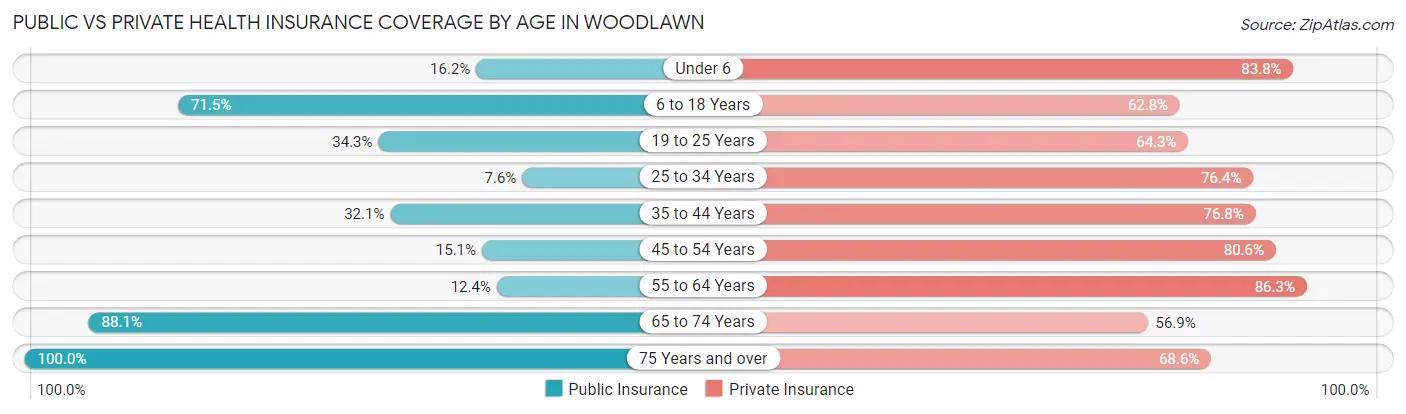
| Age Bracket | Public Insurance | Private Insurance |
| Under 6 | 11 (16.2%) | 57 (83.8%) |
| 6 to 18 Years | 507 (71.5%) | 445 (62.8%) |
| 19 to 25 Years | 204 (34.3%) | 382 (64.3%) |
| 25 to 34 Years | 21 (7.6%) | 210 (76.4%) |
| 35 to 44 Years | 205 (32.1%) | 490 (76.8%) |
| 45 to 54 Years | 77 (15.1%) | 410 (80.5%) |
| 55 to 64 Years | 46 (12.4%) | 321 (86.3%) |
| 65 to 74 Years | 311 (88.1%) | 201 (56.9%) |
| 75 Years and over | 229 (100.0%) | 157 (68.6%) |
| Total | 1,611 (43.0%) | 2,673 (71.3%) |
Disability Status by Sex by Age in Woodlawn
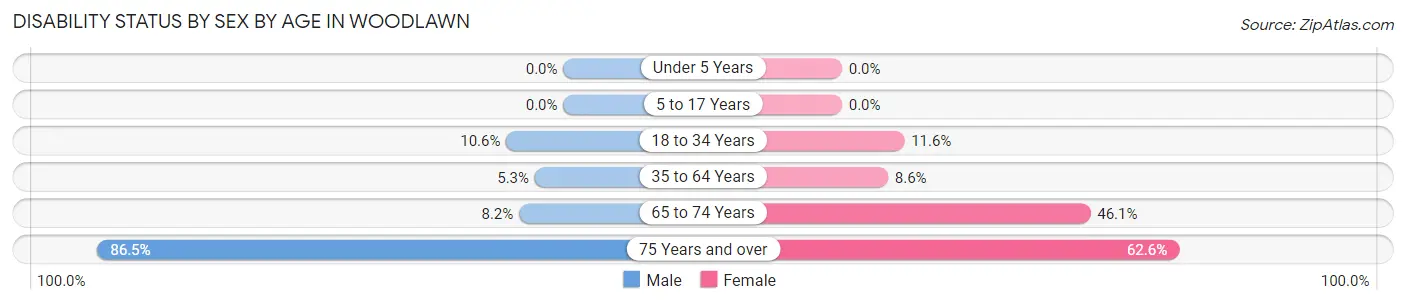
| Age Bracket | Male | Female |
| Under 5 Years | 0 (0.0%) | 0 (0.0%) |
| 5 to 17 Years | 0 (0.0%) | 0 (0.0%) |
| 18 to 34 Years | 41 (10.6%) | 69 (11.6%) |
| 35 to 64 Years | 37 (5.3%) | 70 (8.6%) |
| 65 to 74 Years | 11 (8.2%) | 101 (46.1%) |
| 75 Years and over | 64 (86.5%) | 97 (62.6%) |
Disability Class by Sex by Age in Woodlawn
Disability Class: Hearing Difficulty
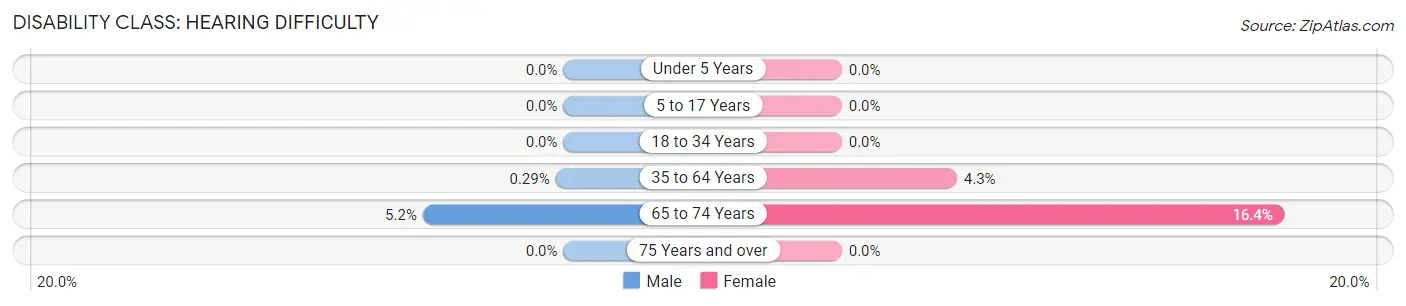
| Age Bracket | Male | Female |
| Under 5 Years | 0 (0.0%) | 0 (0.0%) |
| 5 to 17 Years | 0 (0.0%) | 0 (0.0%) |
| 18 to 34 Years | 0 (0.0%) | 0 (0.0%) |
| 35 to 64 Years | 2 (0.3%) | 35 (4.3%) |
| 65 to 74 Years | 7 (5.2%) | 36 (16.4%) |
| 75 Years and over | 0 (0.0%) | 0 (0.0%) |
Disability Class: Vision Difficulty
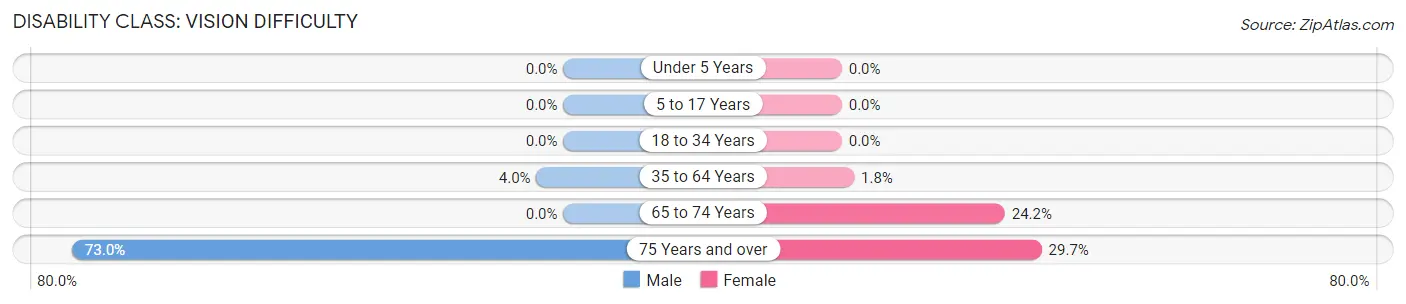
| Age Bracket | Male | Female |
| Under 5 Years | 0 (0.0%) | 0 (0.0%) |
| 5 to 17 Years | 0 (0.0%) | 0 (0.0%) |
| 18 to 34 Years | 0 (0.0%) | 0 (0.0%) |
| 35 to 64 Years | 28 (4.0%) | 15 (1.8%) |
| 65 to 74 Years | 0 (0.0%) | 53 (24.2%) |
| 75 Years and over | 54 (73.0%) | 46 (29.7%) |
Disability Class: Cognitive Difficulty
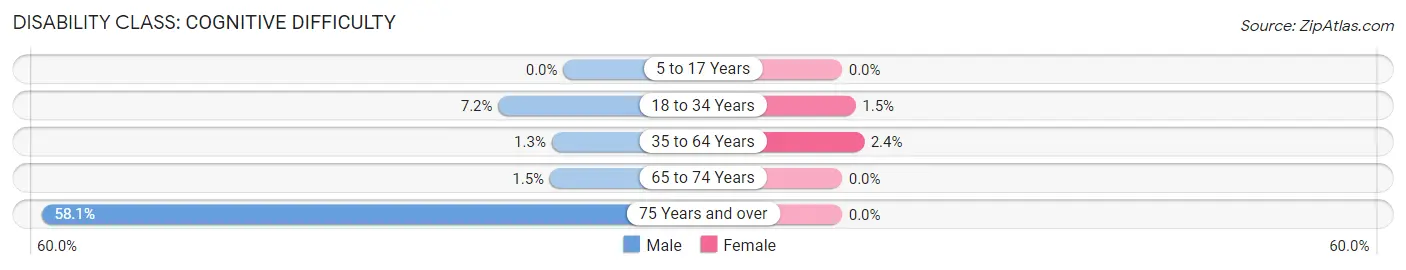
| Age Bracket | Male | Female |
| 5 to 17 Years | 0 (0.0%) | 0 (0.0%) |
| 18 to 34 Years | 28 (7.2%) | 9 (1.5%) |
| 35 to 64 Years | 9 (1.3%) | 20 (2.4%) |
| 65 to 74 Years | 2 (1.5%) | 0 (0.0%) |
| 75 Years and over | 43 (58.1%) | 0 (0.0%) |
Disability Class: Ambulatory Difficulty
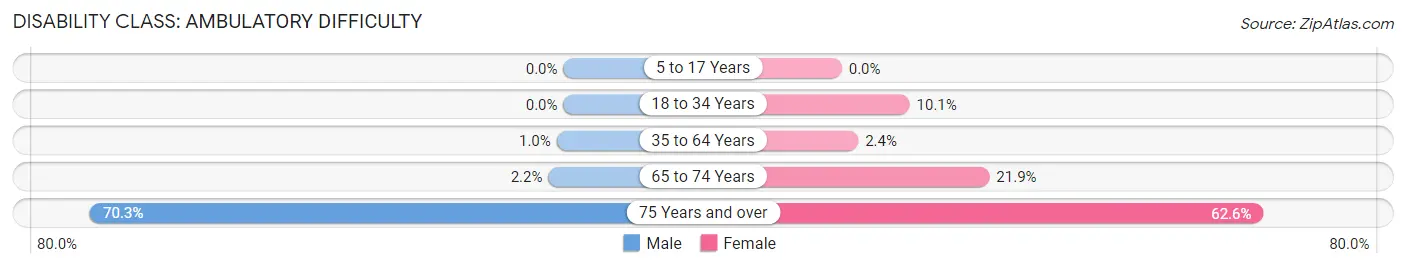
| Age Bracket | Male | Female |
| 5 to 17 Years | 0 (0.0%) | 0 (0.0%) |
| 18 to 34 Years | 0 (0.0%) | 60 (10.1%) |
| 35 to 64 Years | 7 (1.0%) | 20 (2.4%) |
| 65 to 74 Years | 3 (2.2%) | 48 (21.9%) |
| 75 Years and over | 52 (70.3%) | 97 (62.6%) |
Disability Class: Self-Care Difficulty
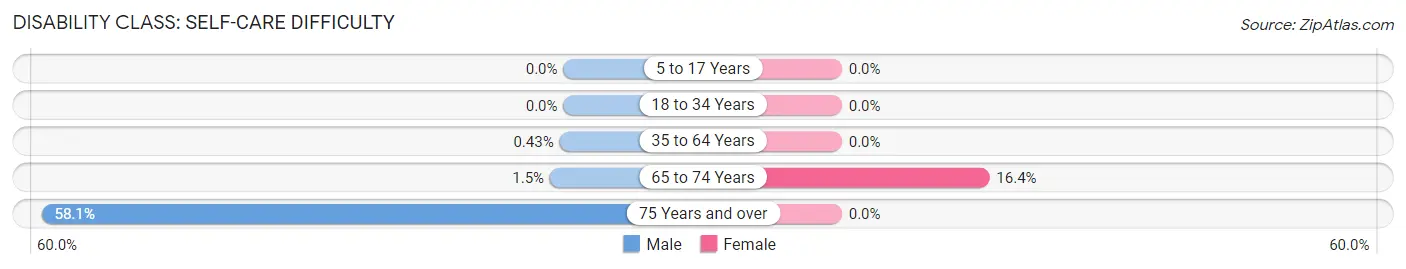
| Age Bracket | Male | Female |
| 5 to 17 Years | 0 (0.0%) | 0 (0.0%) |
| 18 to 34 Years | 0 (0.0%) | 0 (0.0%) |
| 35 to 64 Years | 3 (0.4%) | 0 (0.0%) |
| 65 to 74 Years | 2 (1.5%) | 36 (16.4%) |
| 75 Years and over | 43 (58.1%) | 0 (0.0%) |
Technology Access in Woodlawn
Computing Device Access in Woodlawn
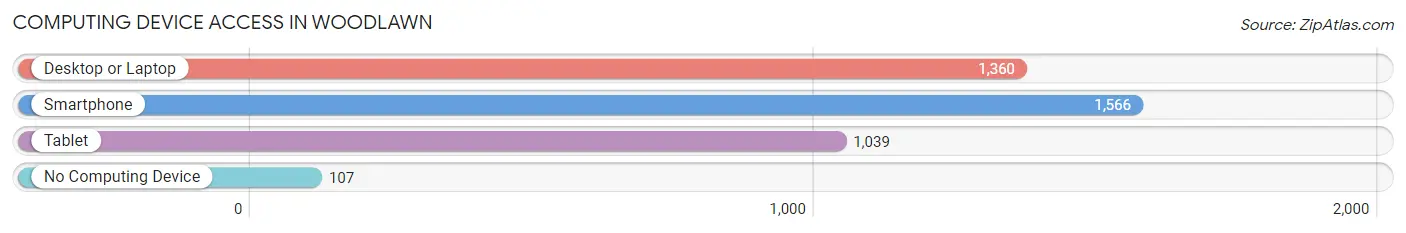
| Device Type | # Households | % Households |
| Desktop or Laptop | 1,360 | 77.4% |
| Smartphone | 1,566 | 89.1% |
| Tablet | 1,039 | 59.1% |
| No Computing Device | 107 | 6.1% |
| Total | 1,758 | 100.0% |
Internet Access in Woodlawn
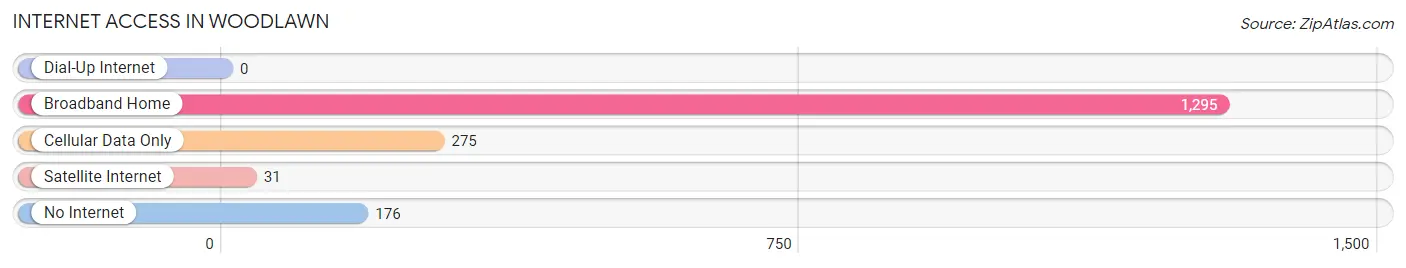
| Internet Type | # Households | % Households |
| Dial-Up Internet | 0 | 0.0% |
| Broadband Home | 1,295 | 73.7% |
| Cellular Data Only | 275 | 15.6% |
| Satellite Internet | 31 | 1.8% |
| No Internet | 176 | 10.0% |
| Total | 1,758 | 100.0% |
Woodlawn Summary
Woodlawn, Ohio is a small village located in Hamilton County, Ohio. It is situated just north of Cincinnati, Ohio and is part of the Cincinnati metropolitan area. The village has a population of approximately 4,000 people and is home to a variety of businesses, including a large shopping center.
History
Woodlawn was founded in 1845 by a group of settlers from Pennsylvania. The village was originally known as “Woodlawn Station” and was a stop on the Cincinnati, Hamilton and Dayton Railroad. The village was incorporated in 1867 and was named after the nearby Woodlawn Cemetery.
In the late 19th century, Woodlawn was a popular destination for wealthy Cincinnatians who wanted to escape the city. The village was known for its large estates and beautiful homes. In the early 20th century, the village began to decline as the wealthy moved away and the population decreased.
In the 1950s, the village was revitalized with the construction of a large shopping center. This shopping center, known as the Woodlawn Shopping Center, is still in operation today and is the largest shopping center in the village.
Geography
Woodlawn is located in Hamilton County, Ohio. It is situated just north of Cincinnati, Ohio and is part of the Cincinnati metropolitan area. The village is bordered by the cities of Forest Park, Springfield Township, and Lockland.
The village is located on the banks of the Mill Creek, which is a tributary of the Great Miami River. The village is also located near the Little Miami River, which is a tributary of the Ohio River.
The village has a total area of 1.2 square miles, all of which is land. The village is located at an elevation of 845 feet above sea level.
Economy
The economy of Woodlawn is largely based on retail and services. The village is home to a large shopping center, which is the largest shopping center in the village. The shopping center is home to a variety of stores, including a grocery store, a department store, and a variety of specialty stores.
The village is also home to a variety of restaurants, including fast food restaurants, family restaurants, and fine dining establishments. The village is also home to a variety of professional services, including medical offices, law offices, and financial services.
Demographics
As of the 2010 census, the population of Woodlawn was 4,000. The racial makeup of the village was 94.3% White, 2.2% African American, 0.2% Native American, 0.7% Asian, 0.1% Pacific Islander, 0.7% from other races, and 1.9% from two or more races. Hispanic or Latino of any race were 2.2% of the population.
The median income for a household in the village was $45,000, and the median income for a family was $50,000. The per capita income for the village was $20,000. About 8.3% of families and 10.2% of the population were below the poverty line, including 14.3% of those under age 18 and 6.7% of those age 65 or over.
Common Questions
What is Per Capita Income in Woodlawn?
Per Capita income in Woodlawn is $32,732.
What is the Median Family Income in Woodlawn?
Median Family Income in Woodlawn is $66,750.
What is the Median Household income in Woodlawn?
Median Household Income in Woodlawn is $59,977.
What is Income or Wage Gap in Woodlawn?
Income or Wage Gap in Woodlawn is 3.3%.
Women in Woodlawn earn 96.7 cents for every dollar earned by a man.
What is Inequality or Gini Index in Woodlawn?
Inequality or Gini Index in Woodlawn is 0.37.
What is the Total Population of Woodlawn?
Total Population of Woodlawn is 3,862.
What is the Total Male Population of Woodlawn?
Total Male Population of Woodlawn is 1,541.
What is the Total Female Population of Woodlawn?
Total Female Population of Woodlawn is 2,321.
What is the Ratio of Males per 100 Females in Woodlawn?
There are 66.39 Males per 100 Females in Woodlawn.
What is the Ratio of Females per 100 Males in Woodlawn?
There are 150.62 Females per 100 Males in Woodlawn.
What is the Median Population Age in Woodlawn?
Median Population Age in Woodlawn is 39.7 Years.
What is the Average Family Size in Woodlawn
Average Family Size in Woodlawn is 3.1 People.
What is the Average Household Size in Woodlawn
Average Household Size in Woodlawn is 2.1 People.
How Large is the Labor Force in Woodlawn?
There are 2,268 People in the Labor Forcein in Woodlawn.
What is the Percentage of People in the Labor Force in Woodlawn?
70.0% of People are in the Labor Force in Woodlawn.
What is the Unemployment Rate in Woodlawn?
Unemployment Rate in Woodlawn is 3.0%.