Cities with the Highest Percentage of Slovene Population in Ohio
RELATED REPORTS & OPTIONS
Slovene
Ohio
Compare Cities
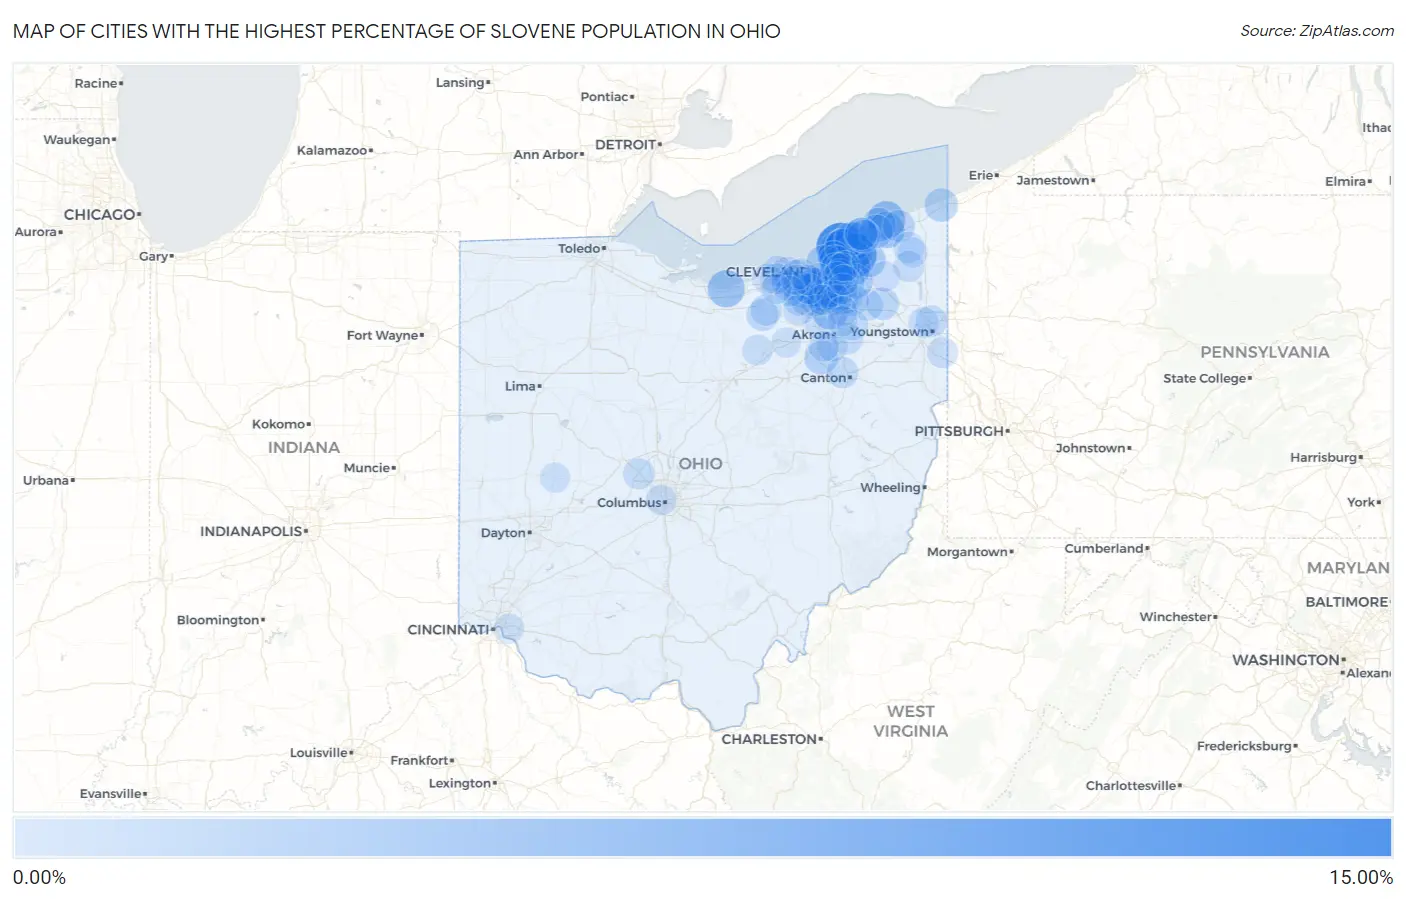
Map of Cities with the Highest Percentage of Slovene Population in Ohio
0.00%
15.00%
Cities with the Highest Percentage of Slovene Population in Ohio
| City | Slovene | vs State | vs National | |
| 1. | Lakeline | 12.12% | 0.40%(+11.7)#1 | 0.052%(+12.1)#12 |
| 2. | Kirtland | 9.75% | 0.40%(+9.35)#2 | 0.052%(+9.70)#15 |
| 3. | Willoughby Hills | 8.67% | 0.40%(+8.27)#3 | 0.052%(+8.62)#17 |
| 4. | Valley View | 8.47% | 0.40%(+8.07)#4 | 0.052%(+8.42)#18 |
| 5. | Wickliffe | 8.27% | 0.40%(+7.87)#5 | 0.052%(+8.22)#20 |
| 6. | Waite Hill | 7.04% | 0.40%(+6.64)#6 | 0.052%(+6.99)#29 |
| 7. | Willoughby | 6.79% | 0.40%(+6.38)#7 | 0.052%(+6.74)#30 |
| 8. | Willowick | 6.73% | 0.40%(+6.32)#8 | 0.052%(+6.67)#33 |
| 9. | Independence | 6.63% | 0.40%(+6.23)#9 | 0.052%(+6.58)#34 |
| 10. | Mayfield | 5.95% | 0.40%(+5.55)#10 | 0.052%(+5.90)#39 |
| 11. | North Lima | 5.54% | 0.40%(+5.13)#11 | 0.052%(+5.48)#43 |
| 12. | Eastlake | 5.29% | 0.40%(+4.89)#12 | 0.052%(+5.24)#45 |
| 13. | North Madison | 5.10% | 0.40%(+4.70)#13 | 0.052%(+5.05)#48 |
| 14. | Mentor | 5.04% | 0.40%(+4.64)#14 | 0.052%(+4.99)#51 |
| 15. | Mitiwanga | 4.82% | 0.40%(+4.42)#15 | 0.052%(+4.77)#52 |
| 16. | Kirtland Hills | 4.57% | 0.40%(+4.17)#16 | 0.052%(+4.52)#57 |
| 17. | Chesterland | 4.54% | 0.40%(+4.13)#17 | 0.052%(+4.49)#58 |
| 18. | Peninsula | 4.42% | 0.40%(+4.02)#18 | 0.052%(+4.37)#60 |
| 19. | Madison | 4.39% | 0.40%(+3.99)#19 | 0.052%(+4.34)#61 |
| 20. | Seven Hills | 3.83% | 0.40%(+3.42)#20 | 0.052%(+3.78)#68 |
| 21. | Highland Heights | 3.56% | 0.40%(+3.16)#21 | 0.052%(+3.51)#73 |
| 22. | South Russell | 3.53% | 0.40%(+3.13)#22 | 0.052%(+3.48)#75 |
| 23. | Bratenahl | 3.38% | 0.40%(+2.97)#23 | 0.052%(+3.32)#82 |
| 24. | Timberlake | 3.36% | 0.40%(+2.96)#24 | 0.052%(+3.31)#83 |
| 25. | North Perry | 3.17% | 0.40%(+2.77)#25 | 0.052%(+3.12)#88 |
| 26. | Chardon | 3.09% | 0.40%(+2.68)#26 | 0.052%(+3.04)#92 |
| 27. | Mentor On The Lake | 2.92% | 0.40%(+2.52)#27 | 0.052%(+2.87)#95 |
| 28. | Clinton | 2.82% | 0.40%(+2.42)#28 | 0.052%(+2.77)#98 |
| 29. | Grand River | 2.81% | 0.40%(+2.40)#29 | 0.052%(+2.75)#100 |
| 30. | Conneaut | 2.68% | 0.40%(+2.28)#30 | 0.052%(+2.63)#109 |
| 31. | Perry | 2.66% | 0.40%(+2.26)#31 | 0.052%(+2.61)#111 |
| 32. | Euclid | 2.44% | 0.40%(+2.03)#32 | 0.052%(+2.38)#120 |
| 33. | Painesville | 2.35% | 0.40%(+1.95)#33 | 0.052%(+2.30)#122 |
| 34. | Brooklyn Heights | 2.20% | 0.40%(+1.80)#34 | 0.052%(+2.15)#127 |
| 35. | Fairport Harbor | 2.19% | 0.40%(+1.79)#35 | 0.052%(+2.14)#128 |
| 36. | Garrettsville | 2.12% | 0.40%(+1.72)#36 | 0.052%(+2.07)#133 |
| 37. | Middleburg Heights | 2.05% | 0.40%(+1.65)#37 | 0.052%(+2.00)#138 |
| 38. | North Royalton | 2.04% | 0.40%(+1.64)#38 | 0.052%(+1.99)#139 |
| 39. | Geneva | 2.04% | 0.40%(+1.64)#39 | 0.052%(+1.99)#140 |
| 40. | Broadview Heights | 2.00% | 0.40%(+1.60)#40 | 0.052%(+1.95)#144 |
| 41. | North Randall | 1.98% | 0.40%(+1.57)#41 | 0.052%(+1.92)#149 |
| 42. | Pheasant Run | 1.89% | 0.40%(+1.49)#42 | 0.052%(+1.84)#158 |
| 43. | Chagrin Falls | 1.87% | 0.40%(+1.47)#43 | 0.052%(+1.82)#161 |
| 44. | Richmond Heights | 1.84% | 0.40%(+1.44)#44 | 0.052%(+1.79)#163 |
| 45. | Lyndhurst | 1.81% | 0.40%(+1.40)#45 | 0.052%(+1.75)#164 |
| 46. | Reminderville | 1.75% | 0.40%(+1.35)#46 | 0.052%(+1.70)#171 |
| 47. | Bay Village | 1.75% | 0.40%(+1.35)#47 | 0.052%(+1.70)#172 |
| 48. | Twinsburg | 1.74% | 0.40%(+1.34)#48 | 0.052%(+1.69)#174 |
| 49. | Walton Hills | 1.73% | 0.40%(+1.33)#49 | 0.052%(+1.68)#175 |
| 50. | Bass Lake | 1.72% | 0.40%(+1.32)#50 | 0.052%(+1.67)#176 |
| 51. | Pepper Pike | 1.62% | 0.40%(+1.22)#51 | 0.052%(+1.57)#186 |
| 52. | Lagrange | 1.62% | 0.40%(+1.21)#52 | 0.052%(+1.56)#188 |
| 53. | Churchill | 1.61% | 0.40%(+1.20)#53 | 0.052%(+1.56)#189 |
| 54. | Mayfield Heights | 1.60% | 0.40%(+1.20)#54 | 0.052%(+1.55)#190 |
| 55. | Hills And Dales | 1.57% | 0.40%(+1.17)#55 | 0.052%(+1.52)#192 |
| 56. | Mantua | 1.56% | 0.40%(+1.16)#56 | 0.052%(+1.51)#193 |
| 57. | New California | 1.52% | 0.40%(+1.12)#57 | 0.052%(+1.47)#203 |
| 58. | Mogadore | 1.51% | 0.40%(+1.11)#58 | 0.052%(+1.46)#206 |
| 59. | Westlake | 1.50% | 0.40%(+1.10)#59 | 0.052%(+1.45)#209 |
| 60. | Newburgh Heights | 1.48% | 0.40%(+1.07)#60 | 0.052%(+1.43)#214 |
| 61. | Brook Park | 1.47% | 0.40%(+1.07)#61 | 0.052%(+1.42)#215 |
| 62. | Woodmere | 1.46% | 0.40%(+1.06)#62 | 0.052%(+1.41)#219 |
| 63. | Northfield | 1.44% | 0.40%(+1.04)#63 | 0.052%(+1.39)#222 |
| 64. | Oakwood Village Cuyahoga County | 1.41% | 0.40%(+1.01)#64 | 0.052%(+1.36)#223 |
| 65. | North Olmsted | 1.40% | 0.40%(+0.996)#65 | 0.052%(+1.35)#225 |
| 66. | Rock Creek | 1.39% | 0.40%(+0.984)#66 | 0.052%(+1.34)#226 |
| 67. | Strongsville | 1.37% | 0.40%(+0.964)#67 | 0.052%(+1.32)#229 |
| 68. | Aurora | 1.36% | 0.40%(+0.956)#68 | 0.052%(+1.31)#230 |
| 69. | Montrose Ghent | 1.33% | 0.40%(+0.930)#69 | 0.052%(+1.28)#233 |
| 70. | Brunswick | 1.32% | 0.40%(+0.917)#70 | 0.052%(+1.27)#234 |
| 71. | New Middletown | 1.32% | 0.40%(+0.914)#71 | 0.052%(+1.26)#236 |
| 72. | Avon Lake | 1.31% | 0.40%(+0.906)#72 | 0.052%(+1.26)#240 |
| 73. | Lakewood | 1.29% | 0.40%(+0.888)#73 | 0.052%(+1.24)#242 |
| 74. | Orwell | 1.27% | 0.40%(+0.872)#74 | 0.052%(+1.22)#245 |
| 75. | Macedonia | 1.25% | 0.40%(+0.843)#75 | 0.052%(+1.19)#250 |
| 76. | Avon | 1.24% | 0.40%(+0.838)#76 | 0.052%(+1.19)#251 |
| 77. | Portage Lakes | 1.21% | 0.40%(+0.811)#77 | 0.052%(+1.16)#255 |
| 78. | Kent | 1.20% | 0.40%(+0.797)#78 | 0.052%(+1.15)#259 |
| 79. | Parma | 1.18% | 0.40%(+0.774)#79 | 0.052%(+1.12)#265 |
| 80. | Cinnamon Lake | 1.17% | 0.40%(+0.766)#80 | 0.052%(+1.12)#266 |
| 81. | Brooklyn | 1.15% | 0.40%(+0.743)#81 | 0.052%(+1.09)#270 |
| 82. | Barberton | 1.14% | 0.40%(+0.738)#82 | 0.052%(+1.09)#274 |
| 83. | Mcdonald | 1.14% | 0.40%(+0.737)#83 | 0.052%(+1.09)#276 |
| 84. | Brecksville | 1.14% | 0.40%(+0.736)#84 | 0.052%(+1.09)#277 |
| 85. | Sheffield | 1.14% | 0.40%(+0.733)#85 | 0.052%(+1.08)#278 |
| 86. | Rocky River | 1.13% | 0.40%(+0.729)#86 | 0.052%(+1.08)#281 |
| 87. | Olmsted Falls | 1.13% | 0.40%(+0.728)#87 | 0.052%(+1.08)#282 |
| 88. | Grandview Heights | 1.09% | 0.40%(+0.687)#88 | 0.052%(+1.04)#295 |
| 89. | Solon | 1.03% | 0.40%(+0.624)#89 | 0.052%(+0.975)#310 |
| 90. | Middlefield | 0.98% | 0.40%(+0.578)#90 | 0.052%(+0.929)#327 |
| 91. | Fairview Park | 0.96% | 0.40%(+0.560)#91 | 0.052%(+0.911)#335 |
| 92. | Turpin Hills | 0.94% | 0.40%(+0.541)#92 | 0.052%(+0.892)#340 |
| 93. | Gates Mills | 0.93% | 0.40%(+0.524)#93 | 0.052%(+0.875)#345 |
| 94. | Westfield Center | 0.91% | 0.40%(+0.512)#94 | 0.052%(+0.863)#347 |
| 95. | North Ridgeville | 0.91% | 0.40%(+0.508)#95 | 0.052%(+0.859)#350 |
| 96. | Hudson | 0.89% | 0.40%(+0.488)#96 | 0.052%(+0.839)#358 |
| 97. | St Paris | 0.89% | 0.40%(+0.486)#97 | 0.052%(+0.837)#361 |
| 98. | Stow | 0.89% | 0.40%(+0.485)#98 | 0.052%(+0.836)#363 |
| 99. | Moreland Hills | 0.87% | 0.40%(+0.469)#99 | 0.052%(+0.820)#367 |
| 100. | Roaming Shores | 0.87% | 0.40%(+0.466)#100 | 0.052%(+0.817)#371 |
Common Questions
What are the Top 10 Cities with the Highest Percentage of Slovene Population in Ohio?
Top 10 Cities with the Highest Percentage of Slovene Population in Ohio are:
#1
12.12%
#2
9.75%
#3
8.67%
#4
8.47%
#5
8.27%
#6
7.04%
#7
6.79%
#8
6.73%
#9
6.63%
#10
5.95%
What city has the Highest Percentage of Slovene Population in Ohio?
Lakeline has the Highest Percentage of Slovene Population in Ohio with 12.12%.
What is the Percentage of Slovene Population in the State of Ohio?
Percentage of Slovene Population in Ohio is 0.40%.
What is the Percentage of Slovene Population in the United States?
Percentage of Slovene Population in the United States is 0.052%.