Cities with the Most Immigrants from South America in Ohio
RELATED REPORTS & OPTIONS
South America
Ohio
Compare Cities
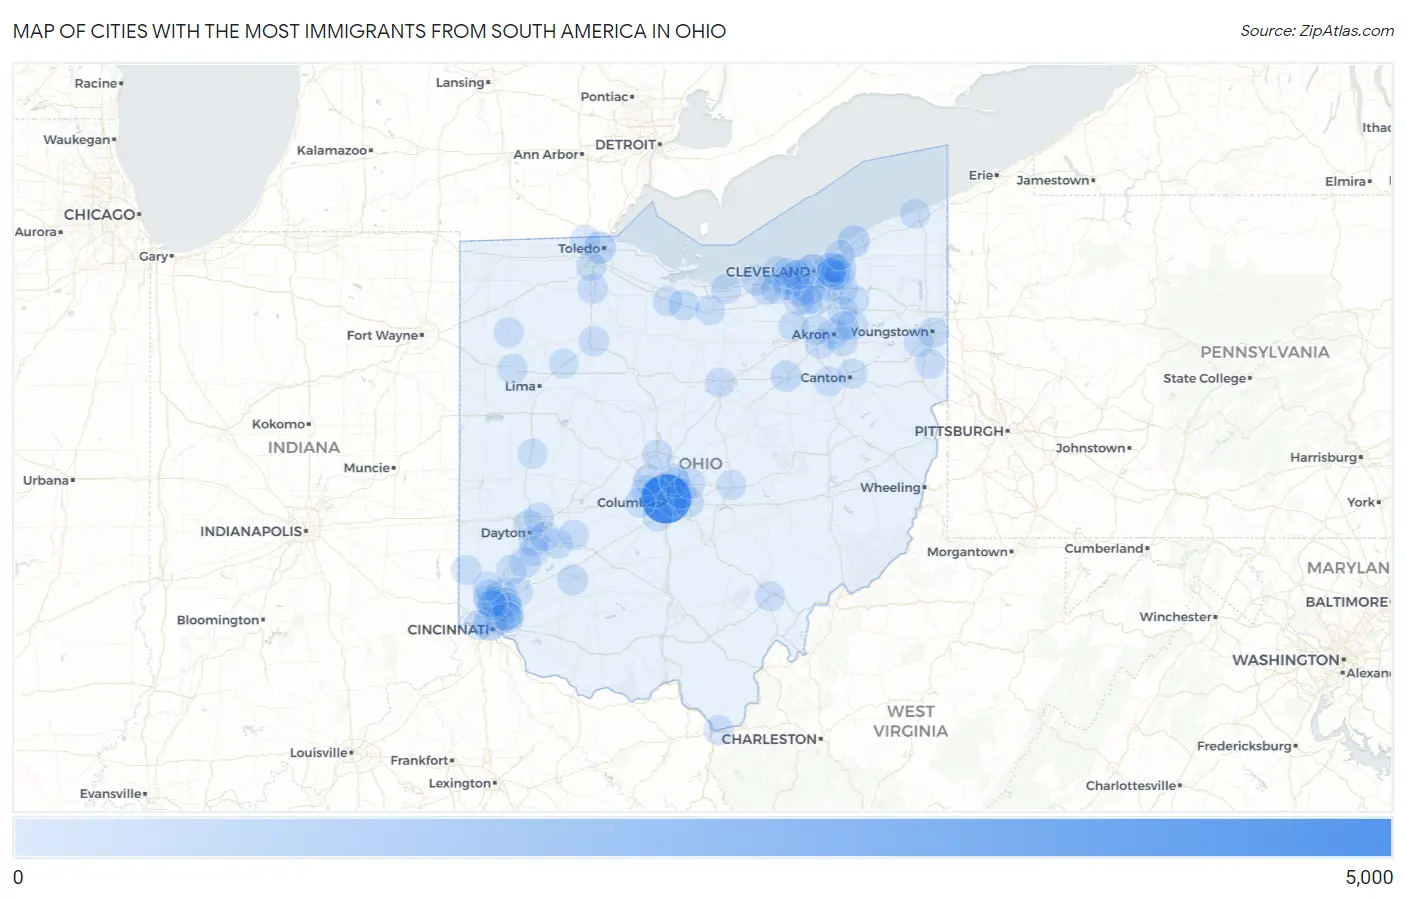
Map of Cities with the Most Immigrants from South America in Ohio
0
5,000
Cities with the Most Immigrants from South America in Ohio
| City | South America | vs State | vs National | |
| 1. | Columbus | 4,201 | 22,909(18.34%)#1 | 3,636,375(0.12%)#105 |
| 2. | Cleveland | 942 | 22,909(4.11%)#2 | 3,636,375(0.03%)#516 |
| 3. | Cincinnati | 673 | 22,909(2.94%)#3 | 3,636,375(0.02%)#719 |
| 4. | Mentor | 452 | 22,909(1.97%)#4 | 3,636,375(0.01%)#977 |
| 5. | Toledo | 427 | 22,909(1.86%)#5 | 3,636,375(0.01%)#1,025 |
| 6. | Hilliard | 378 | 22,909(1.65%)#6 | 3,636,375(0.01%)#1,132 |
| 7. | Parma | 352 | 22,909(1.54%)#7 | 3,636,375(0.01%)#1,192 |
| 8. | Wooster | 254 | 22,909(1.11%)#8 | 3,636,375(0.01%)#1,507 |
| 9. | Fairfield | 215 | 22,909(0.94%)#9 | 3,636,375(0.01%)#1,690 |
| 10. | Shaker Heights | 202 | 22,909(0.88%)#10 | 3,636,375(0.01%)#1,756 |
| 11. | Bellevue | 189 | 22,909(0.83%)#11 | 3,636,375(0.01%)#1,831 |
| 12. | Dublin | 187 | 22,909(0.82%)#12 | 3,636,375(0.01%)#1,839 |
| 13. | Wilmington | 184 | 22,909(0.80%)#13 | 3,636,375(0.01%)#1,853 |
| 14. | Dayton | 180 | 22,909(0.79%)#14 | 3,636,375(0.00%)#1,868 |
| 15. | Lorain | 169 | 22,909(0.74%)#15 | 3,636,375(0.00%)#1,944 |
| 16. | Strongsville | 168 | 22,909(0.73%)#16 | 3,636,375(0.00%)#1,952 |
| 17. | Solon | 168 | 22,909(0.73%)#17 | 3,636,375(0.00%)#1,955 |
| 18. | Delaware | 167 | 22,909(0.73%)#18 | 3,636,375(0.00%)#1,964 |
| 19. | Springboro | 159 | 22,909(0.69%)#19 | 3,636,375(0.00%)#2,023 |
| 20. | Westlake | 150 | 22,909(0.65%)#20 | 3,636,375(0.00%)#2,071 |
| 21. | Cleveland Heights | 148 | 22,909(0.65%)#21 | 3,636,375(0.00%)#2,086 |
| 22. | Middletown | 142 | 22,909(0.62%)#22 | 3,636,375(0.00%)#2,148 |
| 23. | Mayfield Heights | 137 | 22,909(0.60%)#23 | 3,636,375(0.00%)#2,196 |
| 24. | Youngstown | 127 | 22,909(0.55%)#24 | 3,636,375(0.00%)#2,294 |
| 25. | Kenwood | 127 | 22,909(0.55%)#25 | 3,636,375(0.00%)#2,305 |
| 26. | Pleasant Run Farm | 118 | 22,909(0.52%)#26 | 3,636,375(0.00%)#2,406 |
| 27. | Medina | 113 | 22,909(0.49%)#27 | 3,636,375(0.00%)#2,448 |
| 28. | Beckett Ridge | 113 | 22,909(0.49%)#28 | 3,636,375(0.00%)#2,459 |
| 29. | Springdale | 112 | 22,909(0.49%)#29 | 3,636,375(0.00%)#2,472 |
| 30. | Lakewood | 111 | 22,909(0.48%)#30 | 3,636,375(0.00%)#2,477 |
| 31. | Akron | 110 | 22,909(0.48%)#31 | 3,636,375(0.00%)#2,494 |
| 32. | Bowling Green | 106 | 22,909(0.46%)#32 | 3,636,375(0.00%)#2,547 |
| 33. | Beachwood | 105 | 22,909(0.46%)#33 | 3,636,375(0.00%)#2,563 |
| 34. | Mason | 103 | 22,909(0.45%)#34 | 3,636,375(0.00%)#2,583 |
| 35. | Kettering | 101 | 22,909(0.44%)#35 | 3,636,375(0.00%)#2,614 |
| 36. | Bexley | 98 | 22,909(0.43%)#36 | 3,636,375(0.00%)#2,648 |
| 37. | Upper Arlington | 97 | 22,909(0.42%)#37 | 3,636,375(0.00%)#2,660 |
| 38. | Reynoldsburg | 95 | 22,909(0.41%)#38 | 3,636,375(0.00%)#2,684 |
| 39. | Norton | 92 | 22,909(0.40%)#39 | 3,636,375(0.00%)#2,739 |
| 40. | Findlay | 91 | 22,909(0.40%)#40 | 3,636,375(0.00%)#2,748 |
| 41. | Mitiwanga | 91 | 22,909(0.40%)#41 | 3,636,375(0.00%)#2,766 |
| 42. | Kent | 89 | 22,909(0.39%)#42 | 3,636,375(0.00%)#2,782 |
| 43. | Middleburg Heights | 89 | 22,909(0.39%)#43 | 3,636,375(0.00%)#2,786 |
| 44. | Sawyerwood | 88 | 22,909(0.38%)#44 | 3,636,375(0.00%)#2,804 |
| 45. | Aurora | 83 | 22,909(0.36%)#45 | 3,636,375(0.00%)#2,884 |
| 46. | North Ridgeville | 80 | 22,909(0.35%)#46 | 3,636,375(0.00%)#2,926 |
| 47. | Xenia | 74 | 22,909(0.32%)#47 | 3,636,375(0.00%)#3,037 |
| 48. | Clyde | 74 | 22,909(0.32%)#48 | 3,636,375(0.00%)#3,053 |
| 49. | Avon Lake | 73 | 22,909(0.32%)#49 | 3,636,375(0.00%)#3,061 |
| 50. | Sidney | 72 | 22,909(0.31%)#50 | 3,636,375(0.00%)#3,090 |
| 51. | Norwalk | 72 | 22,909(0.31%)#51 | 3,636,375(0.00%)#3,095 |
| 52. | Ashtabula | 71 | 22,909(0.31%)#52 | 3,636,375(0.00%)#3,112 |
| 53. | Sharonville | 70 | 22,909(0.31%)#53 | 3,636,375(0.00%)#3,134 |
| 54. | Grove City | 68 | 22,909(0.30%)#54 | 3,636,375(0.00%)#3,182 |
| 55. | Maple Heights | 68 | 22,909(0.30%)#55 | 3,636,375(0.00%)#3,184 |
| 56. | Broadview Heights | 68 | 22,909(0.30%)#56 | 3,636,375(0.00%)#3,185 |
| 57. | Blue Ash | 66 | 22,909(0.29%)#57 | 3,636,375(0.00%)#3,237 |
| 58. | Westerville | 63 | 22,909(0.28%)#58 | 3,636,375(0.00%)#3,301 |
| 59. | North Olmsted | 63 | 22,909(0.28%)#59 | 3,636,375(0.00%)#3,302 |
| 60. | South Euclid | 63 | 22,909(0.28%)#60 | 3,636,375(0.00%)#3,306 |
| 61. | Columbiana | 62 | 22,909(0.27%)#61 | 3,636,375(0.00%)#3,340 |
| 62. | Gahanna | 61 | 22,909(0.27%)#62 | 3,636,375(0.00%)#3,355 |
| 63. | Elyria | 59 | 22,909(0.26%)#63 | 3,636,375(0.00%)#3,396 |
| 64. | Huber Heights | 59 | 22,909(0.26%)#64 | 3,636,375(0.00%)#3,397 |
| 65. | Pepper Pike | 59 | 22,909(0.26%)#65 | 3,636,375(0.00%)#3,417 |
| 66. | Madeira | 56 | 22,909(0.24%)#66 | 3,636,375(0.00%)#3,496 |
| 67. | Lake Darby | 56 | 22,909(0.24%)#67 | 3,636,375(0.00%)#3,503 |
| 68. | Bluffton | 56 | 22,909(0.24%)#68 | 3,636,375(0.00%)#3,508 |
| 69. | Norwood | 54 | 22,909(0.24%)#69 | 3,636,375(0.00%)#3,553 |
| 70. | Lyndhurst | 54 | 22,909(0.24%)#70 | 3,636,375(0.00%)#3,557 |
| 71. | Bay Village | 53 | 22,909(0.23%)#71 | 3,636,375(0.00%)#3,587 |
| 72. | Oakwood | 52 | 22,909(0.23%)#72 | 3,636,375(0.00%)#3,631 |
| 73. | Canfield | 52 | 22,909(0.23%)#73 | 3,636,375(0.00%)#3,635 |
| 74. | North Royalton | 50 | 22,909(0.22%)#74 | 3,636,375(0.00%)#3,687 |
| 75. | Burlington | 49 | 22,909(0.21%)#75 | 3,636,375(0.00%)#3,751 |
| 76. | Massillon | 48 | 22,909(0.21%)#76 | 3,636,375(0.00%)#3,762 |
| 77. | Oxford | 48 | 22,909(0.21%)#77 | 3,636,375(0.00%)#3,764 |
| 78. | Mansfield | 46 | 22,909(0.20%)#78 | 3,636,375(0.00%)#3,820 |
| 79. | Sylvania | 46 | 22,909(0.20%)#79 | 3,636,375(0.00%)#3,828 |
| 80. | Delphos | 46 | 22,909(0.20%)#80 | 3,636,375(0.00%)#3,845 |
| 81. | Silverton | 46 | 22,909(0.20%)#81 | 3,636,375(0.00%)#3,848 |
| 82. | Huber Ridge | 45 | 22,909(0.20%)#82 | 3,636,375(0.00%)#3,886 |
| 83. | Perrysburg | 44 | 22,909(0.19%)#83 | 3,636,375(0.00%)#3,903 |
| 84. | Rocky River | 44 | 22,909(0.19%)#84 | 3,636,375(0.00%)#3,907 |
| 85. | Forest Park | 43 | 22,909(0.19%)#85 | 3,636,375(0.00%)#3,943 |
| 86. | University Heights | 43 | 22,909(0.19%)#86 | 3,636,375(0.00%)#3,946 |
| 87. | Wickliffe | 43 | 22,909(0.19%)#87 | 3,636,375(0.00%)#3,949 |
| 88. | Centerville | 42 | 22,909(0.18%)#88 | 3,636,375(0.00%)#3,981 |
| 89. | Hudson | 42 | 22,909(0.18%)#89 | 3,636,375(0.00%)#3,982 |
| 90. | Athens | 41 | 22,909(0.18%)#90 | 3,636,375(0.00%)#4,015 |
| 91. | Covedale | 41 | 22,909(0.18%)#91 | 3,636,375(0.00%)#4,028 |
| 92. | Beavercreek | 40 | 22,909(0.17%)#92 | 3,636,375(0.00%)#4,044 |
| 93. | New Albany | 39 | 22,909(0.17%)#93 | 3,636,375(0.00%)#4,101 |
| 94. | Newark | 38 | 22,909(0.17%)#94 | 3,636,375(0.00%)#4,131 |
| 95. | Canton | 37 | 22,909(0.16%)#95 | 3,636,375(0.00%)#4,175 |
| 96. | Munroe Falls | 37 | 22,909(0.16%)#96 | 3,636,375(0.00%)#4,200 |
| 97. | Pigeon Creek | 37 | 22,909(0.16%)#97 | 3,636,375(0.00%)#4,221 |
| 98. | Cedarville | 36 | 22,909(0.16%)#98 | 3,636,375(0.00%)#4,251 |
| 99. | Greenhills | 36 | 22,909(0.16%)#99 | 3,636,375(0.00%)#4,253 |
| 100. | Hamilton | 35 | 22,909(0.15%)#100 | 3,636,375(0.00%)#4,268 |
Common Questions
What are the Top 10 Cities with the Most Immigrants from South America in Ohio?
Top 10 Cities with the Most Immigrants from South America in Ohio are:
#1
4,201
#2
942
#3
673
#4
452
#5
427
#6
378
#7
352
#8
254
#9
215
#10
202
What city has the Most Immigrants from South America in Ohio?
Columbus has the Most Immigrants from South America in Ohio with 4,201.
What is the Total Immigrants from South America in the State of Ohio?
Total Immigrants from South America in Ohio is 22,909.
What is the Total Immigrants from South America in the United States?
Total Immigrants from South America in the United States is 3,636,375.