Cities with the Most Immigrants from Cambodia in Ohio
RELATED REPORTS & OPTIONS
Cambodia
Ohio
Compare Cities
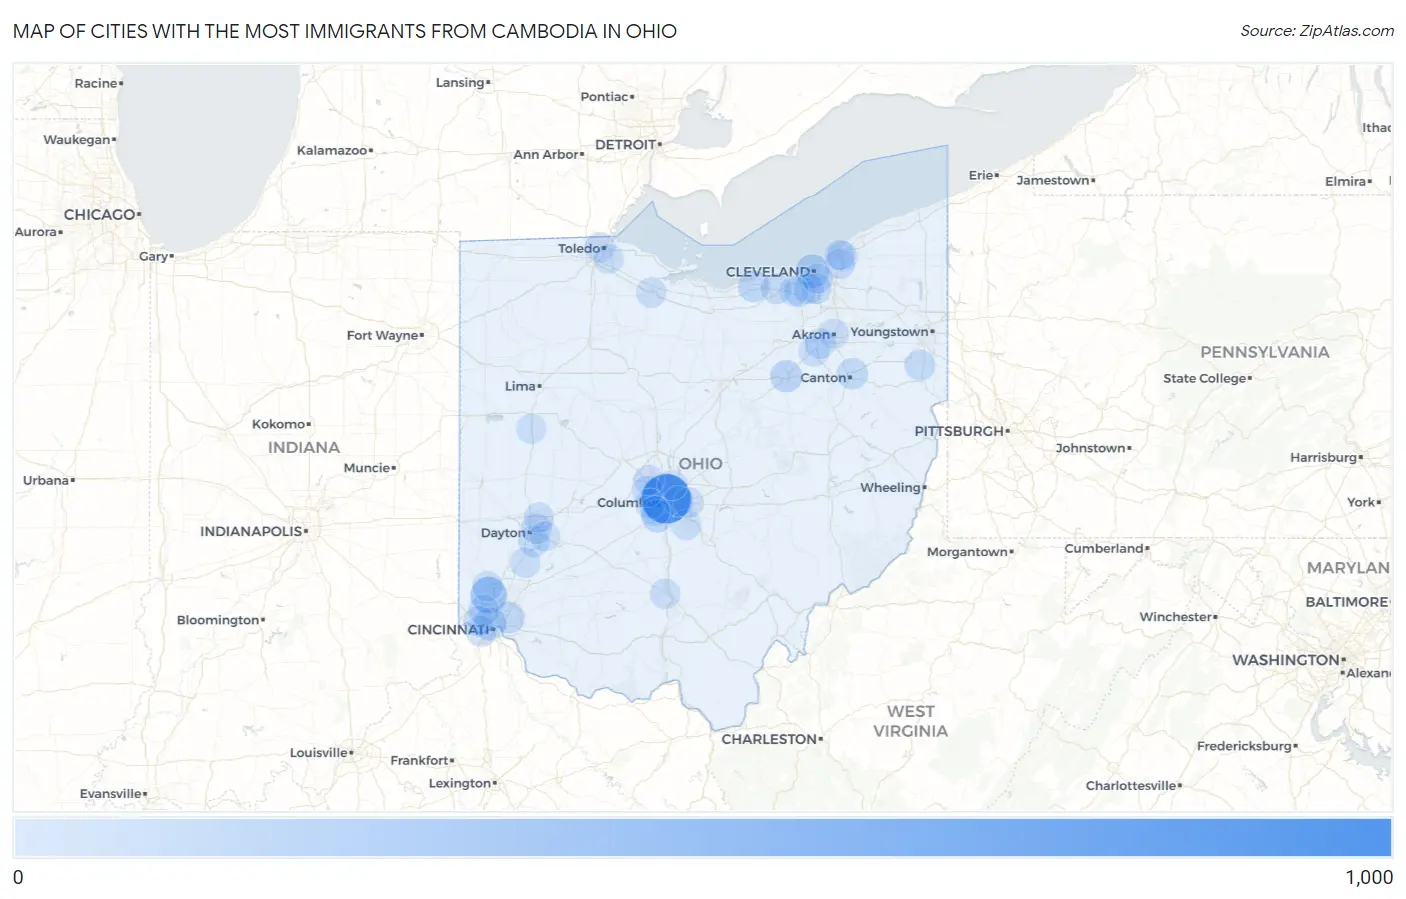
Map of Cities with the Most Immigrants from Cambodia in Ohio
0
1,000
Cities with the Most Immigrants from Cambodia in Ohio
| City | Cambodia | vs State | vs National | |
| 1. | Columbus | 817 | 2,620(31.18%)#1 | 149,355(0.55%)#20 |
| 2. | Fairfield | 255 | 2,620(9.73%)#2 | 149,355(0.17%)#89 |
| 3. | Cleveland | 146 | 2,620(5.57%)#3 | 149,355(0.10%)#172 |
| 4. | Cincinnati | 97 | 2,620(3.70%)#4 | 149,355(0.06%)#245 |
| 5. | Grove City | 91 | 2,620(3.47%)#5 | 149,355(0.06%)#266 |
| 6. | Wooster | 85 | 2,620(3.24%)#6 | 149,355(0.06%)#285 |
| 7. | Amherst | 68 | 2,620(2.60%)#7 | 149,355(0.05%)#346 |
| 8. | Madeira | 63 | 2,620(2.40%)#8 | 149,355(0.04%)#370 |
| 9. | Middleburg Heights | 51 | 2,620(1.95%)#9 | 149,355(0.03%)#448 |
| 10. | Canton | 50 | 2,620(1.91%)#10 | 149,355(0.03%)#451 |
| 11. | Kettering | 42 | 2,620(1.60%)#11 | 149,355(0.03%)#505 |
| 12. | Guilford Lake | 37 | 2,620(1.41%)#12 | 149,355(0.02%)#551 |
| 13. | Delhi Hills | 36 | 2,620(1.37%)#13 | 149,355(0.02%)#565 |
| 14. | Leetonia | 36 | 2,620(1.37%)#14 | 149,355(0.02%)#567 |
| 15. | Bridgetown | 34 | 2,620(1.30%)#15 | 149,355(0.02%)#584 |
| 16. | Groesbeck | 28 | 2,620(1.07%)#16 | 149,355(0.02%)#680 |
| 17. | North Ridgeville | 26 | 2,620(0.99%)#17 | 149,355(0.02%)#704 |
| 18. | Hilliard | 25 | 2,620(0.95%)#18 | 149,355(0.02%)#727 |
| 19. | Riverside | 25 | 2,620(0.95%)#19 | 149,355(0.02%)#732 |
| 20. | Seven Hills | 23 | 2,620(0.88%)#20 | 149,355(0.02%)#771 |
| 21. | Toledo | 20 | 2,620(0.76%)#21 | 149,355(0.01%)#823 |
| 22. | Parma | 20 | 2,620(0.76%)#22 | 149,355(0.01%)#828 |
| 23. | Springboro | 19 | 2,620(0.73%)#23 | 149,355(0.01%)#864 |
| 24. | Doylestown | 19 | 2,620(0.73%)#24 | 149,355(0.01%)#875 |
| 25. | Fremont | 17 | 2,620(0.65%)#25 | 149,355(0.01%)#917 |
| 26. | Willoughby Hills | 17 | 2,620(0.65%)#26 | 149,355(0.01%)#919 |
| 27. | Highland Heights | 17 | 2,620(0.65%)#27 | 149,355(0.01%)#921 |
| 28. | Newburgh Heights | 15 | 2,620(0.57%)#28 | 149,355(0.01%)#982 |
| 29. | Hamilton | 14 | 2,620(0.53%)#29 | 149,355(0.01%)#988 |
| 30. | Dublin | 13 | 2,620(0.50%)#30 | 149,355(0.01%)#1,022 |
| 31. | Norton | 12 | 2,620(0.46%)#31 | 149,355(0.01%)#1,062 |
| 32. | Wickliffe | 11 | 2,620(0.42%)#32 | 149,355(0.01%)#1,090 |
| 33. | Lithopolis | 11 | 2,620(0.42%)#33 | 149,355(0.01%)#1,098 |
| 34. | Reynoldsburg | 10 | 2,620(0.38%)#34 | 149,355(0.01%)#1,111 |
| 35. | Akron | 8 | 2,620(0.31%)#35 | 149,355(0.01%)#1,181 |
| 36. | Huber Heights | 8 | 2,620(0.31%)#36 | 149,355(0.01%)#1,192 |
| 37. | Chillicothe | 8 | 2,620(0.31%)#37 | 149,355(0.01%)#1,201 |
| 38. | Whitehall | 8 | 2,620(0.31%)#38 | 149,355(0.01%)#1,202 |
| 39. | Lincoln Village | 7 | 2,620(0.27%)#39 | 149,355(0.00%)#1,240 |
| 40. | Walbridge | 4 | 2,620(0.15%)#40 | 149,355(0.00%)#1,342 |
| 41. | Botkins | 4 | 2,620(0.15%)#41 | 149,355(0.00%)#1,352 |
| 42. | Berea | 3 | 2,620(0.11%)#42 | 149,355(0.00%)#1,365 |
| 43. | Urbancrest | 3 | 2,620(0.11%)#43 | 149,355(0.00%)#1,377 |
| 44. | Beavercreek | 2 | 2,620(0.08%)#44 | 149,355(0.00%)#1,390 |
| 45. | Minerva Park | 1 | 2,620(0.04%)#45 | 149,355(0.00%)#1,436 |
Common Questions
What are the Top 10 Cities with the Most Immigrants from Cambodia in Ohio?
Top 10 Cities with the Most Immigrants from Cambodia in Ohio are:
#1
817
#2
255
#3
146
#4
97
#5
91
#6
85
#7
68
#8
63
#9
51
#10
50
What city has the Most Immigrants from Cambodia in Ohio?
Columbus has the Most Immigrants from Cambodia in Ohio with 817.
What is the Total Immigrants from Cambodia in the State of Ohio?
Total Immigrants from Cambodia in Ohio is 2,620.
What is the Total Immigrants from Cambodia in the United States?
Total Immigrants from Cambodia in the United States is 149,355.