Sheffield, OH Map & Demographics
Sheffield Map
Sheffield Overview
$47,265
PER CAPITA INCOME
$109,046
AVG FAMILY INCOME
$101,173
AVG HOUSEHOLD INCOME
15.2%
WAGE / INCOME GAP [ % ]
84.8¢/ $1
WAGE / INCOME GAP [ $ ]
0.37
INEQUALITY / GINI INDEX
4,225
TOTAL POPULATION
2,181
MALE POPULATION
2,044
FEMALE POPULATION
106.70
MALES / 100 FEMALES
93.72
FEMALES / 100 MALES
49.5
MEDIAN AGE
2.9
AVG FAMILY SIZE
2.5
AVG HOUSEHOLD SIZE
2,140
LABOR FORCE [ PEOPLE ]
58.1%
PERCENT IN LABOR FORCE
2.4%
UNEMPLOYMENT RATE
Income in Sheffield
Income Overview in Sheffield
Per Capita Income in Sheffield is $47,265, while median incomes of families and households are $109,046 and $101,173 respectively.
| Characteristic | Number | Measure |
| Per Capita Income | 4,225 | $47,265 |
| Median Family Income | 1,225 | $109,046 |
| Mean Family Income | 1,225 | $129,301 |
| Median Household Income | 1,660 | $101,173 |
| Mean Household Income | 1,660 | $117,461 |
| Income Deficit | 1,225 | $0 |
| Wage / Income Gap (%) | 4,225 | 15.16% |
| Wage / Income Gap ($) | 4,225 | 84.84¢ per $1 |
| Gini / Inequality Index | 4,225 | 0.37 |
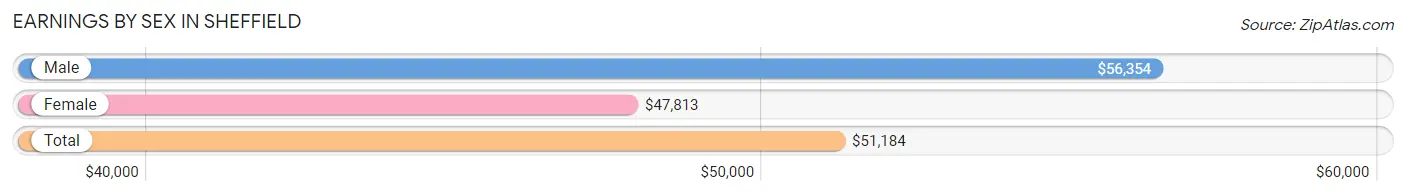
Earnings by Sex in Sheffield
Average Earnings in Sheffield are $51,184, $56,354 for men and $47,813 for women, a difference of 15.2%.
| Sex | Number | Average Earnings |
| Male | 1,261 (54.5%) | $56,354 |
| Female | 1,053 (45.5%) | $47,813 |
| Total | 2,314 (100.0%) | $51,184 |
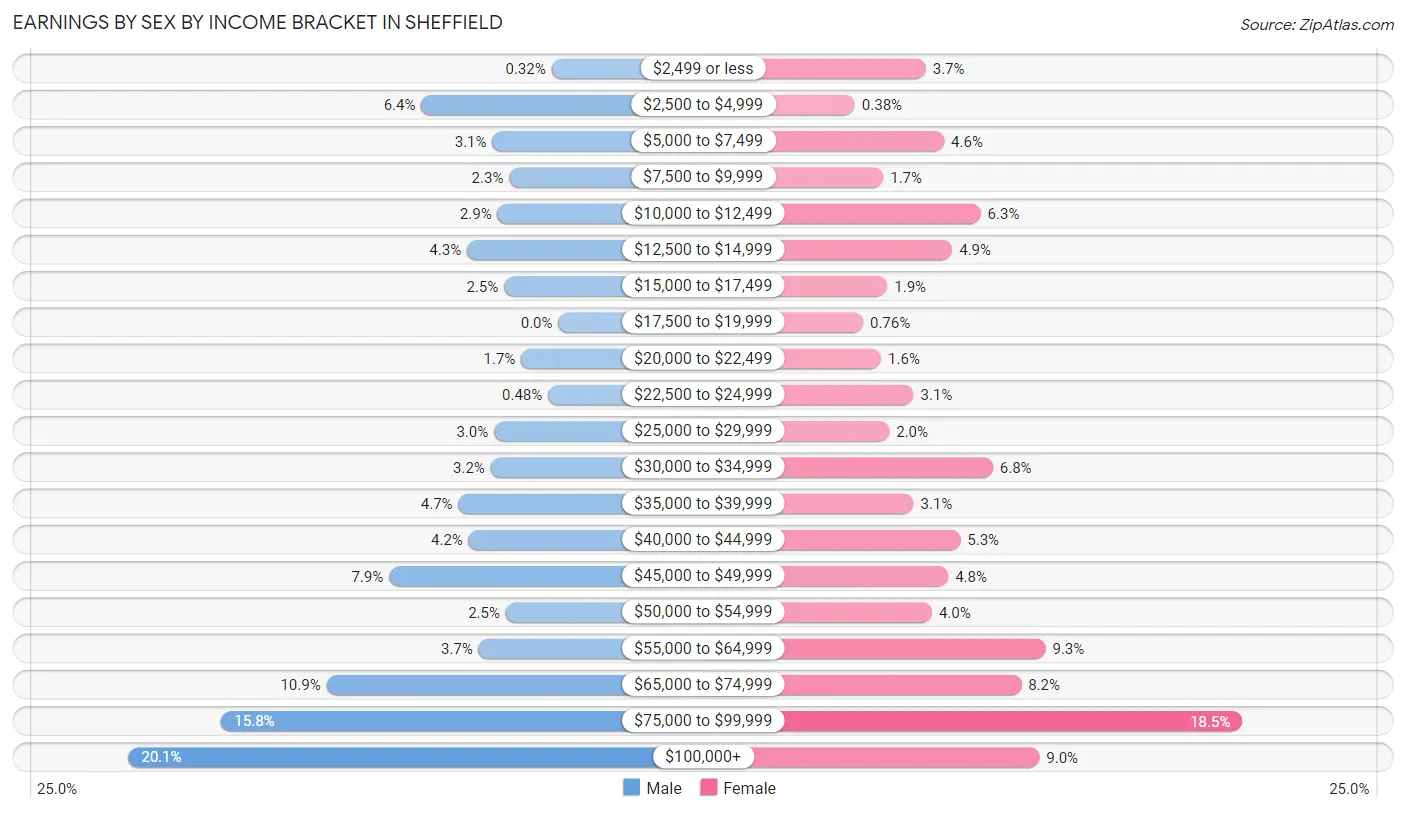
Earnings by Sex by Income Bracket in Sheffield
The most common earnings brackets in Sheffield are $100,000+ for men (254 | 20.1%) and $75,000 to $99,999 for women (195 | 18.5%).
| Income | Male | Female |
| $2,499 or less | 4 (0.3%) | 39 (3.7%) |
| $2,500 to $4,999 | 81 (6.4%) | 4 (0.4%) |
| $5,000 to $7,499 | 39 (3.1%) | 48 (4.6%) |
| $7,500 to $9,999 | 29 (2.3%) | 18 (1.7%) |
| $10,000 to $12,499 | 36 (2.9%) | 66 (6.3%) |
| $12,500 to $14,999 | 54 (4.3%) | 52 (4.9%) |
| $15,000 to $17,499 | 32 (2.5%) | 20 (1.9%) |
| $17,500 to $19,999 | 0 (0.0%) | 8 (0.8%) |
| $20,000 to $22,499 | 22 (1.7%) | 17 (1.6%) |
| $22,500 to $24,999 | 6 (0.5%) | 33 (3.1%) |
| $25,000 to $29,999 | 38 (3.0%) | 21 (2.0%) |
| $30,000 to $34,999 | 40 (3.2%) | 72 (6.8%) |
| $35,000 to $39,999 | 59 (4.7%) | 33 (3.1%) |
| $40,000 to $44,999 | 53 (4.2%) | 56 (5.3%) |
| $45,000 to $49,999 | 100 (7.9%) | 50 (4.8%) |
| $50,000 to $54,999 | 31 (2.5%) | 42 (4.0%) |
| $55,000 to $64,999 | 47 (3.7%) | 98 (9.3%) |
| $65,000 to $74,999 | 137 (10.9%) | 86 (8.2%) |
| $75,000 to $99,999 | 199 (15.8%) | 195 (18.5%) |
| $100,000+ | 254 (20.1%) | 95 (9.0%) |
| Total | 1,261 (100.0%) | 1,053 (100.0%) |
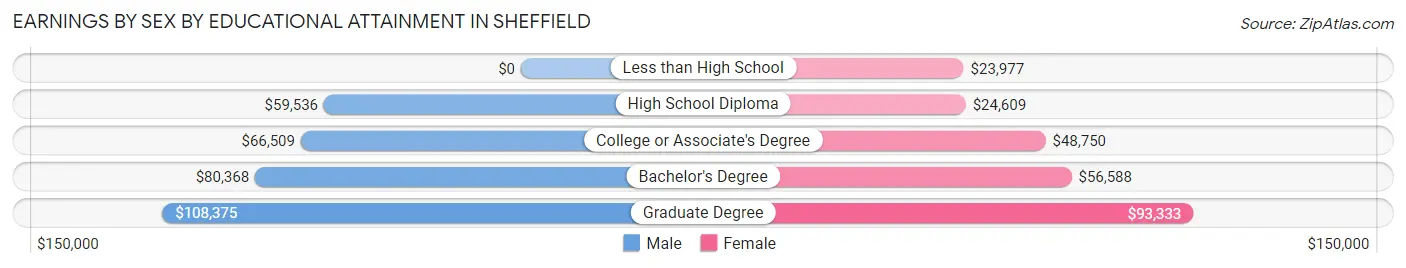
Earnings by Sex by Educational Attainment in Sheffield
Average earnings in Sheffield are $67,404 for men and $52,227 for women, a difference of 22.5%. Men with an educational attainment of graduate degree enjoy the highest average annual earnings of $108,375, while those with high school diploma education earn the least with $59,536. Women with an educational attainment of graduate degree earn the most with the average annual earnings of $93,333, while those with less than high school education have the smallest earnings of $23,977.
| Educational Attainment | Male Income | Female Income |
| Less than High School | - | - |
| High School Diploma | $59,536 | $24,609 |
| College or Associate's Degree | $66,509 | $48,750 |
| Bachelor's Degree | $80,368 | $56,588 |
| Graduate Degree | $108,375 | $93,333 |
| Total | $67,404 | $52,227 |
Family Income in Sheffield
Family Income Brackets in Sheffield
According to the Sheffield family income data, there are 399 families falling into the $100,000 to $149,999 income range, which is the most common income bracket and makes up 32.6% of all families. Conversely, the less than $10,000 income bracket is the least frequent group with only 4 families (0.3%) belonging to this category.
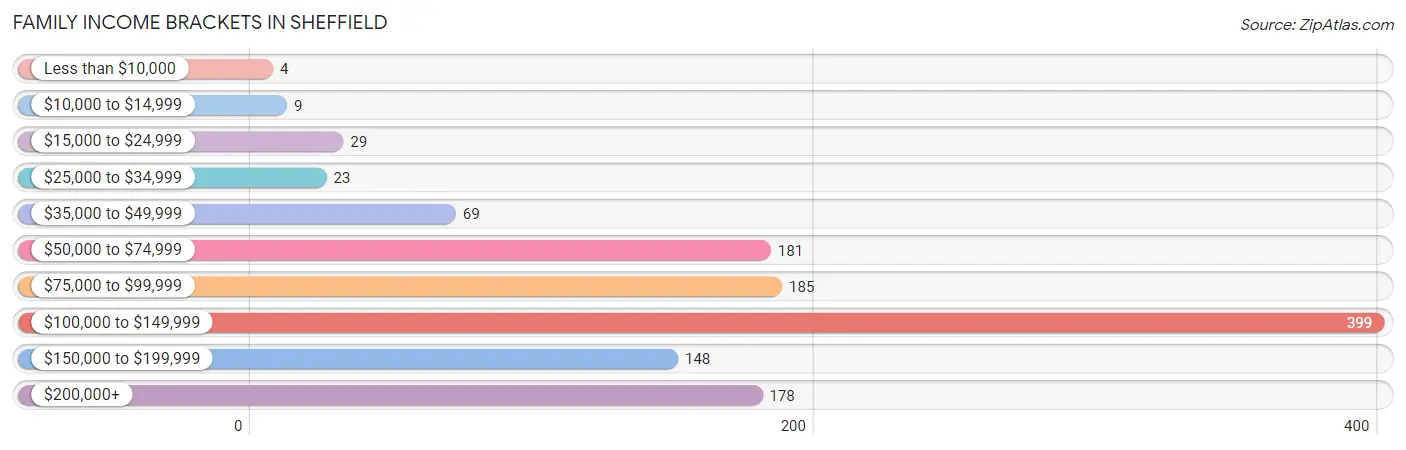
| Income Bracket | # Families | % Families |
| Less than $10,000 | 4 | 0.3% |
| $10,000 to $14,999 | 9 | 0.7% |
| $15,000 to $24,999 | 29 | 2.4% |
| $25,000 to $34,999 | 23 | 1.9% |
| $35,000 to $49,999 | 69 | 5.6% |
| $50,000 to $74,999 | 181 | 14.8% |
| $75,000 to $99,999 | 185 | 15.1% |
| $100,000 to $149,999 | 399 | 32.6% |
| $150,000 to $199,999 | 148 | 12.1% |
| $200,000+ | 178 | 14.5% |
Family Income by Famaliy Size in Sheffield
5-person families (42 | 3.4%) account for the highest median family income in Sheffield with $141,667 per family, while 2-person families (713 | 58.2%) have the highest median income of $50,287 per family member.
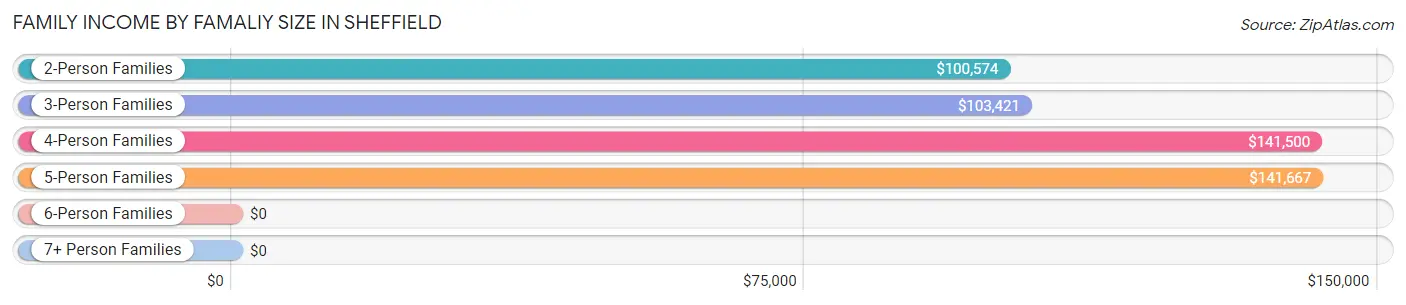
| Income Bracket | # Families | Median Income |
| 2-Person Families | 713 (58.2%) | $100,574 |
| 3-Person Families | 210 (17.1%) | $103,421 |
| 4-Person Families | 248 (20.2%) | $141,500 |
| 5-Person Families | 42 (3.4%) | $141,667 |
| 6-Person Families | 4 (0.3%) | $0 |
| 7+ Person Families | 8 (0.6%) | $0 |
| Total | 1,225 (100.0%) | $109,046 |
Family Income by Number of Earners in Sheffield
The median family income in Sheffield is $109,046, with families comprising 3+ earners (176) having the highest median family income of $142,333, while families with no earners (261) have the lowest median family income of $70,018, accounting for 14.4% and 21.3% of families, respectively.
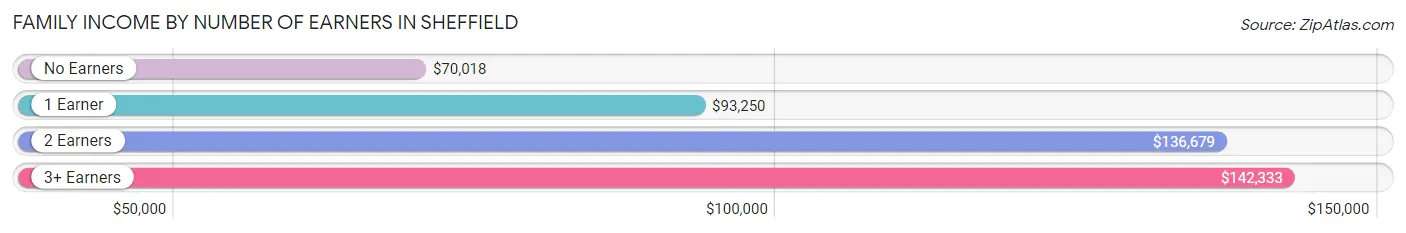
| Number of Earners | # Families | Median Income |
| No Earners | 261 (21.3%) | $70,018 |
| 1 Earner | 289 (23.6%) | $93,250 |
| 2 Earners | 499 (40.7%) | $136,679 |
| 3+ Earners | 176 (14.4%) | $142,333 |
| Total | 1,225 (100.0%) | $109,046 |
Household Income in Sheffield
Household Income Brackets in Sheffield
With 407 households falling in the category, the $100,000 to $149,999 income range is the most frequent in Sheffield, accounting for 24.5% of all households. In contrast, only 15 households (0.9%) fall into the $10,000 to $14,999 income bracket, making it the least populous group.
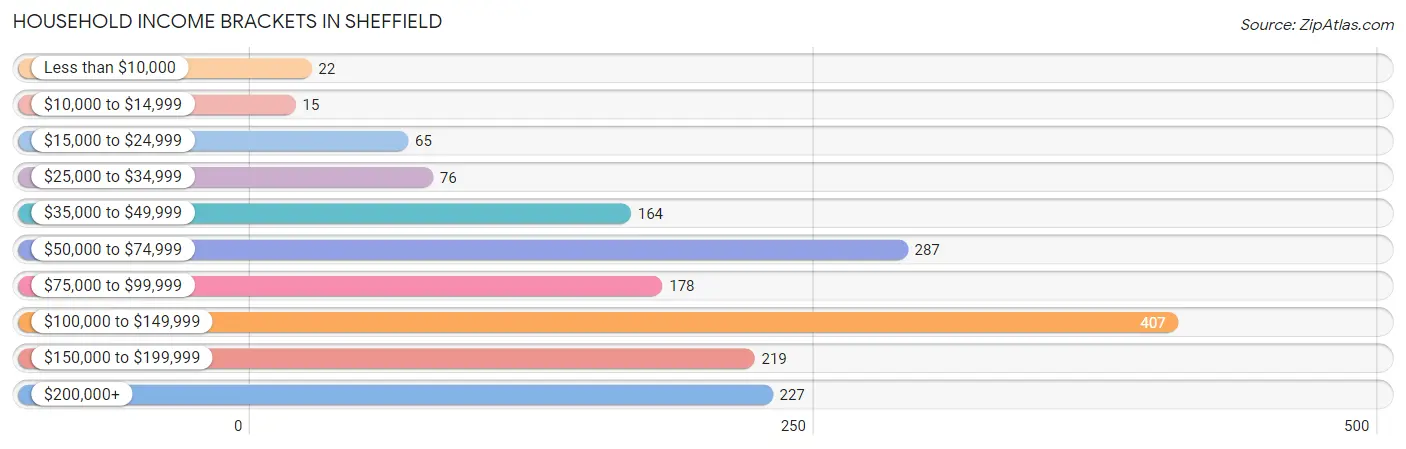
| Income Bracket | # Households | % Households |
| Less than $10,000 | 22 | 1.3% |
| $10,000 to $14,999 | 15 | 0.9% |
| $15,000 to $24,999 | 65 | 3.9% |
| $25,000 to $34,999 | 76 | 4.6% |
| $35,000 to $49,999 | 164 | 9.9% |
| $50,000 to $74,999 | 287 | 17.3% |
| $75,000 to $99,999 | 178 | 10.7% |
| $100,000 to $149,999 | 407 | 24.5% |
| $150,000 to $199,999 | 219 | 13.2% |
| $200,000+ | 227 | 13.7% |
Household Income by Householder Age in Sheffield
The median household income in Sheffield is $101,173, with the highest median household income of $140,556 found in the 45 to 64 years age bracket for the primary householder. A total of 660 households (39.8%) fall into this category.
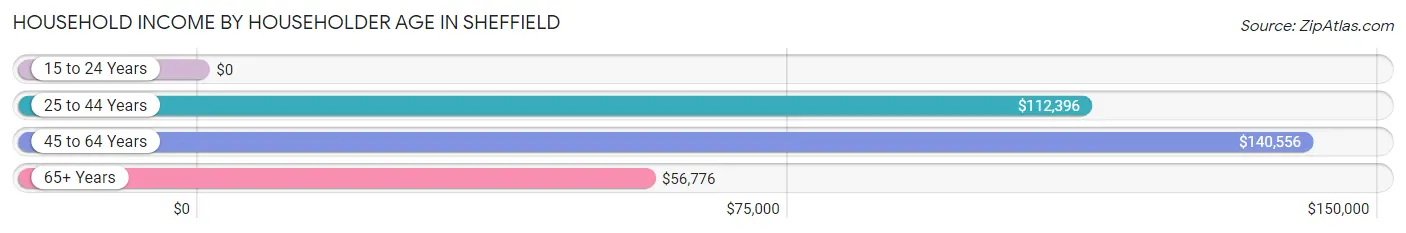
| Income Bracket | # Households | Median Income |
| 15 to 24 Years | 0 (0.0%) | $0 |
| 25 to 44 Years | 359 (21.6%) | $112,396 |
| 45 to 64 Years | 660 (39.8%) | $140,556 |
| 65+ Years | 641 (38.6%) | $56,776 |
| Total | 1,660 (100.0%) | $101,173 |
Poverty in Sheffield
Income Below Poverty by Sex and Age in Sheffield
With 1.8% poverty level for males and 2.0% for females among the residents of Sheffield, 65 to 74 year old males and 12 to 14 year old females are the most vulnerable to poverty, with 20 males (5.5%) and 4 females (11.8%) in their respective age groups living below the poverty level.
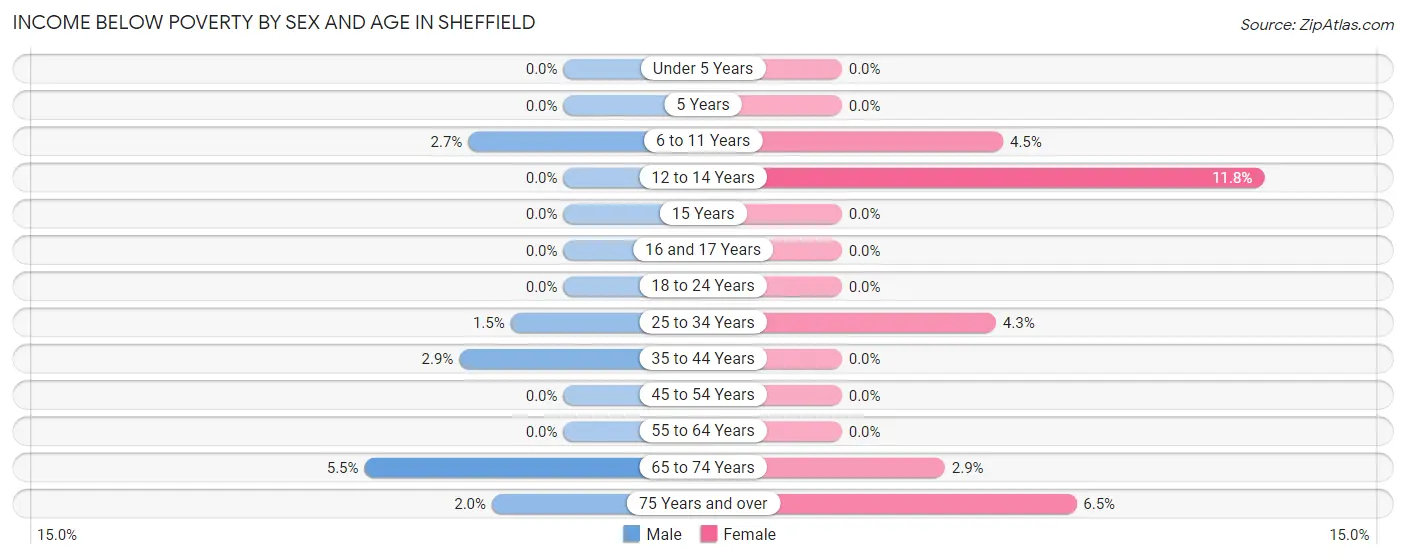
| Age Bracket | Male | Female |
| Under 5 Years | 0 (0.0%) | 0 (0.0%) |
| 5 Years | 0 (0.0%) | 0 (0.0%) |
| 6 to 11 Years | 4 (2.6%) | 4 (4.5%) |
| 12 to 14 Years | 0 (0.0%) | 4 (11.8%) |
| 15 Years | 0 (0.0%) | 0 (0.0%) |
| 16 and 17 Years | 0 (0.0%) | 0 (0.0%) |
| 18 to 24 Years | 0 (0.0%) | 0 (0.0%) |
| 25 to 34 Years | 5 (1.5%) | 6 (4.3%) |
| 35 to 44 Years | 6 (2.9%) | 0 (0.0%) |
| 45 to 54 Years | 0 (0.0%) | 0 (0.0%) |
| 55 to 64 Years | 0 (0.0%) | 0 (0.0%) |
| 65 to 74 Years | 20 (5.5%) | 10 (2.9%) |
| 75 Years and over | 3 (2.0%) | 16 (6.5%) |
| Total | 38 (1.8%) | 40 (2.0%) |
Income Above Poverty by Sex and Age in Sheffield
According to the poverty statistics in Sheffield, males aged under 5 years and females aged under 5 years are the age groups that are most secure financially, with 100.0% of males and 100.0% of females in these age groups living above the poverty line.
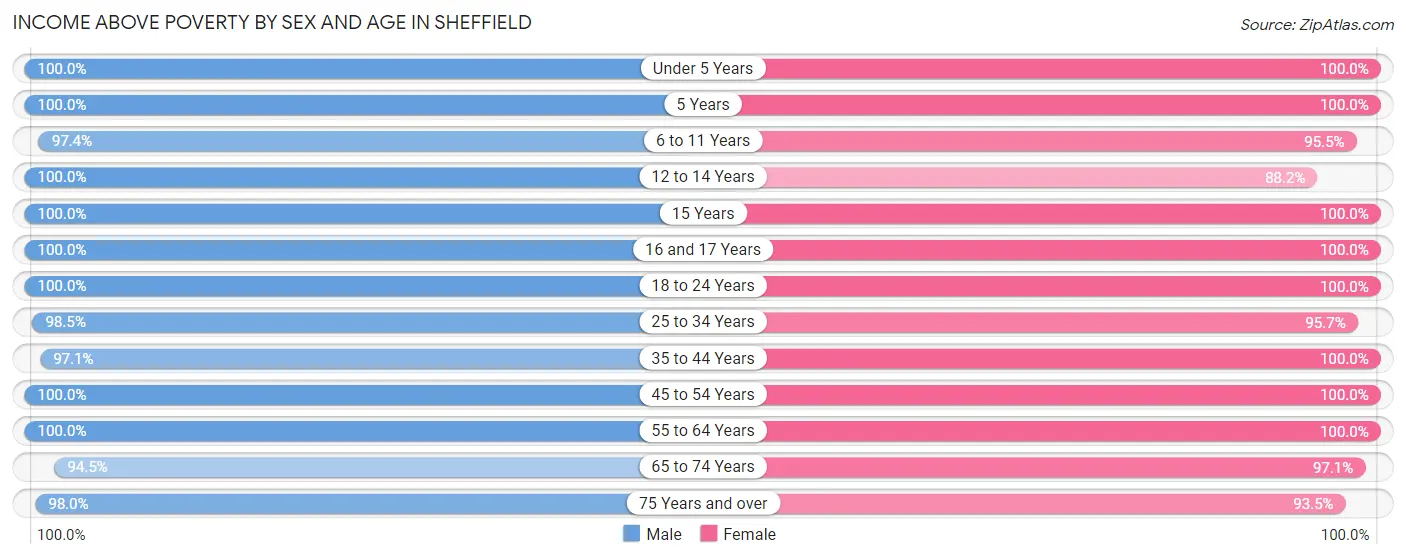
| Age Bracket | Male | Female |
| Under 5 Years | 34 (100.0%) | 84 (100.0%) |
| 5 Years | 6 (100.0%) | 41 (100.0%) |
| 6 to 11 Years | 147 (97.4%) | 85 (95.5%) |
| 12 to 14 Years | 39 (100.0%) | 30 (88.2%) |
| 15 Years | 18 (100.0%) | 27 (100.0%) |
| 16 and 17 Years | 22 (100.0%) | 39 (100.0%) |
| 18 to 24 Years | 219 (100.0%) | 120 (100.0%) |
| 25 to 34 Years | 336 (98.5%) | 134 (95.7%) |
| 35 to 44 Years | 201 (97.1%) | 235 (100.0%) |
| 45 to 54 Years | 260 (100.0%) | 367 (100.0%) |
| 55 to 64 Years | 353 (100.0%) | 274 (100.0%) |
| 65 to 74 Years | 341 (94.5%) | 339 (97.1%) |
| 75 Years and over | 148 (98.0%) | 229 (93.5%) |
| Total | 2,124 (98.2%) | 2,004 (98.0%) |
Income Below Poverty Among Married-Couple Families in Sheffield
The poverty statistics for married-couple families in Sheffield show that 0.9% or 9 of the total 1,032 families live below the poverty line. Families with no children have the highest poverty rate of 1.2%, comprising of 9 families. On the other hand, families with 1 or 2 children have the lowest poverty rate of 0.0%, which includes 0 families.
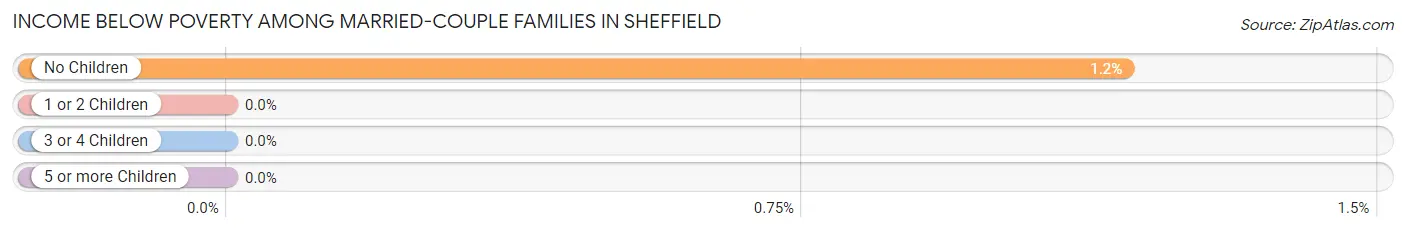
| Children | Above Poverty | Below Poverty |
| No Children | 757 (98.8%) | 9 (1.2%) |
| 1 or 2 Children | 249 (100.0%) | 0 (0.0%) |
| 3 or 4 Children | 17 (100.0%) | 0 (0.0%) |
| 5 or more Children | 0 (0.0%) | 0 (0.0%) |
| Total | 1,023 (99.1%) | 9 (0.9%) |
Income Below Poverty Among Single-Parent Households in Sheffield
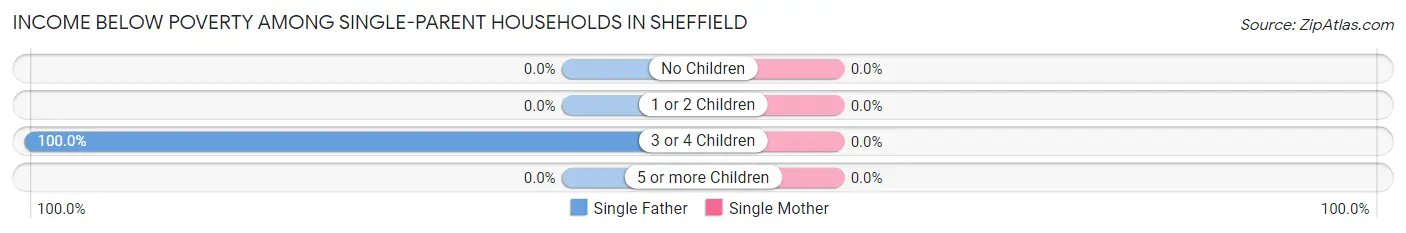
| Children | Single Father | Single Mother |
| No Children | 0 (0.0%) | 0 (0.0%) |
| 1 or 2 Children | 0 (0.0%) | 0 (0.0%) |
| 3 or 4 Children | 4 (100.0%) | 0 (0.0%) |
| 5 or more Children | 0 (0.0%) | 0 (0.0%) |
| Total | 4 (23.5%) | 0 (0.0%) |
Income Below Poverty Among Married-Couple vs Single-Parent Households in Sheffield
The poverty data for Sheffield shows that 9 of the married-couple family households (0.9%) and 4 of the single-parent households (2.1%) are living below the poverty level. Within the married-couple family households, those with no children have the highest poverty rate, with 9 households (1.2%) falling below the poverty line. Among the single-parent households, those with 3 or 4 children have the highest poverty rate, with 4 household (100.0%) living below poverty.
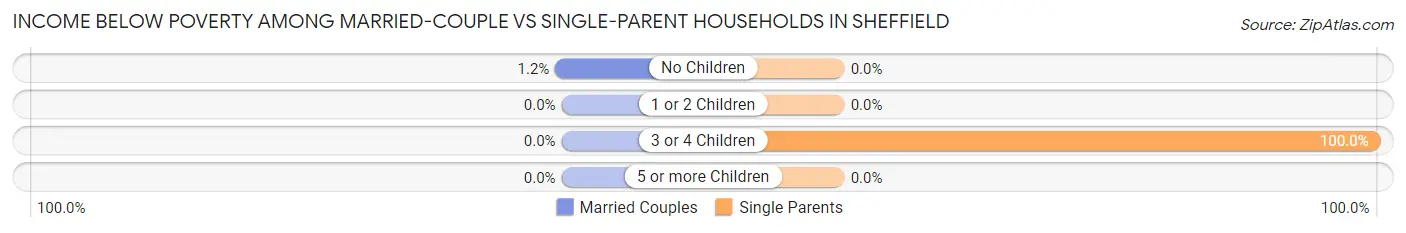
| Children | Married-Couple Families | Single-Parent Households |
| No Children | 9 (1.2%) | 0 (0.0%) |
| 1 or 2 Children | 0 (0.0%) | 0 (0.0%) |
| 3 or 4 Children | 0 (0.0%) | 4 (100.0%) |
| 5 or more Children | 0 (0.0%) | 0 (0.0%) |
| Total | 9 (0.9%) | 4 (2.1%) |
Race in Sheffield
The most populous races in Sheffield are White / Caucasian (3,742 | 88.6%), Two or more Races (224 | 5.3%), and Asian (141 | 3.3%).
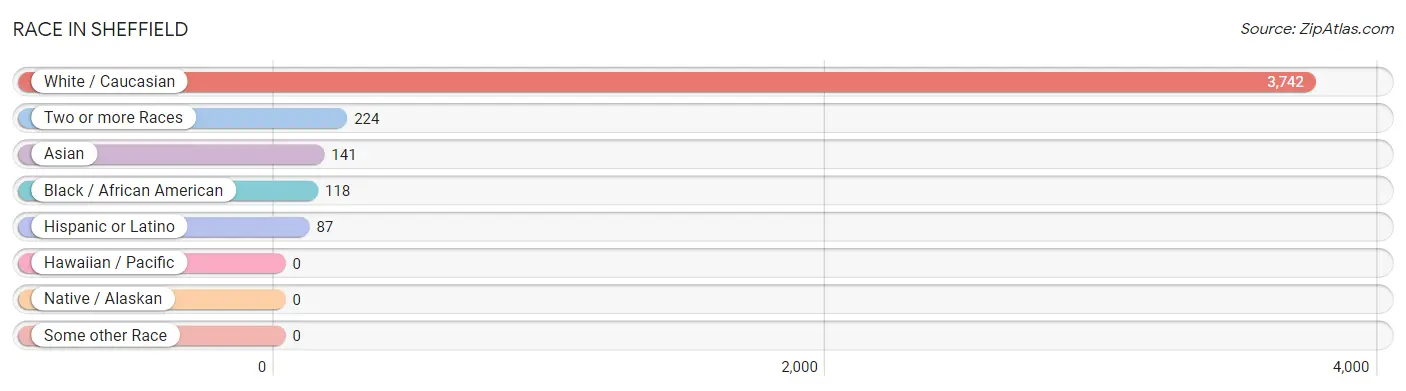
| Race | # Population | % Population |
| Asian | 141 | 3.3% |
| Black / African American | 118 | 2.8% |
| Hawaiian / Pacific | 0 | 0.0% |
| Hispanic or Latino | 87 | 2.1% |
| Native / Alaskan | 0 | 0.0% |
| White / Caucasian | 3,742 | 88.6% |
| Two or more Races | 224 | 5.3% |
| Some other Race | 0 | 0.0% |
| Total | 4,225 | 100.0% |
Ancestry in Sheffield
The most populous ancestries reported in Sheffield are German (704 | 16.7%), English (487 | 11.5%), American (388 | 9.2%), Italian (362 | 8.6%), and Irish (331 | 7.8%), together accounting for 53.8% of all Sheffield residents.
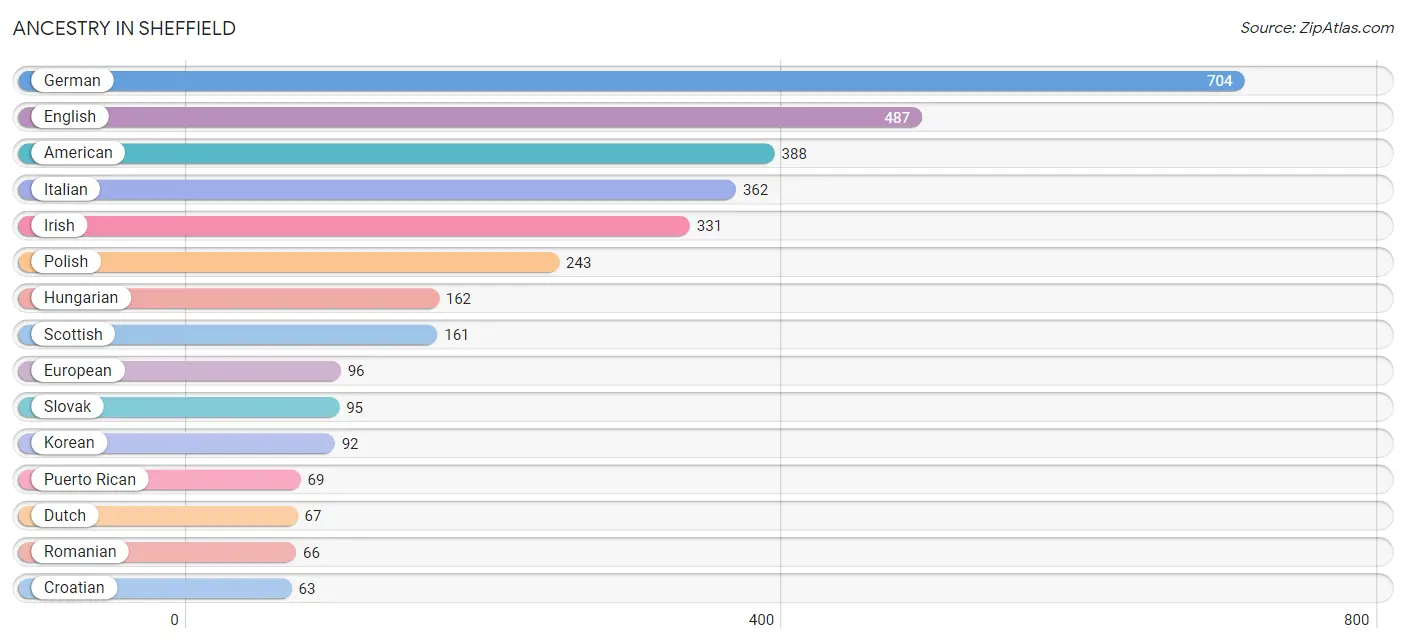
| Ancestry | # Population | % Population |
| African | 8 | 0.2% |
| American | 388 | 9.2% |
| Belgian | 10 | 0.2% |
| Blackfeet | 31 | 0.7% |
| Canadian | 18 | 0.4% |
| Cherokee | 33 | 0.8% |
| Croatian | 63 | 1.5% |
| Czech | 31 | 0.7% |
| Czechoslovakian | 49 | 1.2% |
| Danish | 21 | 0.5% |
| Dutch | 67 | 1.6% |
| Eastern European | 50 | 1.2% |
| English | 487 | 11.5% |
| European | 96 | 2.3% |
| Finnish | 8 | 0.2% |
| French | 22 | 0.5% |
| German | 704 | 16.7% |
| Greek | 20 | 0.5% |
| Hungarian | 162 | 3.8% |
| Irish | 331 | 7.8% |
| Italian | 362 | 8.6% |
| Korean | 92 | 2.2% |
| Lithuanian | 32 | 0.8% |
| Mexican | 18 | 0.4% |
| Norwegian | 32 | 0.8% |
| Polish | 243 | 5.8% |
| Portuguese | 5 | 0.1% |
| Puerto Rican | 69 | 1.6% |
| Romanian | 66 | 1.6% |
| Russian | 42 | 1.0% |
| Scotch-Irish | 26 | 0.6% |
| Scottish | 161 | 3.8% |
| Serbian | 9 | 0.2% |
| Slovak | 95 | 2.2% |
| Slovene | 48 | 1.1% |
| Sri Lankan | 48 | 1.1% |
| Subsaharan African | 8 | 0.2% |
| Swedish | 12 | 0.3% |
| Swiss | 8 | 0.2% |
| Thai | 51 | 1.2% |
| Ukrainian | 10 | 0.2% |
| Welsh | 9 | 0.2% | View All 42 Rows |
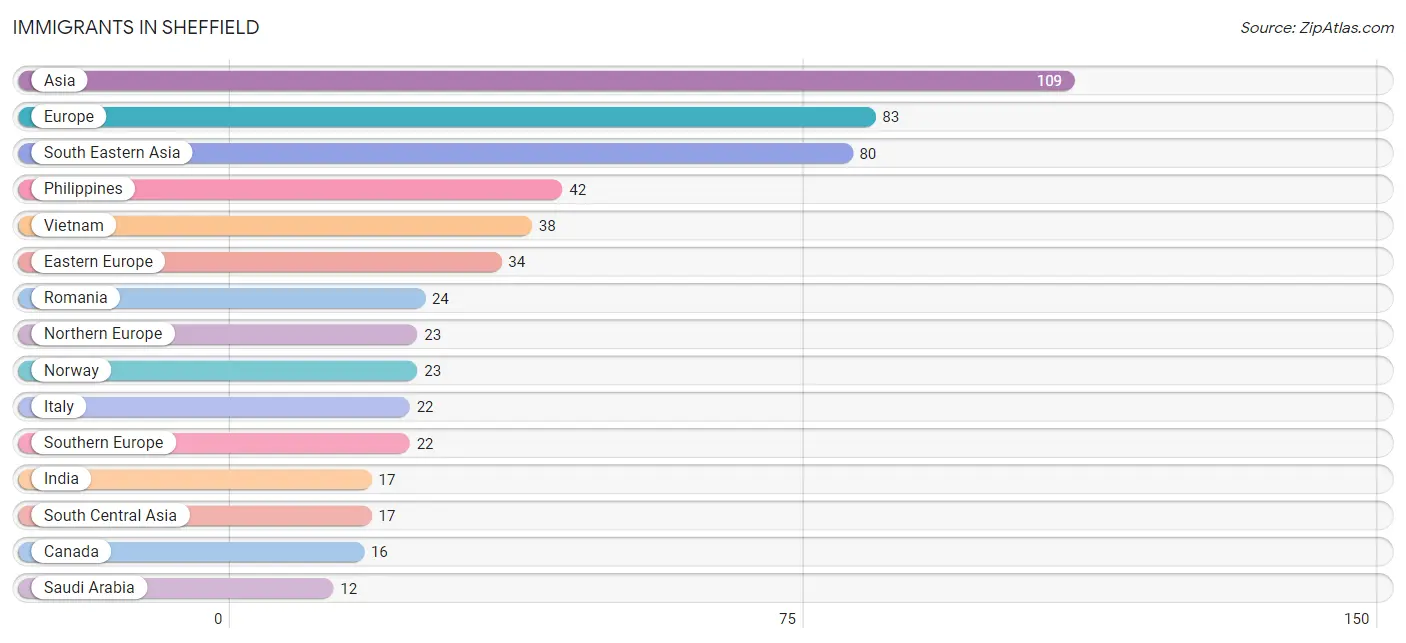
Immigrants in Sheffield
The most numerous immigrant groups reported in Sheffield came from Asia (109 | 2.6%), Europe (83 | 2.0%), South Eastern Asia (80 | 1.9%), Philippines (42 | 1.0%), and Vietnam (38 | 0.9%), together accounting for 8.3% of all Sheffield residents.
| Immigration Origin | # Population | % Population |
| Asia | 109 | 2.6% |
| Austria | 4 | 0.1% |
| Canada | 16 | 0.4% |
| Eastern Europe | 34 | 0.8% |
| Europe | 83 | 2.0% |
| Hungary | 3 | 0.1% |
| India | 17 | 0.4% |
| Italy | 22 | 0.5% |
| Northern Europe | 23 | 0.5% |
| Norway | 23 | 0.5% |
| Philippines | 42 | 1.0% |
| Romania | 24 | 0.6% |
| Saudi Arabia | 12 | 0.3% |
| South Central Asia | 17 | 0.4% |
| South Eastern Asia | 80 | 1.9% |
| Southern Europe | 22 | 0.5% |
| Vietnam | 38 | 0.9% |
| Western Asia | 12 | 0.3% |
| Western Europe | 4 | 0.1% | View All 19 Rows |
Sex and Age in Sheffield
Sex and Age in Sheffield
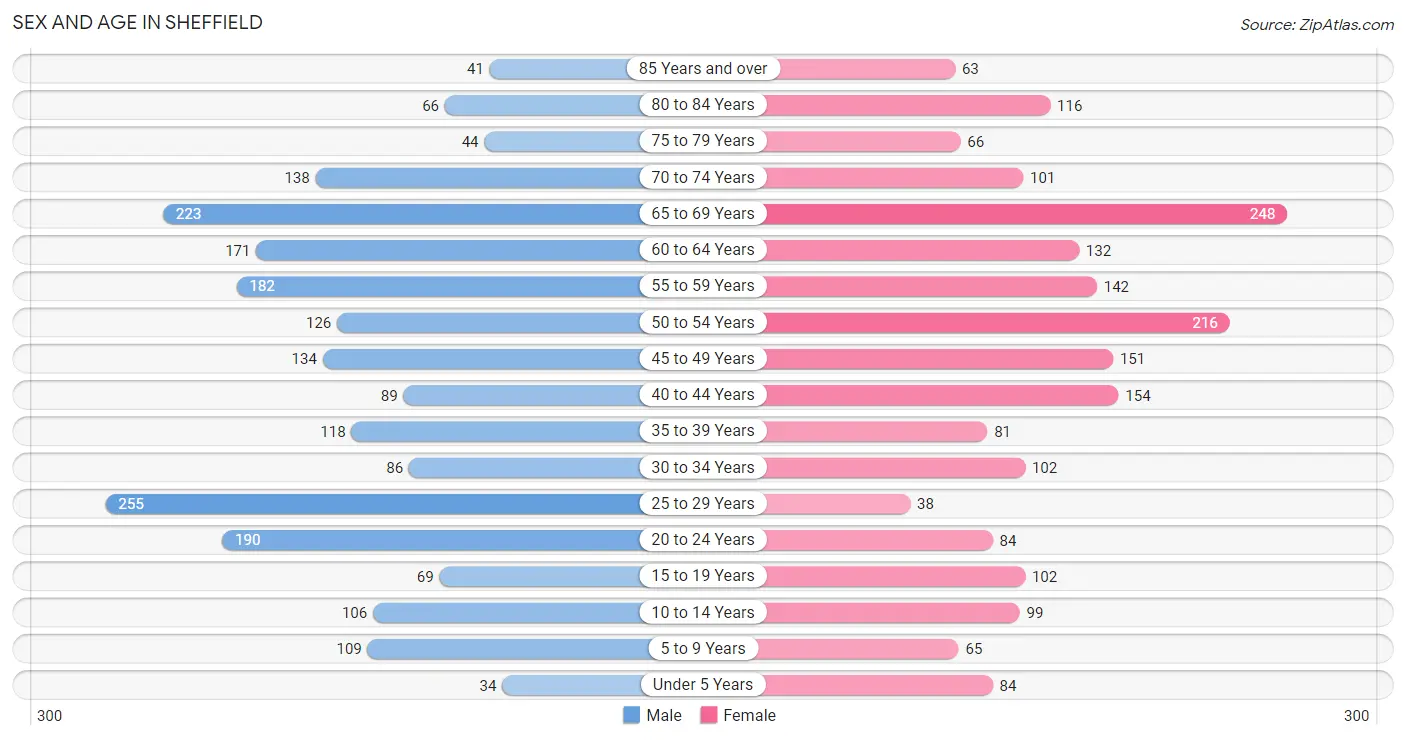
The most populous age groups in Sheffield are 25 to 29 Years (255 | 11.7%) for men and 65 to 69 Years (248 | 12.1%) for women.
| Age Bracket | Male | Female |
| Under 5 Years | 34 (1.6%) | 84 (4.1%) |
| 5 to 9 Years | 109 (5.0%) | 65 (3.2%) |
| 10 to 14 Years | 106 (4.9%) | 99 (4.8%) |
| 15 to 19 Years | 69 (3.2%) | 102 (5.0%) |
| 20 to 24 Years | 190 (8.7%) | 84 (4.1%) |
| 25 to 29 Years | 255 (11.7%) | 38 (1.9%) |
| 30 to 34 Years | 86 (3.9%) | 102 (5.0%) |
| 35 to 39 Years | 118 (5.4%) | 81 (4.0%) |
| 40 to 44 Years | 89 (4.1%) | 154 (7.5%) |
| 45 to 49 Years | 134 (6.1%) | 151 (7.4%) |
| 50 to 54 Years | 126 (5.8%) | 216 (10.6%) |
| 55 to 59 Years | 182 (8.3%) | 142 (7.0%) |
| 60 to 64 Years | 171 (7.8%) | 132 (6.5%) |
| 65 to 69 Years | 223 (10.2%) | 248 (12.1%) |
| 70 to 74 Years | 138 (6.3%) | 101 (4.9%) |
| 75 to 79 Years | 44 (2.0%) | 66 (3.2%) |
| 80 to 84 Years | 66 (3.0%) | 116 (5.7%) |
| 85 Years and over | 41 (1.9%) | 63 (3.1%) |
| Total | 2,181 (100.0%) | 2,044 (100.0%) |
Families and Households in Sheffield
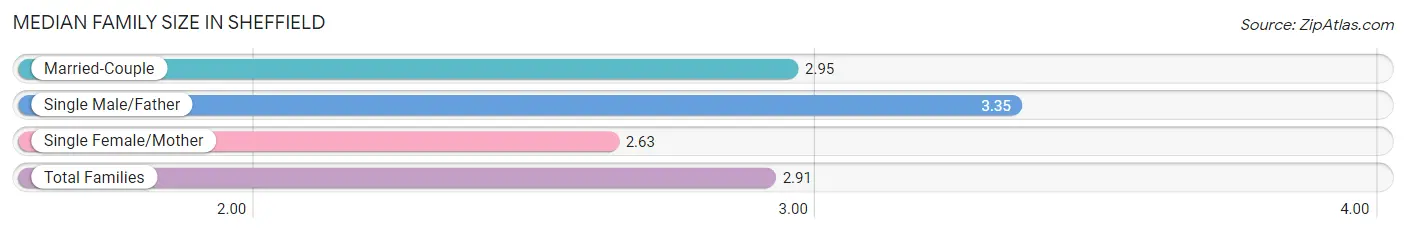
Median Family Size in Sheffield
The median family size in Sheffield is 2.91 persons per family, with single male/father families (17 | 1.4%) accounting for the largest median family size of 3.35 persons per family. On the other hand, single female/mother families (176 | 14.4%) represent the smallest median family size with 2.63 persons per family.
| Family Type | # Families | Family Size |
| Married-Couple | 1,032 (84.2%) | 2.95 |
| Single Male/Father | 17 (1.4%) | 3.35 |
| Single Female/Mother | 176 (14.4%) | 2.63 |
| Total Families | 1,225 (100.0%) | 2.91 |
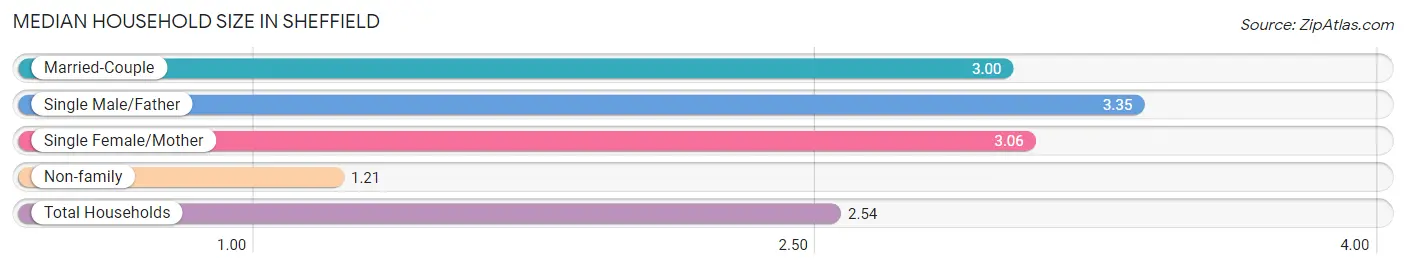
Median Household Size in Sheffield
The median household size in Sheffield is 2.54 persons per household, with single male/father households (17 | 1.0%) accounting for the largest median household size of 3.35 persons per household. non-family households (435 | 26.2%) represent the smallest median household size with 1.21 persons per household.
| Household Type | # Households | Household Size |
| Married-Couple | 1,032 (62.2%) | 3.00 |
| Single Male/Father | 17 (1.0%) | 3.35 |
| Single Female/Mother | 176 (10.6%) | 3.06 |
| Non-family | 435 (26.2%) | 1.21 |
| Total Households | 1,660 (100.0%) | 2.54 |
Household Size by Marriage Status in Sheffield
Out of a total of 1,660 households in Sheffield, 1,225 (73.8%) are family households, while 435 (26.2%) are nonfamily households. The most numerous type of family households are 2-person households, comprising 678, and the most common type of nonfamily households are 1-person households, comprising 382.
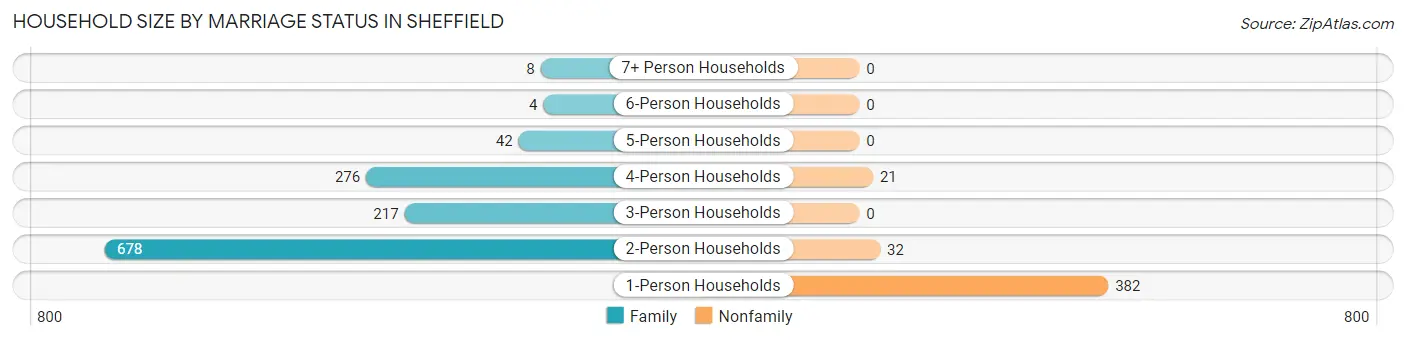
| Household Size | Family Households | Nonfamily Households |
| 1-Person Households | - | 382 (23.0%) |
| 2-Person Households | 678 (40.8%) | 32 (1.9%) |
| 3-Person Households | 217 (13.1%) | 0 (0.0%) |
| 4-Person Households | 276 (16.6%) | 21 (1.3%) |
| 5-Person Households | 42 (2.5%) | 0 (0.0%) |
| 6-Person Households | 4 (0.2%) | 0 (0.0%) |
| 7+ Person Households | 8 (0.5%) | 0 (0.0%) |
| Total | 1,225 (73.8%) | 435 (26.2%) |
Female Fertility in Sheffield
Fertility by Age in Sheffield
| Age Bracket | Women with Births | Births / 1,000 Women |
| 15 to 19 years | 0 (0.0%) | 0.0 |
| 20 to 34 years | 0 (0.0%) | 0.0 |
| 35 to 50 years | 0 (0.0%) | 0.0 |
| Total | 0 (0.0%) | 0.0 |
Fertility by Age by Marriage Status in Sheffield
| Age Bracket | Married | Unmarried |
| 15 to 19 years | 0 (0.0%) | 0 (0.0%) |
| 20 to 34 years | 0 (0.0%) | 0 (0.0%) |
| 35 to 50 years | 0 (0.0%) | 0 (0.0%) |
| Total | 0 (0.0%) | 0 (0.0%) |
Fertility by Education in Sheffield
| Educational Attainment | Women with Births | Births / 1,000 Women |
| Less than High School | 0 (0.0%) | 0.0 |
| High School Diploma | 0 (0.0%) | 0.0 |
| College or Associate's Degree | 0 (0.0%) | 0.0 |
| Bachelor's Degree | 0 (0.0%) | 0.0 |
| Graduate Degree | 0 (0.0%) | 0.0 |
| Total | 0 (0.0%) | 0.0 |
Fertility by Education by Marriage Status in Sheffield
| Educational Attainment | Married | Unmarried |
| Less than High School | 0 (0.0%) | 0 (0.0%) |
| High School Diploma | 0 (0.0%) | 0 (0.0%) |
| College or Associate's Degree | 0 (0.0%) | 0 (0.0%) |
| Bachelor's Degree | 0 (0.0%) | 0 (0.0%) |
| Graduate Degree | 0 (0.0%) | 0 (0.0%) |
| Total | 0 (0.0%) | 0 (0.0%) |
Employment Characteristics in Sheffield
Employment by Class of Employer in Sheffield
Among the 2,080 employed individuals in Sheffield, private company employees (1,530 | 73.6%), not-for-profit organizations (182 | 8.7%), and local government employees (107 | 5.1%) make up the most common classes of employment.
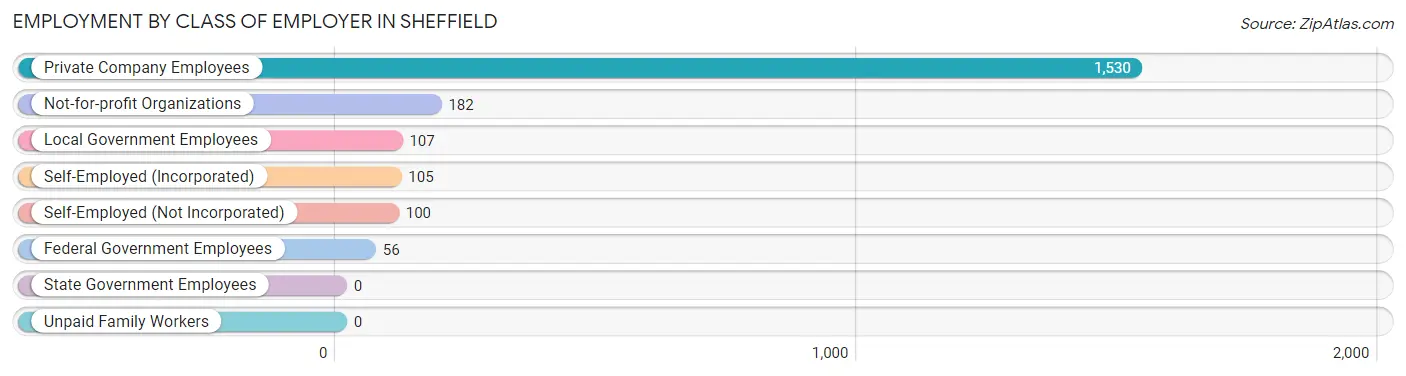
| Employer Class | # Employees | % Employees |
| Private Company Employees | 1,530 | 73.6% |
| Self-Employed (Incorporated) | 105 | 5.1% |
| Self-Employed (Not Incorporated) | 100 | 4.8% |
| Not-for-profit Organizations | 182 | 8.7% |
| Local Government Employees | 107 | 5.1% |
| State Government Employees | 0 | 0.0% |
| Federal Government Employees | 56 | 2.7% |
| Unpaid Family Workers | 0 | 0.0% |
| Total | 2,080 | 100.0% |
Employment Status by Age in Sheffield
According to the labor force statistics for Sheffield, out of the total population over 16 years of age (3,683), 58.1% or 2,140 individuals are in the labor force, with 2.4% or 51 of them unemployed. The age group with the highest labor force participation rate is 55 to 59 years, with 93.8% or 304 individuals in the labor force. Within the labor force, the 75 years and over age range has the highest percentage of unemployed individuals, with 57.9% or 11 of them being unemployed.
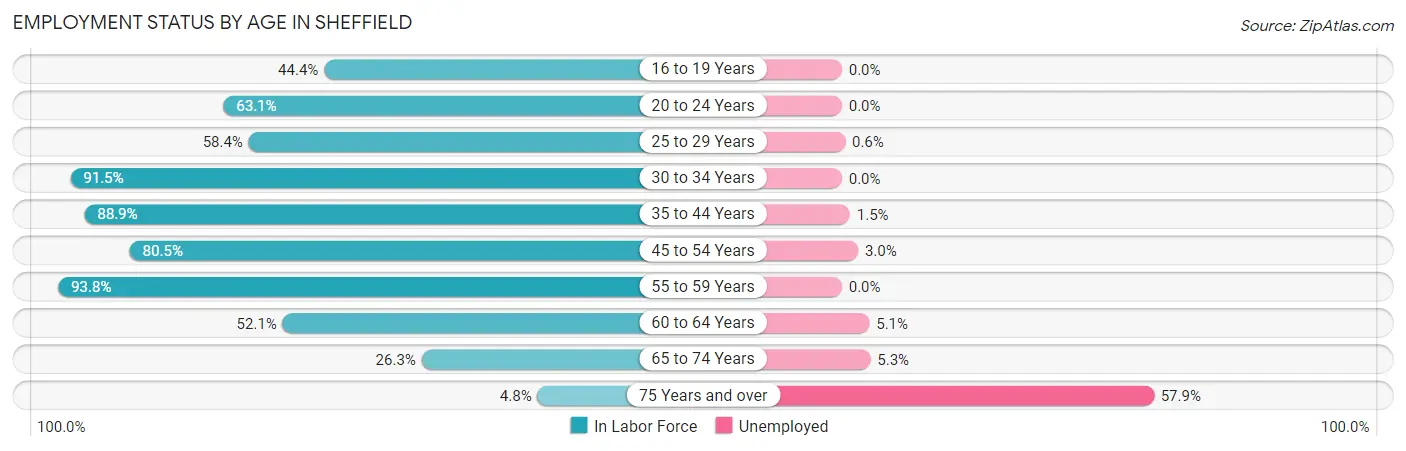
| Age Bracket | In Labor Force | Unemployed |
| 16 to 19 Years | 56 (44.4%) | 0 (0.0%) |
| 20 to 24 Years | 173 (63.1%) | 0 (0.0%) |
| 25 to 29 Years | 171 (58.4%) | 1 (0.6%) |
| 30 to 34 Years | 172 (91.5%) | 0 (0.0%) |
| 35 to 44 Years | 393 (88.9%) | 6 (1.5%) |
| 45 to 54 Years | 505 (80.5%) | 15 (3.0%) |
| 55 to 59 Years | 304 (93.8%) | 0 (0.0%) |
| 60 to 64 Years | 158 (52.1%) | 8 (5.1%) |
| 65 to 74 Years | 187 (26.3%) | 10 (5.3%) |
| 75 Years and over | 19 (4.8%) | 11 (57.9%) |
| Total | 2,140 (58.1%) | 51 (2.4%) |
Employment Status by Educational Attainment in Sheffield
According to labor force statistics for Sheffield, 78.2% of individuals (1,702) out of the total population between 25 and 64 years of age (2,177) are in the labor force, with 1.8% or 31 of them being unemployed. The group with the highest labor force participation rate are those with the educational attainment of bachelor's degree or higher, with 88.8% or 746 individuals in the labor force. Within the labor force, individuals with less than high school education have the highest percentage of unemployment, with 5.6% or 5 of them being unemployed.
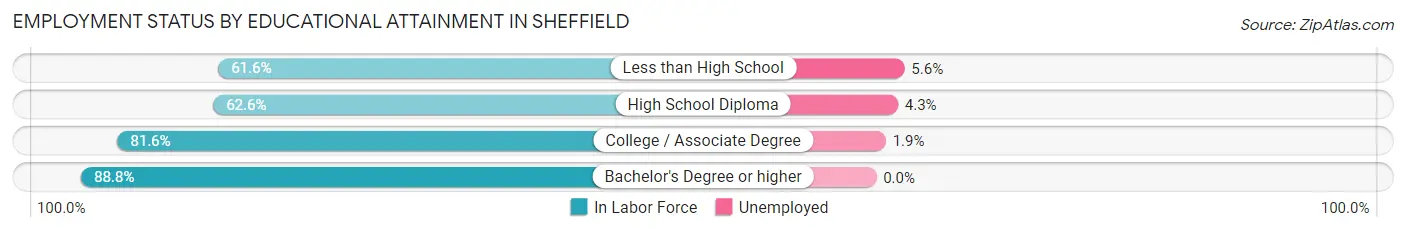
| Educational Attainment | In Labor Force | Unemployed |
| Less than High School | 90 (61.6%) | 8 (5.6%) |
| High School Diploma | 345 (62.6%) | 24 (4.3%) |
| College / Associate Degree | 522 (81.6%) | 12 (1.9%) |
| Bachelor's Degree or higher | 746 (88.8%) | 0 (0.0%) |
| Total | 1,702 (78.2%) | 39 (1.8%) |
Employment Occupations by Sex in Sheffield
Management, Business, Science and Arts Occupations
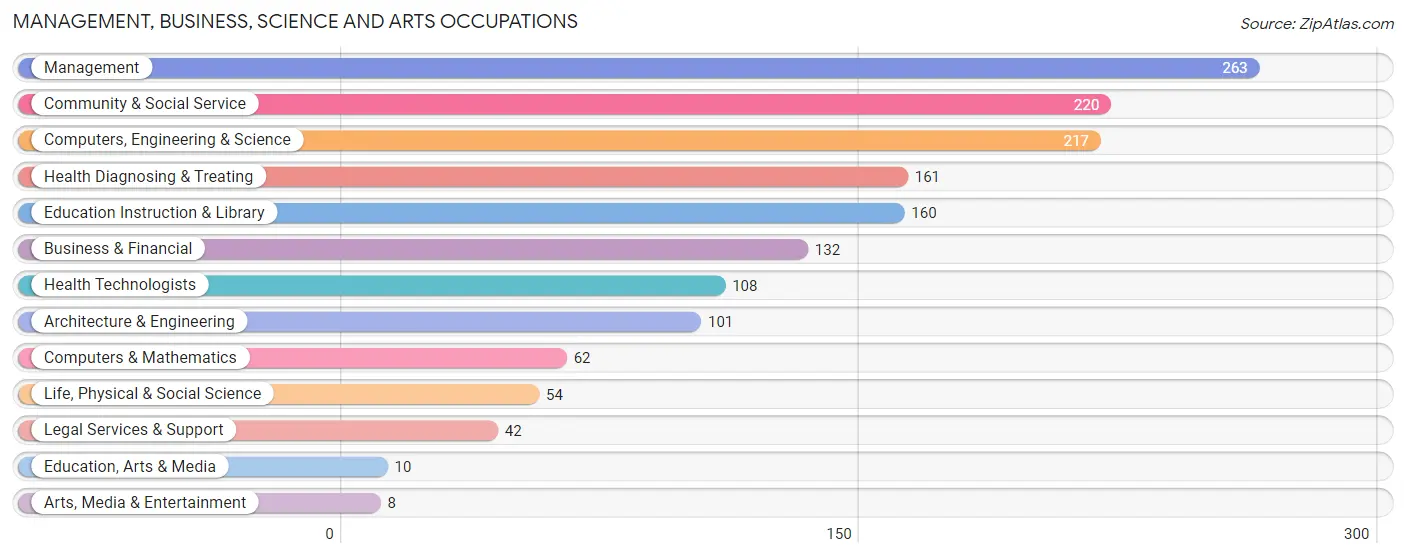
The most common Management, Business, Science and Arts occupations in Sheffield are Management (263 | 12.6%), Community & Social Service (220 | 10.6%), Computers, Engineering & Science (217 | 10.4%), Health Diagnosing & Treating (161 | 7.7%), and Education Instruction & Library (160 | 7.7%).
Management, Business, Science and Arts Occupations by Sex
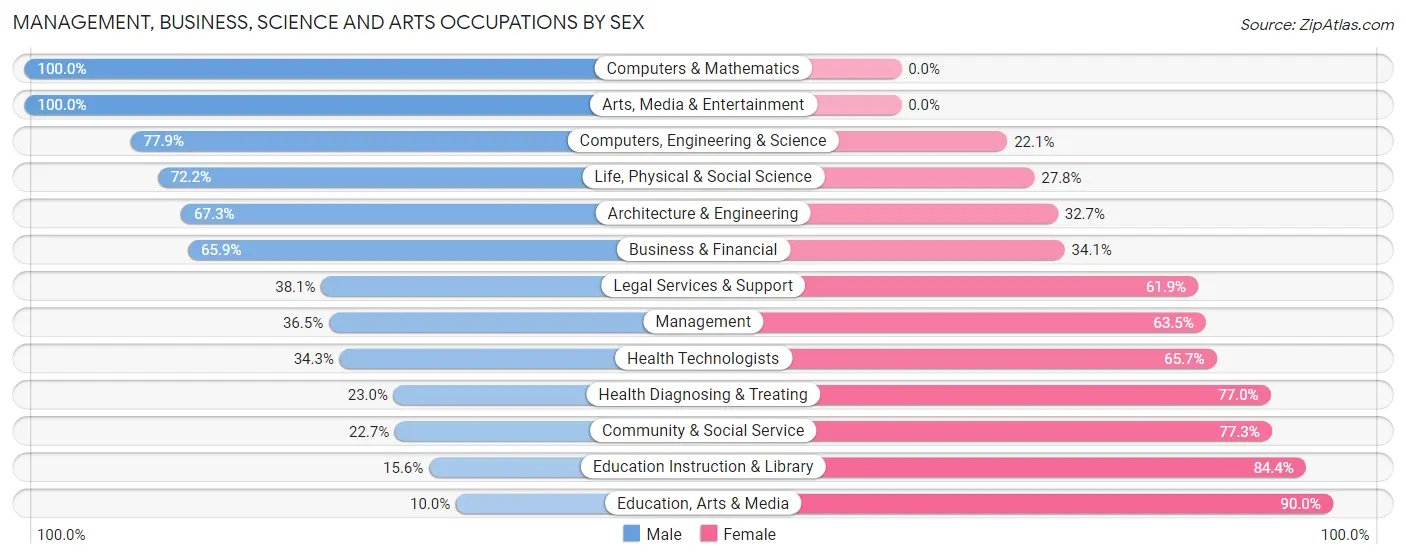
Within the Management, Business, Science and Arts occupations in Sheffield, the most male-oriented occupations are Computers & Mathematics (100.0%), Arts, Media & Entertainment (100.0%), and Computers, Engineering & Science (77.9%), while the most female-oriented occupations are Education, Arts & Media (90.0%), Education Instruction & Library (84.4%), and Community & Social Service (77.3%).
| Occupation | Male | Female |
| Management | 96 (36.5%) | 167 (63.5%) |
| Business & Financial | 87 (65.9%) | 45 (34.1%) |
| Computers, Engineering & Science | 169 (77.9%) | 48 (22.1%) |
| Computers & Mathematics | 62 (100.0%) | 0 (0.0%) |
| Architecture & Engineering | 68 (67.3%) | 33 (32.7%) |
| Life, Physical & Social Science | 39 (72.2%) | 15 (27.8%) |
| Community & Social Service | 50 (22.7%) | 170 (77.3%) |
| Education, Arts & Media | 1 (10.0%) | 9 (90.0%) |
| Legal Services & Support | 16 (38.1%) | 26 (61.9%) |
| Education Instruction & Library | 25 (15.6%) | 135 (84.4%) |
| Arts, Media & Entertainment | 8 (100.0%) | 0 (0.0%) |
| Health Diagnosing & Treating | 37 (23.0%) | 124 (77.0%) |
| Health Technologists | 37 (34.3%) | 71 (65.7%) |
| Total (Category) | 439 (44.2%) | 554 (55.8%) |
| Total (Overall) | 1,135 (54.5%) | 947 (45.5%) |
Services Occupations
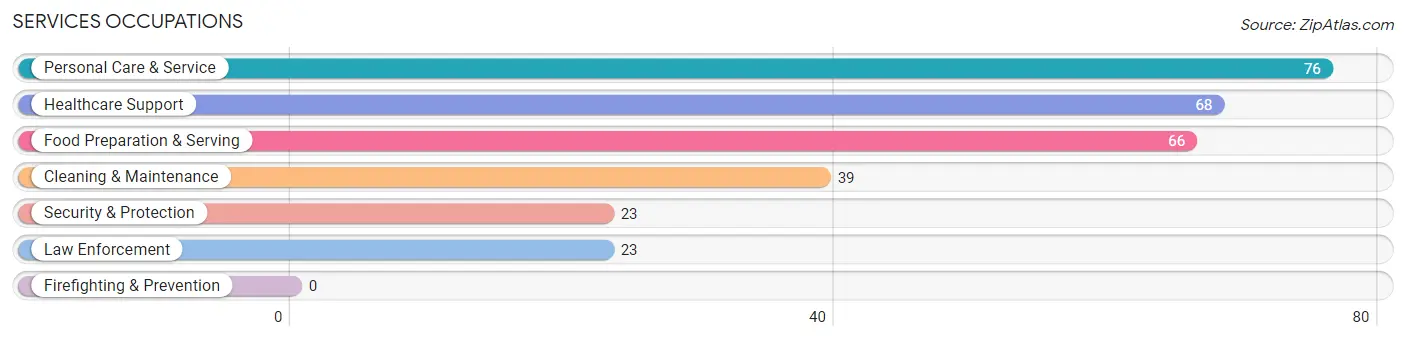
The most common Services occupations in Sheffield are Personal Care & Service (76 | 3.6%), Healthcare Support (68 | 3.3%), Food Preparation & Serving (66 | 3.2%), Cleaning & Maintenance (39 | 1.9%), and Security & Protection (23 | 1.1%).
Services Occupations by Sex
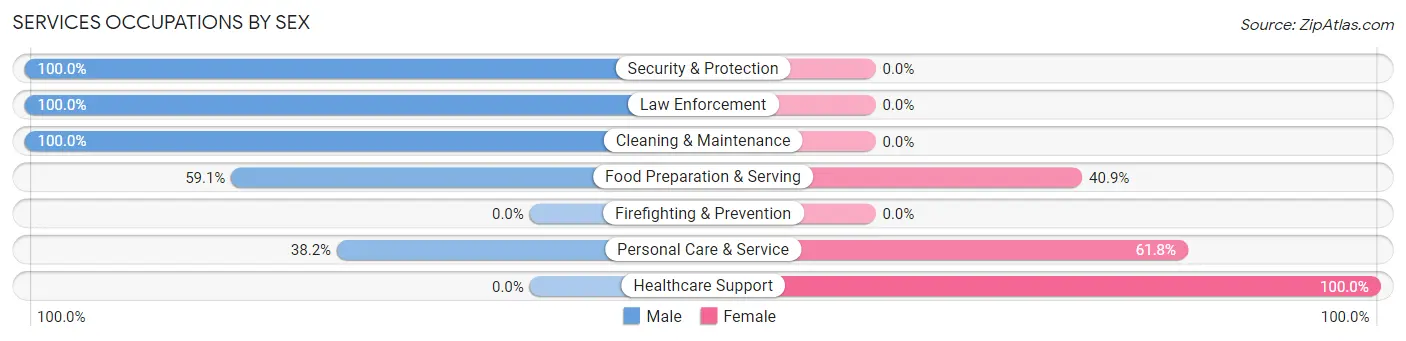
Within the Services occupations in Sheffield, the most male-oriented occupations are Security & Protection (100.0%), Law Enforcement (100.0%), and Cleaning & Maintenance (100.0%), while the most female-oriented occupations are Healthcare Support (100.0%), Personal Care & Service (61.8%), and Food Preparation & Serving (40.9%).
| Occupation | Male | Female |
| Healthcare Support | 0 (0.0%) | 68 (100.0%) |
| Security & Protection | 23 (100.0%) | 0 (0.0%) |
| Firefighting & Prevention | 0 (0.0%) | 0 (0.0%) |
| Law Enforcement | 23 (100.0%) | 0 (0.0%) |
| Food Preparation & Serving | 39 (59.1%) | 27 (40.9%) |
| Cleaning & Maintenance | 39 (100.0%) | 0 (0.0%) |
| Personal Care & Service | 29 (38.2%) | 47 (61.8%) |
| Total (Category) | 130 (47.8%) | 142 (52.2%) |
| Total (Overall) | 1,135 (54.5%) | 947 (45.5%) |
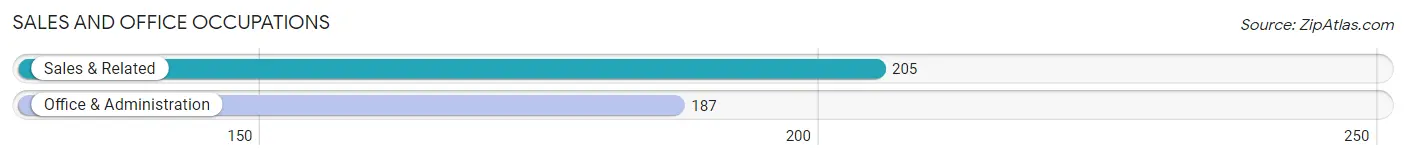
Sales and Office Occupations
The most common Sales and Office occupations in Sheffield are Sales & Related (205 | 9.9%), and Office & Administration (187 | 9.0%).
Sales and Office Occupations by Sex
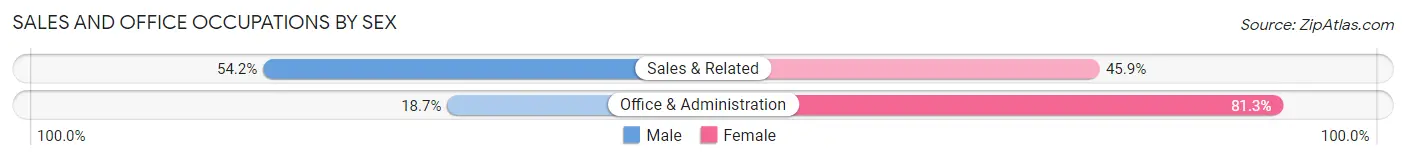
| Occupation | Male | Female |
| Sales & Related | 111 (54.1%) | 94 (45.9%) |
| Office & Administration | 35 (18.7%) | 152 (81.3%) |
| Total (Category) | 146 (37.2%) | 246 (62.8%) |
| Total (Overall) | 1,135 (54.5%) | 947 (45.5%) |
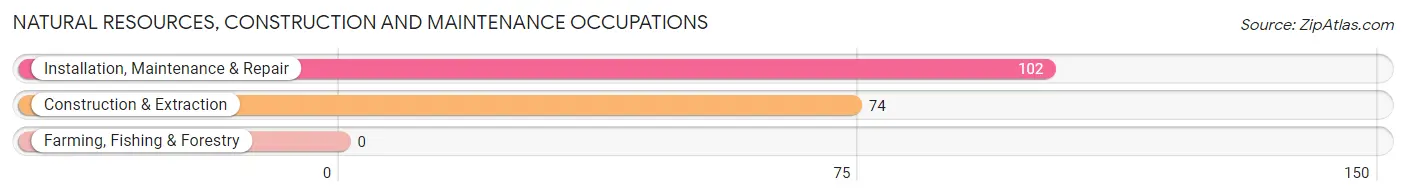
Natural Resources, Construction and Maintenance Occupations
The most common Natural Resources, Construction and Maintenance occupations in Sheffield are Installation, Maintenance & Repair (102 | 4.9%), and Construction & Extraction (74 | 3.5%).
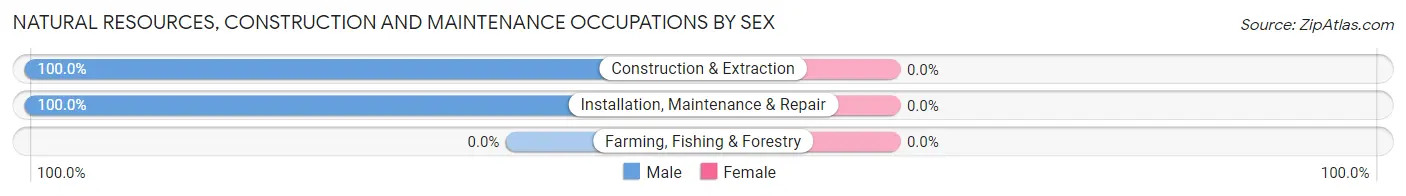
Natural Resources, Construction and Maintenance Occupations by Sex
| Occupation | Male | Female |
| Farming, Fishing & Forestry | 0 (0.0%) | 0 (0.0%) |
| Construction & Extraction | 74 (100.0%) | 0 (0.0%) |
| Installation, Maintenance & Repair | 102 (100.0%) | 0 (0.0%) |
| Total (Category) | 176 (100.0%) | 0 (0.0%) |
| Total (Overall) | 1,135 (54.5%) | 947 (45.5%) |
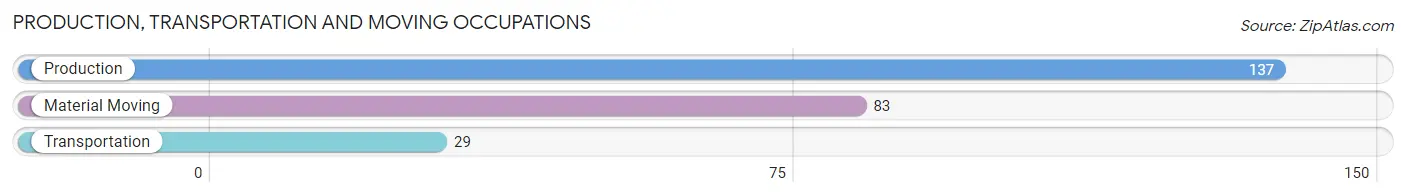
Production, Transportation and Moving Occupations
The most common Production, Transportation and Moving occupations in Sheffield are Production (137 | 6.6%), Material Moving (83 | 4.0%), and Transportation (29 | 1.4%).
Production, Transportation and Moving Occupations by Sex
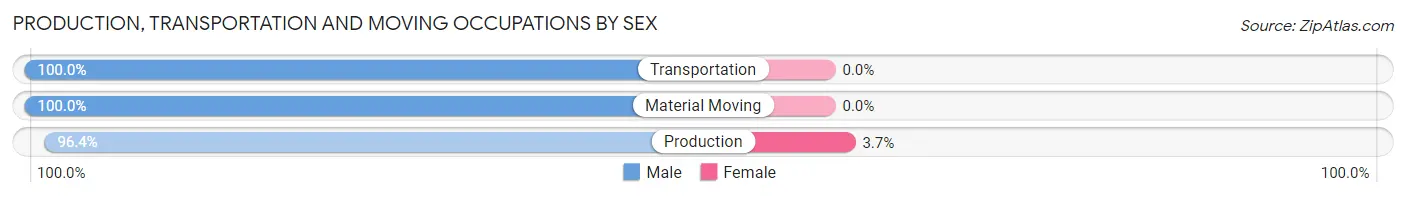
| Occupation | Male | Female |
| Production | 132 (96.4%) | 5 (3.6%) |
| Transportation | 29 (100.0%) | 0 (0.0%) |
| Material Moving | 83 (100.0%) | 0 (0.0%) |
| Total (Category) | 244 (98.0%) | 5 (2.0%) |
| Total (Overall) | 1,135 (54.5%) | 947 (45.5%) |
Employment Industries by Sex in Sheffield
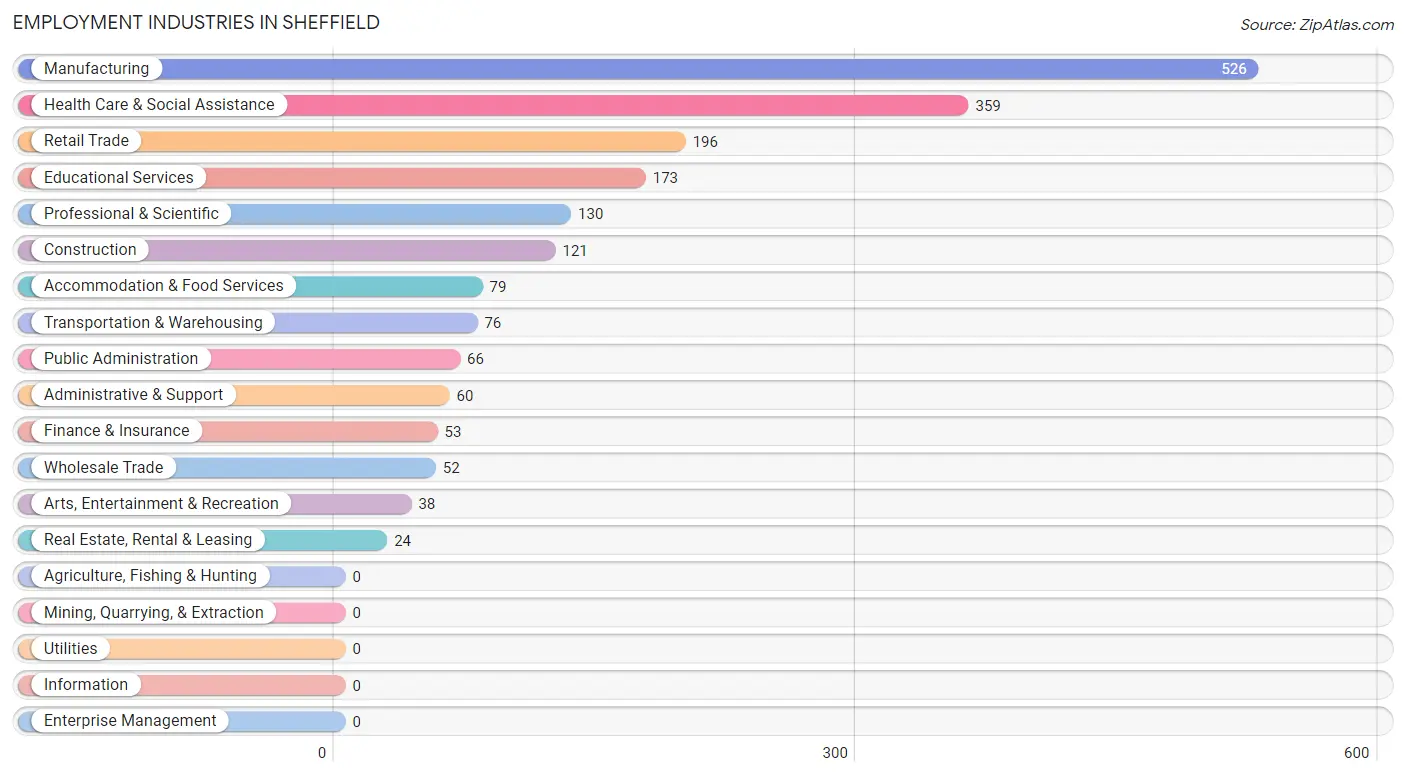
Employment Industries in Sheffield
The major employment industries in Sheffield include Manufacturing (526 | 25.3%), Health Care & Social Assistance (359 | 17.2%), Retail Trade (196 | 9.4%), Educational Services (173 | 8.3%), and Professional & Scientific (130 | 6.2%).
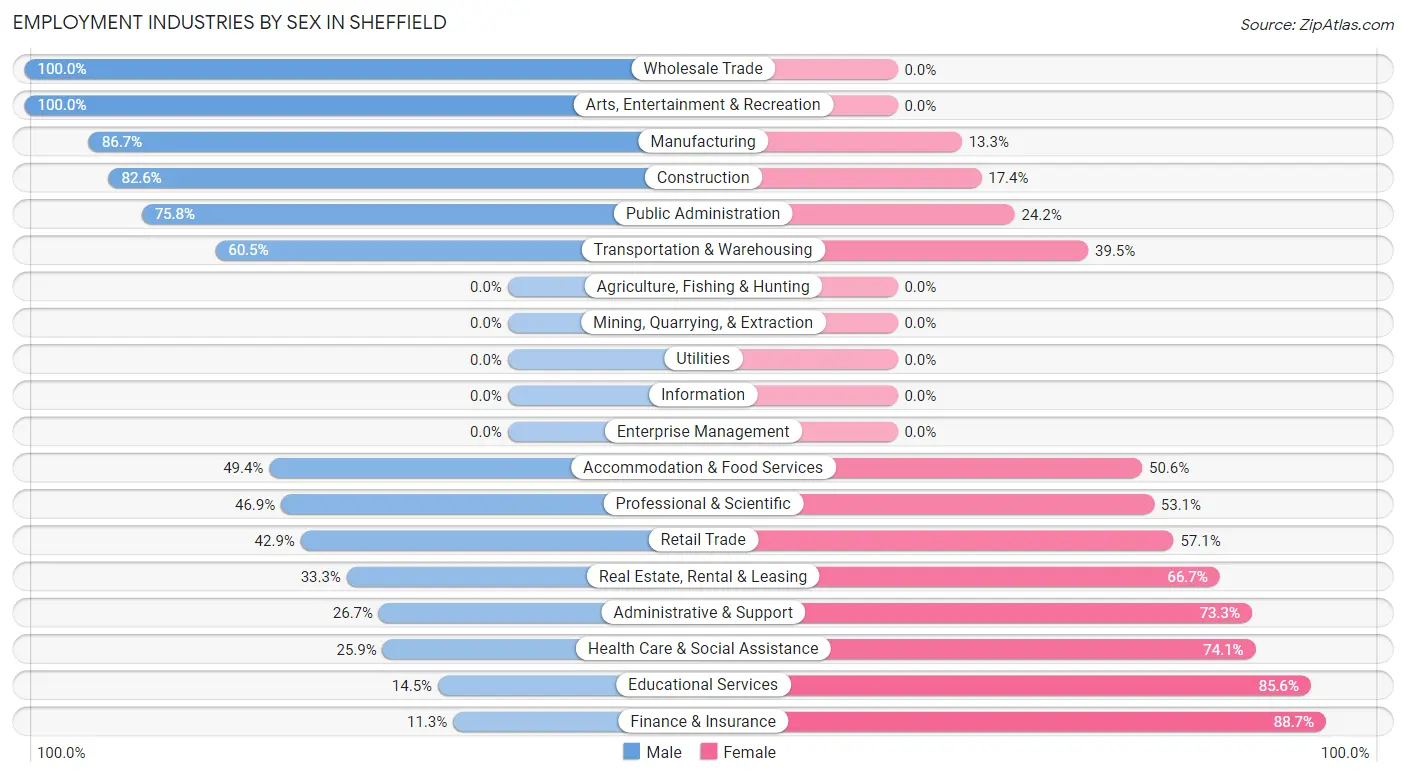
Employment Industries by Sex in Sheffield
The Sheffield industries that see more men than women are Wholesale Trade (100.0%), Arts, Entertainment & Recreation (100.0%), and Manufacturing (86.7%), whereas the industries that tend to have a higher number of women are Finance & Insurance (88.7%), Educational Services (85.6%), and Health Care & Social Assistance (74.1%).
| Industry | Male | Female |
| Agriculture, Fishing & Hunting | 0 (0.0%) | 0 (0.0%) |
| Mining, Quarrying, & Extraction | 0 (0.0%) | 0 (0.0%) |
| Construction | 100 (82.6%) | 21 (17.4%) |
| Manufacturing | 456 (86.7%) | 70 (13.3%) |
| Wholesale Trade | 52 (100.0%) | 0 (0.0%) |
| Retail Trade | 84 (42.9%) | 112 (57.1%) |
| Transportation & Warehousing | 46 (60.5%) | 30 (39.5%) |
| Utilities | 0 (0.0%) | 0 (0.0%) |
| Information | 0 (0.0%) | 0 (0.0%) |
| Finance & Insurance | 6 (11.3%) | 47 (88.7%) |
| Real Estate, Rental & Leasing | 8 (33.3%) | 16 (66.7%) |
| Professional & Scientific | 61 (46.9%) | 69 (53.1%) |
| Enterprise Management | 0 (0.0%) | 0 (0.0%) |
| Administrative & Support | 16 (26.7%) | 44 (73.3%) |
| Educational Services | 25 (14.4%) | 148 (85.6%) |
| Health Care & Social Assistance | 93 (25.9%) | 266 (74.1%) |
| Arts, Entertainment & Recreation | 38 (100.0%) | 0 (0.0%) |
| Accommodation & Food Services | 39 (49.4%) | 40 (50.6%) |
| Public Administration | 50 (75.8%) | 16 (24.2%) |
| Total | 1,135 (54.5%) | 947 (45.5%) |
Education in Sheffield
School Enrollment in Sheffield
The most common levels of schooling among the 851 students in Sheffield are college / undergraduate (276 | 32.4%), elementary school (159 | 18.7%), and middle school (155 | 18.2%).
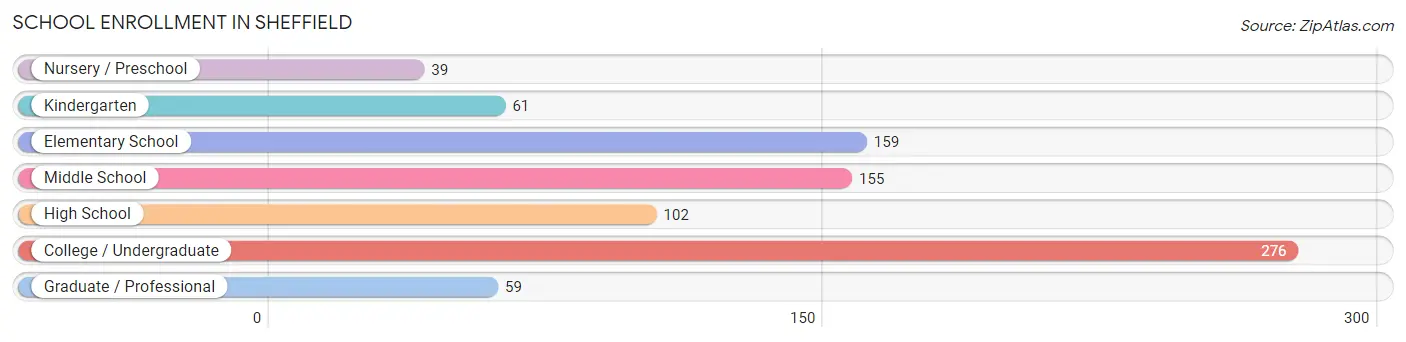
| School Level | # Students | % Students |
| Nursery / Preschool | 39 | 4.6% |
| Kindergarten | 61 | 7.2% |
| Elementary School | 159 | 18.7% |
| Middle School | 155 | 18.2% |
| High School | 102 | 12.0% |
| College / Undergraduate | 276 | 32.4% |
| Graduate / Professional | 59 | 6.9% |
| Total | 851 | 100.0% |
School Enrollment by Age by Funding Source in Sheffield
Out of a total of 851 students who are enrolled in schools in Sheffield, 186 (21.9%) attend a private institution, while the remaining 665 (78.1%) are enrolled in public schools. The age group of 18 to 19 year olds has the highest likelihood of being enrolled in private schools, with 34 (52.3% in the age bracket) enrolled. Conversely, the age group of 25 to 34 year olds has the lowest likelihood of being enrolled in a private school, with 23 (95.8% in the age bracket) attending a public institution.
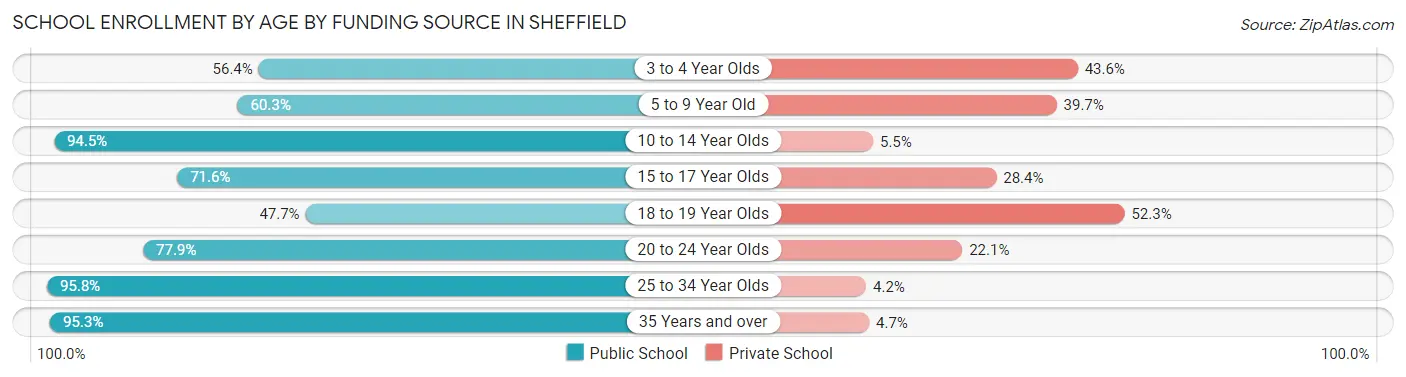
| Age Bracket | Public School | Private School |
| 3 to 4 Year Olds | 22 (56.4%) | 17 (43.6%) |
| 5 to 9 Year Old | 105 (60.3%) | 69 (39.7%) |
| 10 to 14 Year Olds | 190 (94.5%) | 11 (5.5%) |
| 15 to 17 Year Olds | 73 (71.6%) | 29 (28.4%) |
| 18 to 19 Year Olds | 31 (47.7%) | 34 (52.3%) |
| 20 to 24 Year Olds | 60 (77.9%) | 17 (22.1%) |
| 25 to 34 Year Olds | 23 (95.8%) | 1 (4.2%) |
| 35 Years and over | 161 (95.3%) | 8 (4.7%) |
| Total | 665 (78.1%) | 186 (21.9%) |
Educational Attainment by Field of Study in Sheffield
Business (331 | 26.2%), education (185 | 14.6%), science & technology (147 | 11.6%), arts & humanities (117 | 9.2%), and engineering (78 | 6.2%) are the most common fields of study among 1,265 individuals in Sheffield who have obtained a bachelor's degree or higher.
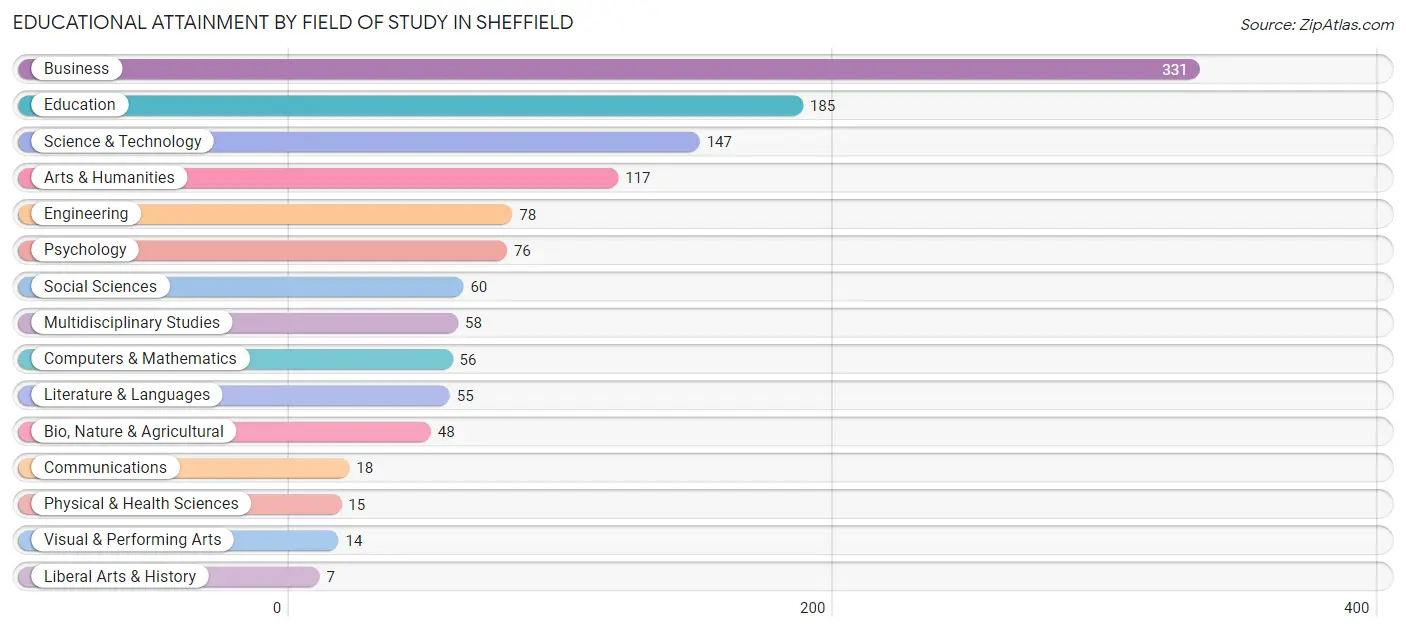
| Field of Study | # Graduates | % Graduates |
| Computers & Mathematics | 56 | 4.4% |
| Bio, Nature & Agricultural | 48 | 3.8% |
| Physical & Health Sciences | 15 | 1.2% |
| Psychology | 76 | 6.0% |
| Social Sciences | 60 | 4.7% |
| Engineering | 78 | 6.2% |
| Multidisciplinary Studies | 58 | 4.6% |
| Science & Technology | 147 | 11.6% |
| Business | 331 | 26.2% |
| Education | 185 | 14.6% |
| Literature & Languages | 55 | 4.3% |
| Liberal Arts & History | 7 | 0.5% |
| Visual & Performing Arts | 14 | 1.1% |
| Communications | 18 | 1.4% |
| Arts & Humanities | 117 | 9.2% |
| Total | 1,265 | 100.0% |
Transportation & Commute in Sheffield
Vehicle Availability by Sex in Sheffield
The most prevalent vehicle ownership categories in Sheffield are males with 2 vehicles (593, accounting for 52.2%) and females with 2 vehicles (461, making up 63.1%).
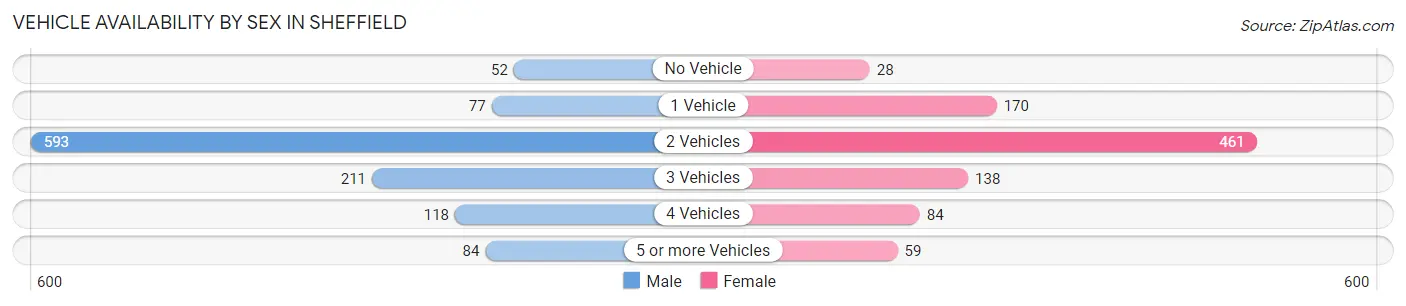
| Vehicles Available | Male | Female |
| No Vehicle | 52 (4.6%) | 28 (3.0%) |
| 1 Vehicle | 77 (6.8%) | 170 (18.1%) |
| 2 Vehicles | 593 (52.2%) | 461 (49.0%) |
| 3 Vehicles | 211 (18.6%) | 138 (14.7%) |
| 4 Vehicles | 118 (10.4%) | 84 (8.9%) |
| 5 or more Vehicles | 84 (7.4%) | 59 (6.3%) |
| Total | 1,135 (100.0%) | 940 (100.0%) |
Commute Time in Sheffield
The most frequently occuring commute durations in Sheffield are 10 to 14 minutes (357 commuters, 19.3%), 20 to 24 minutes (296 commuters, 16.0%), and 15 to 19 minutes (274 commuters, 14.8%).
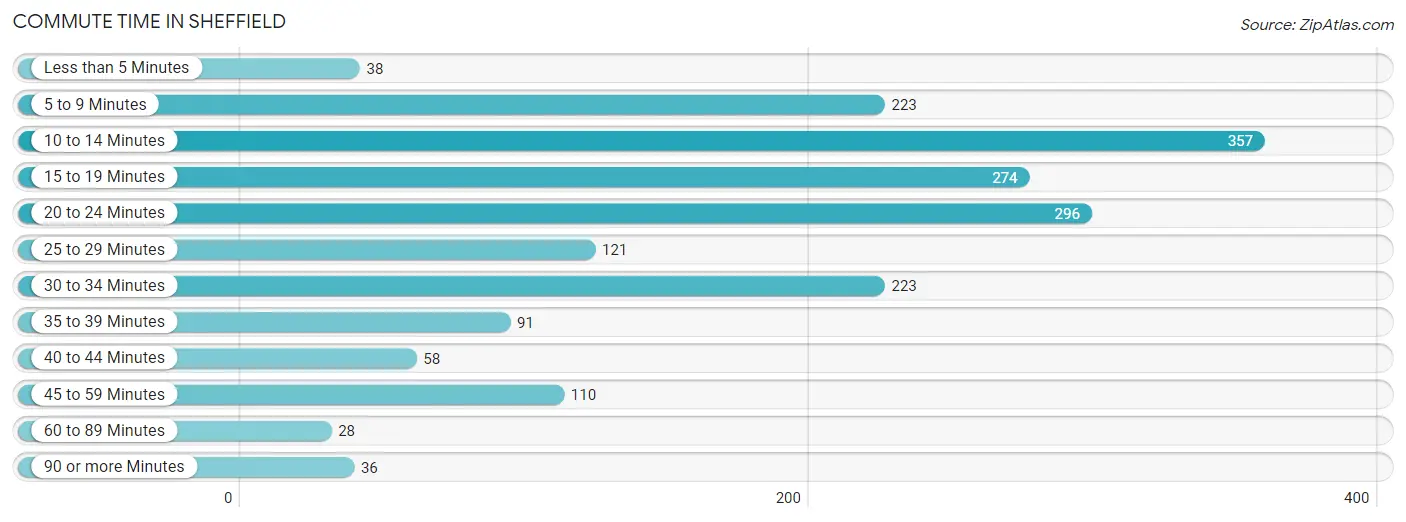
| Commute Time | # Commuters | % Commuters |
| Less than 5 Minutes | 38 | 2.1% |
| 5 to 9 Minutes | 223 | 12.0% |
| 10 to 14 Minutes | 357 | 19.3% |
| 15 to 19 Minutes | 274 | 14.8% |
| 20 to 24 Minutes | 296 | 16.0% |
| 25 to 29 Minutes | 121 | 6.5% |
| 30 to 34 Minutes | 223 | 12.0% |
| 35 to 39 Minutes | 91 | 4.9% |
| 40 to 44 Minutes | 58 | 3.1% |
| 45 to 59 Minutes | 110 | 5.9% |
| 60 to 89 Minutes | 28 | 1.5% |
| 90 or more Minutes | 36 | 1.9% |
Commute Time by Sex in Sheffield
The most common commute times in Sheffield are 20 to 24 minutes (229 commuters, 21.3%) for males and 10 to 14 minutes (199 commuters, 25.5%) for females.
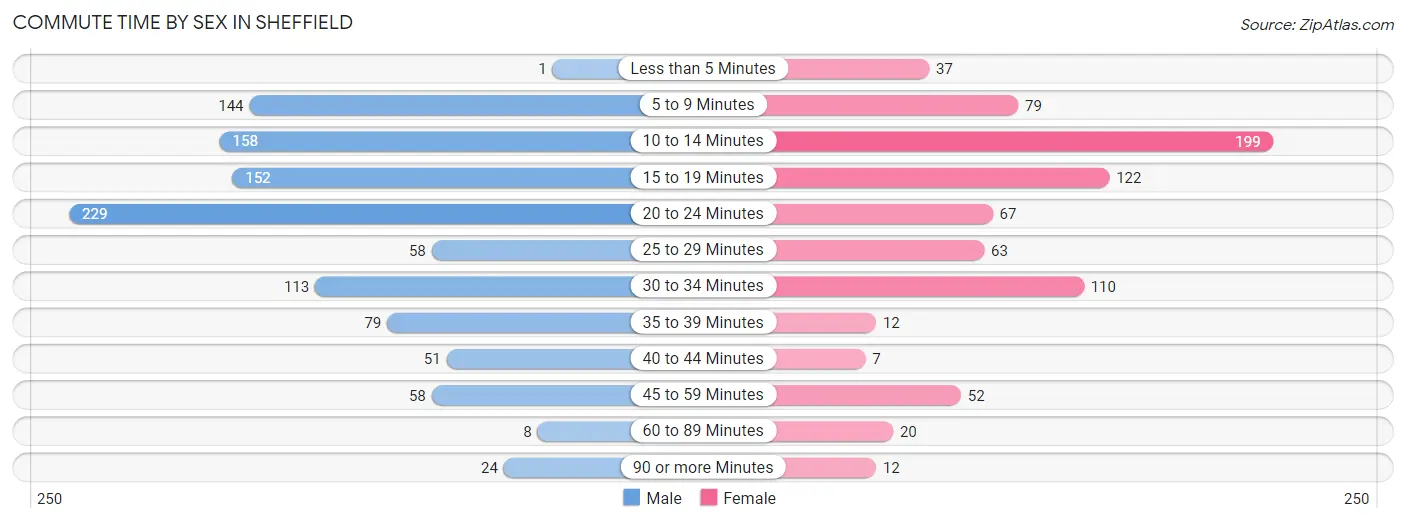
| Commute Time | Male | Female |
| Less than 5 Minutes | 1 (0.1%) | 37 (4.7%) |
| 5 to 9 Minutes | 144 (13.4%) | 79 (10.1%) |
| 10 to 14 Minutes | 158 (14.7%) | 199 (25.5%) |
| 15 to 19 Minutes | 152 (14.1%) | 122 (15.6%) |
| 20 to 24 Minutes | 229 (21.3%) | 67 (8.6%) |
| 25 to 29 Minutes | 58 (5.4%) | 63 (8.1%) |
| 30 to 34 Minutes | 113 (10.5%) | 110 (14.1%) |
| 35 to 39 Minutes | 79 (7.3%) | 12 (1.5%) |
| 40 to 44 Minutes | 51 (4.7%) | 7 (0.9%) |
| 45 to 59 Minutes | 58 (5.4%) | 52 (6.7%) |
| 60 to 89 Minutes | 8 (0.7%) | 20 (2.6%) |
| 90 or more Minutes | 24 (2.2%) | 12 (1.5%) |
Time of Departure to Work by Sex in Sheffield
The most frequent times of departure to work in Sheffield are 7:00 AM to 7:29 AM (190, 17.7%) for males and 8:00 AM to 8:29 AM (135, 17.3%) for females.
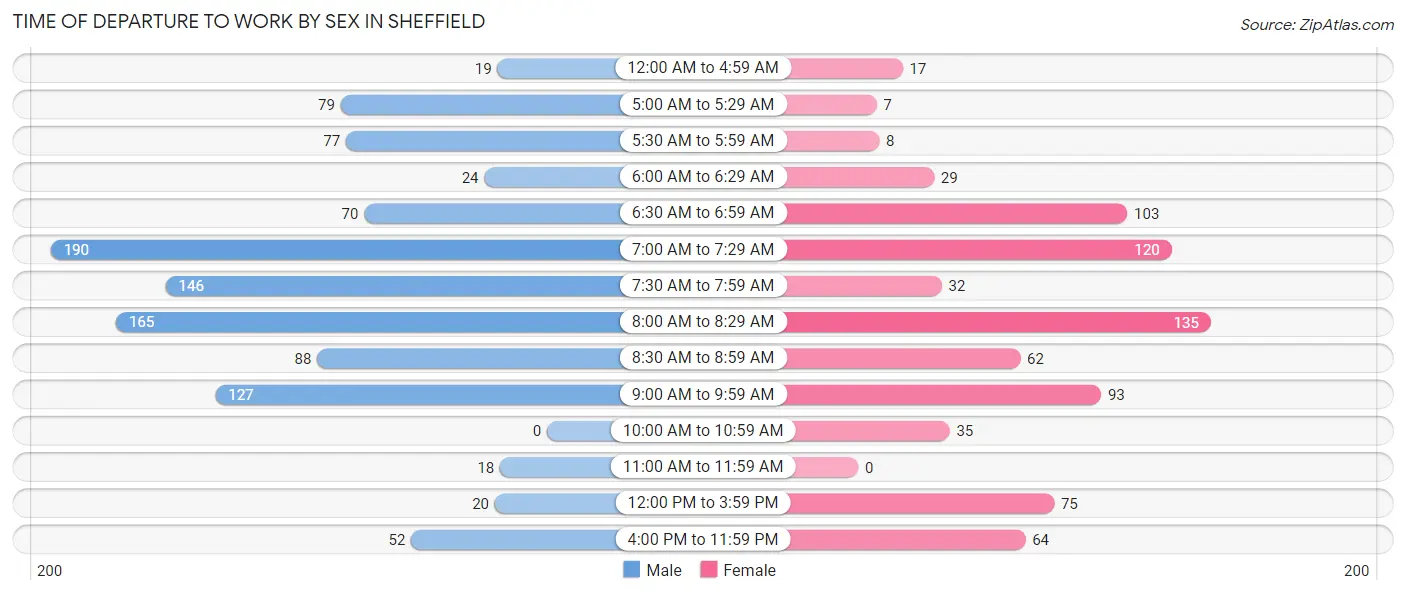
| Time of Departure | Male | Female |
| 12:00 AM to 4:59 AM | 19 (1.8%) | 17 (2.2%) |
| 5:00 AM to 5:29 AM | 79 (7.3%) | 7 (0.9%) |
| 5:30 AM to 5:59 AM | 77 (7.2%) | 8 (1.0%) |
| 6:00 AM to 6:29 AM | 24 (2.2%) | 29 (3.7%) |
| 6:30 AM to 6:59 AM | 70 (6.5%) | 103 (13.2%) |
| 7:00 AM to 7:29 AM | 190 (17.7%) | 120 (15.4%) |
| 7:30 AM to 7:59 AM | 146 (13.6%) | 32 (4.1%) |
| 8:00 AM to 8:29 AM | 165 (15.3%) | 135 (17.3%) |
| 8:30 AM to 8:59 AM | 88 (8.2%) | 62 (8.0%) |
| 9:00 AM to 9:59 AM | 127 (11.8%) | 93 (11.9%) |
| 10:00 AM to 10:59 AM | 0 (0.0%) | 35 (4.5%) |
| 11:00 AM to 11:59 AM | 18 (1.7%) | 0 (0.0%) |
| 12:00 PM to 3:59 PM | 20 (1.9%) | 75 (9.6%) |
| 4:00 PM to 11:59 PM | 52 (4.8%) | 64 (8.2%) |
| Total | 1,075 (100.0%) | 780 (100.0%) |
Housing Occupancy in Sheffield
Occupancy by Ownership in Sheffield
Of the total 1,660 dwellings in Sheffield, owner-occupied units account for 1,215 (73.2%), while renter-occupied units make up 445 (26.8%).
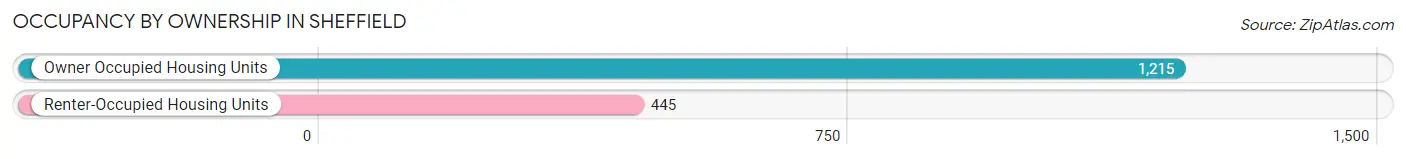
| Occupancy | # Housing Units | % Housing Units |
| Owner Occupied Housing Units | 1,215 | 73.2% |
| Renter-Occupied Housing Units | 445 | 26.8% |
| Total Occupied Housing Units | 1,660 | 100.0% |
Occupancy by Household Size in Sheffield
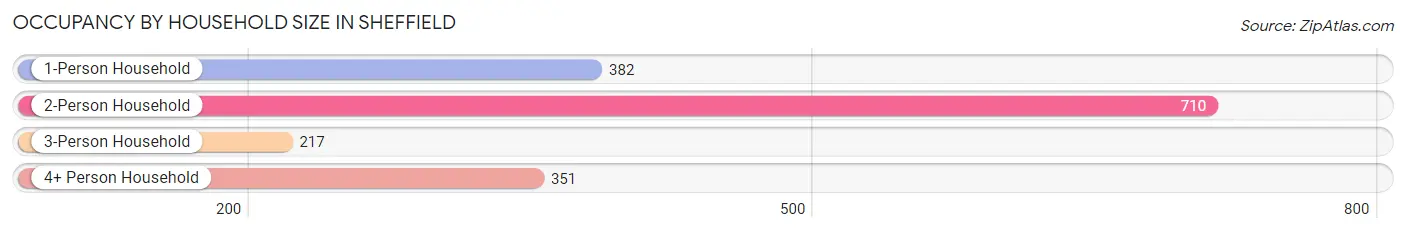
| Household Size | # Housing Units | % Housing Units |
| 1-Person Household | 382 | 23.0% |
| 2-Person Household | 710 | 42.8% |
| 3-Person Household | 217 | 13.1% |
| 4+ Person Household | 351 | 21.1% |
| Total Housing Units | 1,660 | 100.0% |
Occupancy by Ownership by Household Size in Sheffield
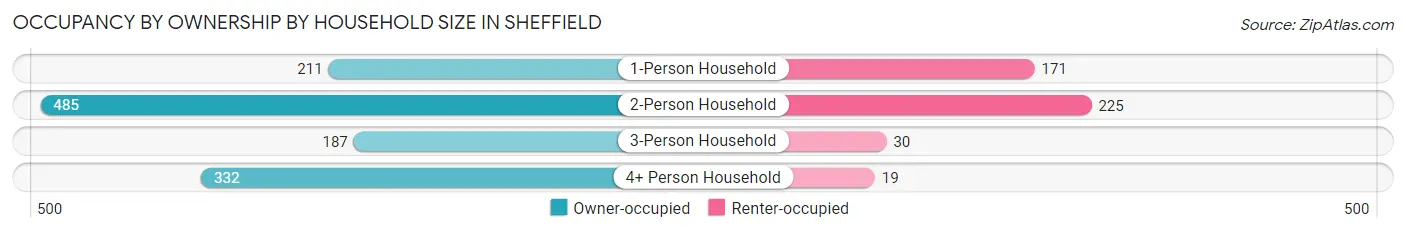
| Household Size | Owner-occupied | Renter-occupied |
| 1-Person Household | 211 (55.2%) | 171 (44.8%) |
| 2-Person Household | 485 (68.3%) | 225 (31.7%) |
| 3-Person Household | 187 (86.2%) | 30 (13.8%) |
| 4+ Person Household | 332 (94.6%) | 19 (5.4%) |
| Total Housing Units | 1,215 (73.2%) | 445 (26.8%) |
Occupancy by Educational Attainment in Sheffield
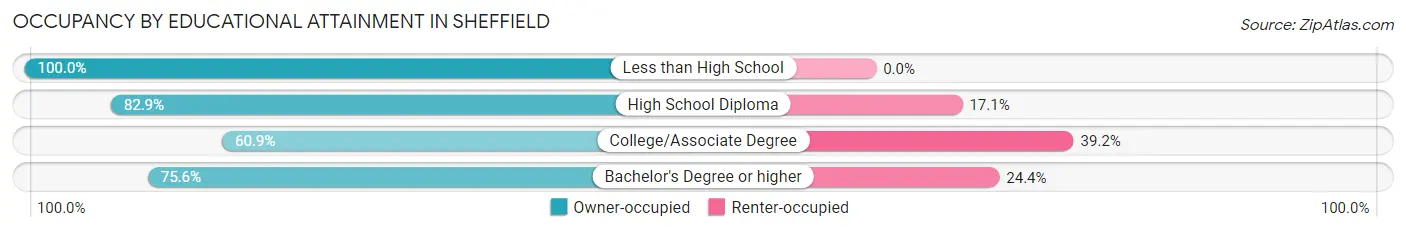
| Household Size | Owner-occupied | Renter-occupied |
| Less than High School | 44 (100.0%) | 0 (0.0%) |
| High School Diploma | 339 (82.9%) | 70 (17.1%) |
| College/Associate Degree | 331 (60.9%) | 213 (39.2%) |
| Bachelor's Degree or higher | 501 (75.6%) | 162 (24.4%) |
Occupancy by Age of Householder in Sheffield
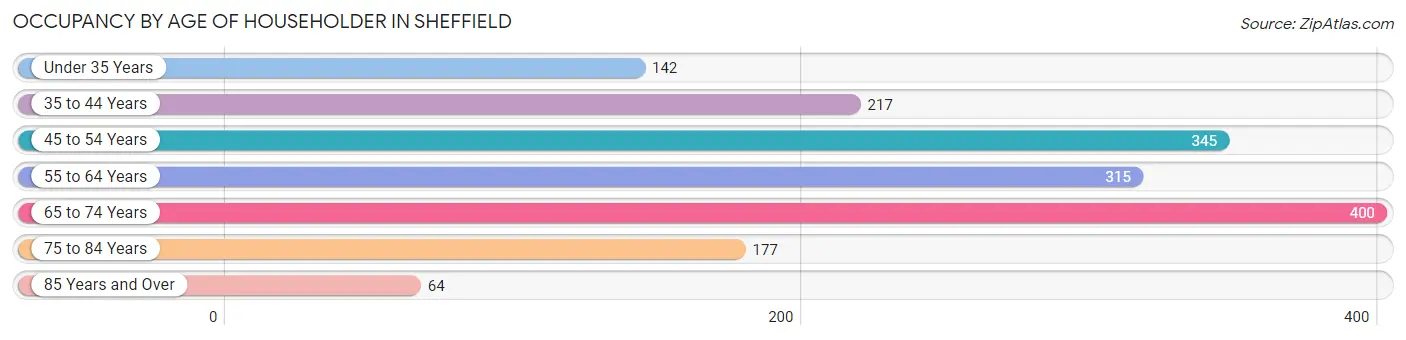
| Age Bracket | # Households | % Households |
| Under 35 Years | 142 | 8.6% |
| 35 to 44 Years | 217 | 13.1% |
| 45 to 54 Years | 345 | 20.8% |
| 55 to 64 Years | 315 | 19.0% |
| 65 to 74 Years | 400 | 24.1% |
| 75 to 84 Years | 177 | 10.7% |
| 85 Years and Over | 64 | 3.9% |
| Total | 1,660 | 100.0% |
Housing Finances in Sheffield
Median Income by Occupancy in Sheffield
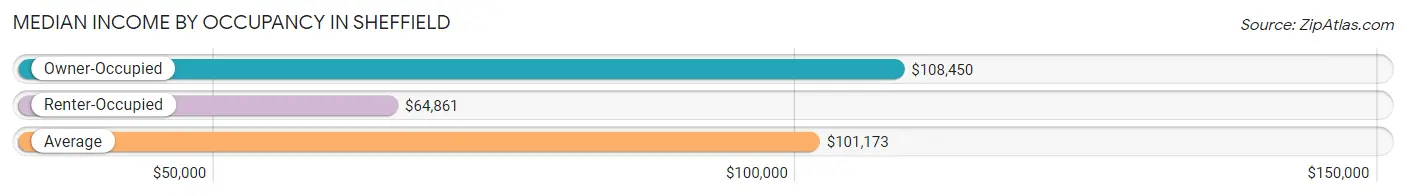
| Occupancy Type | # Households | Median Income |
| Owner-Occupied | 1,215 (73.2%) | $108,450 |
| Renter-Occupied | 445 (26.8%) | $64,861 |
| Average | 1,660 (100.0%) | $101,173 |
Occupancy by Householder Income Bracket in Sheffield
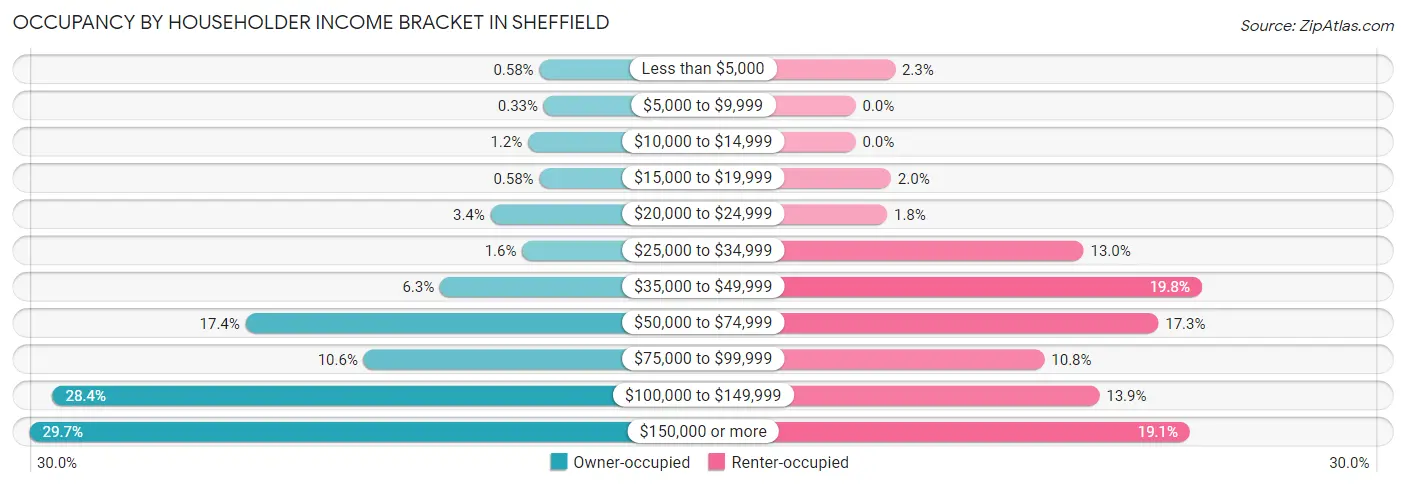
| Income Bracket | Owner-occupied | Renter-occupied |
| Less than $5,000 | 7 (0.6%) | 10 (2.2%) |
| $5,000 to $9,999 | 4 (0.3%) | 0 (0.0%) |
| $10,000 to $14,999 | 15 (1.2%) | 0 (0.0%) |
| $15,000 to $19,999 | 7 (0.6%) | 9 (2.0%) |
| $20,000 to $24,999 | 41 (3.4%) | 8 (1.8%) |
| $25,000 to $34,999 | 19 (1.6%) | 58 (13.0%) |
| $35,000 to $49,999 | 76 (6.3%) | 88 (19.8%) |
| $50,000 to $74,999 | 211 (17.4%) | 77 (17.3%) |
| $75,000 to $99,999 | 129 (10.6%) | 48 (10.8%) |
| $100,000 to $149,999 | 345 (28.4%) | 62 (13.9%) |
| $150,000 or more | 361 (29.7%) | 85 (19.1%) |
| Total | 1,215 (100.0%) | 445 (100.0%) |
Monthly Housing Cost Tiers in Sheffield
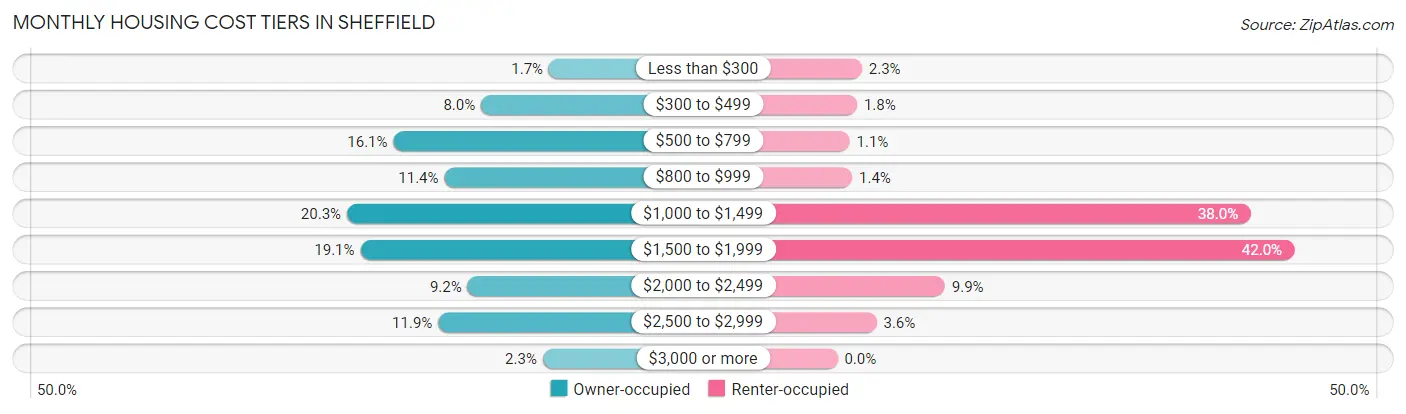
| Monthly Cost | Owner-occupied | Renter-occupied |
| Less than $300 | 21 (1.7%) | 10 (2.2%) |
| $300 to $499 | 97 (8.0%) | 8 (1.8%) |
| $500 to $799 | 195 (16.1%) | 5 (1.1%) |
| $800 to $999 | 138 (11.4%) | 6 (1.3%) |
| $1,000 to $1,499 | 247 (20.3%) | 169 (38.0%) |
| $1,500 to $1,999 | 232 (19.1%) | 187 (42.0%) |
| $2,000 to $2,499 | 112 (9.2%) | 44 (9.9%) |
| $2,500 to $2,999 | 145 (11.9%) | 16 (3.6%) |
| $3,000 or more | 28 (2.3%) | 0 (0.0%) |
| Total | 1,215 (100.0%) | 445 (100.0%) |
Physical Housing Characteristics in Sheffield
Housing Structures in Sheffield
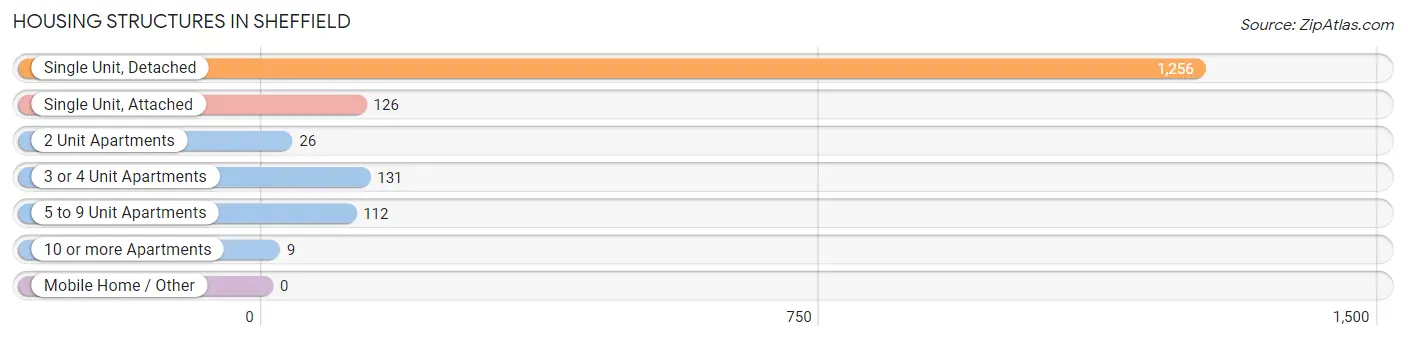
| Structure Type | # Housing Units | % Housing Units |
| Single Unit, Detached | 1,256 | 75.7% |
| Single Unit, Attached | 126 | 7.6% |
| 2 Unit Apartments | 26 | 1.6% |
| 3 or 4 Unit Apartments | 131 | 7.9% |
| 5 to 9 Unit Apartments | 112 | 6.8% |
| 10 or more Apartments | 9 | 0.5% |
| Mobile Home / Other | 0 | 0.0% |
| Total | 1,660 | 100.0% |
Housing Structures by Occupancy in Sheffield
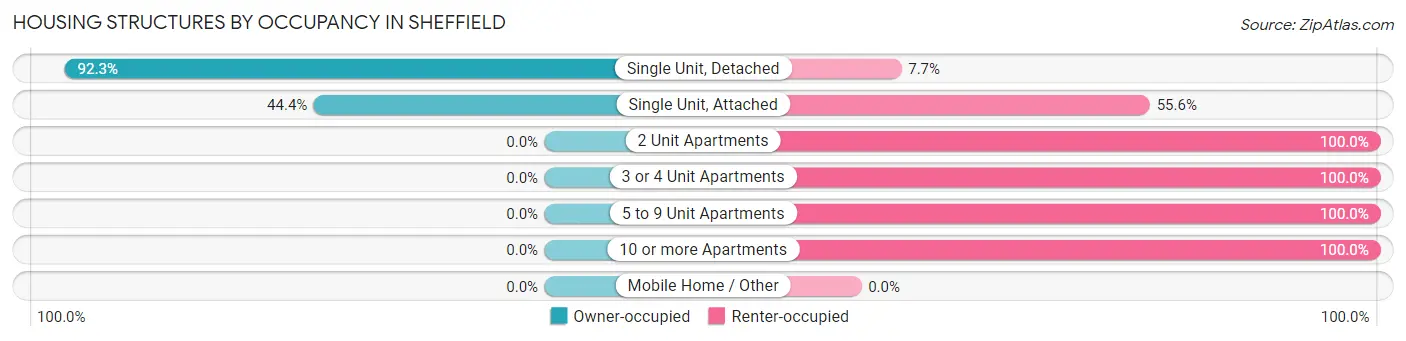
| Structure Type | Owner-occupied | Renter-occupied |
| Single Unit, Detached | 1,159 (92.3%) | 97 (7.7%) |
| Single Unit, Attached | 56 (44.4%) | 70 (55.6%) |
| 2 Unit Apartments | 0 (0.0%) | 26 (100.0%) |
| 3 or 4 Unit Apartments | 0 (0.0%) | 131 (100.0%) |
| 5 to 9 Unit Apartments | 0 (0.0%) | 112 (100.0%) |
| 10 or more Apartments | 0 (0.0%) | 9 (100.0%) |
| Mobile Home / Other | 0 (0.0%) | 0 (0.0%) |
| Total | 1,215 (73.2%) | 445 (26.8%) |
Housing Structures by Number of Rooms in Sheffield
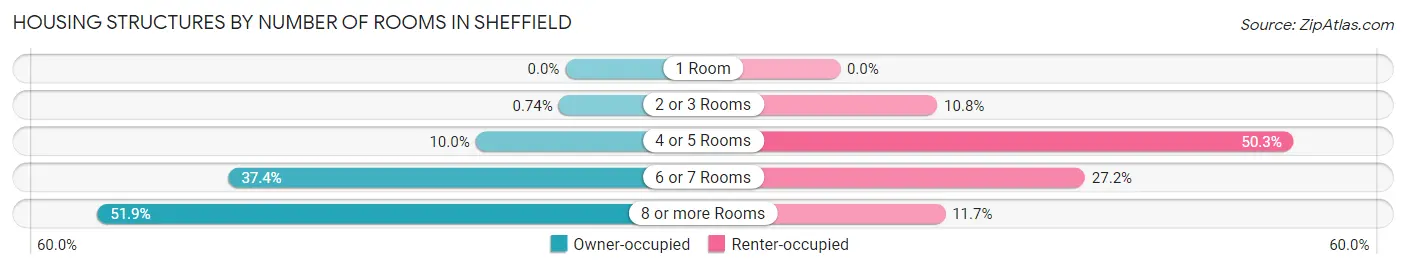
| Number of Rooms | Owner-occupied | Renter-occupied |
| 1 Room | 0 (0.0%) | 0 (0.0%) |
| 2 or 3 Rooms | 9 (0.7%) | 48 (10.8%) |
| 4 or 5 Rooms | 121 (10.0%) | 224 (50.3%) |
| 6 or 7 Rooms | 454 (37.4%) | 121 (27.2%) |
| 8 or more Rooms | 631 (51.9%) | 52 (11.7%) |
| Total | 1,215 (100.0%) | 445 (100.0%) |
Housing Structure by Heating Type in Sheffield
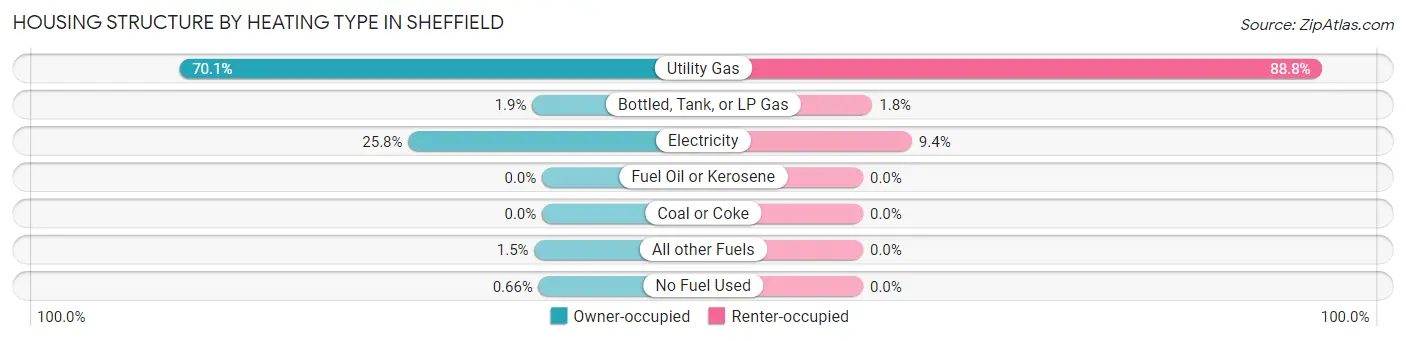
| Heating Type | Owner-occupied | Renter-occupied |
| Utility Gas | 852 (70.1%) | 395 (88.8%) |
| Bottled, Tank, or LP Gas | 23 (1.9%) | 8 (1.8%) |
| Electricity | 314 (25.8%) | 42 (9.4%) |
| Fuel Oil or Kerosene | 0 (0.0%) | 0 (0.0%) |
| Coal or Coke | 0 (0.0%) | 0 (0.0%) |
| All other Fuels | 18 (1.5%) | 0 (0.0%) |
| No Fuel Used | 8 (0.7%) | 0 (0.0%) |
| Total | 1,215 (100.0%) | 445 (100.0%) |
Household Vehicle Usage in Sheffield
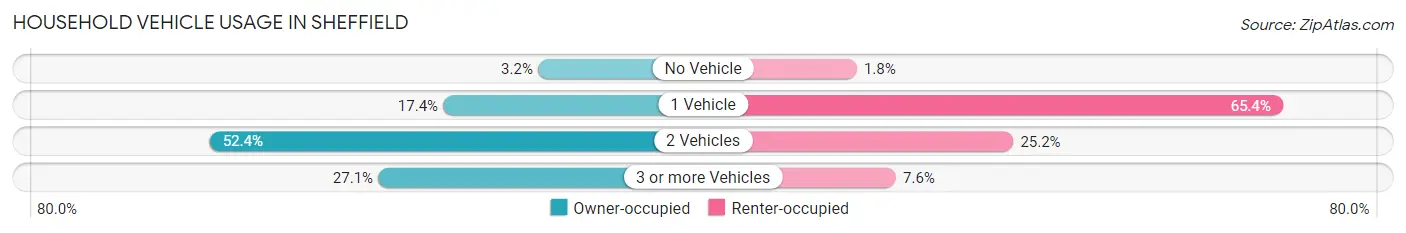
| Vehicles per Household | Owner-occupied | Renter-occupied |
| No Vehicle | 39 (3.2%) | 8 (1.8%) |
| 1 Vehicle | 211 (17.4%) | 291 (65.4%) |
| 2 Vehicles | 636 (52.3%) | 112 (25.2%) |
| 3 or more Vehicles | 329 (27.1%) | 34 (7.6%) |
| Total | 1,215 (100.0%) | 445 (100.0%) |
Real Estate & Mortgages in Sheffield
Real Estate and Mortgage Overview in Sheffield
| Characteristic | Without Mortgage | With Mortgage |
| Housing Units | 438 | 777 |
| Median Property Value | $251,100 | $267,300 |
| Median Household Income | $90,547 | $245 |
| Monthly Housing Costs | $682 | $28 |
| Real Estate Taxes | $3,905 | $17 |
Property Value by Mortgage Status in Sheffield
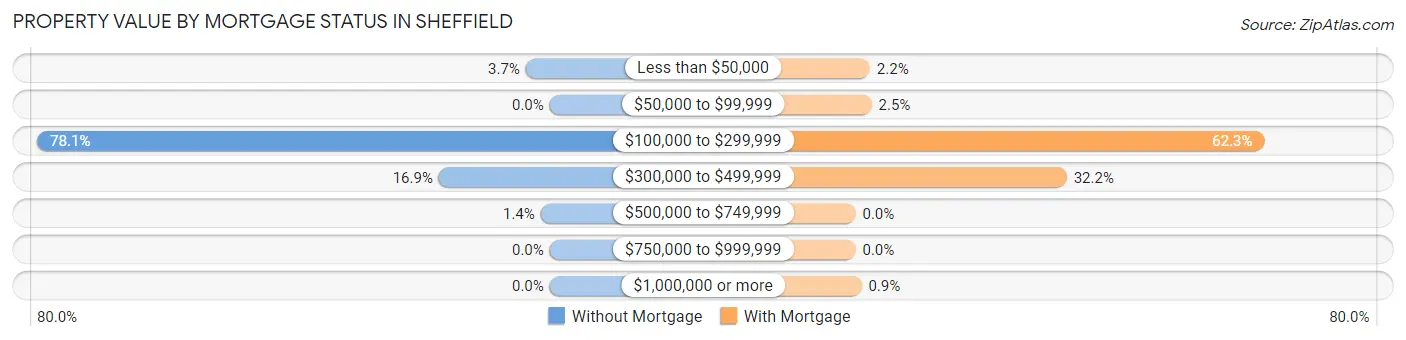
| Property Value | Without Mortgage | With Mortgage |
| Less than $50,000 | 16 (3.6%) | 17 (2.2%) |
| $50,000 to $99,999 | 0 (0.0%) | 19 (2.5%) |
| $100,000 to $299,999 | 342 (78.1%) | 484 (62.3%) |
| $300,000 to $499,999 | 74 (16.9%) | 250 (32.2%) |
| $500,000 to $749,999 | 6 (1.4%) | 0 (0.0%) |
| $750,000 to $999,999 | 0 (0.0%) | 0 (0.0%) |
| $1,000,000 or more | 0 (0.0%) | 7 (0.9%) |
| Total | 438 (100.0%) | 777 (100.0%) |
Household Income by Mortgage Status in Sheffield
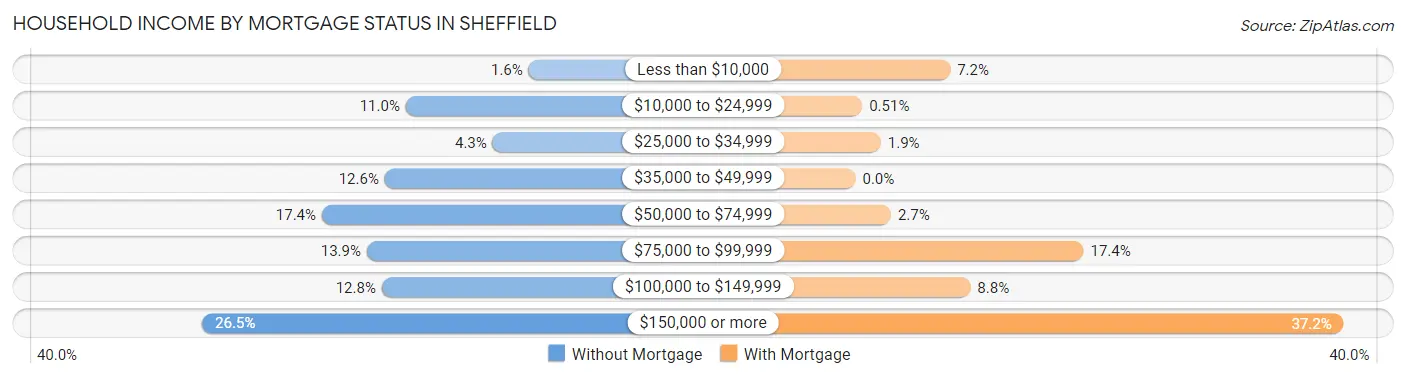
| Household Income | Without Mortgage | With Mortgage |
| Less than $10,000 | 7 (1.6%) | 56 (7.2%) |
| $10,000 to $24,999 | 48 (11.0%) | 4 (0.5%) |
| $25,000 to $34,999 | 19 (4.3%) | 15 (1.9%) |
| $35,000 to $49,999 | 55 (12.6%) | 0 (0.0%) |
| $50,000 to $74,999 | 76 (17.3%) | 21 (2.7%) |
| $75,000 to $99,999 | 61 (13.9%) | 135 (17.4%) |
| $100,000 to $149,999 | 56 (12.8%) | 68 (8.7%) |
| $150,000 or more | 116 (26.5%) | 289 (37.2%) |
| Total | 438 (100.0%) | 777 (100.0%) |
Property Value to Household Income Ratio in Sheffield
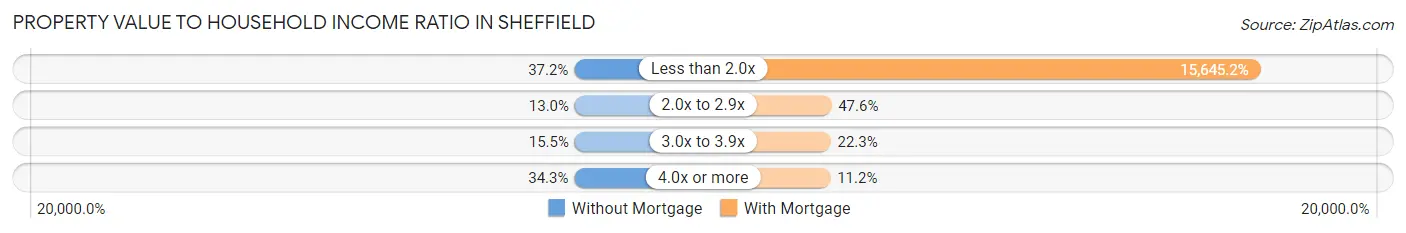
| Value-to-Income Ratio | Without Mortgage | With Mortgage |
| Less than 2.0x | 163 (37.2%) | 121,563 (15,645.2%) |
| 2.0x to 2.9x | 57 (13.0%) | 370 (47.6%) |
| 3.0x to 3.9x | 68 (15.5%) | 173 (22.3%) |
| 4.0x or more | 150 (34.3%) | 87 (11.2%) |
| Total | 438 (100.0%) | 777 (100.0%) |
Real Estate Taxes by Mortgage Status in Sheffield
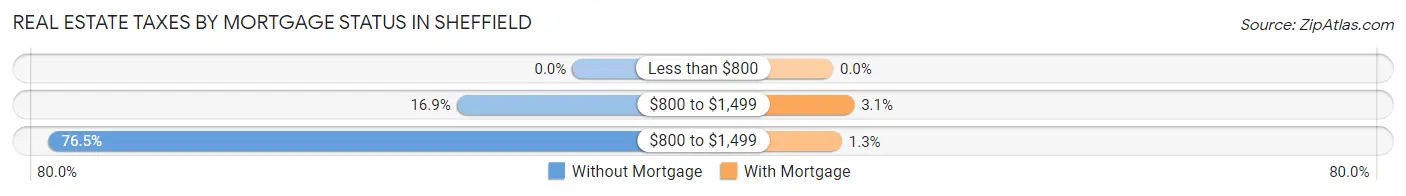
| Property Taxes | Without Mortgage | With Mortgage |
| Less than $800 | 0 (0.0%) | 0 (0.0%) |
| $800 to $1,499 | 74 (16.9%) | 24 (3.1%) |
| $800 to $1,499 | 335 (76.5%) | 10 (1.3%) |
| Total | 438 (100.0%) | 777 (100.0%) |
Health & Disability in Sheffield
Health Insurance Coverage by Age in Sheffield
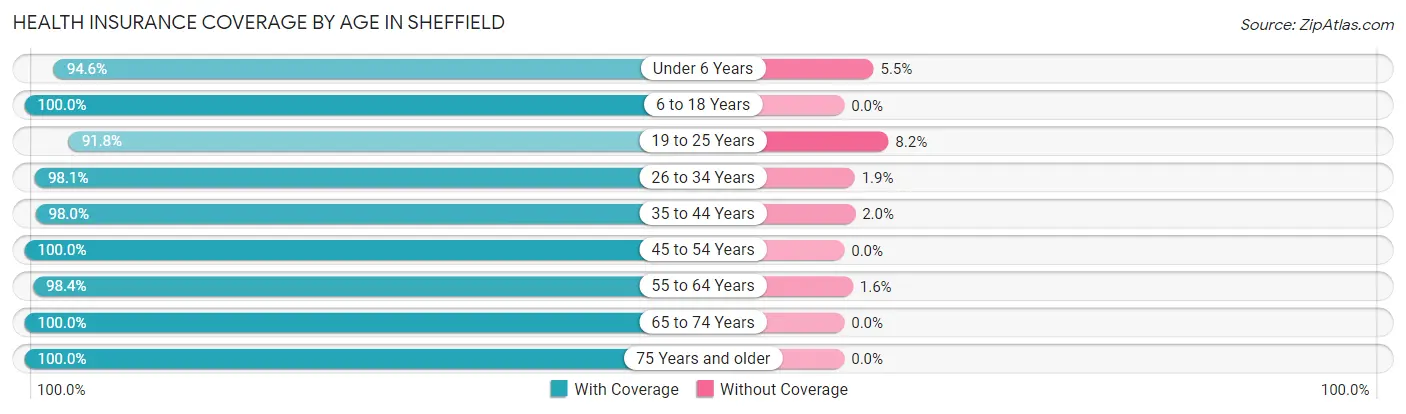
| Age Bracket | With Coverage | Without Coverage |
| Under 6 Years | 156 (94.6%) | 9 (5.4%) |
| 6 to 18 Years | 452 (100.0%) | 0 (0.0%) |
| 19 to 25 Years | 357 (91.8%) | 32 (8.2%) |
| 26 to 34 Years | 404 (98.1%) | 8 (1.9%) |
| 35 to 44 Years | 433 (98.0%) | 9 (2.0%) |
| 45 to 54 Years | 627 (100.0%) | 0 (0.0%) |
| 55 to 64 Years | 617 (98.4%) | 10 (1.6%) |
| 65 to 74 Years | 710 (100.0%) | 0 (0.0%) |
| 75 Years and older | 396 (100.0%) | 0 (0.0%) |
| Total | 4,152 (98.4%) | 68 (1.6%) |
Health Insurance Coverage by Citizenship Status in Sheffield
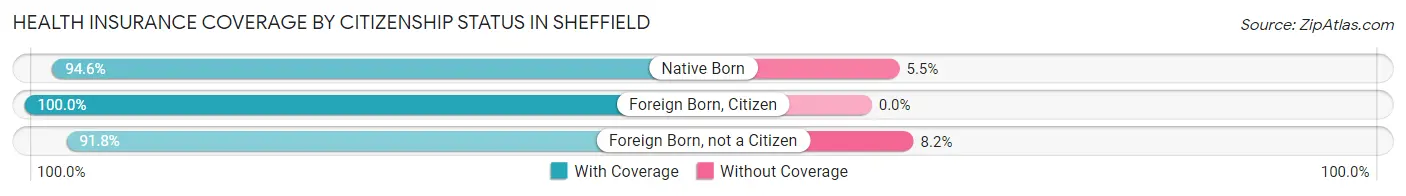
| Citizenship Status | With Coverage | Without Coverage |
| Native Born | 156 (94.6%) | 9 (5.4%) |
| Foreign Born, Citizen | 452 (100.0%) | 0 (0.0%) |
| Foreign Born, not a Citizen | 357 (91.8%) | 32 (8.2%) |
Health Insurance Coverage by Household Income in Sheffield
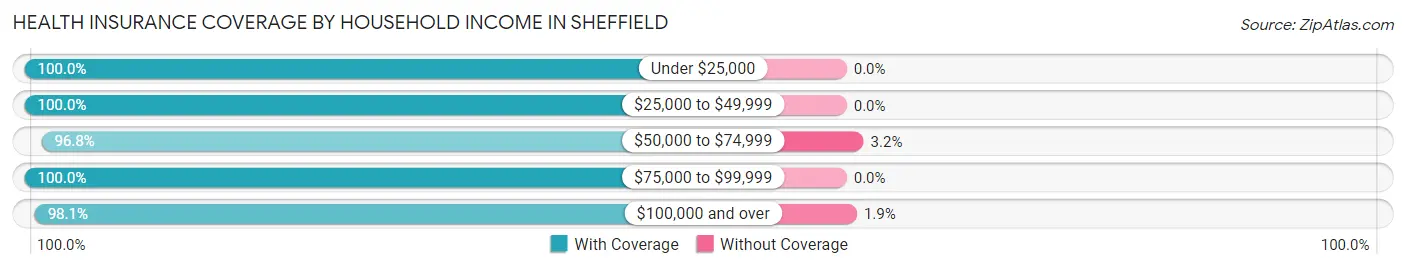
| Household Income | With Coverage | Without Coverage |
| Under $25,000 | 202 (100.0%) | 0 (0.0%) |
| $25,000 to $49,999 | 361 (100.0%) | 0 (0.0%) |
| $50,000 to $74,999 | 521 (96.8%) | 17 (3.2%) |
| $75,000 to $99,999 | 475 (100.0%) | 0 (0.0%) |
| $100,000 and over | 2,584 (98.1%) | 50 (1.9%) |
Public vs Private Health Insurance Coverage by Age in Sheffield
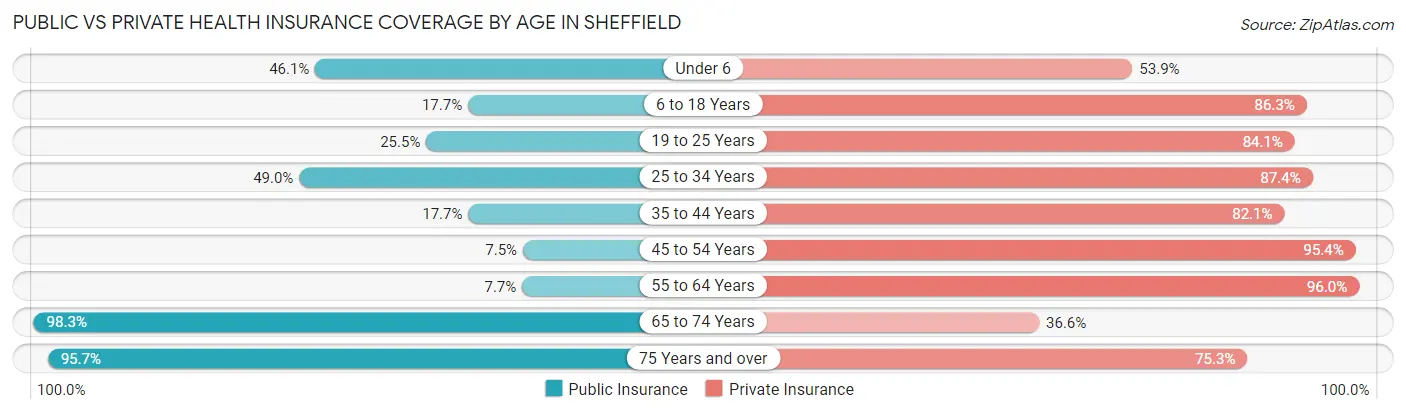
| Age Bracket | Public Insurance | Private Insurance |
| Under 6 | 76 (46.1%) | 89 (53.9%) |
| 6 to 18 Years | 80 (17.7%) | 390 (86.3%) |
| 19 to 25 Years | 99 (25.5%) | 327 (84.1%) |
| 25 to 34 Years | 202 (49.0%) | 360 (87.4%) |
| 35 to 44 Years | 78 (17.6%) | 363 (82.1%) |
| 45 to 54 Years | 47 (7.5%) | 598 (95.4%) |
| 55 to 64 Years | 48 (7.7%) | 602 (96.0%) |
| 65 to 74 Years | 698 (98.3%) | 260 (36.6%) |
| 75 Years and over | 379 (95.7%) | 298 (75.2%) |
| Total | 1,707 (40.5%) | 3,287 (77.9%) |
Disability Status by Sex by Age in Sheffield
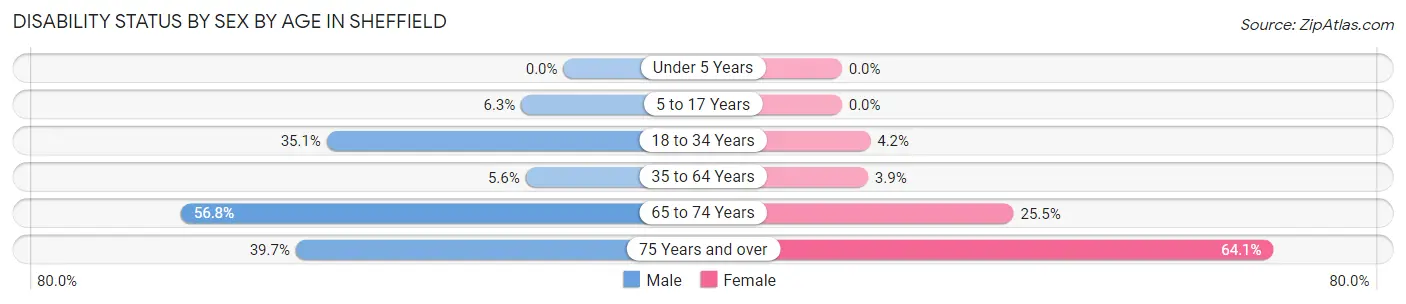
| Age Bracket | Male | Female |
| Under 5 Years | 0 (0.0%) | 0 (0.0%) |
| 5 to 17 Years | 16 (6.3%) | 0 (0.0%) |
| 18 to 34 Years | 195 (35.1%) | 11 (4.2%) |
| 35 to 64 Years | 46 (5.6%) | 34 (3.9%) |
| 65 to 74 Years | 205 (56.8%) | 89 (25.5%) |
| 75 Years and over | 60 (39.7%) | 157 (64.1%) |
Disability Class by Sex by Age in Sheffield
Disability Class: Hearing Difficulty
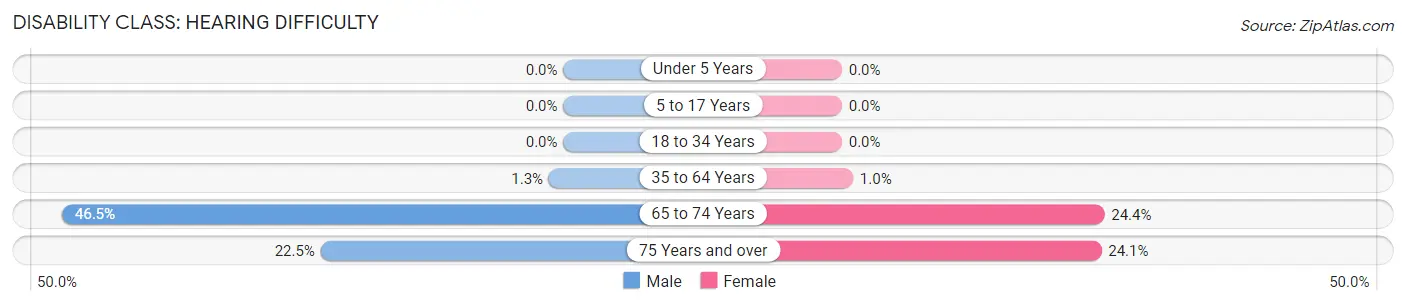
| Age Bracket | Male | Female |
| Under 5 Years | 0 (0.0%) | 0 (0.0%) |
| 5 to 17 Years | 0 (0.0%) | 0 (0.0%) |
| 18 to 34 Years | 0 (0.0%) | 0 (0.0%) |
| 35 to 64 Years | 11 (1.3%) | 9 (1.0%) |
| 65 to 74 Years | 168 (46.5%) | 85 (24.4%) |
| 75 Years and over | 34 (22.5%) | 59 (24.1%) |
Disability Class: Vision Difficulty
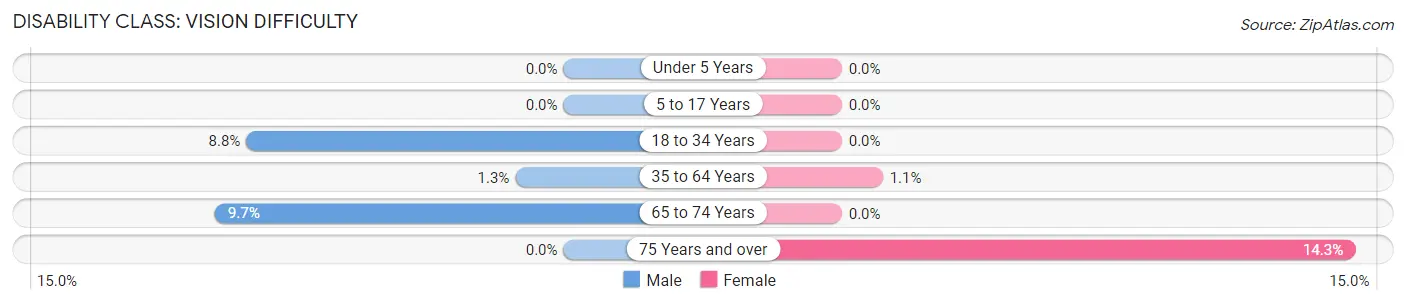
| Age Bracket | Male | Female |
| Under 5 Years | 0 (0.0%) | 0 (0.0%) |
| 5 to 17 Years | 0 (0.0%) | 0 (0.0%) |
| 18 to 34 Years | 49 (8.8%) | 0 (0.0%) |
| 35 to 64 Years | 11 (1.3%) | 10 (1.1%) |
| 65 to 74 Years | 35 (9.7%) | 0 (0.0%) |
| 75 Years and over | 0 (0.0%) | 35 (14.3%) |
Disability Class: Cognitive Difficulty
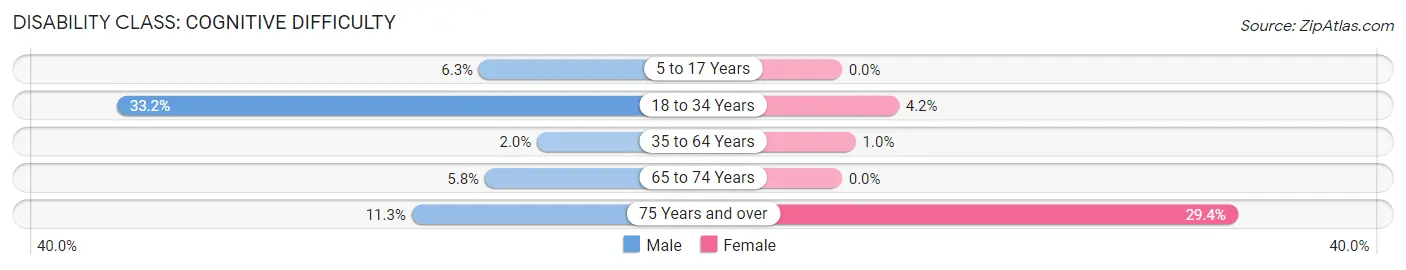
| Age Bracket | Male | Female |
| 5 to 17 Years | 16 (6.3%) | 0 (0.0%) |
| 18 to 34 Years | 184 (33.2%) | 11 (4.2%) |
| 35 to 64 Years | 16 (1.9%) | 9 (1.0%) |
| 65 to 74 Years | 21 (5.8%) | 0 (0.0%) |
| 75 Years and over | 17 (11.3%) | 72 (29.4%) |
Disability Class: Ambulatory Difficulty
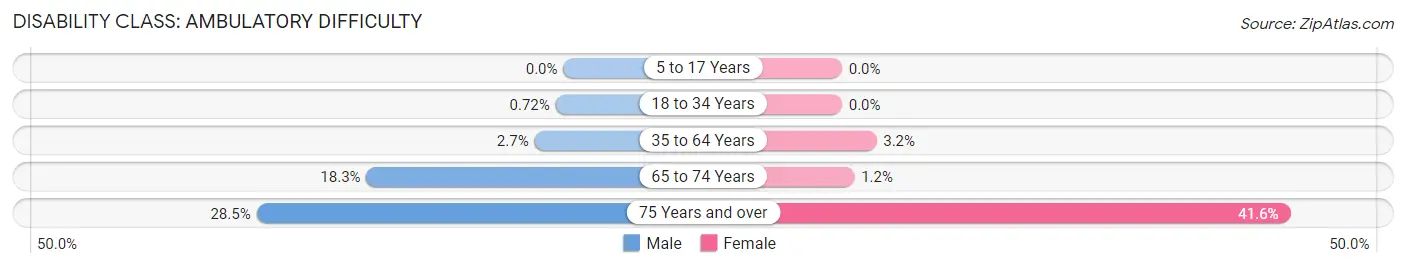
| Age Bracket | Male | Female |
| 5 to 17 Years | 0 (0.0%) | 0 (0.0%) |
| 18 to 34 Years | 4 (0.7%) | 0 (0.0%) |
| 35 to 64 Years | 22 (2.7%) | 28 (3.2%) |
| 65 to 74 Years | 66 (18.3%) | 4 (1.1%) |
| 75 Years and over | 43 (28.5%) | 102 (41.6%) |
Disability Class: Self-Care Difficulty
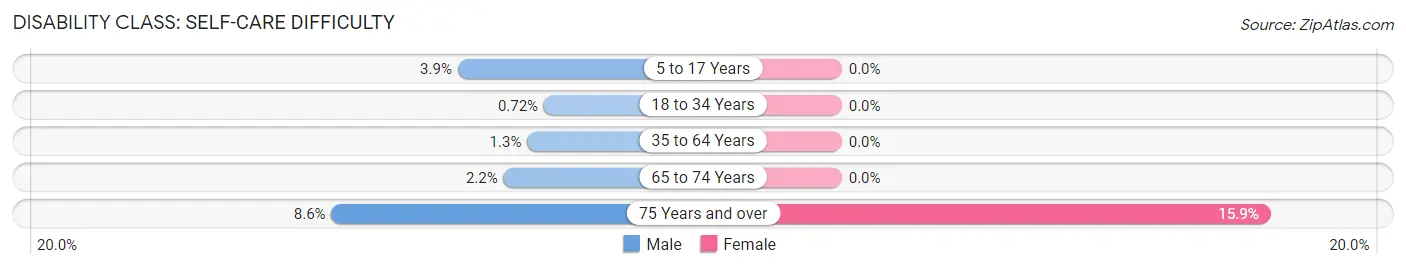
| Age Bracket | Male | Female |
| 5 to 17 Years | 10 (3.9%) | 0 (0.0%) |
| 18 to 34 Years | 4 (0.7%) | 0 (0.0%) |
| 35 to 64 Years | 11 (1.3%) | 0 (0.0%) |
| 65 to 74 Years | 8 (2.2%) | 0 (0.0%) |
| 75 Years and over | 13 (8.6%) | 39 (15.9%) |
Technology Access in Sheffield
Computing Device Access in Sheffield
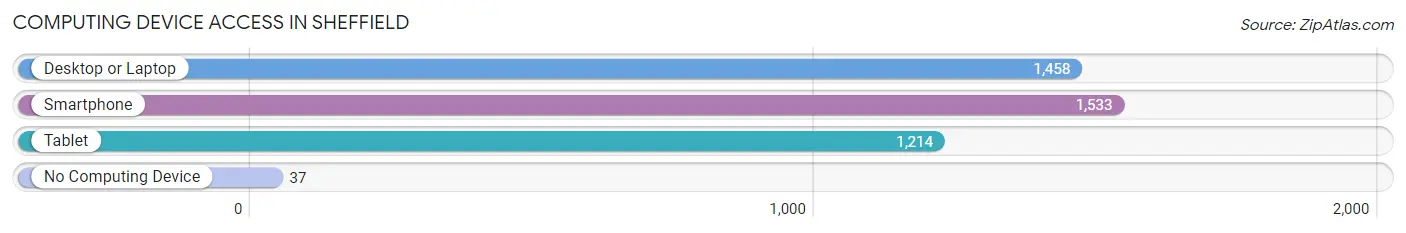
| Device Type | # Households | % Households |
| Desktop or Laptop | 1,458 | 87.8% |
| Smartphone | 1,533 | 92.3% |
| Tablet | 1,214 | 73.1% |
| No Computing Device | 37 | 2.2% |
| Total | 1,660 | 100.0% |
Internet Access in Sheffield
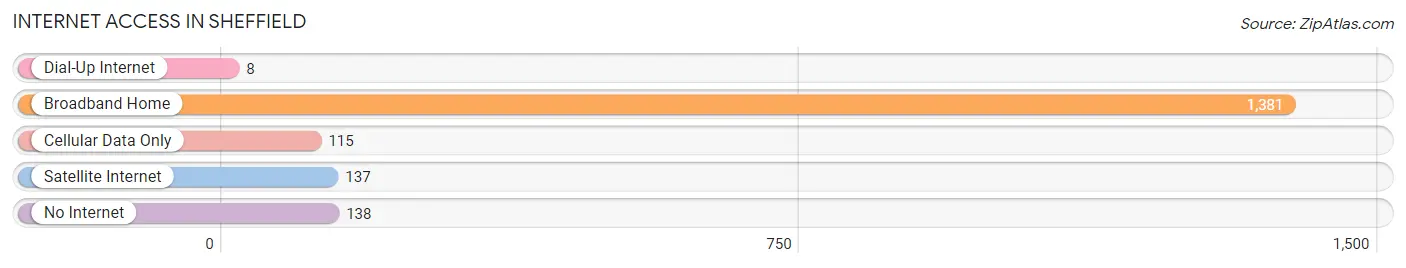
| Internet Type | # Households | % Households |
| Dial-Up Internet | 8 | 0.5% |
| Broadband Home | 1,381 | 83.2% |
| Cellular Data Only | 115 | 6.9% |
| Satellite Internet | 137 | 8.3% |
| No Internet | 138 | 8.3% |
| Total | 1,660 | 100.0% |
Sheffield Summary
Sheffield, Ohio is a small village located in Lorain County, Ohio. It is situated on the banks of the Black River, approximately 25 miles west of Cleveland. The village has a population of approximately 2,000 people and is part of the larger Sheffield-Sheffield Lake Metropolitan Statistical Area.
History
The area that is now Sheffield was first settled in 1818 by a group of settlers from Connecticut. The village was originally known as “Sheffield” after the town of Sheffield, England. The village was officially incorporated in 1837.
In the late 19th century, Sheffield was a major center for the production of steel. The village was home to several steel mills, including the Sheffield Steel Company, which was founded in 1883. The steel industry was a major employer in the village and provided many jobs for the local population.
The steel industry declined in the early 20th century, and the village’s economy shifted to other industries, such as manufacturing and agriculture. The village also became a popular tourist destination, with many visitors coming to enjoy the Black River and the nearby Lake Erie.
Geography
Sheffield is located in Lorain County, Ohio, approximately 25 miles west of Cleveland. The village is situated on the banks of the Black River, which flows through the village and into Lake Erie. The village is surrounded by rolling hills and farmland.
The village has a total area of 1.2 square miles, all of which is land. The village is located at an elevation of 845 feet above sea level.
Economy
The economy of Sheffield is largely based on manufacturing and agriculture. The village is home to several manufacturing companies, including the Sheffield Steel Company, which produces steel products. The village is also home to several agricultural businesses, including dairy farms and fruit orchards.
The village is also home to several small businesses, including restaurants, retail stores, and service providers. The village is also home to several tourist attractions, including the Black River and the nearby Lake Erie.
Demographics
As of the 2010 census, the population of Sheffield was 2,000 people. The racial makeup of the village was 97.5% White, 0.5% African American, 0.3% Native American, 0.2% Asian, and 1.5% from other races. Hispanic or Latino of any race were 1.2% of the population.
The median household income in Sheffield was $45,000, and the median family income was $50,000. The per capita income in the village was $20,000. Approximately 10.5% of the population was below the poverty line.
Conclusion
Sheffield, Ohio is a small village located in Lorain County, Ohio. It is situated on the banks of the Black River, approximately 25 miles west of Cleveland. The village has a population of approximately 2,000 people and is part of the larger Sheffield-Sheffield Lake Metropolitan Statistical Area. The economy of Sheffield is largely based on manufacturing and agriculture, and the village is home to several tourist attractions, including the Black River and the nearby Lake Erie. The racial makeup of the village is predominantly White, with a small percentage of African American, Native American, and Asian residents. The median household income in Sheffield is $45,000, and the per capita income is $20,000.
Common Questions
What is Per Capita Income in Sheffield?
Per Capita income in Sheffield is $47,265.
What is the Median Family Income in Sheffield?
Median Family Income in Sheffield is $109,046.
What is the Median Household income in Sheffield?
Median Household Income in Sheffield is $101,173.
What is Income or Wage Gap in Sheffield?
Income or Wage Gap in Sheffield is 15.2%.
Women in Sheffield earn 84.8 cents for every dollar earned by a man.
What is Inequality or Gini Index in Sheffield?
Inequality or Gini Index in Sheffield is 0.37.
What is the Total Population of Sheffield?
Total Population of Sheffield is 4,225.
What is the Total Male Population of Sheffield?
Total Male Population of Sheffield is 2,181.
What is the Total Female Population of Sheffield?
Total Female Population of Sheffield is 2,044.
What is the Ratio of Males per 100 Females in Sheffield?
There are 106.70 Males per 100 Females in Sheffield.
What is the Ratio of Females per 100 Males in Sheffield?
There are 93.72 Females per 100 Males in Sheffield.
What is the Median Population Age in Sheffield?
Median Population Age in Sheffield is 49.5 Years.
What is the Average Family Size in Sheffield
Average Family Size in Sheffield is 2.9 People.
What is the Average Household Size in Sheffield
Average Household Size in Sheffield is 2.5 People.
How Large is the Labor Force in Sheffield?
There are 2,140 People in the Labor Forcein in Sheffield.
What is the Percentage of People in the Labor Force in Sheffield?
58.1% of People are in the Labor Force in Sheffield.
What is the Unemployment Rate in Sheffield?
Unemployment Rate in Sheffield is 2.4%.