Cities with the Highest Inequality / Gini Index in Ohio
RELATED REPORTS & OPTIONS
Highest Inequality / Gini Index
Ohio
Compare Cities
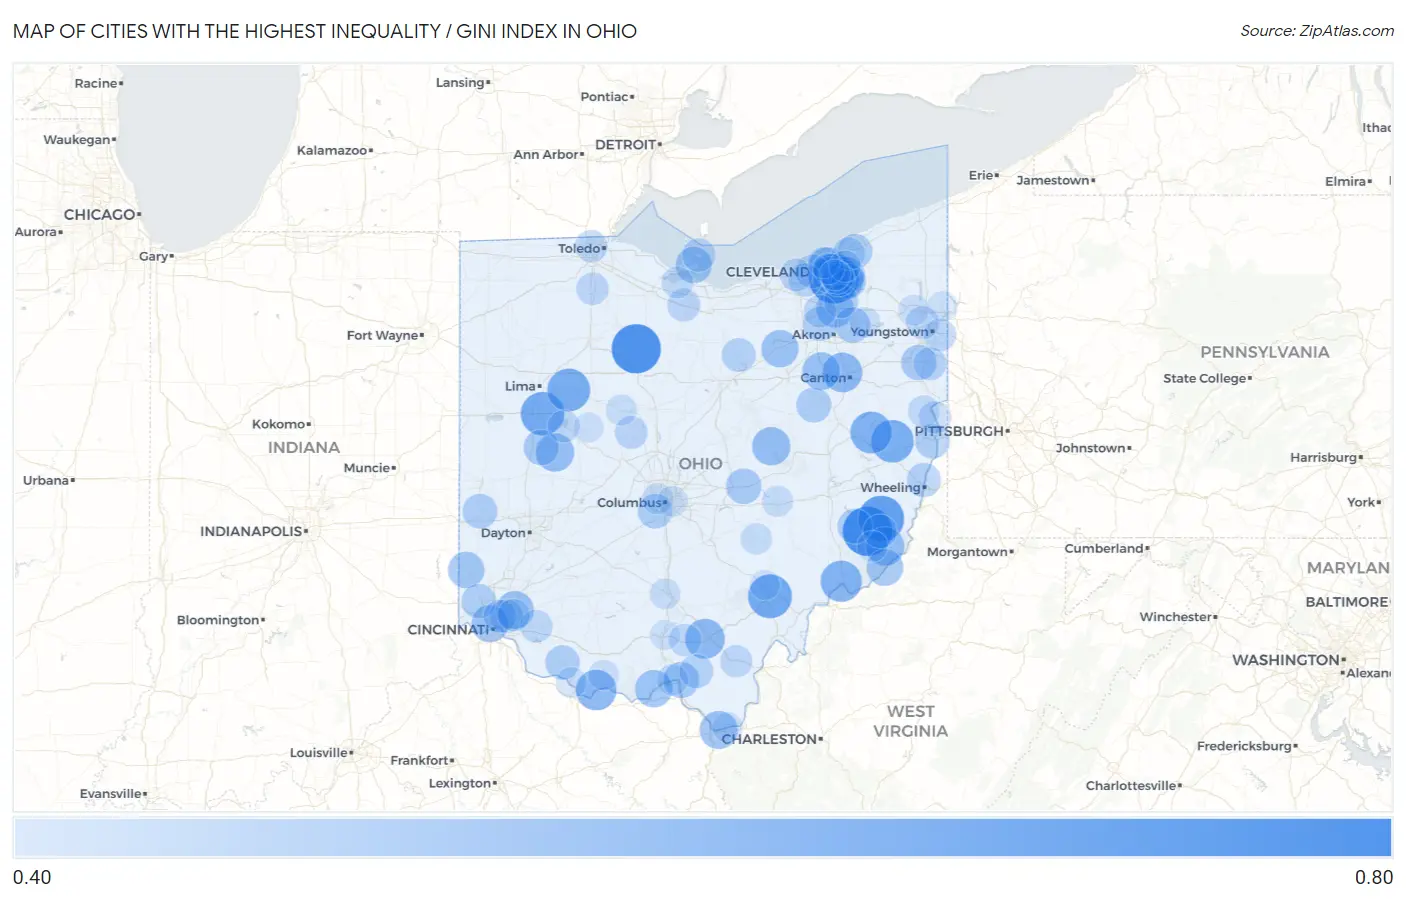
Map of Cities with the Highest Inequality / Gini Index in Ohio
0.00
0.80
Cities with the Highest Inequality / Gini Index in Ohio
| City | Inequality / Gini Index | vs State | vs National | |
| 1. | Highland Hills | 0.64 | 0.47(+0.176)#1 | 0.48(+0.159)#189 |
| 2. | Lewisville | 0.64 | 0.47(+0.174)#2 | 0.48(+0.158)#194 |
| 3. | Mccutchenville | 0.64 | 0.47(+0.173)#3 | 0.48(+0.156)#198 |
| 4. | Jerusalem | 0.61 | 0.47(+0.146)#4 | 0.48(+0.130)#318 |
| 5. | Athens | 0.60 | 0.47(+0.130)#5 | 0.48(+0.114)#451 |
| 6. | St Johns | 0.59 | 0.47(+0.127)#6 | 0.48(+0.111)#473 |
| 7. | Alger | 0.59 | 0.47(+0.122)#7 | 0.48(+0.106)#525 |
| 8. | Jewett | 0.59 | 0.47(+0.119)#8 | 0.48(+0.103)#562 |
| 9. | Bowerston | 0.58 | 0.47(+0.113)#9 | 0.48(+0.096)#627 |
| 10. | Marietta | 0.58 | 0.47(+0.109)#10 | 0.48(+0.092)#684 |
| 11. | Manchester | 0.57 | 0.47(+0.104)#11 | 0.48(+0.087)#756 |
| 12. | Bidwell | 0.57 | 0.47(+0.101)#12 | 0.48(+0.084)#801 |
| 13. | Jackson | 0.56 | 0.47(+0.097)#13 | 0.48(+0.080)#864 |
| 14. | Hills And Dales | 0.56 | 0.47(+0.096)#14 | 0.48(+0.080)#875 |
| 15. | Moreland Hills | 0.56 | 0.47(+0.094)#15 | 0.48(+0.078)#912 |
| 16. | Antioch | 0.56 | 0.47(+0.089)#16 | 0.48(+0.073)#1,014 |
| 17. | Quincy | 0.55 | 0.47(+0.087)#17 | 0.48(+0.071)#1,061 |
| 18. | Nellie | 0.55 | 0.47(+0.086)#18 | 0.48(+0.069)#1,101 |
| 19. | Burlington | 0.55 | 0.47(+0.083)#19 | 0.48(+0.067)#1,146 |
| 20. | East Cleveland | 0.55 | 0.47(+0.083)#20 | 0.48(+0.066)#1,156 |
| 21. | Remington | 0.55 | 0.47(+0.081)#21 | 0.48(+0.065)#1,199 |
| 22. | North Lawrence | 0.55 | 0.47(+0.081)#22 | 0.48(+0.065)#1,207 |
| 23. | Boston Heights | 0.55 | 0.47(+0.079)#23 | 0.48(+0.063)#1,239 |
| 24. | Friendship | 0.55 | 0.47(+0.079)#24 | 0.48(+0.062)#1,252 |
| 25. | Burbank | 0.54 | 0.47(+0.078)#25 | 0.48(+0.061)#1,283 |
| 26. | Cincinnati | 0.54 | 0.47(+0.076)#26 | 0.48(+0.060)#1,321 |
| 27. | Hunting Valley | 0.54 | 0.47(+0.075)#27 | 0.48(+0.058)#1,369 |
| 28. | Matamoras | 0.54 | 0.47(+0.073)#28 | 0.48(+0.056)#1,409 |
| 29. | Oxford | 0.54 | 0.47(+0.071)#29 | 0.48(+0.054)#1,472 |
| 30. | Lakeside | 0.54 | 0.47(+0.070)#30 | 0.48(+0.054)#1,482 |
| 31. | West Logan | 0.54 | 0.47(+0.070)#31 | 0.48(+0.053)#1,501 |
| 32. | Shaker Heights | 0.54 | 0.47(+0.069)#32 | 0.48(+0.052)#1,530 |
| 33. | Sciotodale | 0.53 | 0.47(+0.067)#33 | 0.48(+0.050)#1,595 |
| 34. | East Alliance | 0.53 | 0.47(+0.066)#34 | 0.48(+0.050)#1,612 |
| 35. | Kent | 0.53 | 0.47(+0.064)#35 | 0.48(+0.048)#1,672 |
| 36. | Washingtonville | 0.53 | 0.47(+0.064)#36 | 0.48(+0.048)#1,676 |
| 37. | Port Jefferson | 0.53 | 0.47(+0.064)#37 | 0.48(+0.047)#1,688 |
| 38. | Marne | 0.53 | 0.47(+0.063)#38 | 0.48(+0.047)#1,711 |
| 39. | Winesburg | 0.53 | 0.47(+0.060)#39 | 0.48(+0.043)#1,853 |
| 40. | Summerfield | 0.53 | 0.47(+0.060)#40 | 0.48(+0.043)#1,854 |
| 41. | Kirtland Hills | 0.53 | 0.47(+0.059)#41 | 0.48(+0.042)#1,893 |
| 42. | West Manchester | 0.52 | 0.47(+0.058)#42 | 0.48(+0.041)#1,920 |
| 43. | Urbancrest | 0.52 | 0.47(+0.058)#43 | 0.48(+0.041)#1,934 |
| 44. | Chagrin Falls | 0.52 | 0.47(+0.057)#44 | 0.48(+0.040)#1,958 |
| 45. | Dunlap | 0.52 | 0.47(+0.056)#45 | 0.48(+0.039)#1,985 |
| 46. | Steubenville | 0.52 | 0.47(+0.055)#46 | 0.48(+0.038)#2,027 |
| 47. | Georgetown | 0.52 | 0.47(+0.055)#47 | 0.48(+0.038)#2,034 |
| 48. | Montrose Ghent | 0.52 | 0.47(+0.054)#48 | 0.48(+0.038)#2,069 |
| 49. | Martins Ferry | 0.52 | 0.47(+0.054)#49 | 0.48(+0.037)#2,093 |
| 50. | Bailey Lakes | 0.52 | 0.47(+0.051)#50 | 0.48(+0.034)#2,205 |
| 51. | South Webster | 0.52 | 0.47(+0.051)#51 | 0.48(+0.034)#2,214 |
| 52. | Silverton | 0.52 | 0.47(+0.051)#52 | 0.48(+0.034)#2,224 |
| 53. | Twinsburg Heights | 0.52 | 0.47(+0.051)#53 | 0.48(+0.034)#2,227 |
| 54. | Woodsfield | 0.52 | 0.47(+0.049)#54 | 0.48(+0.033)#2,277 |
| 55. | Cleveland | 0.52 | 0.47(+0.049)#55 | 0.48(+0.032)#2,311 |
| 56. | Kelleys Island | 0.51 | 0.47(+0.047)#56 | 0.48(+0.030)#2,388 |
| 57. | Linndale | 0.51 | 0.47(+0.047)#57 | 0.48(+0.030)#2,400 |
| 58. | Columbiana | 0.51 | 0.47(+0.045)#58 | 0.48(+0.028)#2,491 |
| 59. | Golf Manor | 0.51 | 0.47(+0.044)#59 | 0.48(+0.028)#2,502 |
| 60. | Bellevue | 0.51 | 0.47(+0.043)#60 | 0.48(+0.027)#2,569 |
| 61. | Richwood | 0.51 | 0.47(+0.043)#61 | 0.48(+0.026)#2,582 |
| 62. | Hilltop | 0.51 | 0.47(+0.042)#62 | 0.48(+0.026)#2,614 |
| 63. | Rocky River | 0.51 | 0.47(+0.042)#63 | 0.48(+0.026)#2,622 |
| 64. | Orange | 0.51 | 0.47(+0.042)#64 | 0.48(+0.026)#2,626 |
| 65. | Waite Hill | 0.51 | 0.47(+0.042)#65 | 0.48(+0.025)#2,643 |
| 66. | Richfield | 0.51 | 0.47(+0.042)#66 | 0.48(+0.025)#2,655 |
| 67. | Owensville | 0.51 | 0.47(+0.041)#67 | 0.48(+0.025)#2,672 |
| 68. | Woodmere | 0.51 | 0.47(+0.041)#68 | 0.48(+0.024)#2,702 |
| 69. | Beaver | 0.51 | 0.47(+0.041)#69 | 0.48(+0.024)#2,710 |
| 70. | Bowling Green | 0.51 | 0.47(+0.040)#70 | 0.48(+0.024)#2,723 |
| 71. | Campbell | 0.51 | 0.47(+0.040)#71 | 0.48(+0.024)#2,724 |
| 72. | Rio Grande | 0.51 | 0.47(+0.039)#72 | 0.48(+0.023)#2,773 |
| 73. | The Village Of Indian Hill | 0.51 | 0.47(+0.039)#73 | 0.48(+0.022)#2,820 |
| 74. | Stratton | 0.51 | 0.47(+0.039)#74 | 0.48(+0.022)#2,826 |
| 75. | Ottawa Hills | 0.50 | 0.47(+0.038)#75 | 0.48(+0.022)#2,836 |
| 76. | Russells Point | 0.50 | 0.47(+0.038)#76 | 0.48(+0.021)#2,887 |
| 77. | Irondale | 0.50 | 0.47(+0.036)#77 | 0.48(+0.019)#2,980 |
| 78. | Whites Landing | 0.50 | 0.47(+0.035)#78 | 0.48(+0.019)#3,004 |
| 79. | Bratenahl | 0.50 | 0.47(+0.034)#79 | 0.48(+0.017)#3,075 |
| 80. | Portsmouth | 0.50 | 0.47(+0.033)#80 | 0.48(+0.016)#3,158 |
| 81. | Gates Mills | 0.50 | 0.47(+0.032)#81 | 0.48(+0.016)#3,179 |
| 82. | New Lexington | 0.50 | 0.47(+0.032)#82 | 0.48(+0.015)#3,194 |
| 83. | Marble Cliff | 0.50 | 0.47(+0.030)#83 | 0.48(+0.014)#3,278 |
| 84. | Zanesville | 0.50 | 0.47(+0.030)#84 | 0.48(+0.013)#3,304 |
| 85. | La Rue | 0.50 | 0.47(+0.029)#85 | 0.48(+0.013)#3,366 |
| 86. | Cleveland Heights | 0.49 | 0.47(+0.028)#86 | 0.48(+0.012)#3,415 |
| 87. | Graysville | 0.49 | 0.47(+0.028)#87 | 0.48(+0.011)#3,455 |
| 88. | Ripley | 0.49 | 0.47(+0.027)#88 | 0.48(+0.011)#3,468 |
| 89. | South Mount Vernon | 0.49 | 0.47(+0.027)#89 | 0.48(+0.011)#3,501 |
| 90. | Beachwood | 0.49 | 0.47(+0.027)#90 | 0.48(+0.010)#3,504 |
| 91. | Chillicothe | 0.49 | 0.47(+0.027)#91 | 0.48(+0.010)#3,510 |
| 92. | Ravenna | 0.49 | 0.47(+0.027)#92 | 0.48(+0.010)#3,511 |
| 93. | Warren | 0.49 | 0.47(+0.027)#93 | 0.48(+0.010)#3,528 |
| 94. | West Union | 0.49 | 0.47(+0.026)#94 | 0.48(+0.010)#3,572 |
| 95. | Bexley | 0.49 | 0.47(+0.026)#95 | 0.48(+0.009)#3,584 |
| 96. | Chesapeake | 0.49 | 0.47(+0.025)#96 | 0.48(+0.009)#3,633 |
| 97. | Yankee Lake | 0.49 | 0.47(+0.024)#97 | 0.48(+0.007)#3,724 |
| 98. | Chauncey | 0.49 | 0.47(+0.023)#98 | 0.48(+0.007)#3,741 |
| 99. | Piketon | 0.49 | 0.47(+0.023)#99 | 0.48(+0.007)#3,756 |
| 100. | Rushsylvania | 0.49 | 0.47(+0.023)#100 | 0.48(+0.006)#3,781 |
Common Questions
What are the Top 10 Cities with the Highest Inequality / Gini Index in Ohio?
Top 10 Cities with the Highest Inequality / Gini Index in Ohio are:
#1
0.64
#2
0.64
#3
0.64
#4
0.61
#5
0.60
#6
0.59
#7
0.59
#8
0.59
#9
0.58
#10
0.58
What city has the Highest Inequality / Gini Index in Ohio?
Highland Hills has the Highest Inequality / Gini Index in Ohio with 0.64.
What is the Inequality / Gini Index in the State of Ohio?
Inequality / Gini Index in Ohio is 0.47.
What is the Inequality / Gini Index in the United States?
Inequality / Gini Index in the United States is 0.48.