South Solon, OH Map & Demographics
South Solon Map
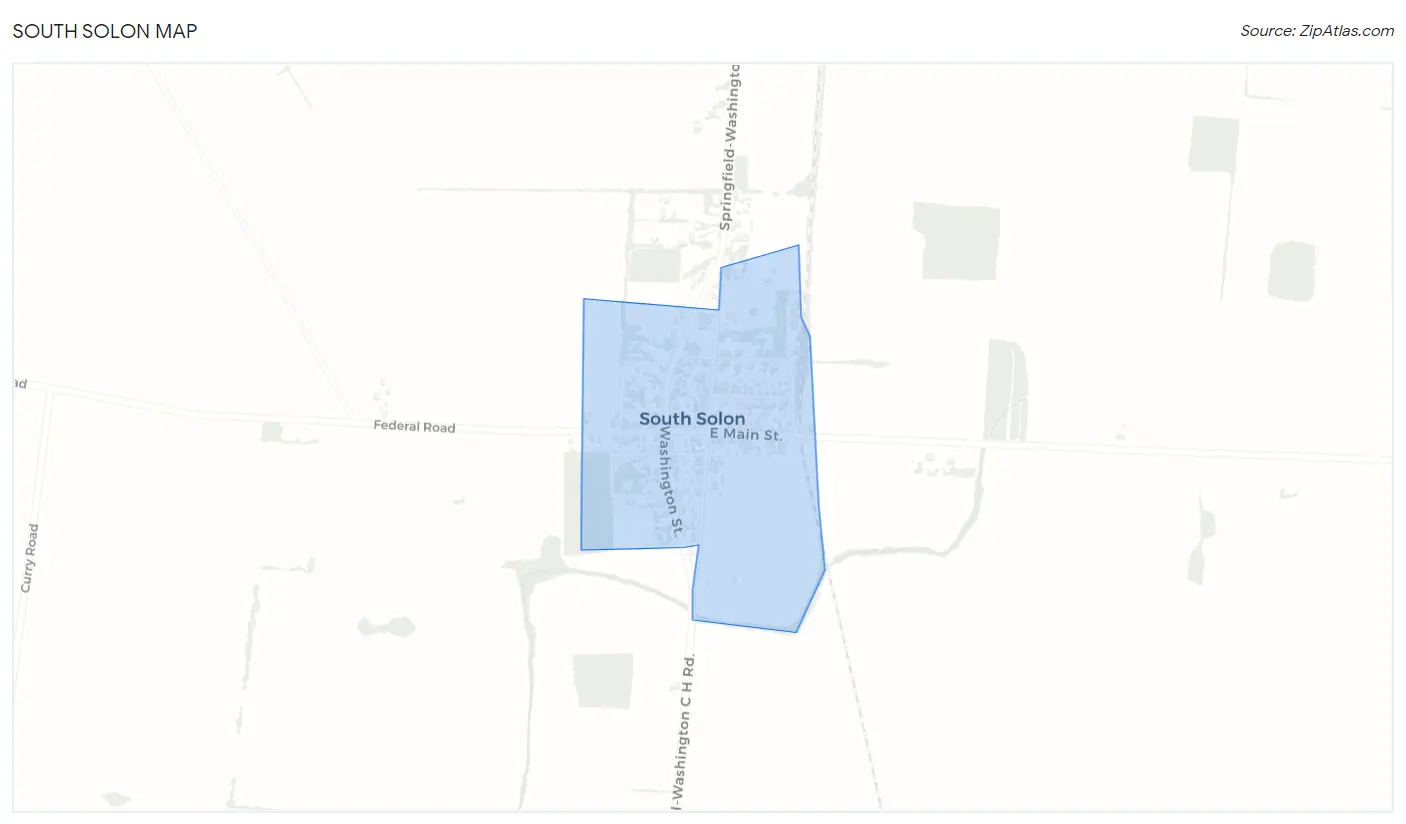
South Solon Overview
$28,709
PER CAPITA INCOME
$78,000
AVG FAMILY INCOME
$56,563
AVG HOUSEHOLD INCOME
0.36
INEQUALITY / GINI INDEX
385
TOTAL POPULATION
195
MALE POPULATION
190
FEMALE POPULATION
102.63
MALES / 100 FEMALES
97.44
FEMALES / 100 MALES
39.8
MEDIAN AGE
3.2
AVG FAMILY SIZE
2.8
AVG HOUSEHOLD SIZE
182
LABOR FORCE [ PEOPLE ]
61.9%
PERCENT IN LABOR FORCE
4.9%
UNEMPLOYMENT RATE
South Solon Zip Codes
Income in South Solon
Income Overview in South Solon
Per Capita Income in South Solon is $28,709, while median incomes of families and households are $78,000 and $56,563 respectively.
| Characteristic | Number | Measure |
| Per Capita Income | 385 | $28,709 |
| Median Family Income | 106 | $78,000 |
| Mean Family Income | 106 | $84,468 |
| Median Household Income | 136 | $56,563 |
| Mean Household Income | 136 | $78,175 |
| Income Deficit | 106 | $0 |
| Wage / Income Gap (%) | 385 | 0.00% |
| Wage / Income Gap ($) | 385 | 100.00¢ per $1 |
| Gini / Inequality Index | 385 | 0.36 |
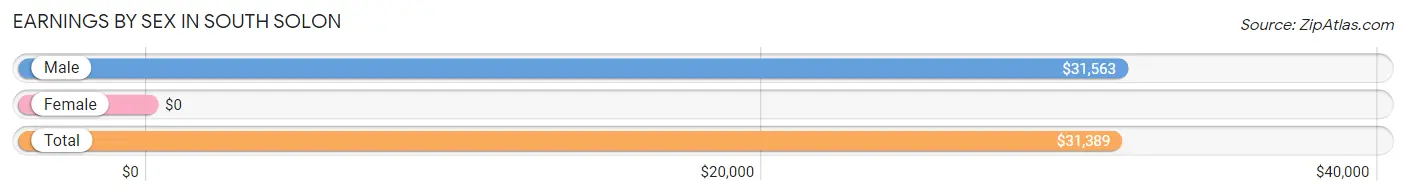
Earnings by Sex in South Solon
| Sex | Number | Average Earnings |
| Male | 131 (60.1%) | $31,563 |
| Female | 87 (39.9%) | $0 |
| Total | 218 (100.0%) | $31,389 |
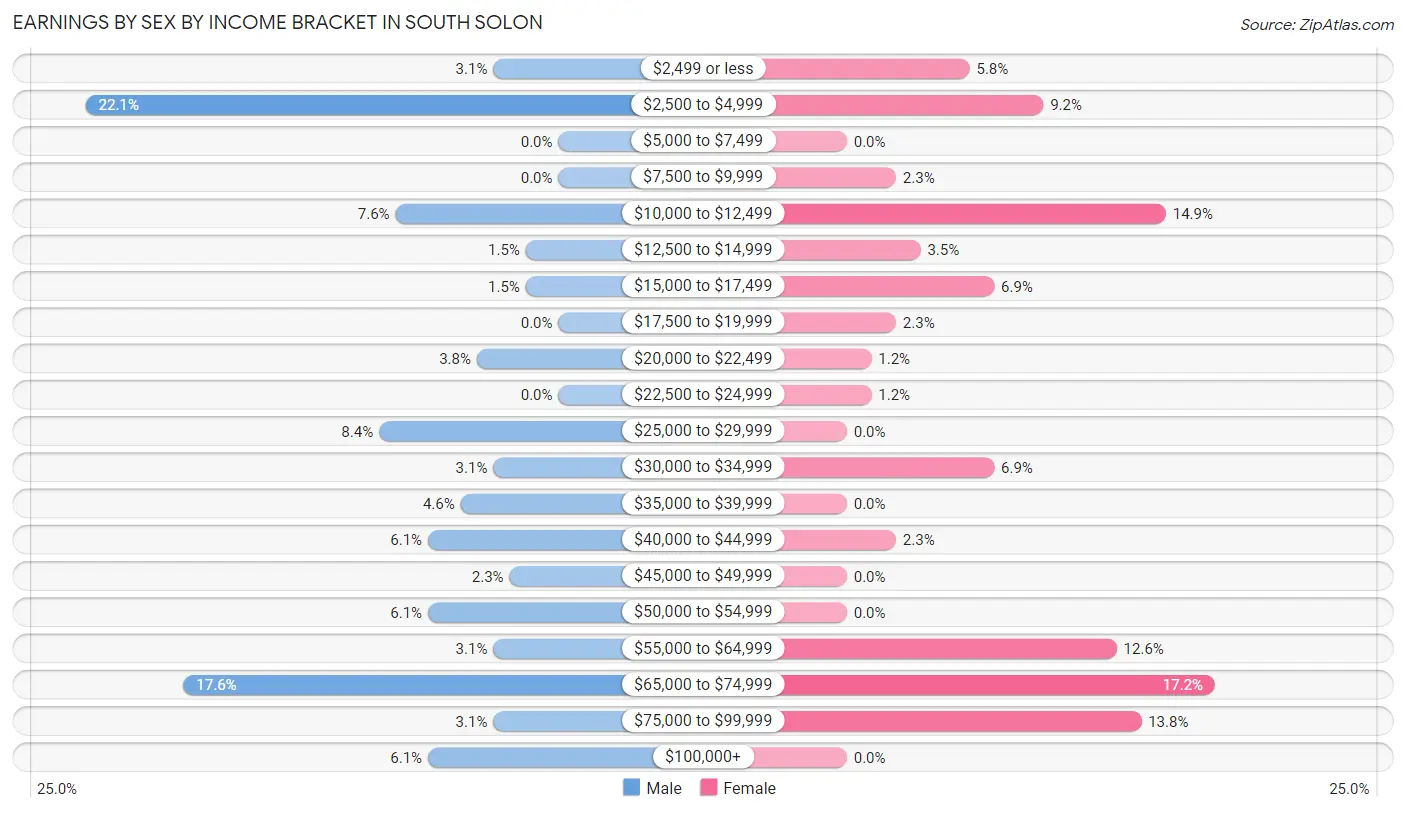
Earnings by Sex by Income Bracket in South Solon
The most common earnings brackets in South Solon are $2,500 to $4,999 for men (29 | 22.1%) and $65,000 to $74,999 for women (15 | 17.2%).
| Income | Male | Female |
| $2,499 or less | 4 (3.0%) | 5 (5.8%) |
| $2,500 to $4,999 | 29 (22.1%) | 8 (9.2%) |
| $5,000 to $7,499 | 0 (0.0%) | 0 (0.0%) |
| $7,500 to $9,999 | 0 (0.0%) | 2 (2.3%) |
| $10,000 to $12,499 | 10 (7.6%) | 13 (14.9%) |
| $12,500 to $14,999 | 2 (1.5%) | 3 (3.5%) |
| $15,000 to $17,499 | 2 (1.5%) | 6 (6.9%) |
| $17,500 to $19,999 | 0 (0.0%) | 2 (2.3%) |
| $20,000 to $22,499 | 5 (3.8%) | 1 (1.1%) |
| $22,500 to $24,999 | 0 (0.0%) | 1 (1.1%) |
| $25,000 to $29,999 | 11 (8.4%) | 0 (0.0%) |
| $30,000 to $34,999 | 4 (3.0%) | 6 (6.9%) |
| $35,000 to $39,999 | 6 (4.6%) | 0 (0.0%) |
| $40,000 to $44,999 | 8 (6.1%) | 2 (2.3%) |
| $45,000 to $49,999 | 3 (2.3%) | 0 (0.0%) |
| $50,000 to $54,999 | 8 (6.1%) | 0 (0.0%) |
| $55,000 to $64,999 | 4 (3.0%) | 11 (12.6%) |
| $65,000 to $74,999 | 23 (17.6%) | 15 (17.2%) |
| $75,000 to $99,999 | 4 (3.0%) | 12 (13.8%) |
| $100,000+ | 8 (6.1%) | 0 (0.0%) |
| Total | 131 (100.0%) | 87 (100.0%) |
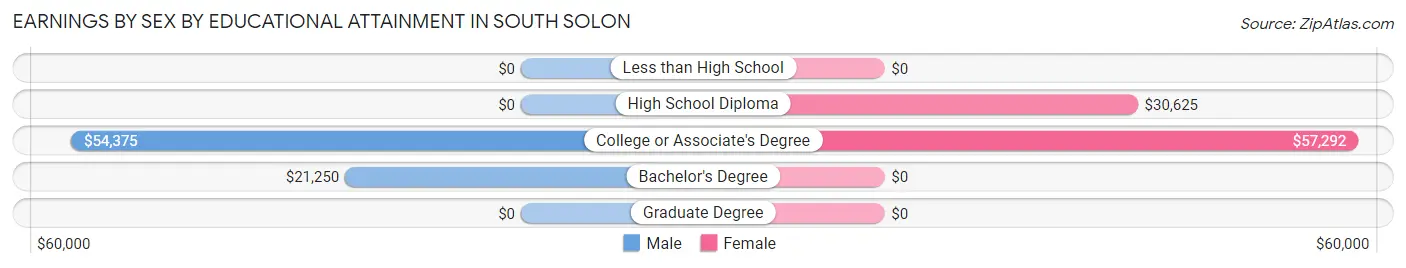
Earnings by Sex by Educational Attainment in South Solon
Average earnings in South Solon are $35,625 for men and $55,625 for women, a difference of 36.0%. Men with an educational attainment of college or associate's degree enjoy the highest average annual earnings of $54,375, while those with bachelor's degree education earn the least with $21,250. Women with an educational attainment of college or associate's degree earn the most with the average annual earnings of $57,292, while those with high school diploma education have the smallest earnings of $30,625.
| Educational Attainment | Male Income | Female Income |
| Less than High School | - | - |
| High School Diploma | - | - |
| College or Associate's Degree | $54,375 | $57,292 |
| Bachelor's Degree | $21,250 | $0 |
| Graduate Degree | - | - |
| Total | $35,625 | $55,625 |
Family Income in South Solon
Family Income Brackets in South Solon
According to the South Solon family income data, there are 34 families falling into the $100,000 to $149,999 income range, which is the most common income bracket and makes up 32.1% of all families. Conversely, the less than $10,000 income bracket is the least frequent group with only 1 families (0.9%) belonging to this category.
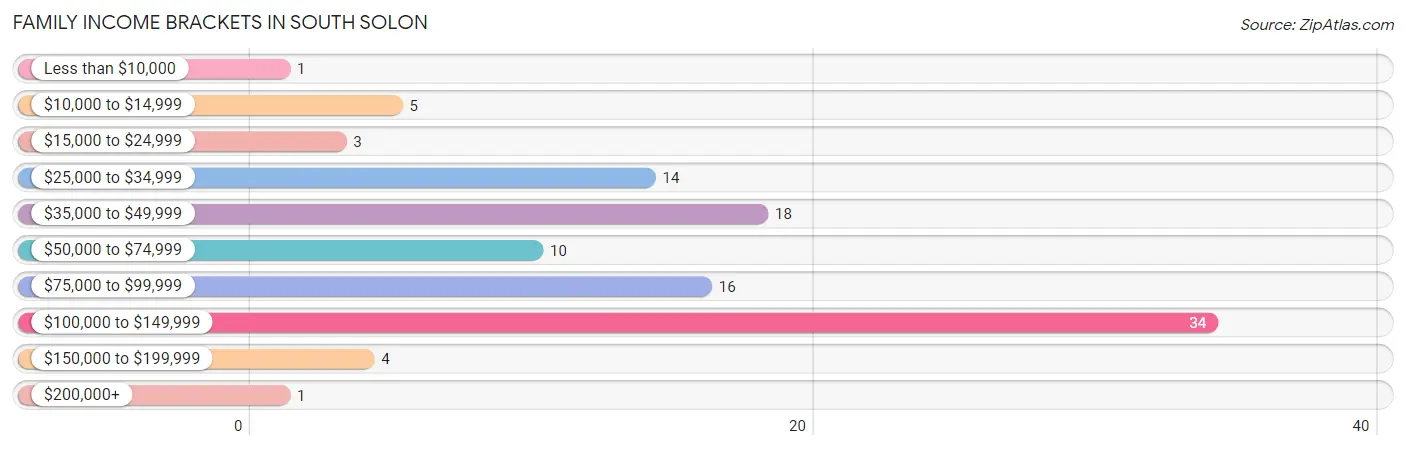
| Income Bracket | # Families | % Families |
| Less than $10,000 | 1 | 0.9% |
| $10,000 to $14,999 | 5 | 4.7% |
| $15,000 to $24,999 | 3 | 2.8% |
| $25,000 to $34,999 | 14 | 13.2% |
| $35,000 to $49,999 | 18 | 17.0% |
| $50,000 to $74,999 | 10 | 9.4% |
| $75,000 to $99,999 | 16 | 15.1% |
| $100,000 to $149,999 | 34 | 32.1% |
| $150,000 to $199,999 | 4 | 3.8% |
| $200,000+ | 1 | 0.9% |
Family Income by Famaliy Size in South Solon
2-person families (59 | 55.7%) account for the highest median family income in South Solon with $113,750 per family, while 2-person families (59 | 55.7%) have the highest median income of $56,875 per family member.
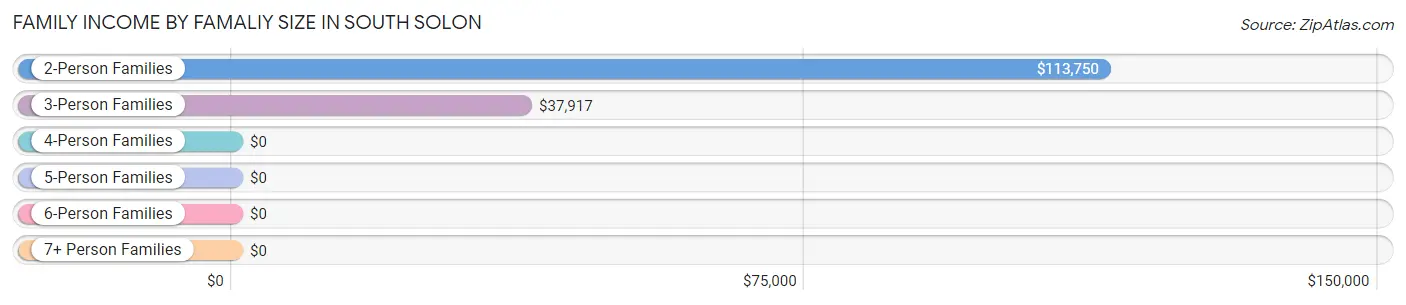
| Income Bracket | # Families | Median Income |
| 2-Person Families | 59 (55.7%) | $113,750 |
| 3-Person Families | 27 (25.5%) | $37,917 |
| 4-Person Families | 14 (13.2%) | $0 |
| 5-Person Families | 2 (1.9%) | $0 |
| 6-Person Families | 3 (2.8%) | $0 |
| 7+ Person Families | 1 (0.9%) | $0 |
| Total | 106 (100.0%) | $78,000 |
Family Income by Number of Earners in South Solon
The median family income in South Solon is $78,000, with families comprising 2 earners (52) having the highest median family income of $135,481, while families with 1 earner (33) have the lowest median family income of $34,250, accounting for 49.1% and 31.1% of families, respectively.
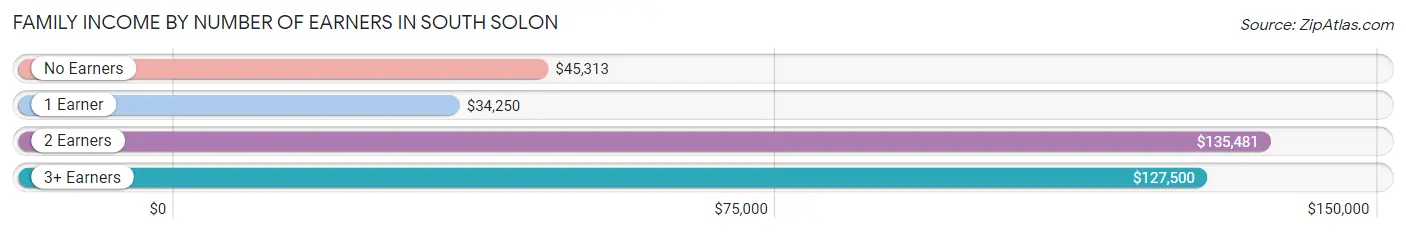
| Number of Earners | # Families | Median Income |
| No Earners | 11 (10.4%) | $45,313 |
| 1 Earner | 33 (31.1%) | $34,250 |
| 2 Earners | 52 (49.1%) | $135,481 |
| 3+ Earners | 10 (9.4%) | $127,500 |
| Total | 106 (100.0%) | $78,000 |
Household Income in South Solon
Household Income Brackets in South Solon
With 34 households falling in the category, the $100,000 to $149,999 income range is the most frequent in South Solon, accounting for 25.0% of all households. In contrast, only 1 households (0.7%) fall into the less than $10,000 income bracket, making it the least populous group.
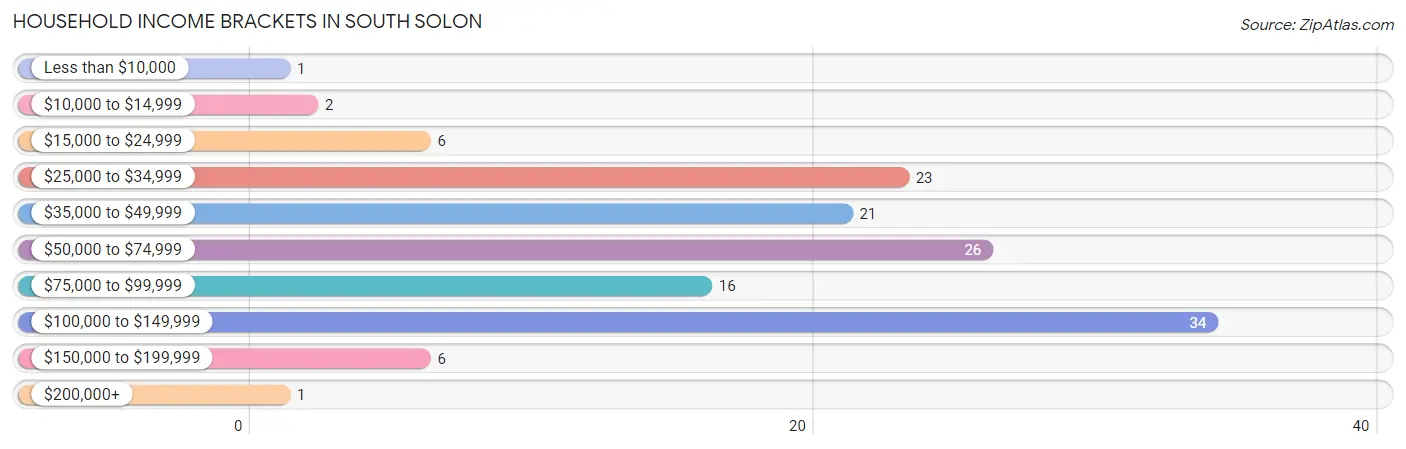
| Income Bracket | # Households | % Households |
| Less than $10,000 | 1 | 0.7% |
| $10,000 to $14,999 | 2 | 1.5% |
| $15,000 to $24,999 | 6 | 4.4% |
| $25,000 to $34,999 | 23 | 16.9% |
| $35,000 to $49,999 | 21 | 15.4% |
| $50,000 to $74,999 | 26 | 19.1% |
| $75,000 to $99,999 | 16 | 11.8% |
| $100,000 to $149,999 | 34 | 25.0% |
| $150,000 to $199,999 | 6 | 4.4% |
| $200,000+ | 1 | 0.7% |
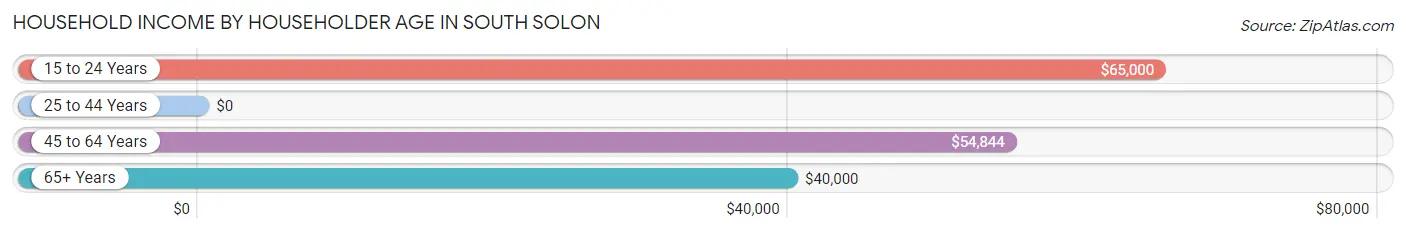
Household Income by Householder Age in South Solon
The median household income in South Solon is $56,563, with the highest median household income of $65,000 found in the 15 to 24 years age bracket for the primary householder. A total of 6 households (4.4%) fall into this category. Meanwhile, the 25 to 44 years age bracket for the primary householder has the lowest median household income of $0, with 41 households (30.1%) in this group.
| Income Bracket | # Households | Median Income |
| 15 to 24 Years | 6 (4.4%) | $65,000 |
| 25 to 44 Years | 41 (30.1%) | $0 |
| 45 to 64 Years | 71 (52.2%) | $54,844 |
| 65+ Years | 18 (13.2%) | $40,000 |
| Total | 136 (100.0%) | $56,563 |
Poverty in South Solon
Income Below Poverty by Sex and Age in South Solon
With 5.6% poverty level for males and 15.3% for females among the residents of South Solon, under 5 year old males and 5 year old females are the most vulnerable to poverty, with 3 males (27.3%) and 2 females (100.0%) in their respective age groups living below the poverty level.
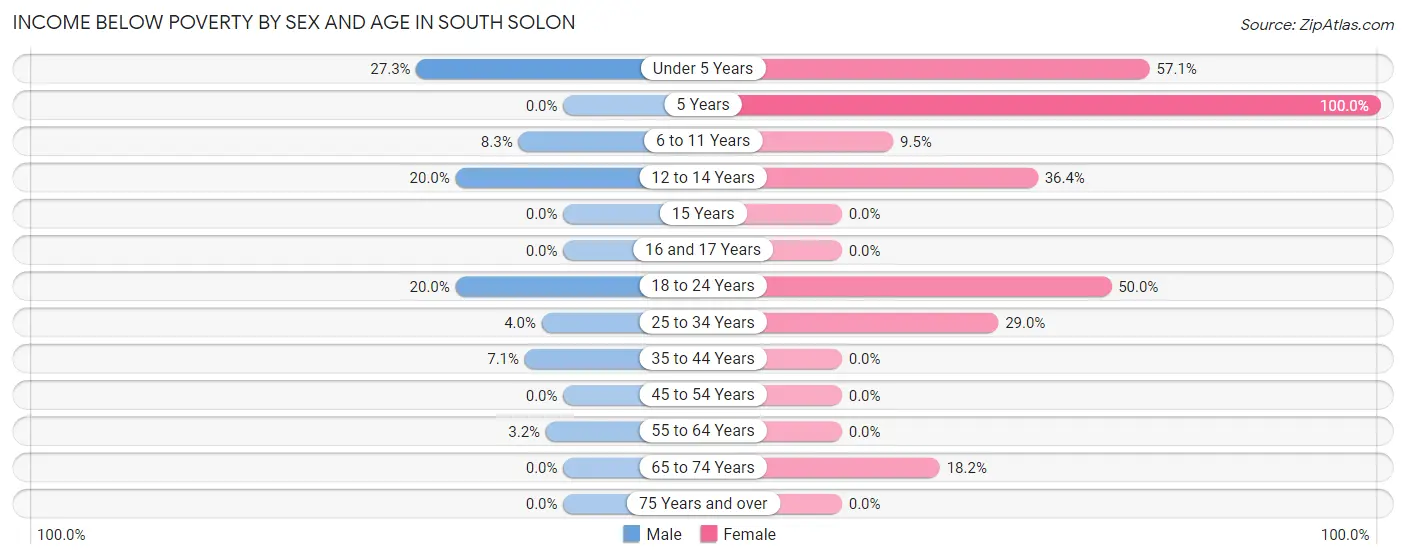
| Age Bracket | Male | Female |
| Under 5 Years | 3 (27.3%) | 4 (57.1%) |
| 5 Years | 0 (0.0%) | 2 (100.0%) |
| 6 to 11 Years | 1 (8.3%) | 4 (9.5%) |
| 12 to 14 Years | 1 (20.0%) | 4 (36.4%) |
| 15 Years | 0 (0.0%) | 0 (0.0%) |
| 16 and 17 Years | 0 (0.0%) | 0 (0.0%) |
| 18 to 24 Years | 2 (20.0%) | 4 (50.0%) |
| 25 to 34 Years | 1 (4.0%) | 9 (29.0%) |
| 35 to 44 Years | 1 (7.1%) | 0 (0.0%) |
| 45 to 54 Years | 0 (0.0%) | 0 (0.0%) |
| 55 to 64 Years | 2 (3.2%) | 0 (0.0%) |
| 65 to 74 Years | 0 (0.0%) | 2 (18.2%) |
| 75 Years and over | 0 (0.0%) | 0 (0.0%) |
| Total | 11 (5.6%) | 29 (15.3%) |
Income Above Poverty by Sex and Age in South Solon
According to the poverty statistics in South Solon, males aged 5 years and females aged 16 and 17 years are the age groups that are most secure financially, with 100.0% of males and 100.0% of females in these age groups living above the poverty line.
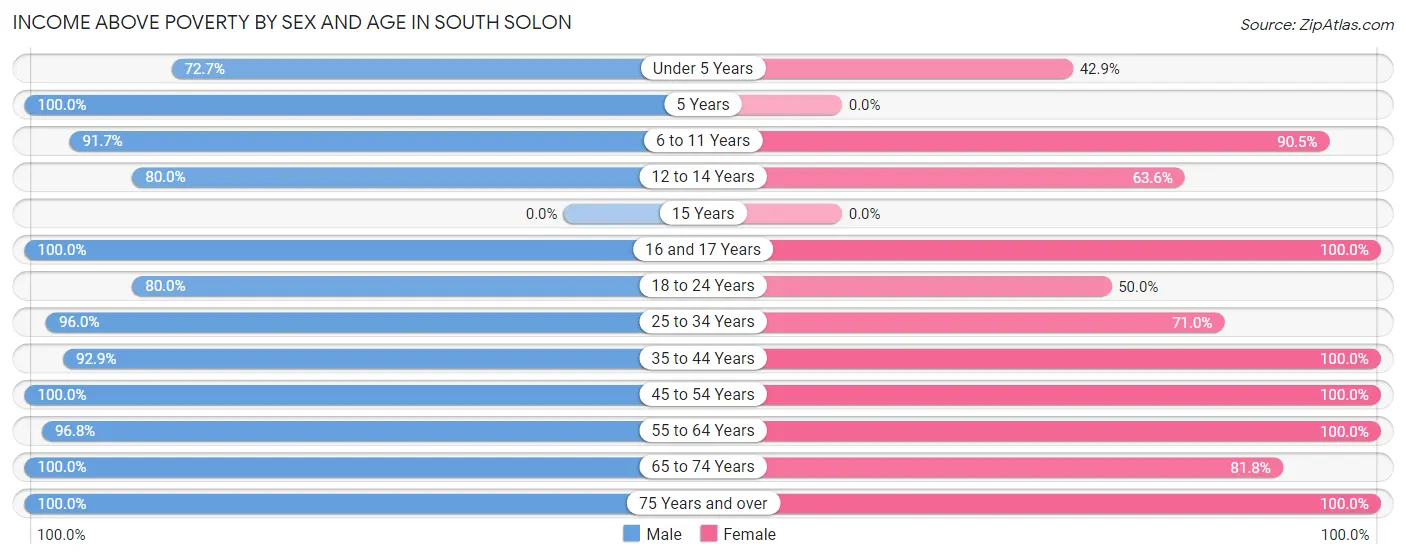
| Age Bracket | Male | Female |
| Under 5 Years | 8 (72.7%) | 3 (42.9%) |
| 5 Years | 1 (100.0%) | 0 (0.0%) |
| 6 to 11 Years | 11 (91.7%) | 38 (90.5%) |
| 12 to 14 Years | 4 (80.0%) | 7 (63.6%) |
| 15 Years | 0 (0.0%) | 0 (0.0%) |
| 16 and 17 Years | 8 (100.0%) | 6 (100.0%) |
| 18 to 24 Years | 8 (80.0%) | 4 (50.0%) |
| 25 to 34 Years | 24 (96.0%) | 22 (71.0%) |
| 35 to 44 Years | 13 (92.9%) | 11 (100.0%) |
| 45 to 54 Years | 36 (100.0%) | 34 (100.0%) |
| 55 to 64 Years | 60 (96.8%) | 19 (100.0%) |
| 65 to 74 Years | 3 (100.0%) | 9 (81.8%) |
| 75 Years and over | 8 (100.0%) | 8 (100.0%) |
| Total | 184 (94.4%) | 161 (84.7%) |
Income Below Poverty Among Married-Couple Families in South Solon
The poverty statistics for married-couple families in South Solon show that 3.6% or 3 of the total 83 families live below the poverty line. Families with 1 or 2 children have the highest poverty rate of 12.5%, comprising of 3 families. On the other hand, families with no children have the lowest poverty rate of 0.0%, which includes 0 families.
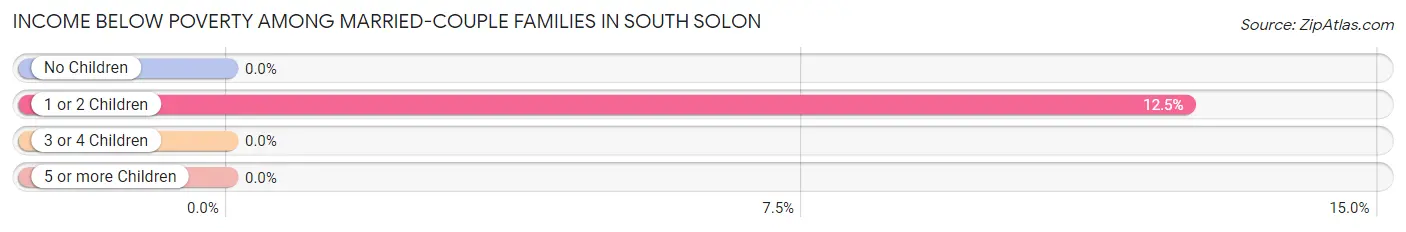
| Children | Above Poverty | Below Poverty |
| No Children | 57 (100.0%) | 0 (0.0%) |
| 1 or 2 Children | 21 (87.5%) | 3 (12.5%) |
| 3 or 4 Children | 1 (100.0%) | 0 (0.0%) |
| 5 or more Children | 1 (100.0%) | 0 (0.0%) |
| Total | 80 (96.4%) | 3 (3.6%) |
Income Below Poverty Among Single-Parent Households in South Solon
According to the poverty data in South Solon, 11.1% or 1 single-father households and 28.6% or 4 single-mother households are living below the poverty line. Among single-father households, those with 3 or 4 children have the highest poverty rate, with 1 households (20.0%) experiencing poverty. Likewise, among single-mother households, those with 1 or 2 children have the highest poverty rate, with 4 households (44.4%) falling below the poverty line.
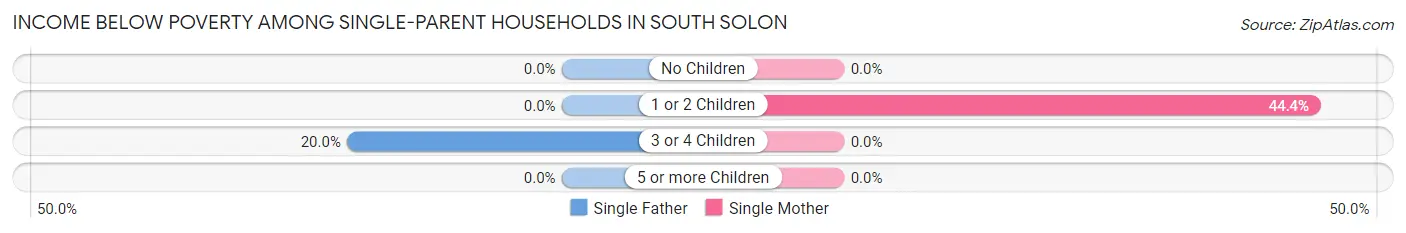
| Children | Single Father | Single Mother |
| No Children | 0 (0.0%) | 0 (0.0%) |
| 1 or 2 Children | 0 (0.0%) | 4 (44.4%) |
| 3 or 4 Children | 1 (20.0%) | 0 (0.0%) |
| 5 or more Children | 0 (0.0%) | 0 (0.0%) |
| Total | 1 (11.1%) | 4 (28.6%) |
Income Below Poverty Among Married-Couple vs Single-Parent Households in South Solon
The poverty data for South Solon shows that 3 of the married-couple family households (3.6%) and 5 of the single-parent households (21.7%) are living below the poverty level. Within the married-couple family households, those with 1 or 2 children have the highest poverty rate, with 3 households (12.5%) falling below the poverty line. Among the single-parent households, those with 1 or 2 children have the highest poverty rate, with 4 household (33.3%) living below poverty.
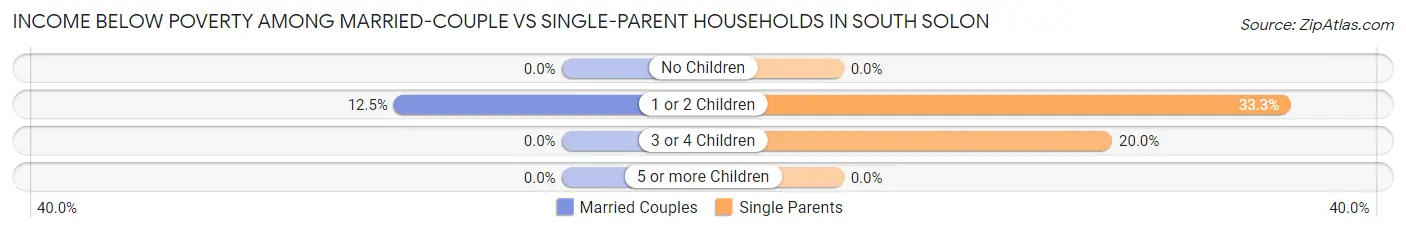
| Children | Married-Couple Families | Single-Parent Households |
| No Children | 0 (0.0%) | 0 (0.0%) |
| 1 or 2 Children | 3 (12.5%) | 4 (33.3%) |
| 3 or 4 Children | 0 (0.0%) | 1 (20.0%) |
| 5 or more Children | 0 (0.0%) | 0 (0.0%) |
| Total | 3 (3.6%) | 5 (21.7%) |
Race in South Solon
The most populous races in South Solon are White / Caucasian (351 | 91.2%), Hispanic or Latino (67 | 17.4%), and Two or more Races (32 | 8.3%).
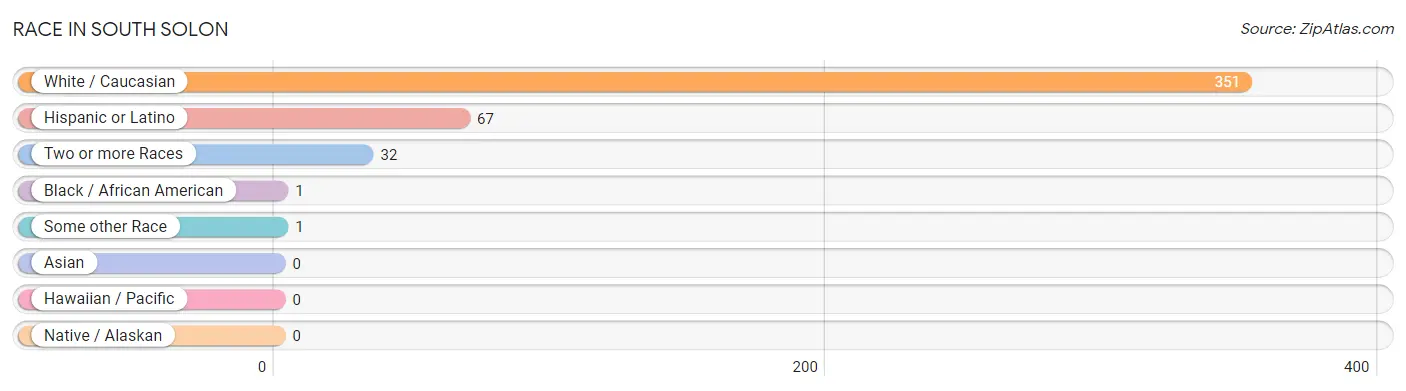
| Race | # Population | % Population |
| Asian | 0 | 0.0% |
| Black / African American | 1 | 0.3% |
| Hawaiian / Pacific | 0 | 0.0% |
| Hispanic or Latino | 67 | 17.4% |
| Native / Alaskan | 0 | 0.0% |
| White / Caucasian | 351 | 91.2% |
| Two or more Races | 32 | 8.3% |
| Some other Race | 1 | 0.3% |
| Total | 385 | 100.0% |
Ancestry in South Solon
The most populous ancestries reported in South Solon are American (97 | 25.2%), Mexican (65 | 16.9%), Dutch (35 | 9.1%), German (33 | 8.6%), and Scotch-Irish (32 | 8.3%), together accounting for 68.0% of all South Solon residents.
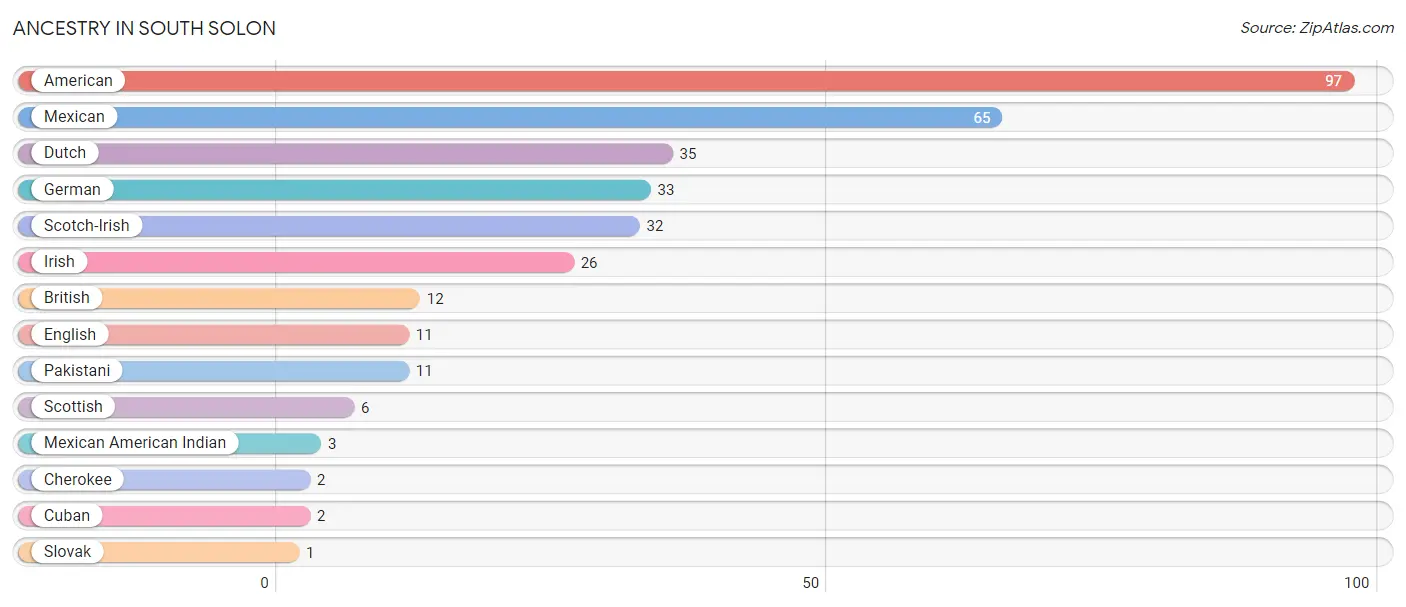
| Ancestry | # Population | % Population |
| American | 97 | 25.2% |
| British | 12 | 3.1% |
| Cherokee | 2 | 0.5% |
| Cuban | 2 | 0.5% |
| Dutch | 35 | 9.1% |
| English | 11 | 2.9% |
| German | 33 | 8.6% |
| Irish | 26 | 6.8% |
| Mexican | 65 | 16.9% |
| Mexican American Indian | 3 | 0.8% |
| Pakistani | 11 | 2.9% |
| Scotch-Irish | 32 | 8.3% |
| Scottish | 6 | 1.6% |
| Slovak | 1 | 0.3% | View All 14 Rows |
Immigrants in South Solon
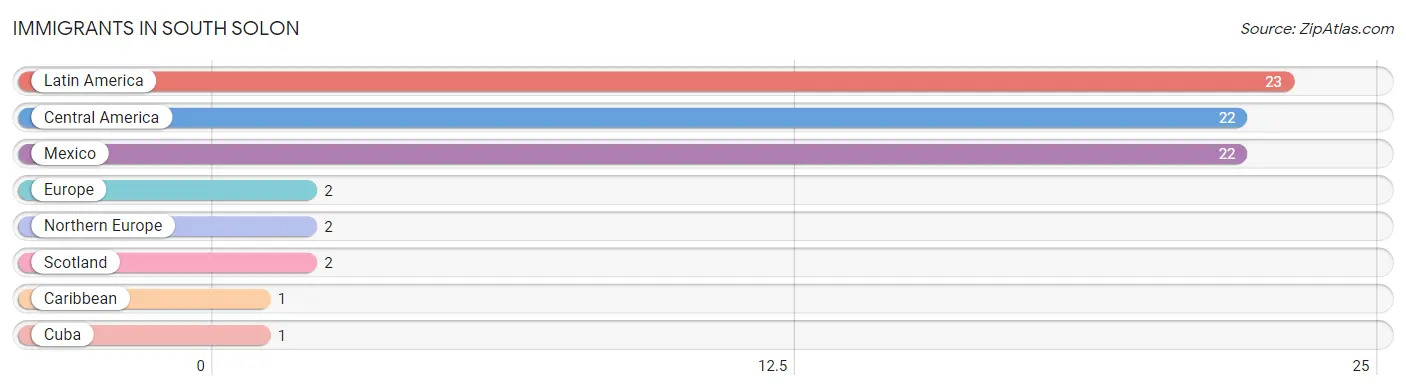
The most numerous immigrant groups reported in South Solon came from Latin America (23 | 6.0%), Central America (22 | 5.7%), Mexico (22 | 5.7%), Europe (2 | 0.5%), and Northern Europe (2 | 0.5%), together accounting for 18.4% of all South Solon residents.
| Immigration Origin | # Population | % Population |
| Caribbean | 1 | 0.3% |
| Central America | 22 | 5.7% |
| Cuba | 1 | 0.3% |
| Europe | 2 | 0.5% |
| Latin America | 23 | 6.0% |
| Mexico | 22 | 5.7% |
| Northern Europe | 2 | 0.5% |
| Scotland | 2 | 0.5% | View All 8 Rows |
Sex and Age in South Solon
Sex and Age in South Solon
The most populous age groups in South Solon are 55 to 59 Years (41 | 21.0%) for men and 10 to 14 Years (29 | 15.3%) for women.
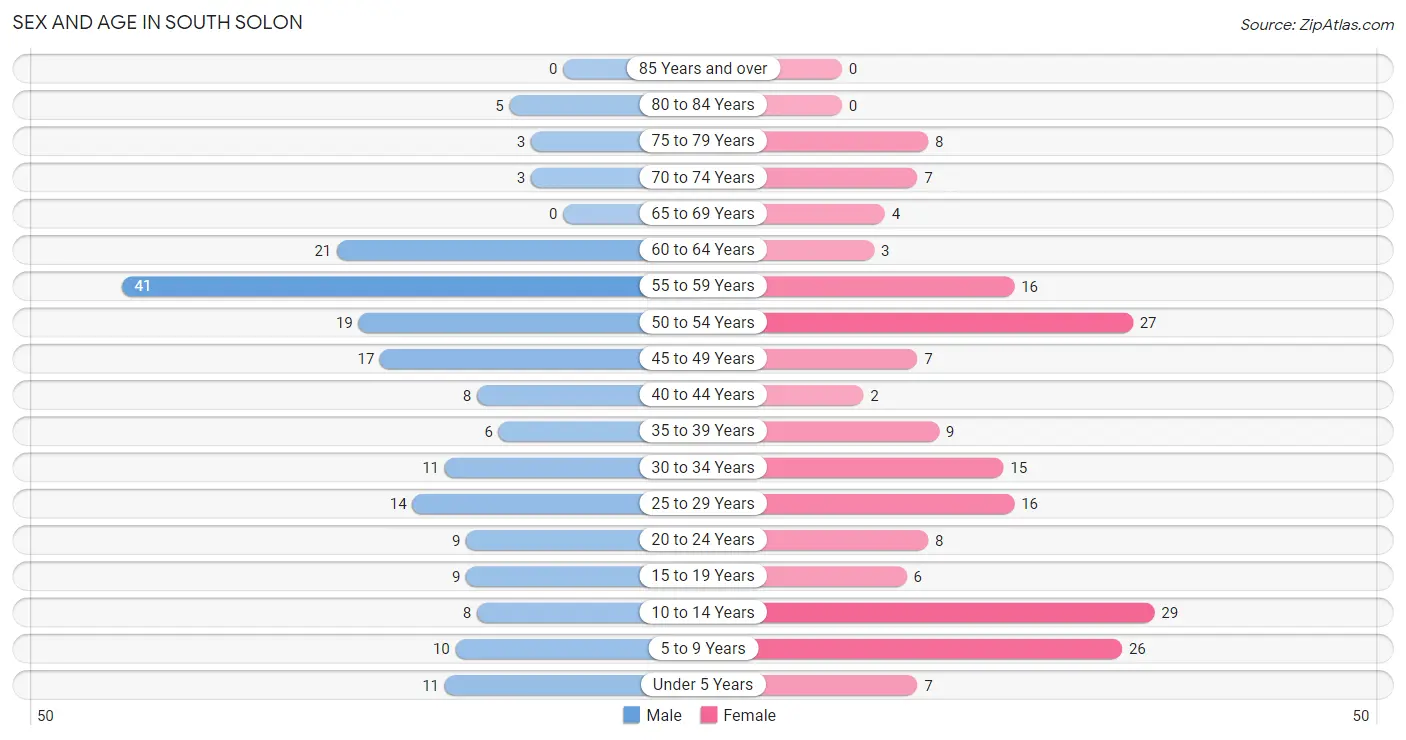
| Age Bracket | Male | Female |
| Under 5 Years | 11 (5.6%) | 7 (3.7%) |
| 5 to 9 Years | 10 (5.1%) | 26 (13.7%) |
| 10 to 14 Years | 8 (4.1%) | 29 (15.3%) |
| 15 to 19 Years | 9 (4.6%) | 6 (3.2%) |
| 20 to 24 Years | 9 (4.6%) | 8 (4.2%) |
| 25 to 29 Years | 14 (7.2%) | 16 (8.4%) |
| 30 to 34 Years | 11 (5.6%) | 15 (7.9%) |
| 35 to 39 Years | 6 (3.1%) | 9 (4.7%) |
| 40 to 44 Years | 8 (4.1%) | 2 (1.1%) |
| 45 to 49 Years | 17 (8.7%) | 7 (3.7%) |
| 50 to 54 Years | 19 (9.7%) | 27 (14.2%) |
| 55 to 59 Years | 41 (21.0%) | 16 (8.4%) |
| 60 to 64 Years | 21 (10.8%) | 3 (1.6%) |
| 65 to 69 Years | 0 (0.0%) | 4 (2.1%) |
| 70 to 74 Years | 3 (1.5%) | 7 (3.7%) |
| 75 to 79 Years | 3 (1.5%) | 8 (4.2%) |
| 80 to 84 Years | 5 (2.6%) | 0 (0.0%) |
| 85 Years and over | 0 (0.0%) | 0 (0.0%) |
| Total | 195 (100.0%) | 190 (100.0%) |
Families and Households in South Solon
Median Family Size in South Solon
The median family size in South Solon is 3.17 persons per family, with single male/father families (9 | 8.5%) accounting for the largest median family size of 6.78 persons per family. On the other hand, married-couple families (83 | 78.3%) represent the smallest median family size with 2.43 persons per family.
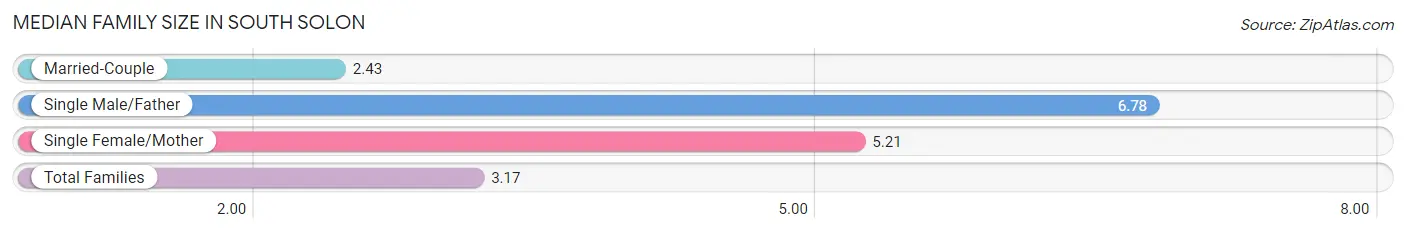
| Family Type | # Families | Family Size |
| Married-Couple | 83 (78.3%) | 2.43 |
| Single Male/Father | 9 (8.5%) | 6.78 |
| Single Female/Mother | 14 (13.2%) | 5.21 |
| Total Families | 106 (100.0%) | 3.17 |
Median Household Size in South Solon
The median household size in South Solon is 2.83 persons per household, with single male/father households (9 | 6.6%) accounting for the largest median household size of 7.78 persons per household. non-family households (30 | 22.1%) represent the smallest median household size with 1.20 persons per household.
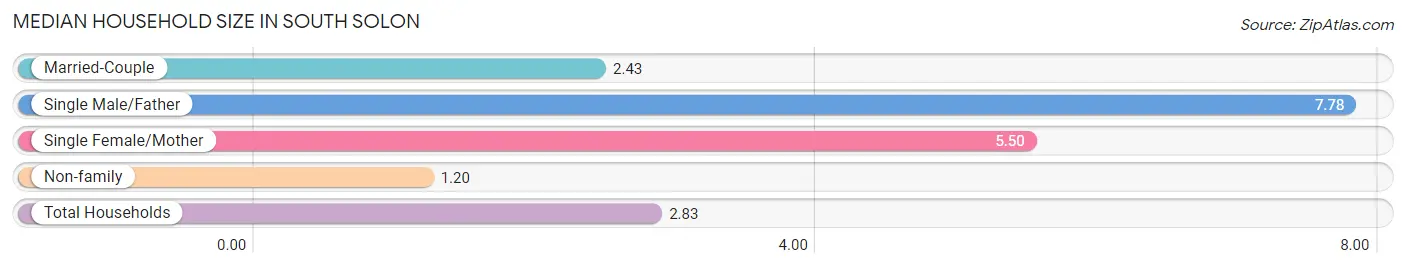
| Household Type | # Households | Household Size |
| Married-Couple | 83 (61.0%) | 2.43 |
| Single Male/Father | 9 (6.6%) | 7.78 |
| Single Female/Mother | 14 (10.3%) | 5.50 |
| Non-family | 30 (22.1%) | 1.20 |
| Total Households | 136 (100.0%) | 2.83 |
Household Size by Marriage Status in South Solon
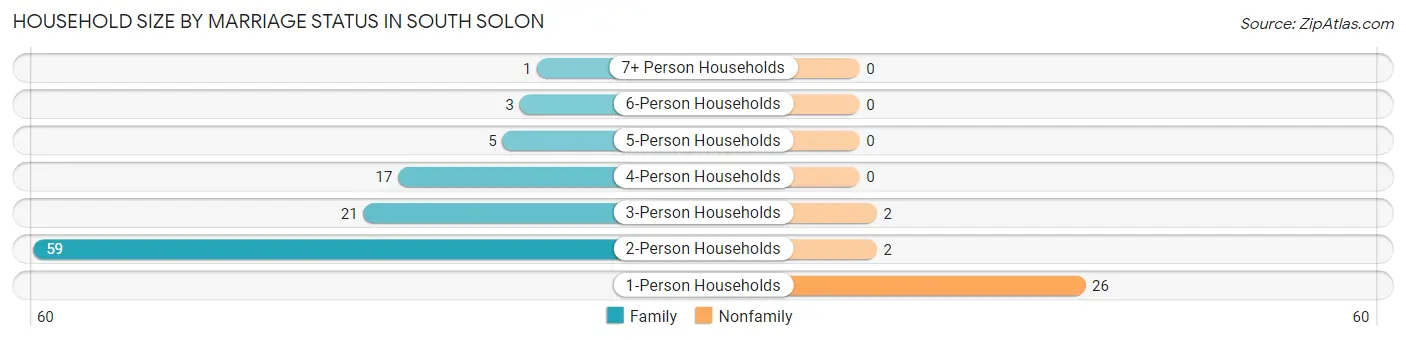
Out of a total of 136 households in South Solon, 106 (77.9%) are family households, while 30 (22.1%) are nonfamily households. The most numerous type of family households are 2-person households, comprising 59, and the most common type of nonfamily households are 1-person households, comprising 26.
| Household Size | Family Households | Nonfamily Households |
| 1-Person Households | - | 26 (19.1%) |
| 2-Person Households | 59 (43.4%) | 2 (1.5%) |
| 3-Person Households | 21 (15.4%) | 2 (1.5%) |
| 4-Person Households | 17 (12.5%) | 0 (0.0%) |
| 5-Person Households | 5 (3.7%) | 0 (0.0%) |
| 6-Person Households | 3 (2.2%) | 0 (0.0%) |
| 7+ Person Households | 1 (0.7%) | 0 (0.0%) |
| Total | 106 (77.9%) | 30 (22.1%) |
Female Fertility in South Solon
Fertility by Age in South Solon
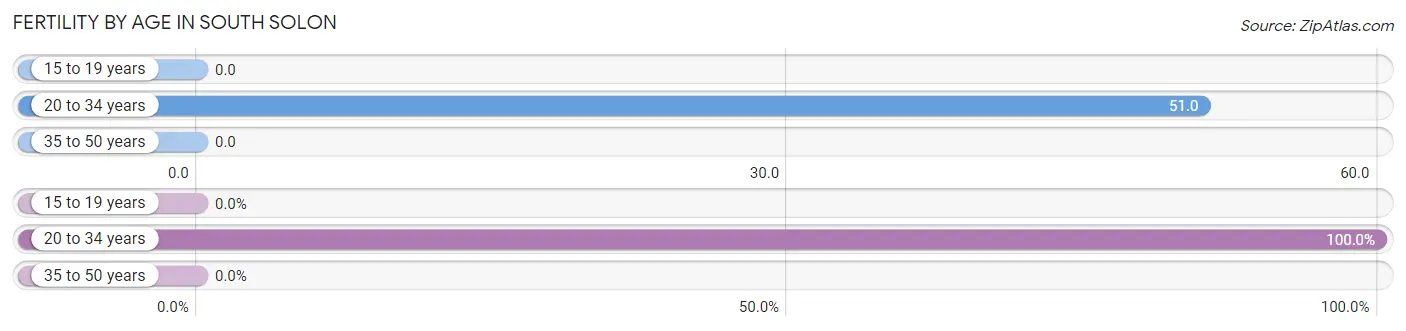
Average fertility rate in South Solon is 26.0 births per 1,000 women. Women in the age bracket of 20 to 34 years have the highest fertility rate with 51.0 births per 1,000 women. Women in the age bracket of 20 to 34 years acount for 100.0% of all women with births.
| Age Bracket | Women with Births | Births / 1,000 Women |
| 15 to 19 years | 0 (0.0%) | 0.0 |
| 20 to 34 years | 2 (100.0%) | 51.0 |
| 35 to 50 years | 0 (0.0%) | 0.0 |
| Total | 2 (100.0%) | 26.0 |
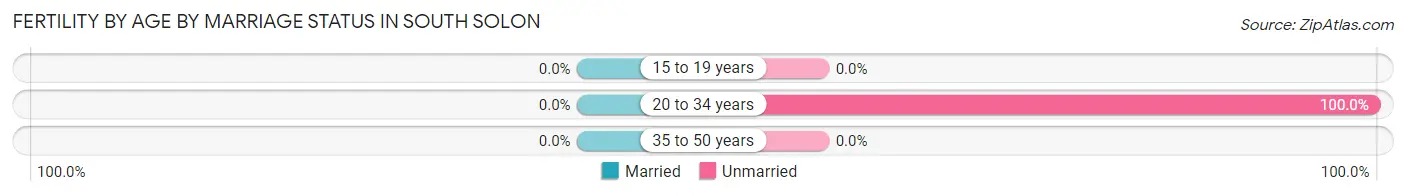
Fertility by Age by Marriage Status in South Solon
| Age Bracket | Married | Unmarried |
| 15 to 19 years | 0 (0.0%) | 0 (0.0%) |
| 20 to 34 years | 0 (0.0%) | 2 (100.0%) |
| 35 to 50 years | 0 (0.0%) | 0 (0.0%) |
| Total | 0 (0.0%) | 2 (100.0%) |
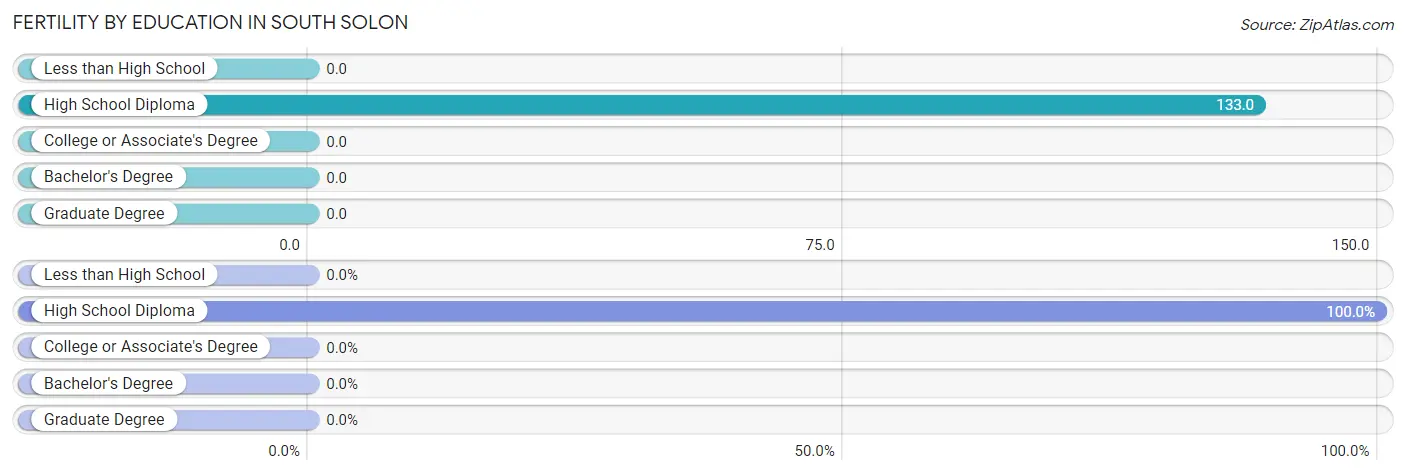
Fertility by Education in South Solon
| Educational Attainment | Women with Births | Births / 1,000 Women |
| Less than High School | 0 (0.0%) | 0.0 |
| High School Diploma | 2 (100.0%) | 133.0 |
| College or Associate's Degree | 0 (0.0%) | 0.0 |
| Bachelor's Degree | 0 (0.0%) | 0.0 |
| Graduate Degree | 0 (0.0%) | 0.0 |
| Total | 2 (100.0%) | 26.0 |
Fertility by Education by Marriage Status in South Solon
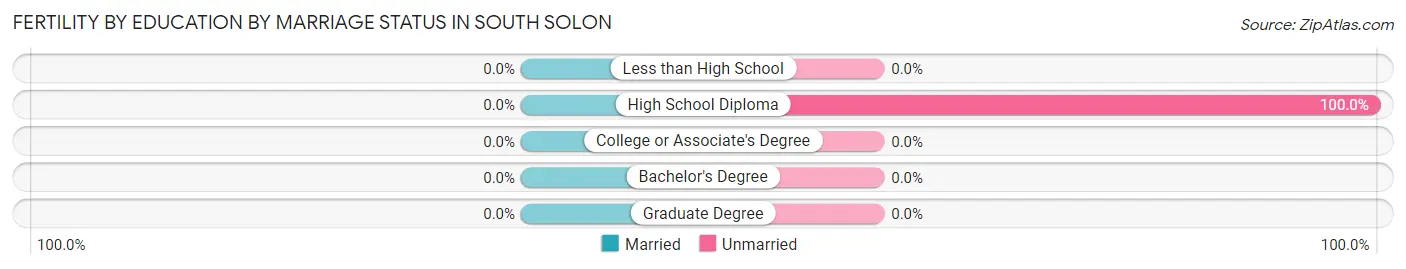
| Educational Attainment | Married | Unmarried |
| Less than High School | 0 (0.0%) | 0 (0.0%) |
| High School Diploma | 0 (0.0%) | 2 (100.0%) |
| College or Associate's Degree | 0 (0.0%) | 0 (0.0%) |
| Bachelor's Degree | 0 (0.0%) | 0 (0.0%) |
| Graduate Degree | 0 (0.0%) | 0 (0.0%) |
| Total | 0 (0.0%) | 2 (100.0%) |
Employment Characteristics in South Solon
Employment by Class of Employer in South Solon
Among the 168 employed individuals in South Solon, private company employees (146 | 86.9%), federal government employees (9 | 5.4%), and self-employed (not incorporated) (5 | 3.0%) make up the most common classes of employment.
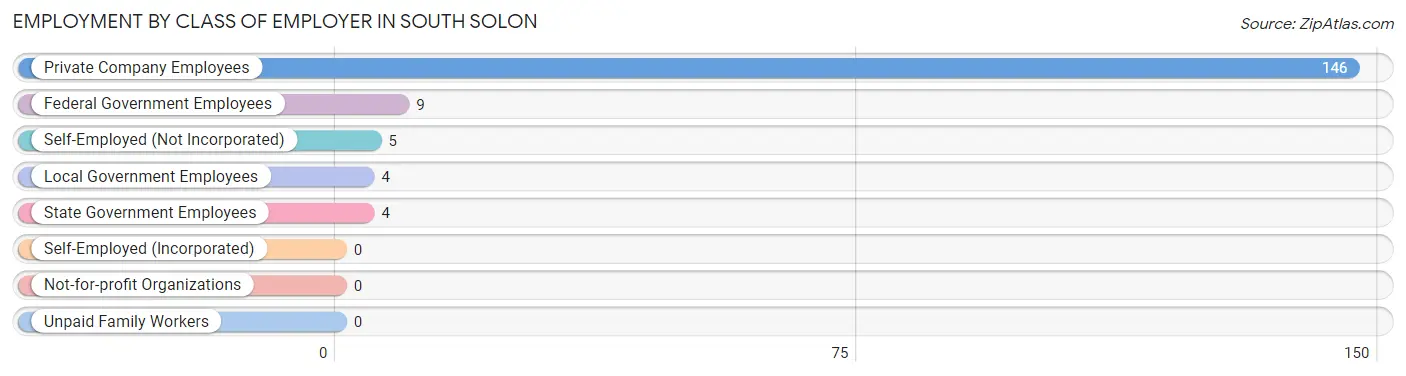
| Employer Class | # Employees | % Employees |
| Private Company Employees | 146 | 86.9% |
| Self-Employed (Incorporated) | 0 | 0.0% |
| Self-Employed (Not Incorporated) | 5 | 3.0% |
| Not-for-profit Organizations | 0 | 0.0% |
| Local Government Employees | 4 | 2.4% |
| State Government Employees | 4 | 2.4% |
| Federal Government Employees | 9 | 5.4% |
| Unpaid Family Workers | 0 | 0.0% |
| Total | 168 | 100.0% |
Employment Status by Age in South Solon
According to the labor force statistics for South Solon, out of the total population over 16 years of age (294), 61.9% or 182 individuals are in the labor force, with 4.9% or 9 of them unemployed. The age group with the highest labor force participation rate is 25 to 29 years, with 96.7% or 29 individuals in the labor force. Within the labor force, the 16 to 19 years age range has the highest percentage of unemployed individuals, with 77.8% or 7 of them being unemployed.
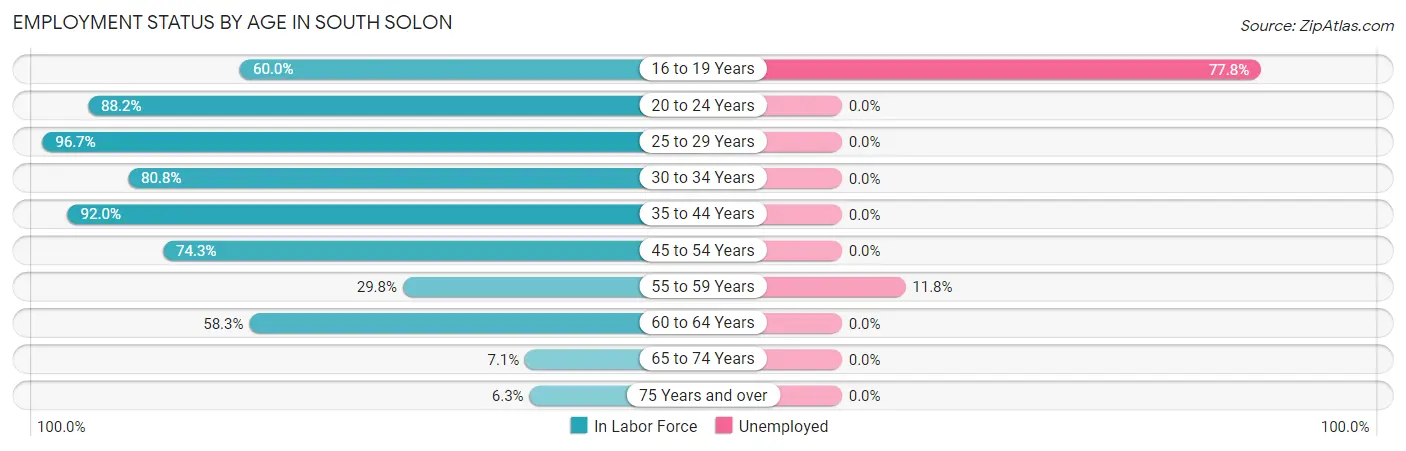
| Age Bracket | In Labor Force | Unemployed |
| 16 to 19 Years | 9 (60.0%) | 7 (77.8%) |
| 20 to 24 Years | 15 (88.2%) | 0 (0.0%) |
| 25 to 29 Years | 29 (96.7%) | 0 (0.0%) |
| 30 to 34 Years | 21 (80.8%) | 0 (0.0%) |
| 35 to 44 Years | 23 (92.0%) | 0 (0.0%) |
| 45 to 54 Years | 52 (74.3%) | 0 (0.0%) |
| 55 to 59 Years | 17 (29.8%) | 2 (11.8%) |
| 60 to 64 Years | 14 (58.3%) | 0 (0.0%) |
| 65 to 74 Years | 1 (7.1%) | 0 (0.0%) |
| 75 Years and over | 1 (6.3%) | 0 (0.0%) |
| Total | 182 (61.9%) | 9 (4.9%) |
Employment Status by Educational Attainment in South Solon
According to labor force statistics for South Solon, 67.2% of individuals (156) out of the total population between 25 and 64 years of age (232) are in the labor force, with 1.3% or 2 of them being unemployed. The group with the highest labor force participation rate are those with the educational attainment of college / associate degree, with 85.2% or 46 individuals in the labor force. Within the labor force, individuals with college / associate degree education have the highest percentage of unemployment, with 2.2% or 1 of them being unemployed.
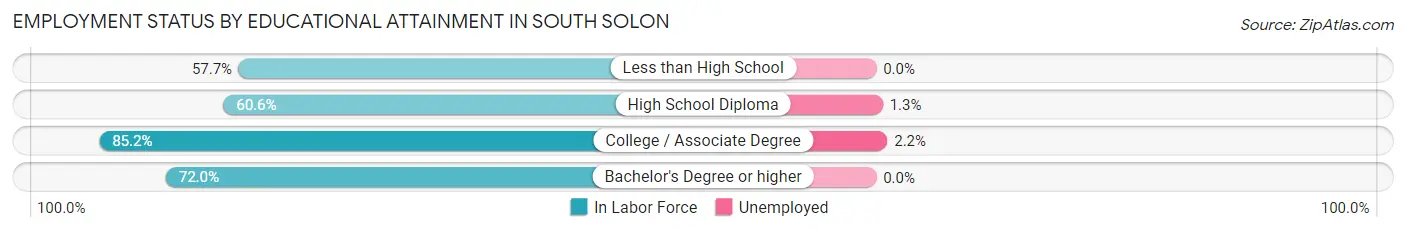
| Educational Attainment | In Labor Force | Unemployed |
| Less than High School | 15 (57.7%) | 0 (0.0%) |
| High School Diploma | 77 (60.6%) | 2 (1.3%) |
| College / Associate Degree | 46 (85.2%) | 1 (2.2%) |
| Bachelor's Degree or higher | 18 (72.0%) | 0 (0.0%) |
| Total | 156 (67.2%) | 3 (1.3%) |
Employment Occupations by Sex in South Solon
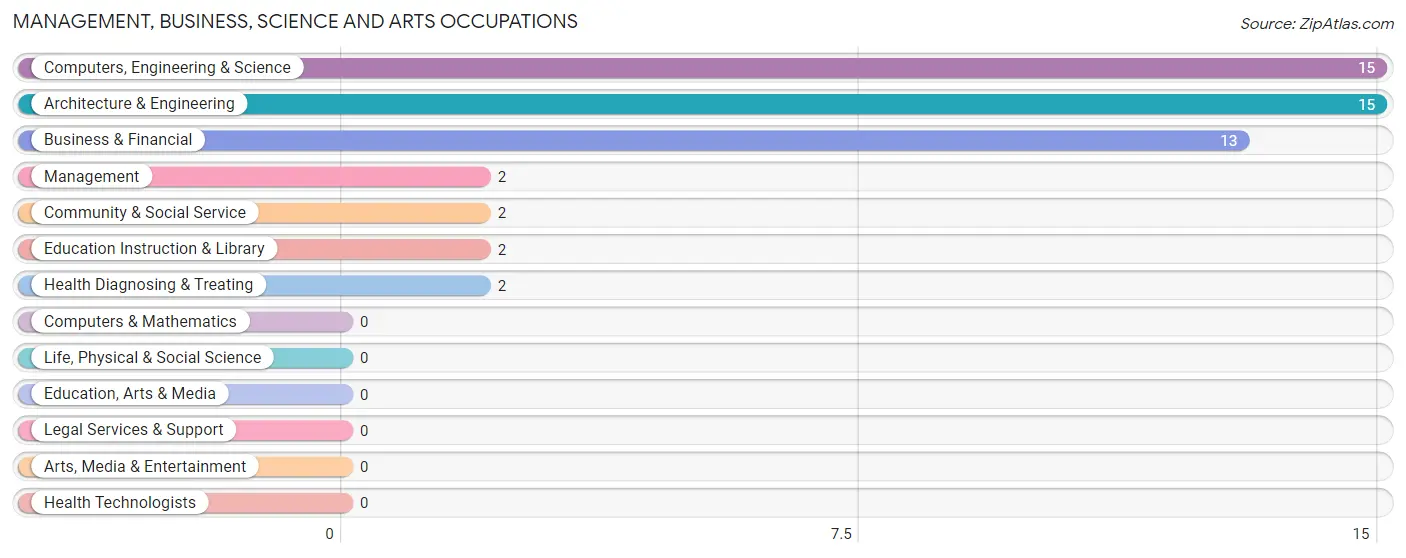
Management, Business, Science and Arts Occupations
The most common Management, Business, Science and Arts occupations in South Solon are Computers, Engineering & Science (15 | 8.7%), Architecture & Engineering (15 | 8.7%), Business & Financial (13 | 7.5%), Management (2 | 1.2%), and Community & Social Service (2 | 1.2%).
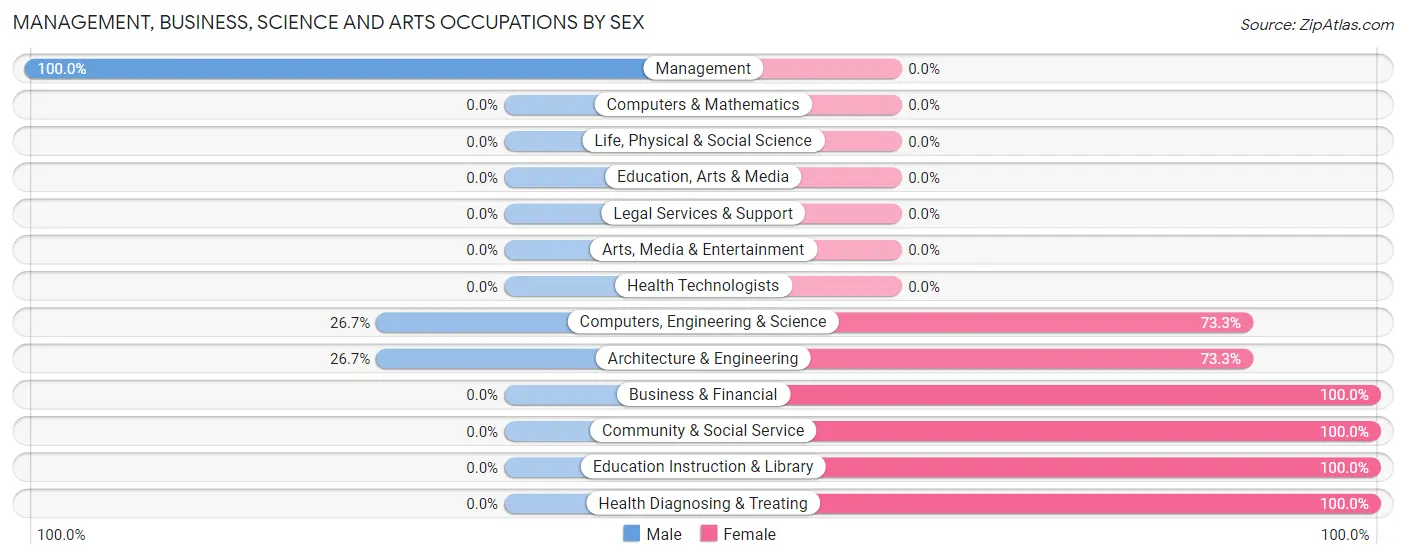
Management, Business, Science and Arts Occupations by Sex
Within the Management, Business, Science and Arts occupations in South Solon, the most male-oriented occupations are Management (100.0%), Computers, Engineering & Science (26.7%), and Architecture & Engineering (26.7%), while the most female-oriented occupations are Business & Financial (100.0%), Community & Social Service (100.0%), and Education Instruction & Library (100.0%).
| Occupation | Male | Female |
| Management | 2 (100.0%) | 0 (0.0%) |
| Business & Financial | 0 (0.0%) | 13 (100.0%) |
| Computers, Engineering & Science | 4 (26.7%) | 11 (73.3%) |
| Computers & Mathematics | 0 (0.0%) | 0 (0.0%) |
| Architecture & Engineering | 4 (26.7%) | 11 (73.3%) |
| Life, Physical & Social Science | 0 (0.0%) | 0 (0.0%) |
| Community & Social Service | 0 (0.0%) | 2 (100.0%) |
| Education, Arts & Media | 0 (0.0%) | 0 (0.0%) |
| Legal Services & Support | 0 (0.0%) | 0 (0.0%) |
| Education Instruction & Library | 0 (0.0%) | 2 (100.0%) |
| Arts, Media & Entertainment | 0 (0.0%) | 0 (0.0%) |
| Health Diagnosing & Treating | 0 (0.0%) | 2 (100.0%) |
| Health Technologists | 0 (0.0%) | 0 (0.0%) |
| Total (Category) | 6 (17.6%) | 28 (82.4%) |
| Total (Overall) | 101 (58.4%) | 72 (41.6%) |
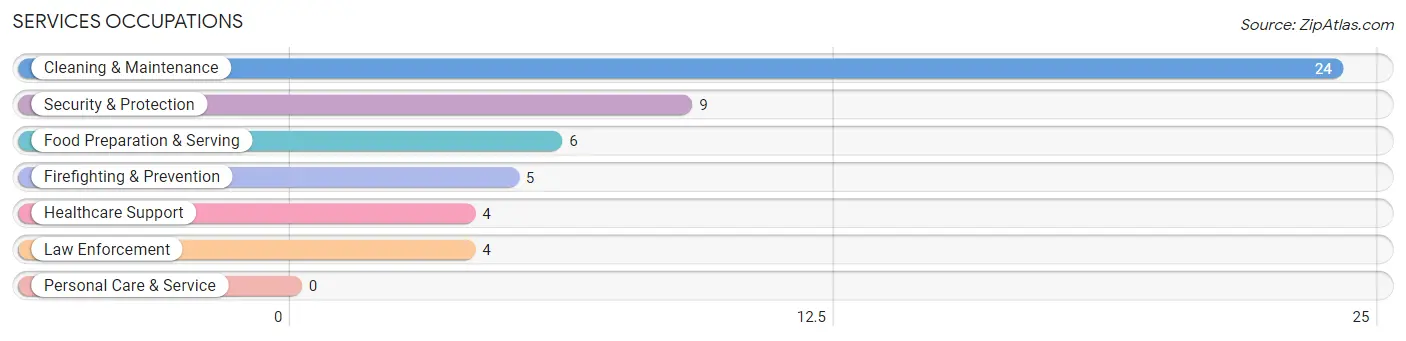
Services Occupations
The most common Services occupations in South Solon are Cleaning & Maintenance (24 | 13.9%), Security & Protection (9 | 5.2%), Food Preparation & Serving (6 | 3.5%), Firefighting & Prevention (5 | 2.9%), and Healthcare Support (4 | 2.3%).
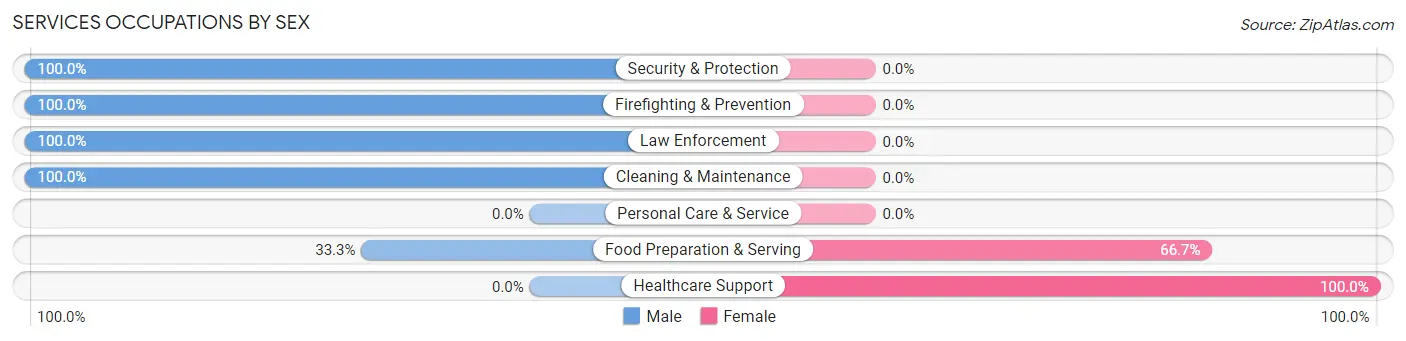
Services Occupations by Sex
Within the Services occupations in South Solon, the most male-oriented occupations are Security & Protection (100.0%), Firefighting & Prevention (100.0%), and Law Enforcement (100.0%), while the most female-oriented occupations are Healthcare Support (100.0%), and Food Preparation & Serving (66.7%).
| Occupation | Male | Female |
| Healthcare Support | 0 (0.0%) | 4 (100.0%) |
| Security & Protection | 9 (100.0%) | 0 (0.0%) |
| Firefighting & Prevention | 5 (100.0%) | 0 (0.0%) |
| Law Enforcement | 4 (100.0%) | 0 (0.0%) |
| Food Preparation & Serving | 2 (33.3%) | 4 (66.7%) |
| Cleaning & Maintenance | 24 (100.0%) | 0 (0.0%) |
| Personal Care & Service | 0 (0.0%) | 0 (0.0%) |
| Total (Category) | 35 (81.4%) | 8 (18.6%) |
| Total (Overall) | 101 (58.4%) | 72 (41.6%) |
Sales and Office Occupations
The most common Sales and Office occupations in South Solon are Sales & Related (13 | 7.5%), and Office & Administration (10 | 5.8%).
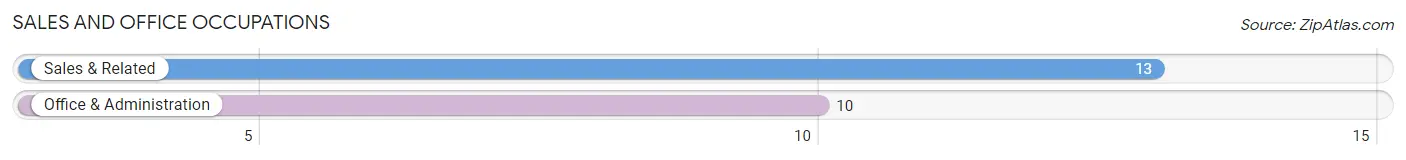
Sales and Office Occupations by Sex
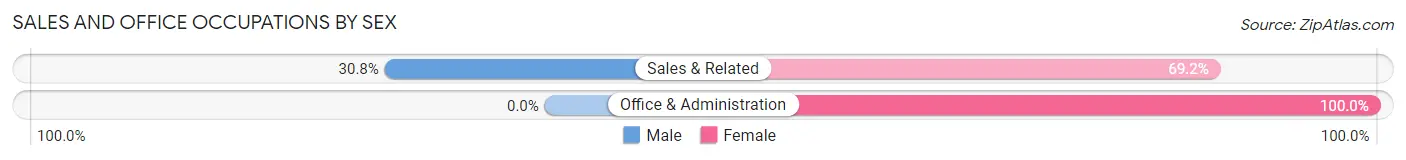
| Occupation | Male | Female |
| Sales & Related | 4 (30.8%) | 9 (69.2%) |
| Office & Administration | 0 (0.0%) | 10 (100.0%) |
| Total (Category) | 4 (17.4%) | 19 (82.6%) |
| Total (Overall) | 101 (58.4%) | 72 (41.6%) |
Natural Resources, Construction and Maintenance Occupations
The most common Natural Resources, Construction and Maintenance occupations in South Solon are Installation, Maintenance & Repair (18 | 10.4%), Farming, Fishing & Forestry (16 | 9.2%), and Construction & Extraction (6 | 3.5%).
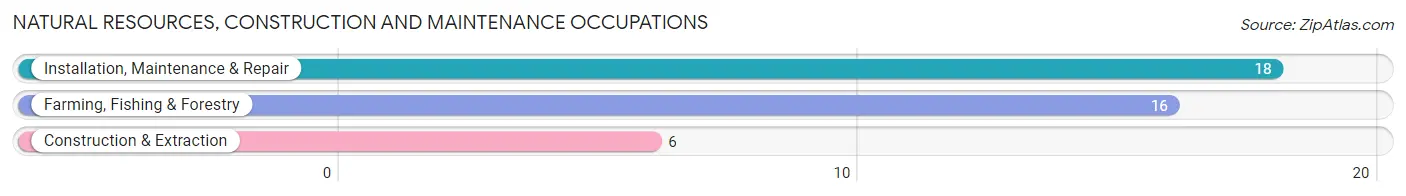
Natural Resources, Construction and Maintenance Occupations by Sex
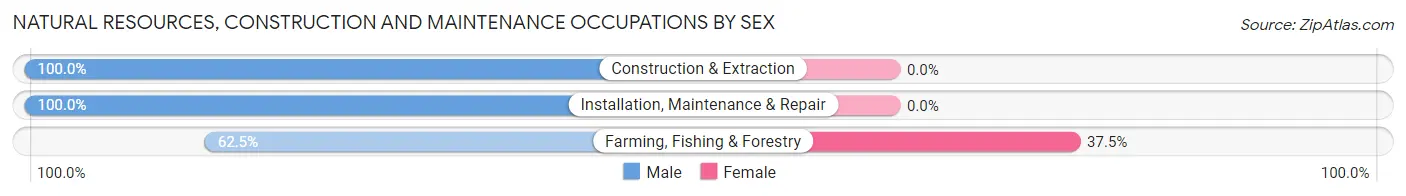
| Occupation | Male | Female |
| Farming, Fishing & Forestry | 10 (62.5%) | 6 (37.5%) |
| Construction & Extraction | 6 (100.0%) | 0 (0.0%) |
| Installation, Maintenance & Repair | 18 (100.0%) | 0 (0.0%) |
| Total (Category) | 34 (85.0%) | 6 (15.0%) |
| Total (Overall) | 101 (58.4%) | 72 (41.6%) |
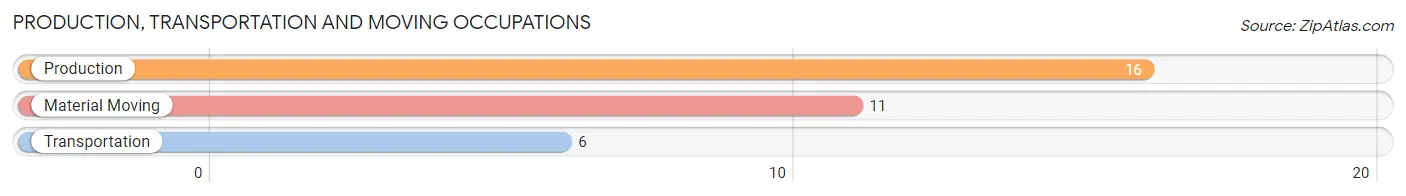
Production, Transportation and Moving Occupations
The most common Production, Transportation and Moving occupations in South Solon are Production (16 | 9.2%), Material Moving (11 | 6.4%), and Transportation (6 | 3.5%).
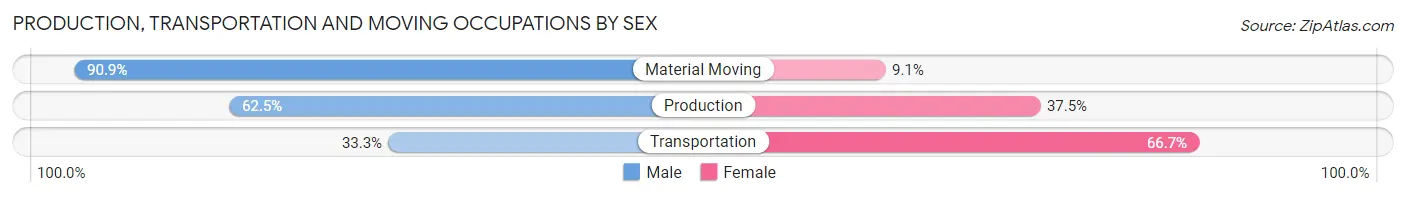
Production, Transportation and Moving Occupations by Sex
| Occupation | Male | Female |
| Production | 10 (62.5%) | 6 (37.5%) |
| Transportation | 2 (33.3%) | 4 (66.7%) |
| Material Moving | 10 (90.9%) | 1 (9.1%) |
| Total (Category) | 22 (66.7%) | 11 (33.3%) |
| Total (Overall) | 101 (58.4%) | 72 (41.6%) |
Employment Industries by Sex in South Solon
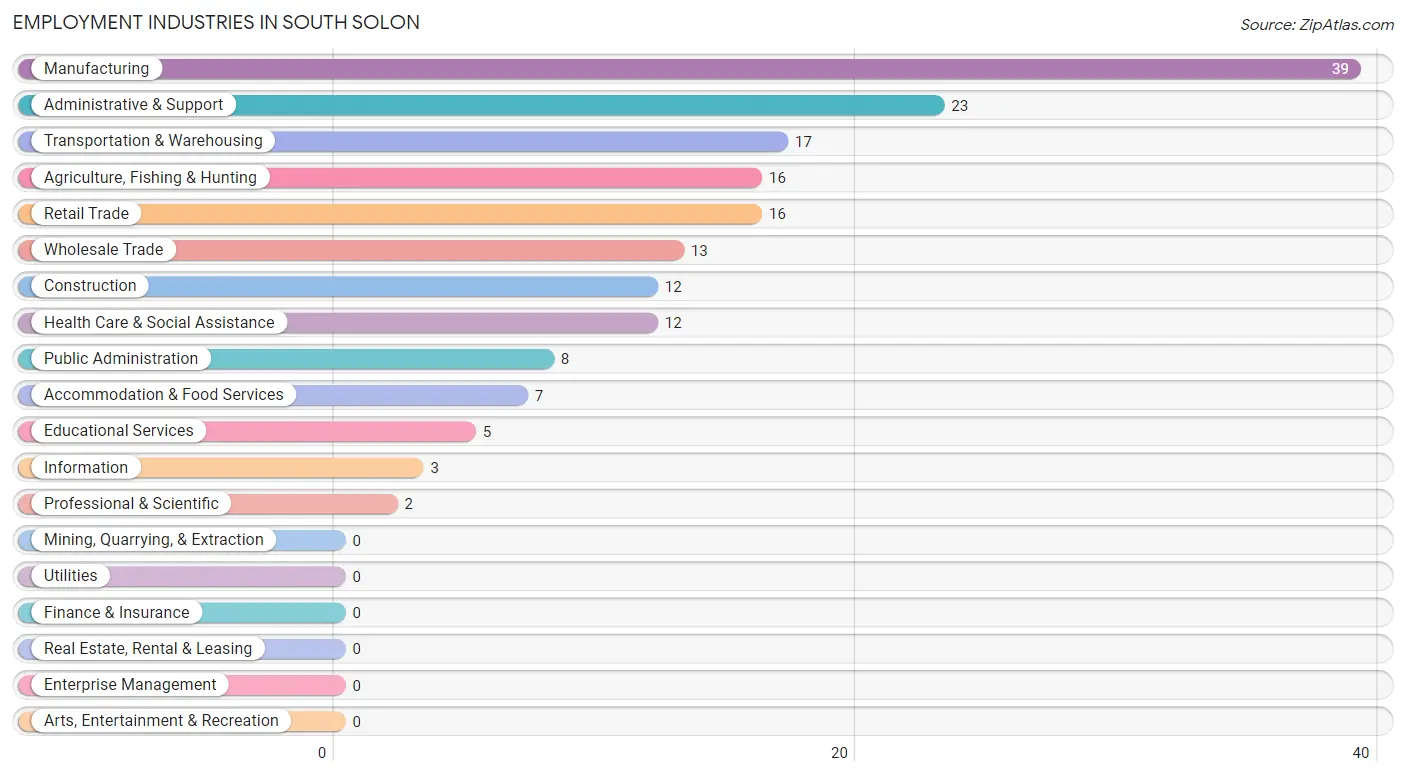
Employment Industries in South Solon
The major employment industries in South Solon include Manufacturing (39 | 22.5%), Administrative & Support (23 | 13.3%), Transportation & Warehousing (17 | 9.8%), Agriculture, Fishing & Hunting (16 | 9.2%), and Retail Trade (16 | 9.2%).
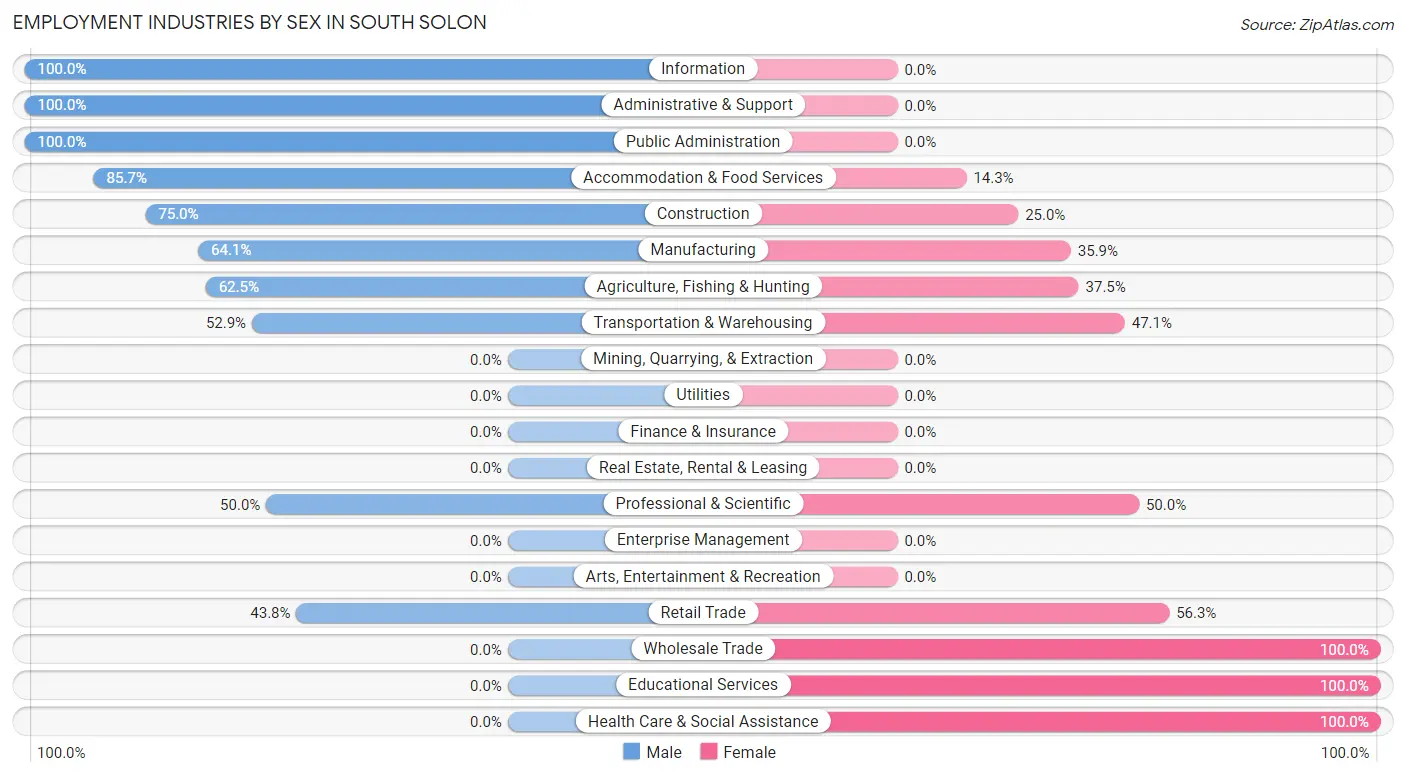
Employment Industries by Sex in South Solon
The South Solon industries that see more men than women are Information (100.0%), Administrative & Support (100.0%), and Public Administration (100.0%), whereas the industries that tend to have a higher number of women are Wholesale Trade (100.0%), Educational Services (100.0%), and Health Care & Social Assistance (100.0%).
| Industry | Male | Female |
| Agriculture, Fishing & Hunting | 10 (62.5%) | 6 (37.5%) |
| Mining, Quarrying, & Extraction | 0 (0.0%) | 0 (0.0%) |
| Construction | 9 (75.0%) | 3 (25.0%) |
| Manufacturing | 25 (64.1%) | 14 (35.9%) |
| Wholesale Trade | 0 (0.0%) | 13 (100.0%) |
| Retail Trade | 7 (43.8%) | 9 (56.2%) |
| Transportation & Warehousing | 9 (52.9%) | 8 (47.1%) |
| Utilities | 0 (0.0%) | 0 (0.0%) |
| Information | 3 (100.0%) | 0 (0.0%) |
| Finance & Insurance | 0 (0.0%) | 0 (0.0%) |
| Real Estate, Rental & Leasing | 0 (0.0%) | 0 (0.0%) |
| Professional & Scientific | 1 (50.0%) | 1 (50.0%) |
| Enterprise Management | 0 (0.0%) | 0 (0.0%) |
| Administrative & Support | 23 (100.0%) | 0 (0.0%) |
| Educational Services | 0 (0.0%) | 5 (100.0%) |
| Health Care & Social Assistance | 0 (0.0%) | 12 (100.0%) |
| Arts, Entertainment & Recreation | 0 (0.0%) | 0 (0.0%) |
| Accommodation & Food Services | 6 (85.7%) | 1 (14.3%) |
| Public Administration | 8 (100.0%) | 0 (0.0%) |
| Total | 101 (58.4%) | 72 (41.6%) |
Education in South Solon
School Enrollment in South Solon
The most common levels of schooling among the 87 students in South Solon are elementary school (38 | 43.7%), middle school (18 | 20.7%), and high school (14 | 16.1%).
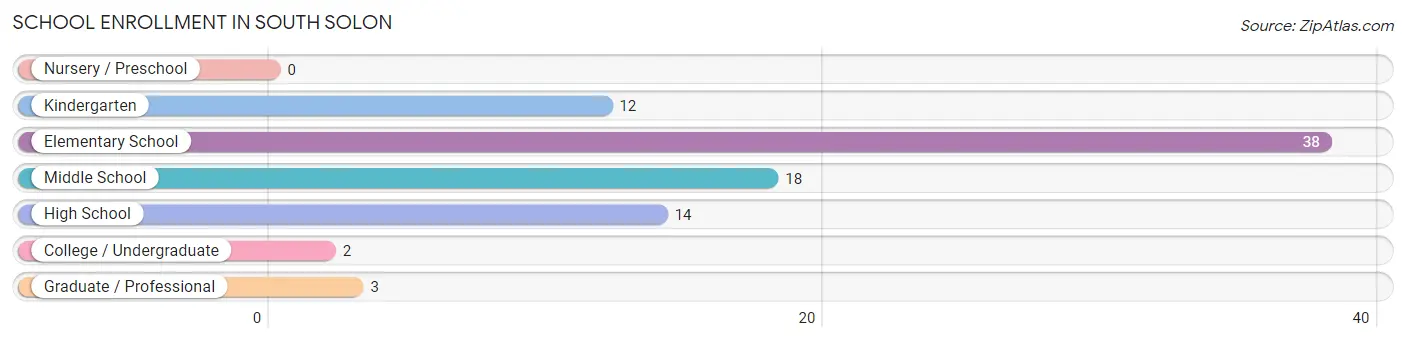
| School Level | # Students | % Students |
| Nursery / Preschool | 0 | 0.0% |
| Kindergarten | 12 | 13.8% |
| Elementary School | 38 | 43.7% |
| Middle School | 18 | 20.7% |
| High School | 14 | 16.1% |
| College / Undergraduate | 2 | 2.3% |
| Graduate / Professional | 3 | 3.5% |
| Total | 87 | 100.0% |
School Enrollment by Age by Funding Source in South Solon
Out of a total of 87 students who are enrolled in schools in South Solon, 6 (6.9%) attend a private institution, while the remaining 81 (93.1%) are enrolled in public schools. The age group of 20 to 24 year olds has the highest likelihood of being enrolled in private schools, with 3 (100.0% in the age bracket) enrolled. Conversely, the age group of 10 to 14 year olds has the lowest likelihood of being enrolled in a private school, with 33 (100.0% in the age bracket) attending a public institution.
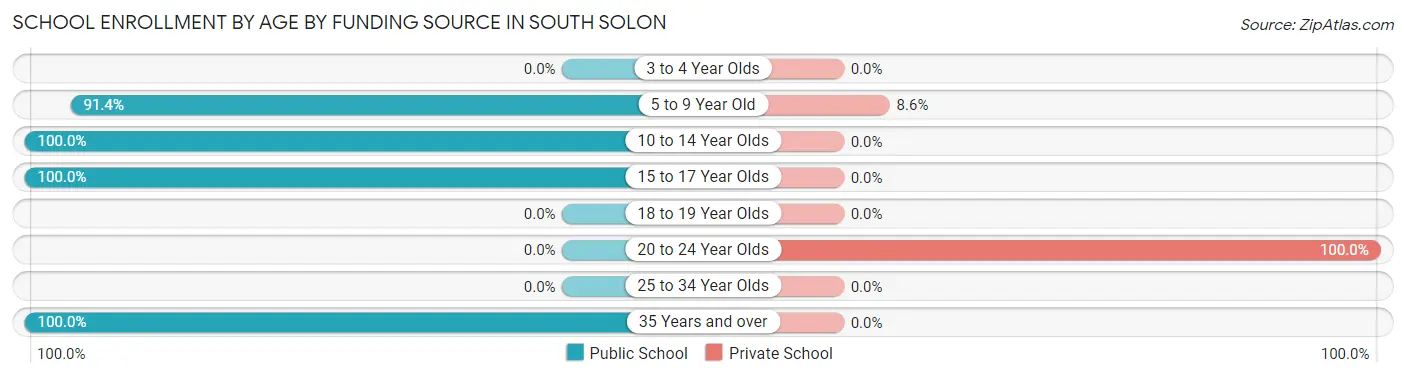
| Age Bracket | Public School | Private School |
| 3 to 4 Year Olds | 0 (0.0%) | 0 (0.0%) |
| 5 to 9 Year Old | 32 (91.4%) | 3 (8.6%) |
| 10 to 14 Year Olds | 33 (100.0%) | 0 (0.0%) |
| 15 to 17 Year Olds | 14 (100.0%) | 0 (0.0%) |
| 18 to 19 Year Olds | 0 (0.0%) | 0 (0.0%) |
| 20 to 24 Year Olds | 0 (0.0%) | 3 (100.0%) |
| 25 to 34 Year Olds | 0 (0.0%) | 0 (0.0%) |
| 35 Years and over | 2 (100.0%) | 0 (0.0%) |
| Total | 81 (93.1%) | 6 (6.9%) |
Educational Attainment by Field of Study in South Solon
Engineering (12 | 48.0%), arts & humanities (8 | 32.0%), education (4 | 16.0%), and business (1 | 4.0%) are the most common fields of study among 25 individuals in South Solon who have obtained a bachelor's degree or higher.
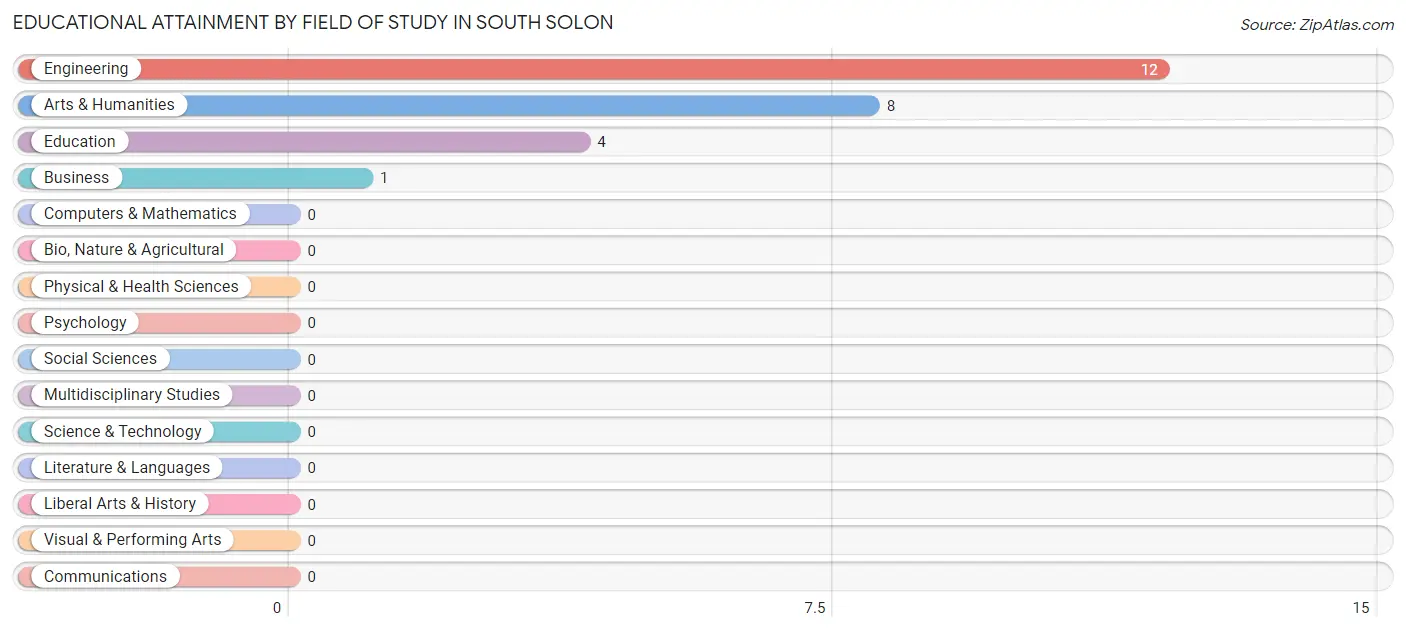
| Field of Study | # Graduates | % Graduates |
| Computers & Mathematics | 0 | 0.0% |
| Bio, Nature & Agricultural | 0 | 0.0% |
| Physical & Health Sciences | 0 | 0.0% |
| Psychology | 0 | 0.0% |
| Social Sciences | 0 | 0.0% |
| Engineering | 12 | 48.0% |
| Multidisciplinary Studies | 0 | 0.0% |
| Science & Technology | 0 | 0.0% |
| Business | 1 | 4.0% |
| Education | 4 | 16.0% |
| Literature & Languages | 0 | 0.0% |
| Liberal Arts & History | 0 | 0.0% |
| Visual & Performing Arts | 0 | 0.0% |
| Communications | 0 | 0.0% |
| Arts & Humanities | 8 | 32.0% |
| Total | 25 | 100.0% |
Transportation & Commute in South Solon
Vehicle Availability by Sex in South Solon
The most prevalent vehicle ownership categories in South Solon are males with 2 vehicles (37, accounting for 37.0%) and females with 2 vehicles (17, making up 54.4%).
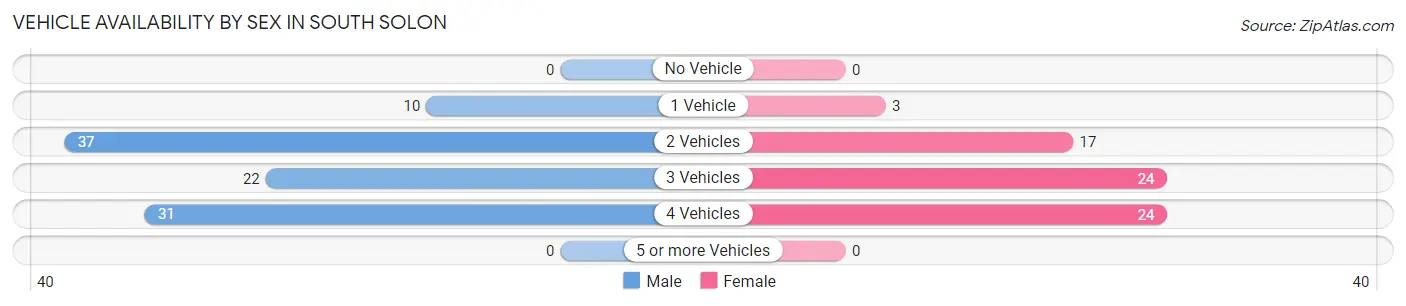
| Vehicles Available | Male | Female |
| No Vehicle | 0 (0.0%) | 0 (0.0%) |
| 1 Vehicle | 10 (10.0%) | 3 (4.4%) |
| 2 Vehicles | 37 (37.0%) | 17 (25.0%) |
| 3 Vehicles | 22 (22.0%) | 24 (35.3%) |
| 4 Vehicles | 31 (31.0%) | 24 (35.3%) |
| 5 or more Vehicles | 0 (0.0%) | 0 (0.0%) |
| Total | 100 (100.0%) | 68 (100.0%) |
Commute Time in South Solon
The most frequently occuring commute durations in South Solon are 60 to 89 minutes (40 commuters, 25.8%), 30 to 34 minutes (30 commuters, 19.4%), and 40 to 44 minutes (19 commuters, 12.3%).
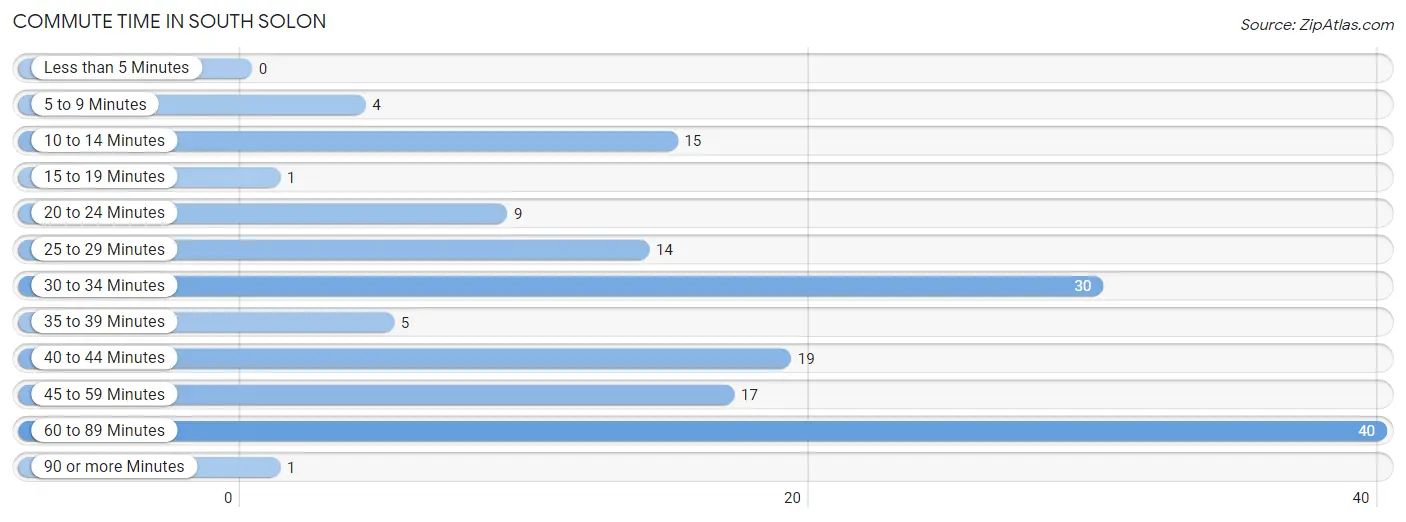
| Commute Time | # Commuters | % Commuters |
| Less than 5 Minutes | 0 | 0.0% |
| 5 to 9 Minutes | 4 | 2.6% |
| 10 to 14 Minutes | 15 | 9.7% |
| 15 to 19 Minutes | 1 | 0.6% |
| 20 to 24 Minutes | 9 | 5.8% |
| 25 to 29 Minutes | 14 | 9.0% |
| 30 to 34 Minutes | 30 | 19.4% |
| 35 to 39 Minutes | 5 | 3.2% |
| 40 to 44 Minutes | 19 | 12.3% |
| 45 to 59 Minutes | 17 | 11.0% |
| 60 to 89 Minutes | 40 | 25.8% |
| 90 or more Minutes | 1 | 0.6% |
Commute Time by Sex in South Solon
The most common commute times in South Solon are 60 to 89 minutes (23 commuters, 23.0%) for males and 60 to 89 minutes (17 commuters, 30.9%) for females.
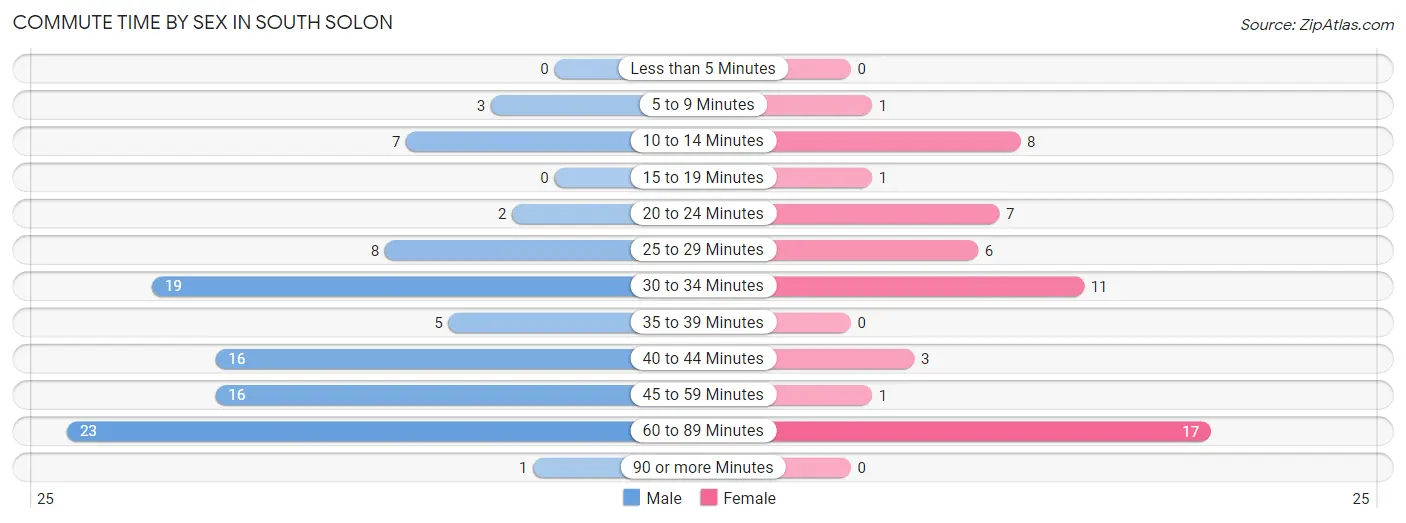
| Commute Time | Male | Female |
| Less than 5 Minutes | 0 (0.0%) | 0 (0.0%) |
| 5 to 9 Minutes | 3 (3.0%) | 1 (1.8%) |
| 10 to 14 Minutes | 7 (7.0%) | 8 (14.5%) |
| 15 to 19 Minutes | 0 (0.0%) | 1 (1.8%) |
| 20 to 24 Minutes | 2 (2.0%) | 7 (12.7%) |
| 25 to 29 Minutes | 8 (8.0%) | 6 (10.9%) |
| 30 to 34 Minutes | 19 (19.0%) | 11 (20.0%) |
| 35 to 39 Minutes | 5 (5.0%) | 0 (0.0%) |
| 40 to 44 Minutes | 16 (16.0%) | 3 (5.4%) |
| 45 to 59 Minutes | 16 (16.0%) | 1 (1.8%) |
| 60 to 89 Minutes | 23 (23.0%) | 17 (30.9%) |
| 90 or more Minutes | 1 (1.0%) | 0 (0.0%) |
Time of Departure to Work by Sex in South Solon
The most frequent times of departure to work in South Solon are 12:00 AM to 4:59 AM (29, 29.0%) for males and 6:00 AM to 6:29 AM (14, 25.5%) for females.
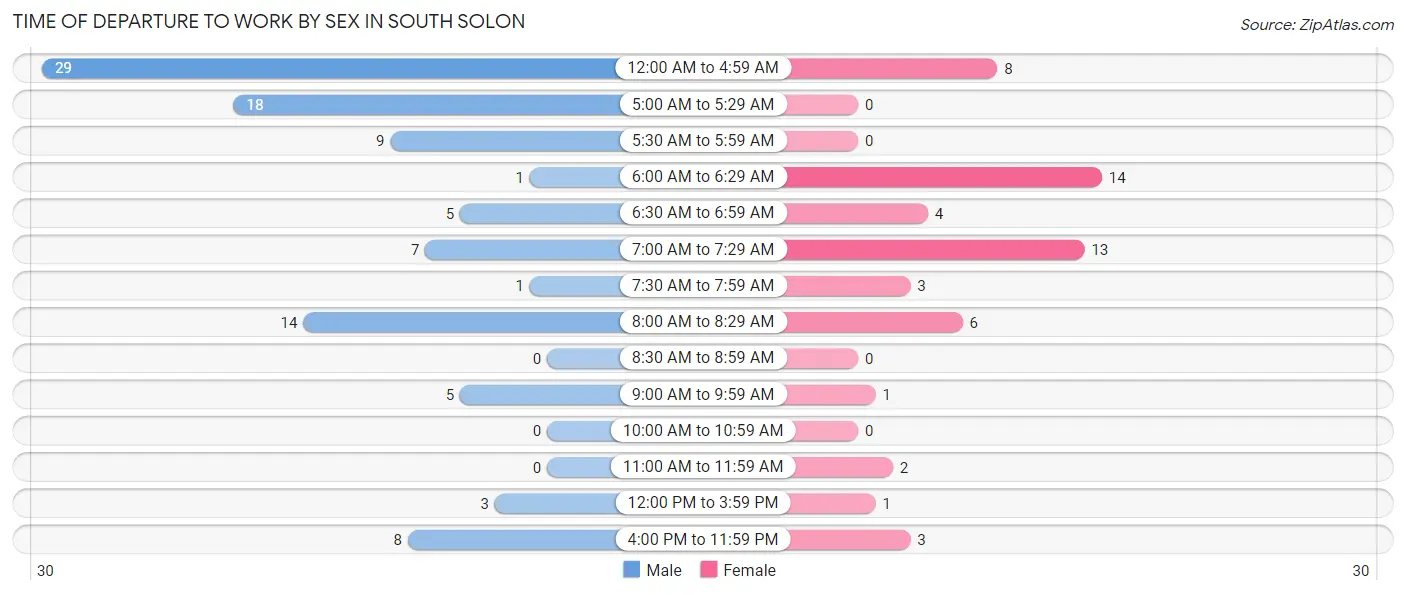
| Time of Departure | Male | Female |
| 12:00 AM to 4:59 AM | 29 (29.0%) | 8 (14.5%) |
| 5:00 AM to 5:29 AM | 18 (18.0%) | 0 (0.0%) |
| 5:30 AM to 5:59 AM | 9 (9.0%) | 0 (0.0%) |
| 6:00 AM to 6:29 AM | 1 (1.0%) | 14 (25.5%) |
| 6:30 AM to 6:59 AM | 5 (5.0%) | 4 (7.3%) |
| 7:00 AM to 7:29 AM | 7 (7.0%) | 13 (23.6%) |
| 7:30 AM to 7:59 AM | 1 (1.0%) | 3 (5.4%) |
| 8:00 AM to 8:29 AM | 14 (14.0%) | 6 (10.9%) |
| 8:30 AM to 8:59 AM | 0 (0.0%) | 0 (0.0%) |
| 9:00 AM to 9:59 AM | 5 (5.0%) | 1 (1.8%) |
| 10:00 AM to 10:59 AM | 0 (0.0%) | 0 (0.0%) |
| 11:00 AM to 11:59 AM | 0 (0.0%) | 2 (3.6%) |
| 12:00 PM to 3:59 PM | 3 (3.0%) | 1 (1.8%) |
| 4:00 PM to 11:59 PM | 8 (8.0%) | 3 (5.4%) |
| Total | 100 (100.0%) | 55 (100.0%) |
Housing Occupancy in South Solon
Occupancy by Ownership in South Solon
Of the total 136 dwellings in South Solon, owner-occupied units account for 93 (68.4%), while renter-occupied units make up 43 (31.6%).
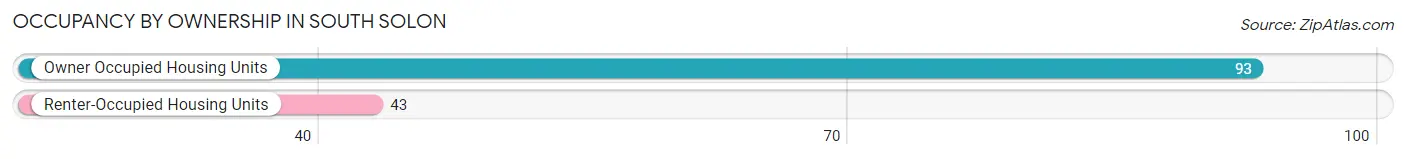
| Occupancy | # Housing Units | % Housing Units |
| Owner Occupied Housing Units | 93 | 68.4% |
| Renter-Occupied Housing Units | 43 | 31.6% |
| Total Occupied Housing Units | 136 | 100.0% |
Occupancy by Household Size in South Solon
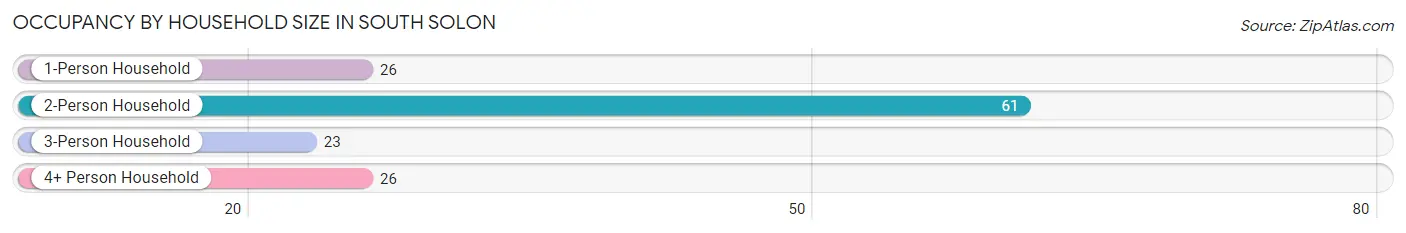
| Household Size | # Housing Units | % Housing Units |
| 1-Person Household | 26 | 19.1% |
| 2-Person Household | 61 | 44.9% |
| 3-Person Household | 23 | 16.9% |
| 4+ Person Household | 26 | 19.1% |
| Total Housing Units | 136 | 100.0% |
Occupancy by Ownership by Household Size in South Solon
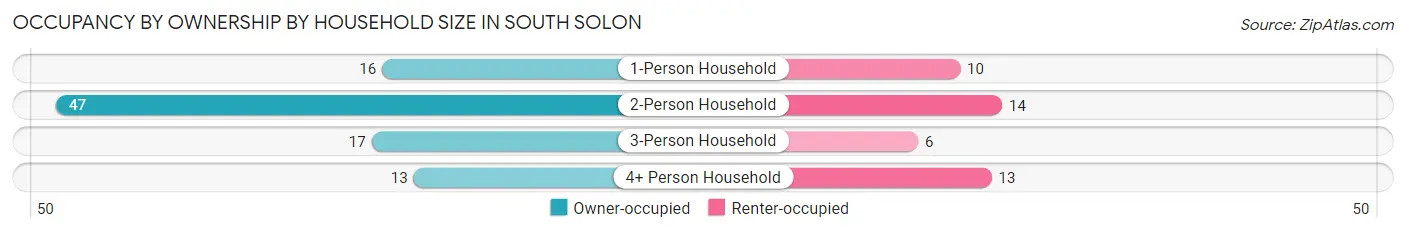
| Household Size | Owner-occupied | Renter-occupied |
| 1-Person Household | 16 (61.5%) | 10 (38.5%) |
| 2-Person Household | 47 (77.0%) | 14 (23.0%) |
| 3-Person Household | 17 (73.9%) | 6 (26.1%) |
| 4+ Person Household | 13 (50.0%) | 13 (50.0%) |
| Total Housing Units | 93 (68.4%) | 43 (31.6%) |
Occupancy by Educational Attainment in South Solon
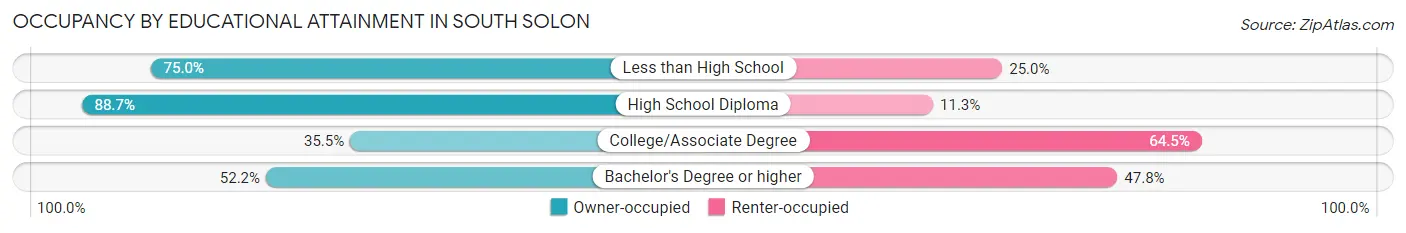
| Household Size | Owner-occupied | Renter-occupied |
| Less than High School | 15 (75.0%) | 5 (25.0%) |
| High School Diploma | 55 (88.7%) | 7 (11.3%) |
| College/Associate Degree | 11 (35.5%) | 20 (64.5%) |
| Bachelor's Degree or higher | 12 (52.2%) | 11 (47.8%) |
Occupancy by Age of Householder in South Solon
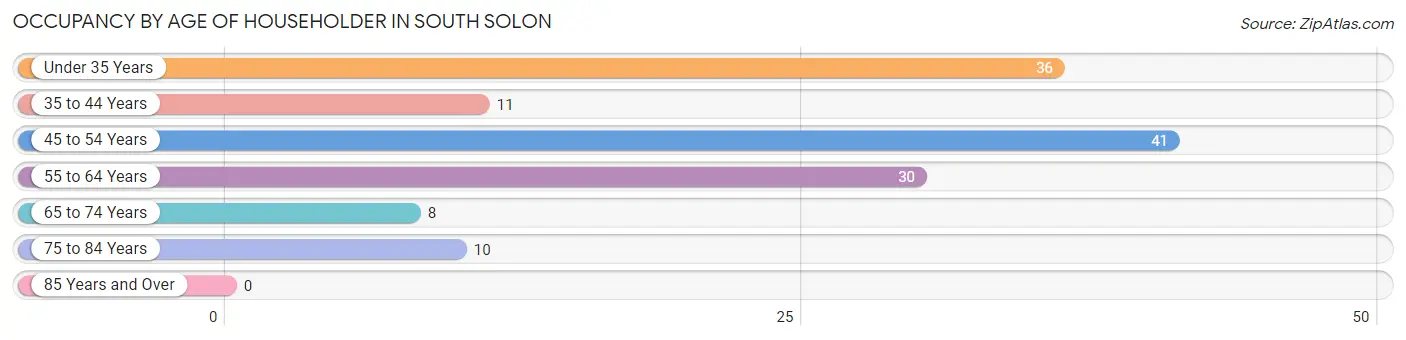
| Age Bracket | # Households | % Households |
| Under 35 Years | 36 | 26.5% |
| 35 to 44 Years | 11 | 8.1% |
| 45 to 54 Years | 41 | 30.1% |
| 55 to 64 Years | 30 | 22.1% |
| 65 to 74 Years | 8 | 5.9% |
| 75 to 84 Years | 10 | 7.3% |
| 85 Years and Over | 0 | 0.0% |
| Total | 136 | 100.0% |
Housing Finances in South Solon
Median Income by Occupancy in South Solon
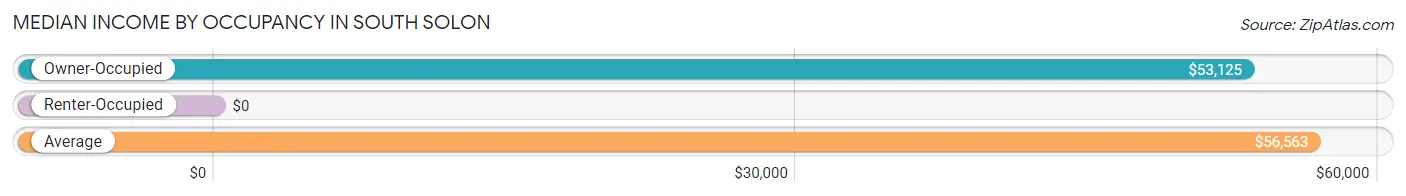
| Occupancy Type | # Households | Median Income |
| Owner-Occupied | 93 (68.4%) | $53,125 |
| Renter-Occupied | 43 (31.6%) | $0 |
| Average | 136 (100.0%) | $56,563 |
Occupancy by Householder Income Bracket in South Solon
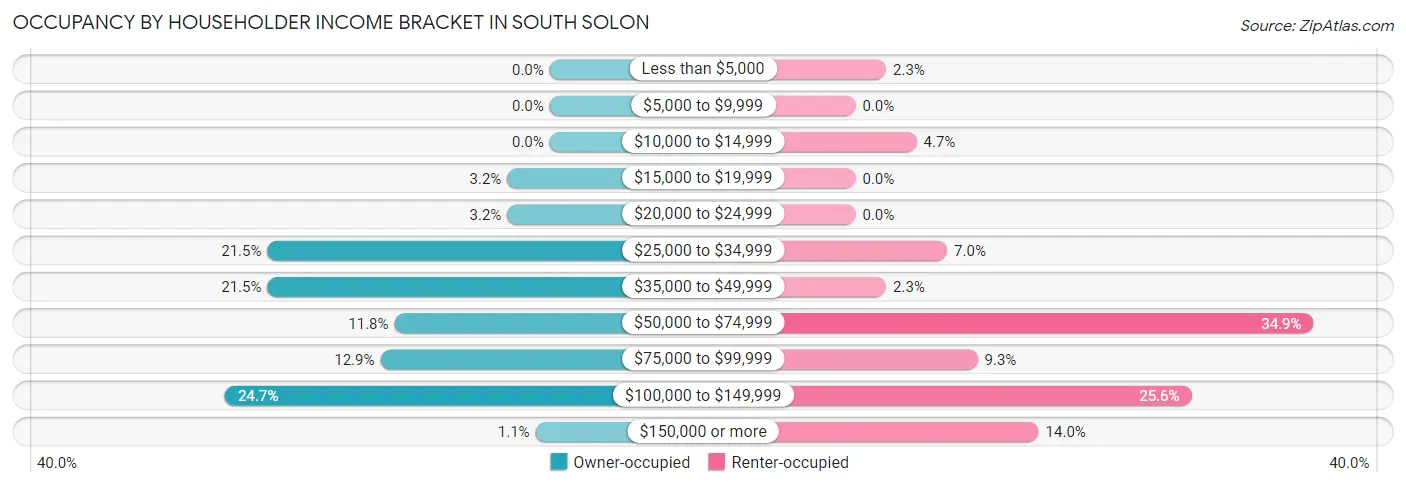
| Income Bracket | Owner-occupied | Renter-occupied |
| Less than $5,000 | 0 (0.0%) | 1 (2.3%) |
| $5,000 to $9,999 | 0 (0.0%) | 0 (0.0%) |
| $10,000 to $14,999 | 0 (0.0%) | 2 (4.6%) |
| $15,000 to $19,999 | 3 (3.2%) | 0 (0.0%) |
| $20,000 to $24,999 | 3 (3.2%) | 0 (0.0%) |
| $25,000 to $34,999 | 20 (21.5%) | 3 (7.0%) |
| $35,000 to $49,999 | 20 (21.5%) | 1 (2.3%) |
| $50,000 to $74,999 | 11 (11.8%) | 15 (34.9%) |
| $75,000 to $99,999 | 12 (12.9%) | 4 (9.3%) |
| $100,000 to $149,999 | 23 (24.7%) | 11 (25.6%) |
| $150,000 or more | 1 (1.1%) | 6 (14.0%) |
| Total | 93 (100.0%) | 43 (100.0%) |
Monthly Housing Cost Tiers in South Solon
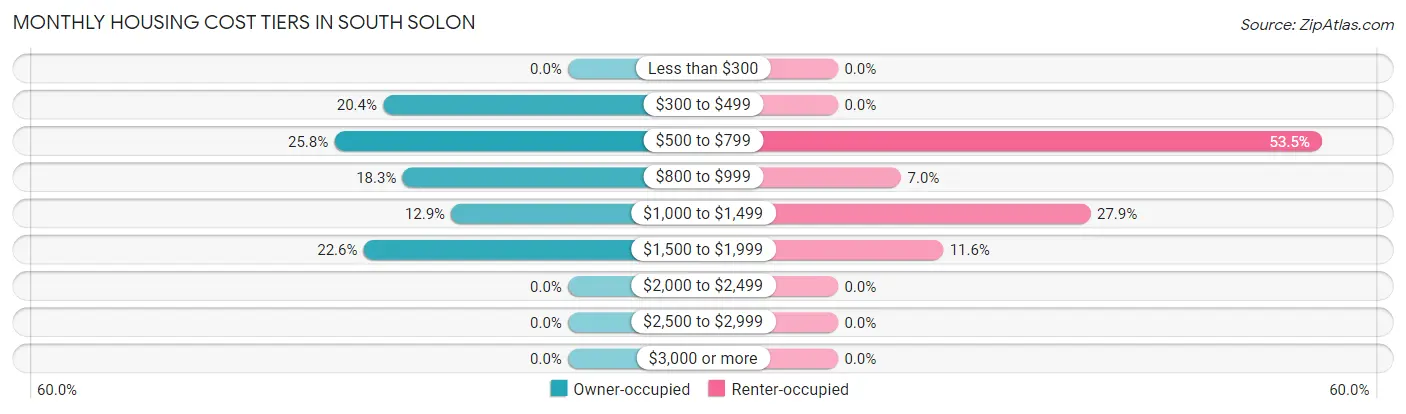
| Monthly Cost | Owner-occupied | Renter-occupied |
| Less than $300 | 0 (0.0%) | 0 (0.0%) |
| $300 to $499 | 19 (20.4%) | 0 (0.0%) |
| $500 to $799 | 24 (25.8%) | 23 (53.5%) |
| $800 to $999 | 17 (18.3%) | 3 (7.0%) |
| $1,000 to $1,499 | 12 (12.9%) | 12 (27.9%) |
| $1,500 to $1,999 | 21 (22.6%) | 5 (11.6%) |
| $2,000 to $2,499 | 0 (0.0%) | 0 (0.0%) |
| $2,500 to $2,999 | 0 (0.0%) | 0 (0.0%) |
| $3,000 or more | 0 (0.0%) | 0 (0.0%) |
| Total | 93 (100.0%) | 43 (100.0%) |
Physical Housing Characteristics in South Solon
Housing Structures in South Solon
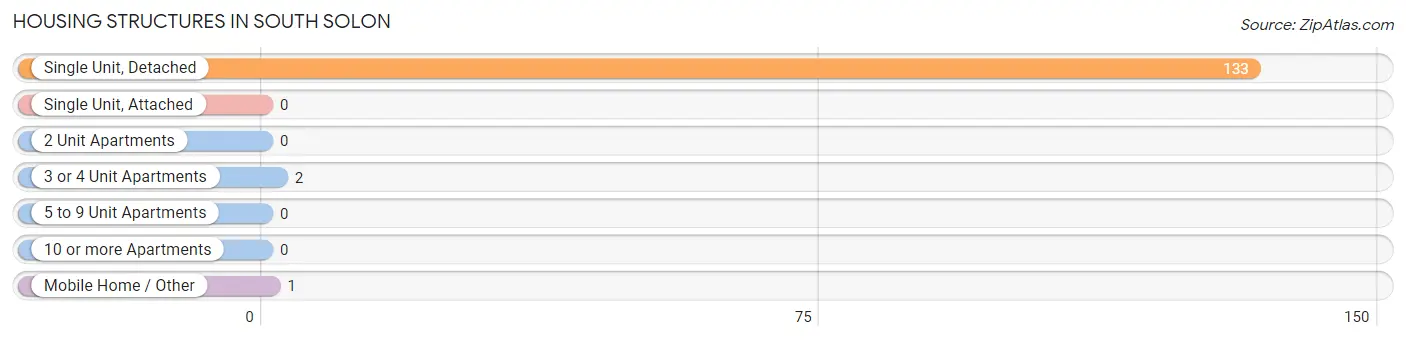
| Structure Type | # Housing Units | % Housing Units |
| Single Unit, Detached | 133 | 97.8% |
| Single Unit, Attached | 0 | 0.0% |
| 2 Unit Apartments | 0 | 0.0% |
| 3 or 4 Unit Apartments | 2 | 1.5% |
| 5 to 9 Unit Apartments | 0 | 0.0% |
| 10 or more Apartments | 0 | 0.0% |
| Mobile Home / Other | 1 | 0.7% |
| Total | 136 | 100.0% |
Housing Structures by Occupancy in South Solon
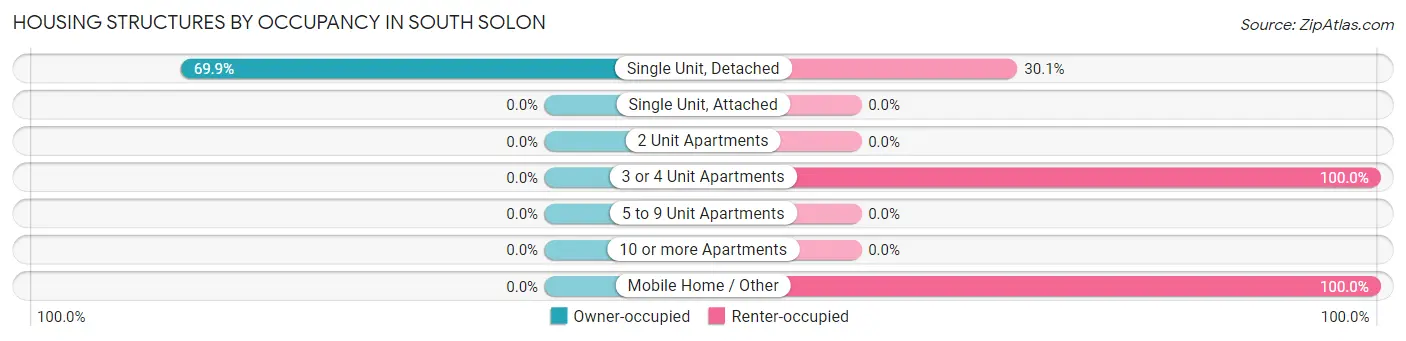
| Structure Type | Owner-occupied | Renter-occupied |
| Single Unit, Detached | 93 (69.9%) | 40 (30.1%) |
| Single Unit, Attached | 0 (0.0%) | 0 (0.0%) |
| 2 Unit Apartments | 0 (0.0%) | 0 (0.0%) |
| 3 or 4 Unit Apartments | 0 (0.0%) | 2 (100.0%) |
| 5 to 9 Unit Apartments | 0 (0.0%) | 0 (0.0%) |
| 10 or more Apartments | 0 (0.0%) | 0 (0.0%) |
| Mobile Home / Other | 0 (0.0%) | 1 (100.0%) |
| Total | 93 (68.4%) | 43 (31.6%) |
Housing Structures by Number of Rooms in South Solon
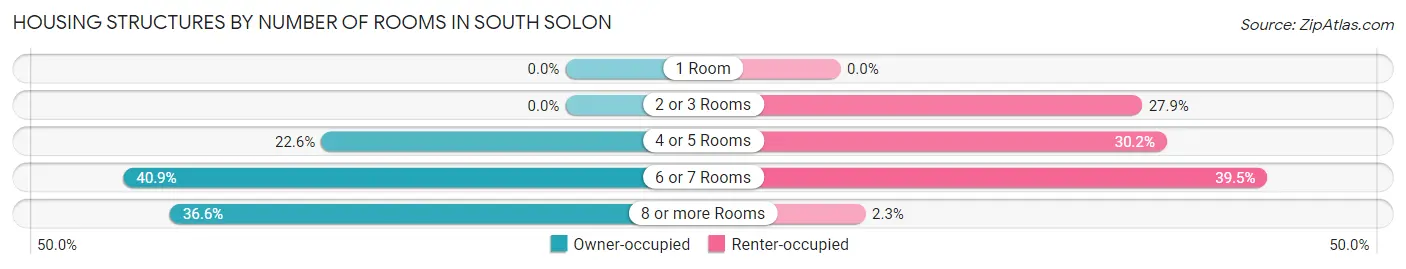
| Number of Rooms | Owner-occupied | Renter-occupied |
| 1 Room | 0 (0.0%) | 0 (0.0%) |
| 2 or 3 Rooms | 0 (0.0%) | 12 (27.9%) |
| 4 or 5 Rooms | 21 (22.6%) | 13 (30.2%) |
| 6 or 7 Rooms | 38 (40.9%) | 17 (39.5%) |
| 8 or more Rooms | 34 (36.6%) | 1 (2.3%) |
| Total | 93 (100.0%) | 43 (100.0%) |
Housing Structure by Heating Type in South Solon
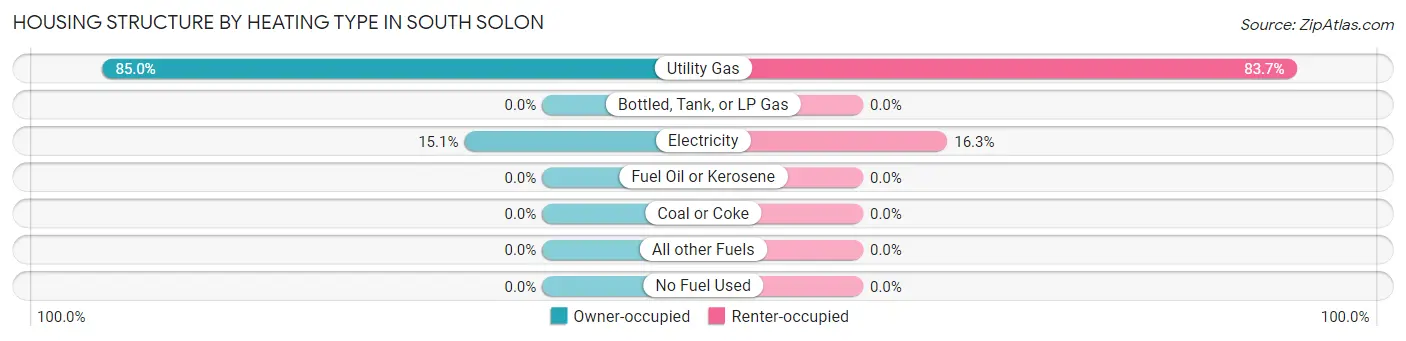
| Heating Type | Owner-occupied | Renter-occupied |
| Utility Gas | 79 (85.0%) | 36 (83.7%) |
| Bottled, Tank, or LP Gas | 0 (0.0%) | 0 (0.0%) |
| Electricity | 14 (15.0%) | 7 (16.3%) |
| Fuel Oil or Kerosene | 0 (0.0%) | 0 (0.0%) |
| Coal or Coke | 0 (0.0%) | 0 (0.0%) |
| All other Fuels | 0 (0.0%) | 0 (0.0%) |
| No Fuel Used | 0 (0.0%) | 0 (0.0%) |
| Total | 93 (100.0%) | 43 (100.0%) |
Household Vehicle Usage in South Solon
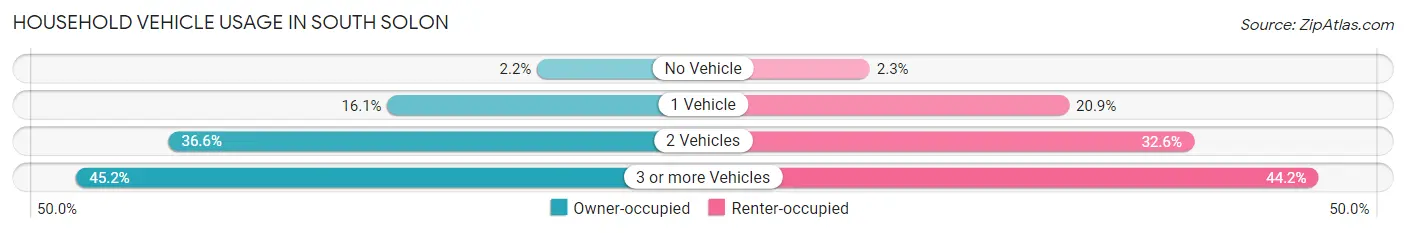
| Vehicles per Household | Owner-occupied | Renter-occupied |
| No Vehicle | 2 (2.1%) | 1 (2.3%) |
| 1 Vehicle | 15 (16.1%) | 9 (20.9%) |
| 2 Vehicles | 34 (36.6%) | 14 (32.6%) |
| 3 or more Vehicles | 42 (45.2%) | 19 (44.2%) |
| Total | 93 (100.0%) | 43 (100.0%) |
Real Estate & Mortgages in South Solon
Real Estate and Mortgage Overview in South Solon
| Characteristic | Without Mortgage | With Mortgage |
| Housing Units | 31 | 62 |
| Median Property Value | $103,800 | $109,400 |
| Median Household Income | $35,625 | $0 |
| Monthly Housing Costs | $482 | $0 |
| Real Estate Taxes | $988 | $1 |
Property Value by Mortgage Status in South Solon
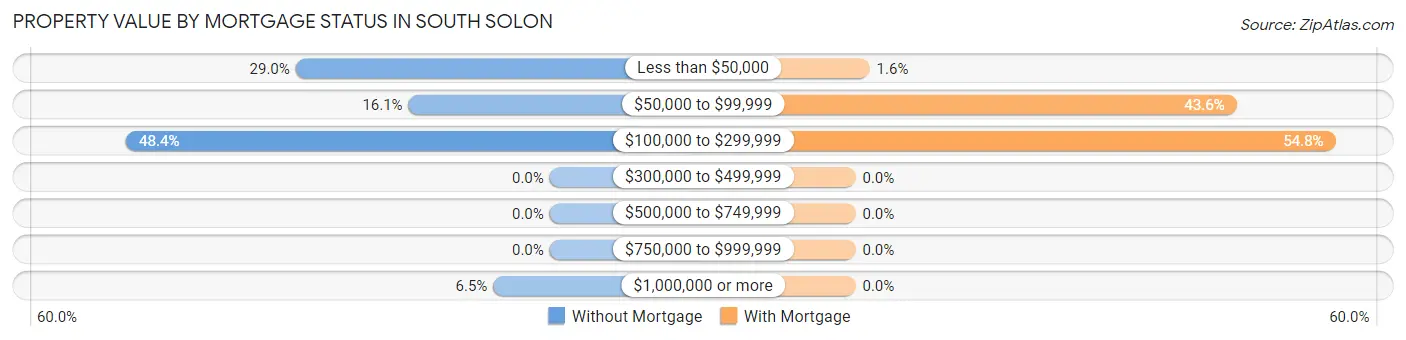
| Property Value | Without Mortgage | With Mortgage |
| Less than $50,000 | 9 (29.0%) | 1 (1.6%) |
| $50,000 to $99,999 | 5 (16.1%) | 27 (43.5%) |
| $100,000 to $299,999 | 15 (48.4%) | 34 (54.8%) |
| $300,000 to $499,999 | 0 (0.0%) | 0 (0.0%) |
| $500,000 to $749,999 | 0 (0.0%) | 0 (0.0%) |
| $750,000 to $999,999 | 0 (0.0%) | 0 (0.0%) |
| $1,000,000 or more | 2 (6.5%) | 0 (0.0%) |
| Total | 31 (100.0%) | 62 (100.0%) |
Household Income by Mortgage Status in South Solon
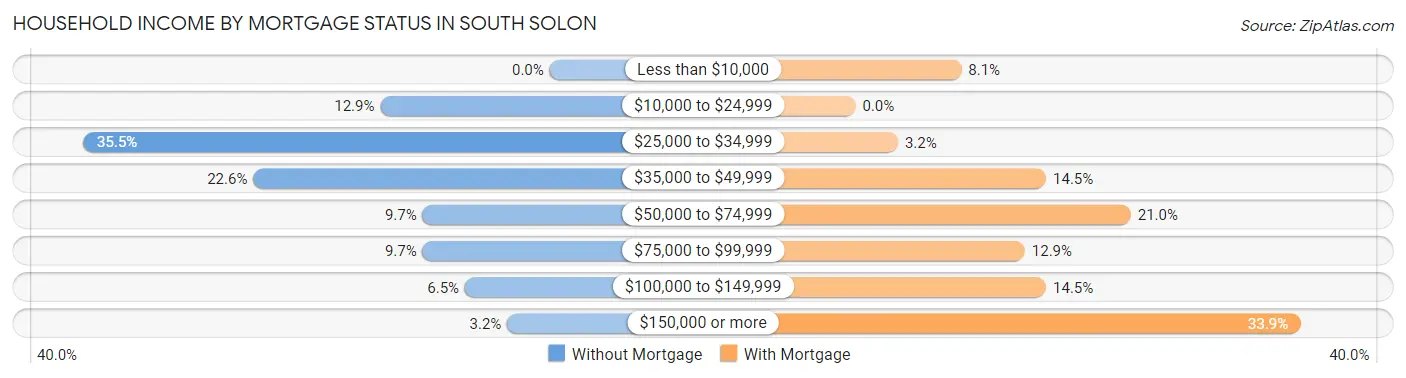
| Household Income | Without Mortgage | With Mortgage |
| Less than $10,000 | 0 (0.0%) | 5 (8.1%) |
| $10,000 to $24,999 | 4 (12.9%) | 0 (0.0%) |
| $25,000 to $34,999 | 11 (35.5%) | 2 (3.2%) |
| $35,000 to $49,999 | 7 (22.6%) | 9 (14.5%) |
| $50,000 to $74,999 | 3 (9.7%) | 13 (21.0%) |
| $75,000 to $99,999 | 3 (9.7%) | 8 (12.9%) |
| $100,000 to $149,999 | 2 (6.5%) | 9 (14.5%) |
| $150,000 or more | 1 (3.2%) | 21 (33.9%) |
| Total | 31 (100.0%) | 62 (100.0%) |
Property Value to Household Income Ratio in South Solon
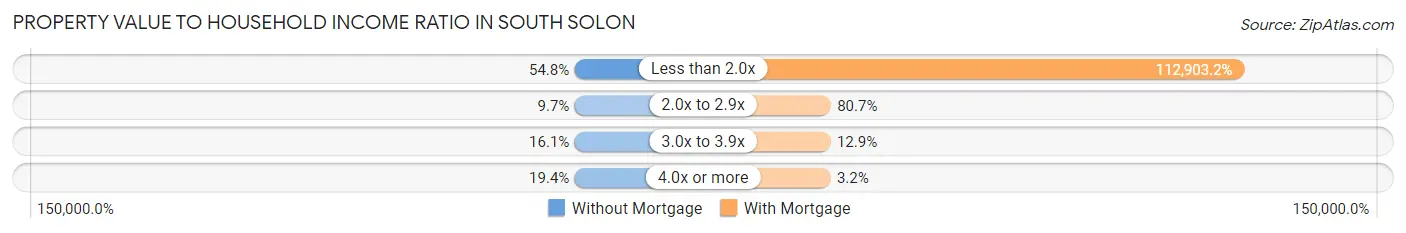
| Value-to-Income Ratio | Without Mortgage | With Mortgage |
| Less than 2.0x | 17 (54.8%) | 70,000 (112,903.2%) |
| 2.0x to 2.9x | 3 (9.7%) | 50 (80.6%) |
| 3.0x to 3.9x | 5 (16.1%) | 8 (12.9%) |
| 4.0x or more | 6 (19.4%) | 2 (3.2%) |
| Total | 31 (100.0%) | 62 (100.0%) |
Real Estate Taxes by Mortgage Status in South Solon
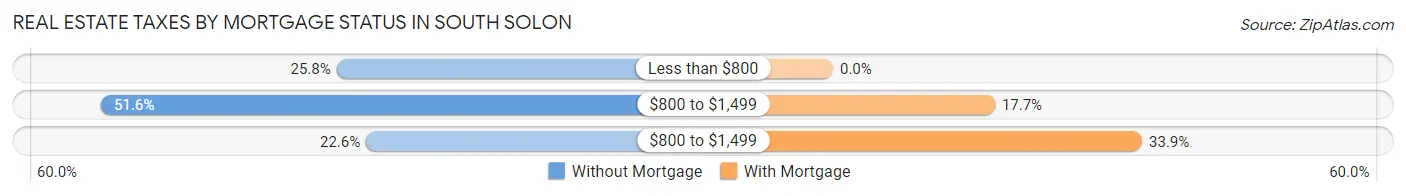
| Property Taxes | Without Mortgage | With Mortgage |
| Less than $800 | 8 (25.8%) | 0 (0.0%) |
| $800 to $1,499 | 16 (51.6%) | 11 (17.7%) |
| $800 to $1,499 | 7 (22.6%) | 21 (33.9%) |
| Total | 31 (100.0%) | 62 (100.0%) |
Health & Disability in South Solon
Health Insurance Coverage by Age in South Solon
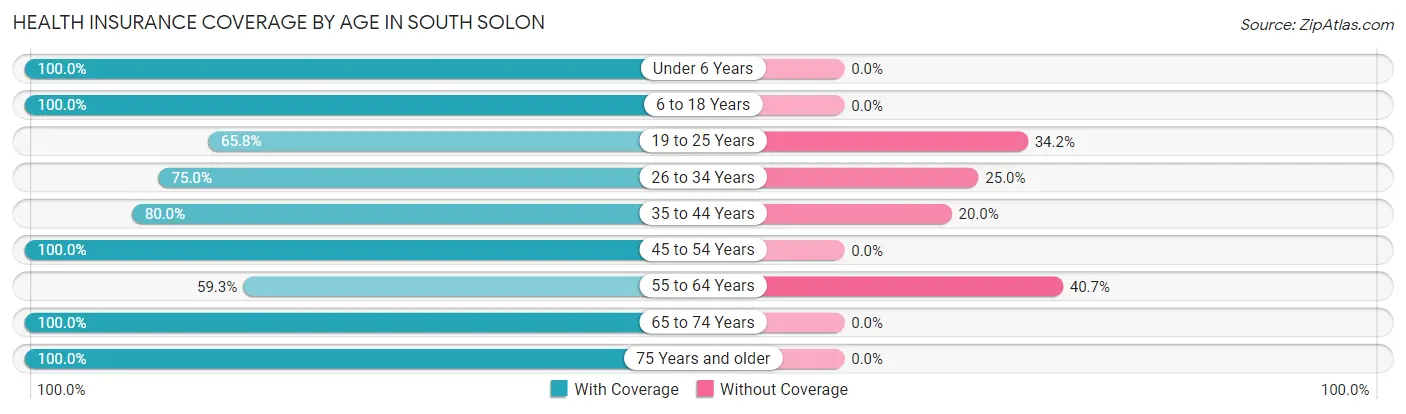
| Age Bracket | With Coverage | Without Coverage |
| Under 6 Years | 21 (100.0%) | 0 (0.0%) |
| 6 to 18 Years | 84 (100.0%) | 0 (0.0%) |
| 19 to 25 Years | 25 (65.8%) | 13 (34.2%) |
| 26 to 34 Years | 27 (75.0%) | 9 (25.0%) |
| 35 to 44 Years | 20 (80.0%) | 5 (20.0%) |
| 45 to 54 Years | 70 (100.0%) | 0 (0.0%) |
| 55 to 64 Years | 48 (59.3%) | 33 (40.7%) |
| 65 to 74 Years | 14 (100.0%) | 0 (0.0%) |
| 75 Years and older | 16 (100.0%) | 0 (0.0%) |
| Total | 325 (84.4%) | 60 (15.6%) |
Health Insurance Coverage by Citizenship Status in South Solon
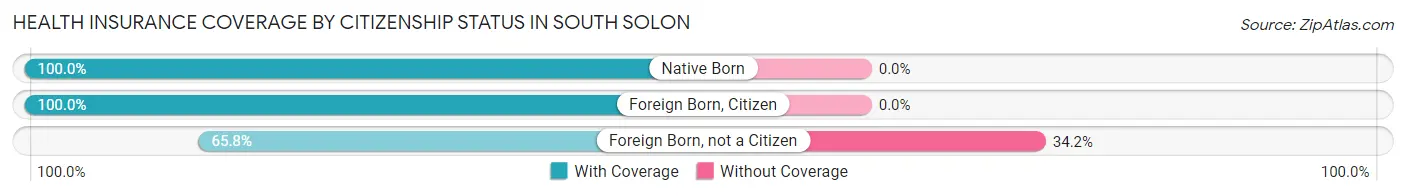
| Citizenship Status | With Coverage | Without Coverage |
| Native Born | 21 (100.0%) | 0 (0.0%) |
| Foreign Born, Citizen | 84 (100.0%) | 0 (0.0%) |
| Foreign Born, not a Citizen | 25 (65.8%) | 13 (34.2%) |
Health Insurance Coverage by Household Income in South Solon
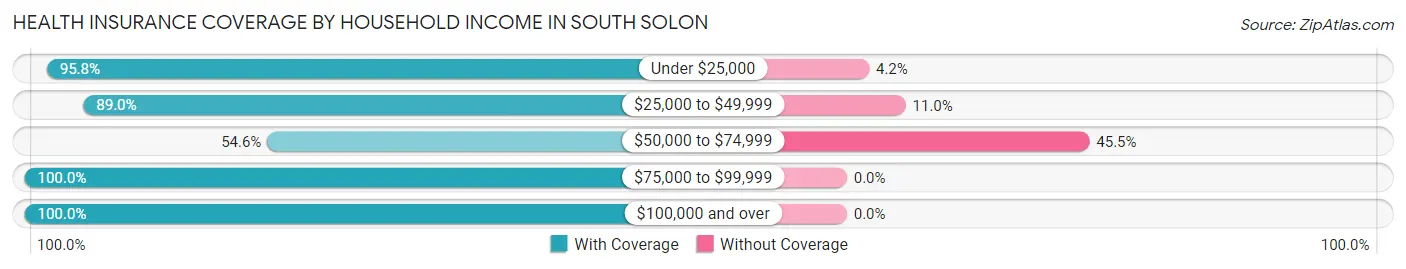
| Household Income | With Coverage | Without Coverage |
| Under $25,000 | 23 (95.8%) | 1 (4.2%) |
| $25,000 to $49,999 | 113 (89.0%) | 14 (11.0%) |
| $50,000 to $74,999 | 54 (54.5%) | 45 (45.5%) |
| $75,000 to $99,999 | 46 (100.0%) | 0 (0.0%) |
| $100,000 and over | 89 (100.0%) | 0 (0.0%) |
Public vs Private Health Insurance Coverage by Age in South Solon
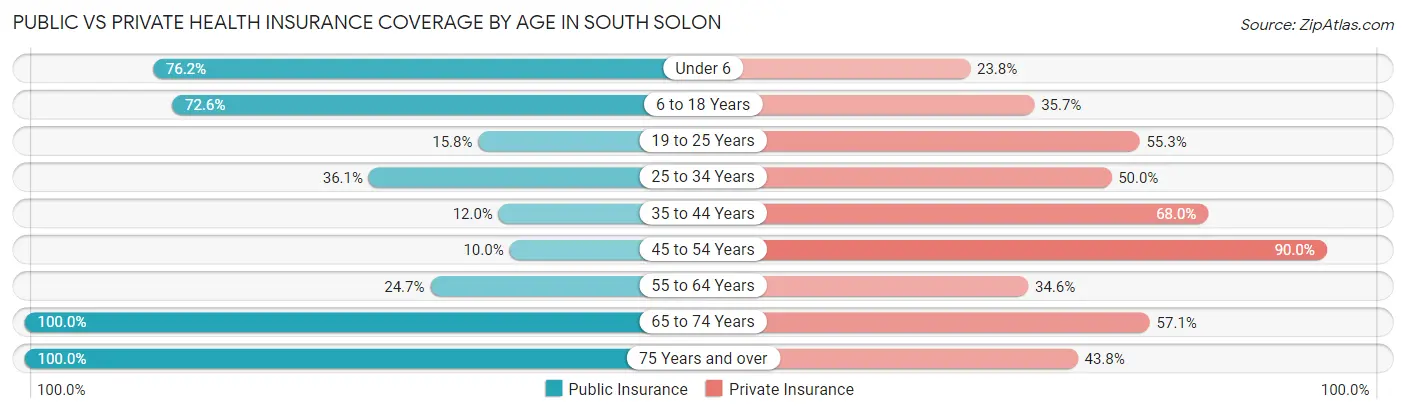
| Age Bracket | Public Insurance | Private Insurance |
| Under 6 | 16 (76.2%) | 5 (23.8%) |
| 6 to 18 Years | 61 (72.6%) | 30 (35.7%) |
| 19 to 25 Years | 6 (15.8%) | 21 (55.3%) |
| 25 to 34 Years | 13 (36.1%) | 18 (50.0%) |
| 35 to 44 Years | 3 (12.0%) | 17 (68.0%) |
| 45 to 54 Years | 7 (10.0%) | 63 (90.0%) |
| 55 to 64 Years | 20 (24.7%) | 28 (34.6%) |
| 65 to 74 Years | 14 (100.0%) | 8 (57.1%) |
| 75 Years and over | 16 (100.0%) | 7 (43.8%) |
| Total | 156 (40.5%) | 197 (51.2%) |
Disability Status by Sex by Age in South Solon
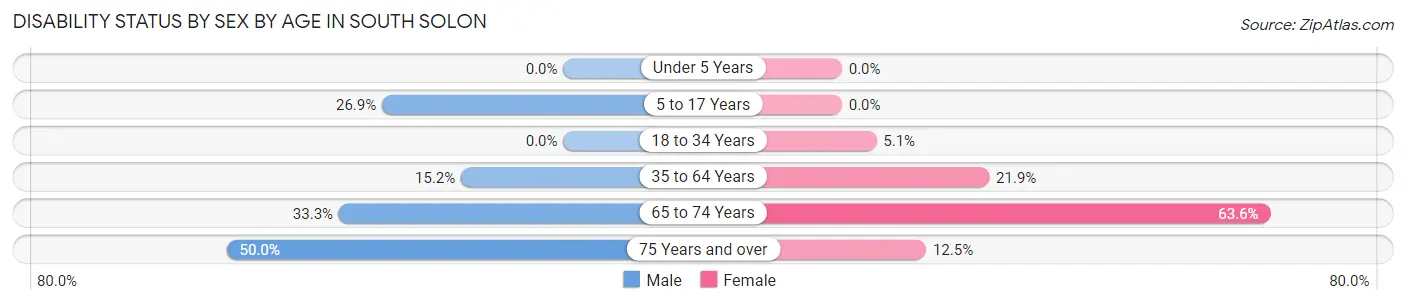
| Age Bracket | Male | Female |
| Under 5 Years | 0 (0.0%) | 0 (0.0%) |
| 5 to 17 Years | 7 (26.9%) | 0 (0.0%) |
| 18 to 34 Years | 0 (0.0%) | 2 (5.1%) |
| 35 to 64 Years | 17 (15.2%) | 14 (21.9%) |
| 65 to 74 Years | 1 (33.3%) | 7 (63.6%) |
| 75 Years and over | 4 (50.0%) | 1 (12.5%) |
Disability Class by Sex by Age in South Solon
Disability Class: Hearing Difficulty
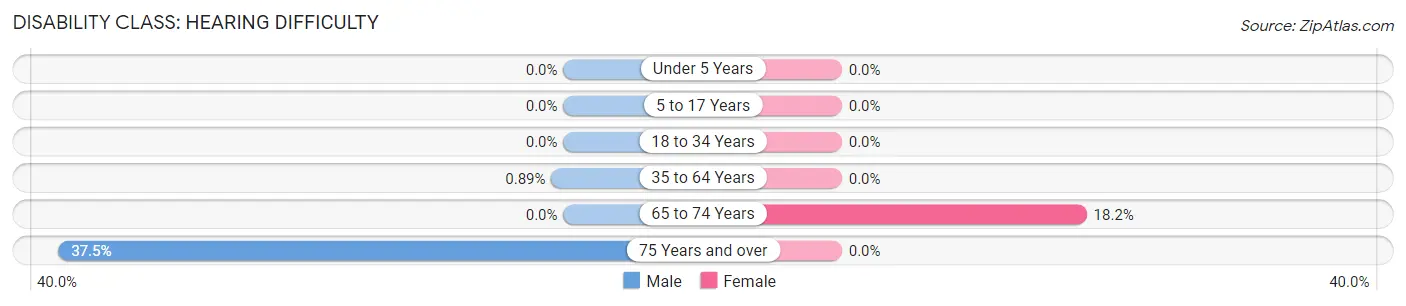
| Age Bracket | Male | Female |
| Under 5 Years | 0 (0.0%) | 0 (0.0%) |
| 5 to 17 Years | 0 (0.0%) | 0 (0.0%) |
| 18 to 34 Years | 0 (0.0%) | 0 (0.0%) |
| 35 to 64 Years | 1 (0.9%) | 0 (0.0%) |
| 65 to 74 Years | 0 (0.0%) | 2 (18.2%) |
| 75 Years and over | 3 (37.5%) | 0 (0.0%) |
Disability Class: Vision Difficulty
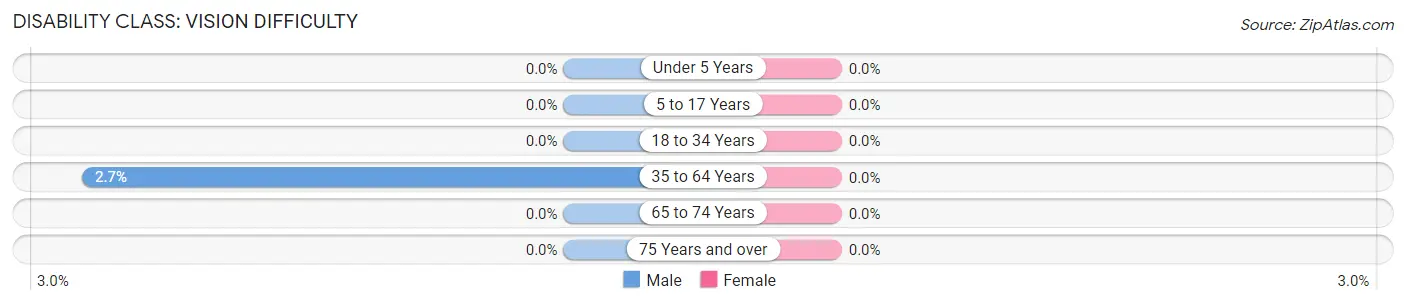
| Age Bracket | Male | Female |
| Under 5 Years | 0 (0.0%) | 0 (0.0%) |
| 5 to 17 Years | 0 (0.0%) | 0 (0.0%) |
| 18 to 34 Years | 0 (0.0%) | 0 (0.0%) |
| 35 to 64 Years | 3 (2.7%) | 0 (0.0%) |
| 65 to 74 Years | 0 (0.0%) | 0 (0.0%) |
| 75 Years and over | 0 (0.0%) | 0 (0.0%) |
Disability Class: Cognitive Difficulty
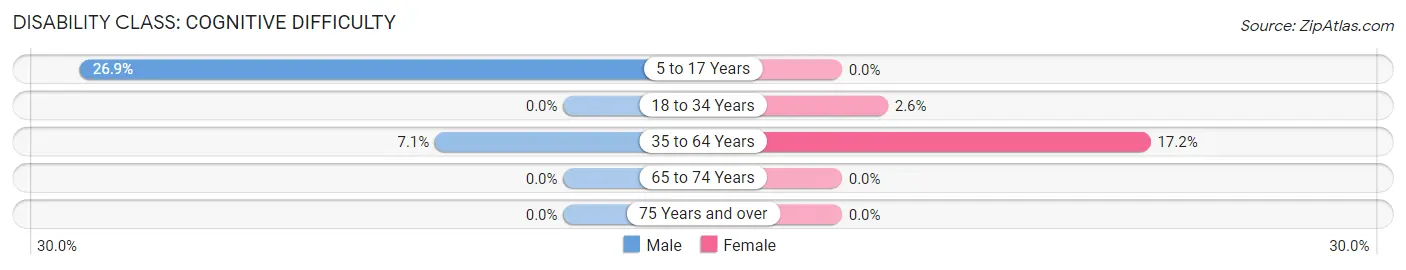
| Age Bracket | Male | Female |
| 5 to 17 Years | 7 (26.9%) | 0 (0.0%) |
| 18 to 34 Years | 0 (0.0%) | 1 (2.6%) |
| 35 to 64 Years | 8 (7.1%) | 11 (17.2%) |
| 65 to 74 Years | 0 (0.0%) | 0 (0.0%) |
| 75 Years and over | 0 (0.0%) | 0 (0.0%) |
Disability Class: Ambulatory Difficulty
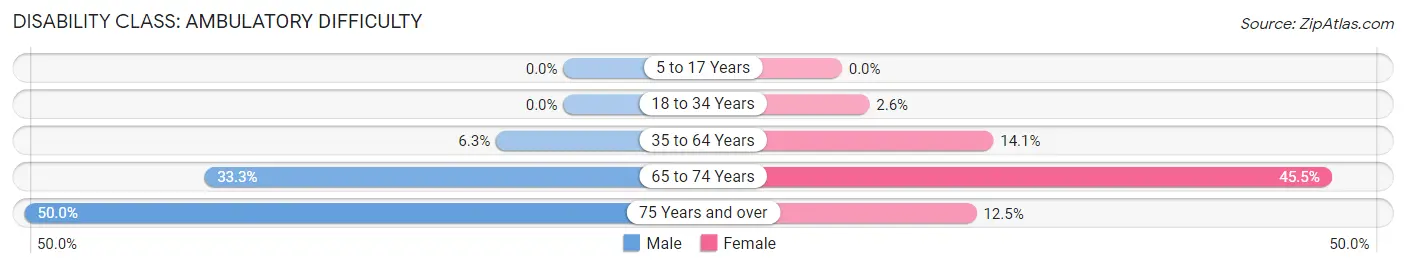
| Age Bracket | Male | Female |
| 5 to 17 Years | 0 (0.0%) | 0 (0.0%) |
| 18 to 34 Years | 0 (0.0%) | 1 (2.6%) |
| 35 to 64 Years | 7 (6.2%) | 9 (14.1%) |
| 65 to 74 Years | 1 (33.3%) | 5 (45.5%) |
| 75 Years and over | 4 (50.0%) | 1 (12.5%) |
Disability Class: Self-Care Difficulty
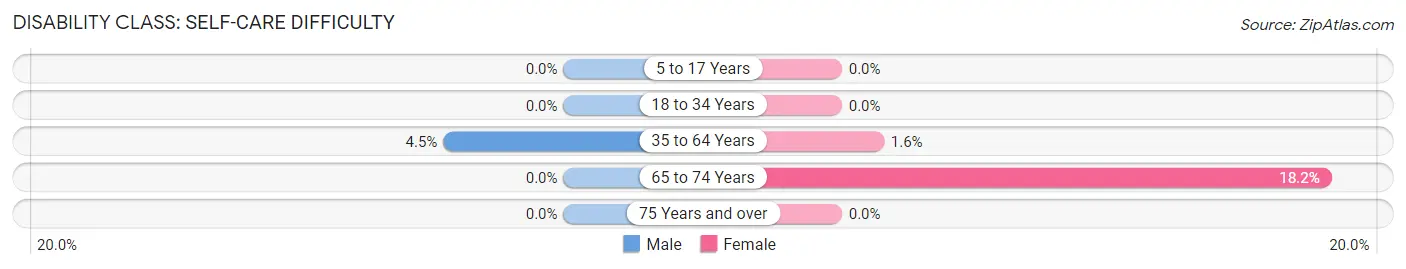
| Age Bracket | Male | Female |
| 5 to 17 Years | 0 (0.0%) | 0 (0.0%) |
| 18 to 34 Years | 0 (0.0%) | 0 (0.0%) |
| 35 to 64 Years | 5 (4.5%) | 1 (1.6%) |
| 65 to 74 Years | 0 (0.0%) | 2 (18.2%) |
| 75 Years and over | 0 (0.0%) | 0 (0.0%) |
Technology Access in South Solon
Computing Device Access in South Solon
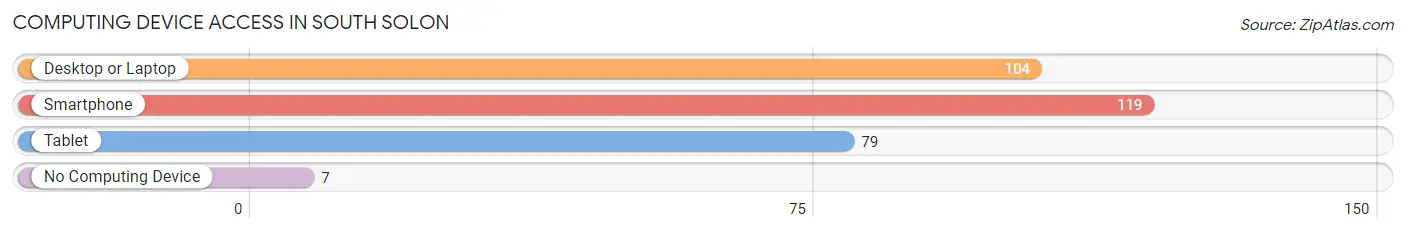
| Device Type | # Households | % Households |
| Desktop or Laptop | 104 | 76.5% |
| Smartphone | 119 | 87.5% |
| Tablet | 79 | 58.1% |
| No Computing Device | 7 | 5.1% |
| Total | 136 | 100.0% |
Internet Access in South Solon
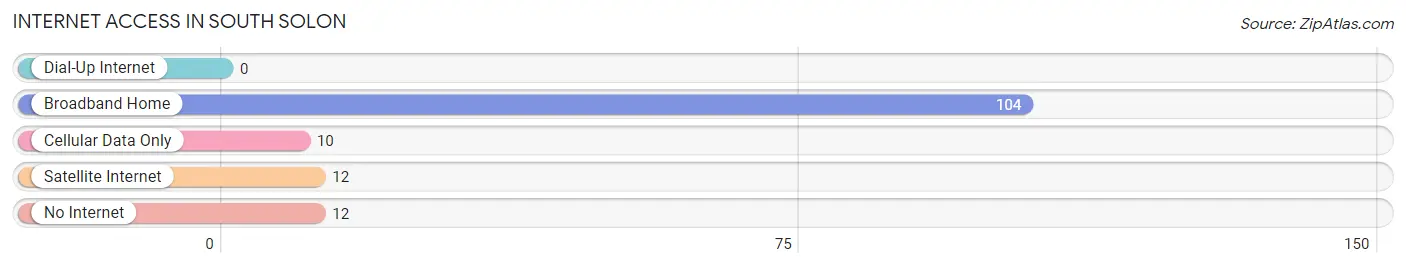
| Internet Type | # Households | % Households |
| Dial-Up Internet | 0 | 0.0% |
| Broadband Home | 104 | 76.5% |
| Cellular Data Only | 10 | 7.3% |
| Satellite Internet | 12 | 8.8% |
| No Internet | 12 | 8.8% |
| Total | 136 | 100.0% |
South Solon Summary
History
South Solon is a small village located in Madison County, Ohio. It is situated in the southwestern part of the county, about 10 miles south of London and 15 miles east of Columbus. The village was founded in 1817 by a group of settlers from New England. The settlers were attracted to the area by the abundance of natural resources, including fertile soil, abundant timber, and plentiful water.
The village was originally known as “Solon”, after the Greek statesman and lawgiver Solon. The name was changed to “South Solon” in 1837 to distinguish it from the nearby village of North Solon.
South Solon was an agricultural community for much of its history. The village was home to several small farms, as well as a few larger ones. The village also had a few small businesses, including a general store, a blacksmith shop, and a sawmill.
In the late 19th century, the village began to experience a period of growth and development. The railroad arrived in 1881, connecting South Solon to the larger cities of London and Columbus. This allowed the village to become a shipping center for agricultural products.
The village also experienced a period of industrial growth in the early 20th century. Several factories were built in the area, including a brickyard, a canning factory, and a furniture factory. These factories provided employment for many of the village’s residents.
Geography
South Solon is located in southwestern Madison County, Ohio. It is situated in the southwestern part of the county, about 10 miles south of London and 15 miles east of Columbus. The village is located on the banks of the Big Darby Creek, which flows through the area.
The village is surrounded by rolling hills and farmland. The area is mostly rural, with a few small towns and villages scattered throughout the countryside. The nearest major city is Columbus, which is located about 15 miles to the east.
The climate in South Solon is typical of the Midwest. Summers are hot and humid, with temperatures reaching into the 90s. Winters are cold and snowy, with temperatures often dropping below freezing.
Economy
South Solon’s economy is largely based on agriculture. The village is home to several small farms, as well as a few larger ones. The village also has a few small businesses, including a general store, a blacksmith shop, and a sawmill.
The village is also home to several factories, including a brickyard, a canning factory, and a furniture factory. These factories provide employment for many of the village’s residents.
The village is also home to a few tourist attractions, including a historic covered bridge and a museum. These attractions draw visitors from all over the region.
Demographics
As of the 2010 census, South Solon had a population of 1,093. The population is mostly white (97.2%), with a small percentage of African Americans (1.2%) and Hispanics (1.6%). The median household income is $45,000, and the median home value is $125,000.
The village is served by the Madison-Plains Local School District. The district has one elementary school, one middle school, and one high school. The village also has a public library and a post office.
Common Questions
What is Per Capita Income in South Solon?
Per Capita income in South Solon is $28,709.
What is the Median Family Income in South Solon?
Median Family Income in South Solon is $78,000.
What is the Median Household income in South Solon?
Median Household Income in South Solon is $56,563.
What is Inequality or Gini Index in South Solon?
Inequality or Gini Index in South Solon is 0.36.
What is the Total Population of South Solon?
Total Population of South Solon is 385.
What is the Total Male Population of South Solon?
Total Male Population of South Solon is 195.
What is the Total Female Population of South Solon?
Total Female Population of South Solon is 190.
What is the Ratio of Males per 100 Females in South Solon?
There are 102.63 Males per 100 Females in South Solon.
What is the Ratio of Females per 100 Males in South Solon?
There are 97.44 Females per 100 Males in South Solon.
What is the Median Population Age in South Solon?
Median Population Age in South Solon is 39.8 Years.
What is the Average Family Size in South Solon
Average Family Size in South Solon is 3.2 People.
What is the Average Household Size in South Solon
Average Household Size in South Solon is 2.8 People.
How Large is the Labor Force in South Solon?
There are 182 People in the Labor Forcein in South Solon.
What is the Percentage of People in the Labor Force in South Solon?
61.9% of People are in the Labor Force in South Solon.
What is the Unemployment Rate in South Solon?
Unemployment Rate in South Solon is 4.9%.