Cities with the Highest Percentage of Immigrants from Asia in Ohio
RELATED REPORTS & OPTIONS
Asia
Ohio
Compare Cities
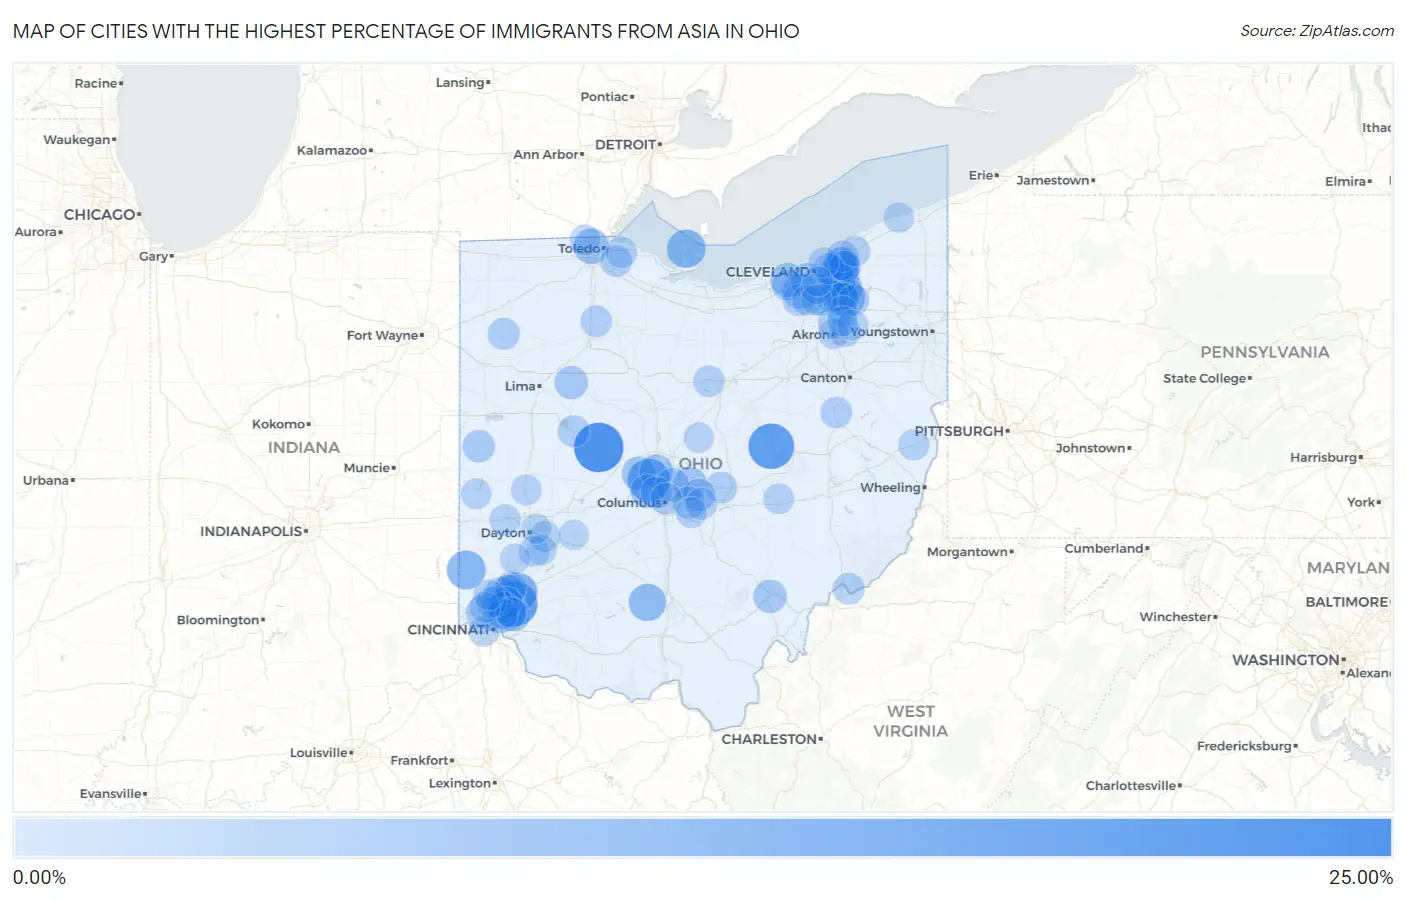
Map of Cities with the Highest Percentage of Immigrants from Asia in Ohio
0.00%
25.00%
Cities with the Highest Percentage of Immigrants from Asia in Ohio
| City | Asia | vs State | vs National | |
| 1. | East Liberty | 22.03% | 2.06%(+20.0)#1 | 4.26%(+17.8)#231 |
| 2. | Nellie | 18.18% | 2.06%(+16.1)#2 | 4.26%(+13.9)#348 |
| 3. | Sixteen Mile Stand | 17.54% | 2.06%(+15.5)#3 | 4.26%(+13.3)#371 |
| 4. | Dublin | 14.96% | 2.06%(+12.9)#4 | 4.26%(+10.7)#485 |
| 5. | Mason | 12.30% | 2.06%(+10.2)#5 | 4.26%(+8.04)#663 |
| 6. | Solon | 11.88% | 2.06%(+9.82)#6 | 4.26%(+7.62)#700 |
| 7. | Oxford | 11.54% | 2.06%(+9.48)#7 | 4.26%(+7.28)#731 |
| 8. | Put In Bay | 11.24% | 2.06%(+9.18)#8 | 4.26%(+6.98)#752 |
| 9. | Pepper Pike | 10.62% | 2.06%(+8.56)#9 | 4.26%(+6.36)#829 |
| 10. | Glenwillow | 10.60% | 2.06%(+8.54)#10 | 4.26%(+6.34)#833 |
| 11. | Reminderville | 10.57% | 2.06%(+8.52)#11 | 4.26%(+6.31)#838 |
| 12. | Bourneville | 10.08% | 2.06%(+8.02)#12 | 4.26%(+5.82)#917 |
| 13. | Blue Ash | 9.68% | 2.06%(+7.62)#13 | 4.26%(+5.42)#960 |
| 14. | Mayfield Heights | 8.77% | 2.06%(+6.71)#14 | 4.26%(+4.51)#1,110 |
| 15. | Ottawa Hills | 8.34% | 2.06%(+6.28)#15 | 4.26%(+4.08)#1,196 |
| 16. | Middleburg Heights | 7.73% | 2.06%(+5.67)#16 | 4.26%(+3.47)#1,328 |
| 17. | Beachwood | 7.56% | 2.06%(+5.50)#17 | 4.26%(+3.30)#1,357 |
| 18. | Maria Stein | 7.19% | 2.06%(+5.13)#18 | 4.26%(+2.93)#1,453 |
| 19. | Kenwood | 7.18% | 2.06%(+5.12)#19 | 4.26%(+2.92)#1,456 |
| 20. | Westlake | 6.99% | 2.06%(+4.93)#20 | 4.26%(+2.73)#1,506 |
| 21. | New California | 6.97% | 2.06%(+4.91)#21 | 4.26%(+2.71)#1,516 |
| 22. | Brooklyn | 6.95% | 2.06%(+4.90)#22 | 4.26%(+2.69)#1,519 |
| 23. | Golf Manor | 6.81% | 2.06%(+4.76)#23 | 4.26%(+2.55)#1,559 |
| 24. | Powell | 6.77% | 2.06%(+4.71)#24 | 4.26%(+2.51)#1,576 |
| 25. | Orange | 6.70% | 2.06%(+4.64)#25 | 4.26%(+2.44)#1,594 |
| 26. | Hilliard | 6.69% | 2.06%(+4.63)#26 | 4.26%(+2.43)#1,596 |
| 27. | Sharon Center | 6.68% | 2.06%(+4.62)#27 | 4.26%(+2.42)#1,602 |
| 28. | New Albany | 6.63% | 2.06%(+4.57)#28 | 4.26%(+2.37)#1,615 |
| 29. | Beckett Ridge | 6.46% | 2.06%(+4.40)#29 | 4.26%(+2.20)#1,657 |
| 30. | Minerva Park | 6.44% | 2.06%(+4.38)#30 | 4.26%(+2.18)#1,666 |
| 31. | Athens | 6.35% | 2.06%(+4.29)#31 | 4.26%(+2.09)#1,691 |
| 32. | Ada | 6.35% | 2.06%(+4.29)#32 | 4.26%(+2.09)#1,694 |
| 33. | Highland Heights | 6.02% | 2.06%(+3.96)#33 | 4.26%(+1.76)#1,781 |
| 34. | White Oak | 5.93% | 2.06%(+3.87)#34 | 4.26%(+1.67)#1,815 |
| 35. | Mayfield | 5.80% | 2.06%(+3.74)#35 | 4.26%(+1.54)#1,871 |
| 36. | Twinsburg | 5.55% | 2.06%(+3.49)#36 | 4.26%(+1.29)#1,964 |
| 37. | The Village Of Indian Hill | 5.54% | 2.06%(+3.48)#37 | 4.26%(+1.28)#1,970 |
| 38. | Wetherington | 5.42% | 2.06%(+3.36)#38 | 4.26%(+1.16)#2,016 |
| 39. | Pataskala | 5.41% | 2.06%(+3.35)#39 | 4.26%(+1.15)#2,018 |
| 40. | New Weston | 5.38% | 2.06%(+3.32)#40 | 4.26%(+1.12)#2,041 |
| 41. | Strongsville | 5.18% | 2.06%(+3.12)#41 | 4.26%(+0.917)#2,115 |
| 42. | Reynoldsburg | 5.10% | 2.06%(+3.04)#42 | 4.26%(+0.842)#2,149 |
| 43. | Cuyahoga Falls | 4.94% | 2.06%(+2.88)#43 | 4.26%(+0.675)#2,232 |
| 44. | Upper Arlington | 4.93% | 2.06%(+2.87)#44 | 4.26%(+0.668)#2,236 |
| 45. | Melrose | 4.90% | 2.06%(+2.84)#45 | 4.26%(+0.637)#2,251 |
| 46. | Northfield | 4.88% | 2.06%(+2.82)#46 | 4.26%(+0.618)#2,262 |
| 47. | Four Bridges | 4.87% | 2.06%(+2.81)#47 | 4.26%(+0.610)#2,267 |
| 48. | Reno | 4.86% | 2.06%(+2.81)#48 | 4.26%(+0.605)#2,269 |
| 49. | Sharonville | 4.85% | 2.06%(+2.79)#49 | 4.26%(+0.589)#2,281 |
| 50. | Huntsville | 4.83% | 2.06%(+2.77)#50 | 4.26%(+0.572)#2,286 |
| 51. | Columbus | 4.82% | 2.06%(+2.76)#51 | 4.26%(+0.562)#2,292 |
| 52. | Granville | 4.76% | 2.06%(+2.70)#52 | 4.26%(+0.499)#2,327 |
| 53. | Millbury | 4.62% | 2.06%(+2.56)#53 | 4.26%(+0.356)#2,407 |
| 54. | Bairdstown | 4.59% | 2.06%(+2.53)#54 | 4.26%(+0.327)#2,425 |
| 55. | Brecksville | 4.53% | 2.06%(+2.47)#55 | 4.26%(+0.270)#2,463 |
| 56. | Parral | 4.48% | 2.06%(+2.42)#56 | 4.26%(+0.224)#2,491 |
| 57. | Curtice | 4.46% | 2.06%(+2.40)#57 | 4.26%(+0.203)#2,500 |
| 58. | Willoughby Hills | 4.46% | 2.06%(+2.40)#58 | 4.26%(+0.202)#2,501 |
| 59. | Ontario | 4.44% | 2.06%(+2.38)#59 | 4.26%(+0.181)#2,511 |
| 60. | Etna | 4.38% | 2.06%(+2.32)#60 | 4.26%(+0.124)#2,546 |
| 61. | Tallmadge | 4.36% | 2.06%(+2.30)#61 | 4.26%(+0.101)#2,558 |
| 62. | Evendale | 4.36% | 2.06%(+2.30)#62 | 4.26%(+0.096)#2,562 |
| 63. | Cleveland Heights | 4.28% | 2.06%(+2.22)#63 | 4.26%(+0.022)#2,625 |
| 64. | Gates Mills | 4.26% | 2.06%(+2.20)#64 | 4.26%(+0.003)#2,635 |
| 65. | North Olmsted | 4.24% | 2.06%(+2.18)#65 | 4.26%(-0.021)#2,657 |
| 66. | Brookville | 4.21% | 2.06%(+2.15)#66 | 4.26%(-0.052)#2,687 |
| 67. | Delshire | 4.06% | 2.06%(+2.00)#67 | 4.26%(-0.204)#2,790 |
| 68. | Aurora | 4.05% | 2.06%(+1.99)#68 | 4.26%(-0.214)#2,796 |
| 69. | Bloomingdale | 4.04% | 2.06%(+1.98)#69 | 4.26%(-0.220)#2,799 |
| 70. | Springdale | 4.00% | 2.06%(+1.94)#70 | 4.26%(-0.257)#2,824 |
| 71. | North Royalton | 3.98% | 2.06%(+1.92)#71 | 4.26%(-0.282)#2,839 |
| 72. | Amberley | 3.97% | 2.06%(+1.92)#72 | 4.26%(-0.285)#2,842 |
| 73. | Pickerington | 3.97% | 2.06%(+1.91)#73 | 4.26%(-0.287)#2,843 |
| 74. | Beavercreek | 3.93% | 2.06%(+1.87)#74 | 4.26%(-0.327)#2,869 |
| 75. | Forest Park | 3.88% | 2.06%(+1.82)#75 | 4.26%(-0.376)#2,903 |
| 76. | Hudson | 3.88% | 2.06%(+1.82)#76 | 4.26%(-0.383)#2,906 |
| 77. | Concorde Hills | 3.87% | 2.06%(+1.81)#77 | 4.26%(-0.387)#2,915 |
| 78. | Guilford Lake | 3.87% | 2.06%(+1.81)#78 | 4.26%(-0.390)#2,917 |
| 79. | Sylvania | 3.84% | 2.06%(+1.78)#79 | 4.26%(-0.421)#2,943 |
| 80. | North Zanesville | 3.84% | 2.06%(+1.78)#80 | 4.26%(-0.424)#2,945 |
| 81. | Seven Hills | 3.83% | 2.06%(+1.77)#81 | 4.26%(-0.434)#2,953 |
| 82. | Northbrook | 3.81% | 2.06%(+1.75)#82 | 4.26%(-0.448)#2,967 |
| 83. | Centerville | 3.76% | 2.06%(+1.70)#83 | 4.26%(-0.499)#3,011 |
| 84. | Wayne Lakes | 3.75% | 2.06%(+1.69)#84 | 4.26%(-0.512)#3,020 |
| 85. | Broadview Heights | 3.73% | 2.06%(+1.68)#85 | 4.26%(-0.526)#3,031 |
| 86. | Fairfield | 3.73% | 2.06%(+1.67)#86 | 4.26%(-0.527)#3,033 |
| 87. | Bellbrook | 3.70% | 2.06%(+1.64)#87 | 4.26%(-0.559)#3,055 |
| 88. | Troy | 3.65% | 2.06%(+1.59)#88 | 4.26%(-0.607)#3,095 |
| 89. | Akron | 3.64% | 2.06%(+1.58)#89 | 4.26%(-0.624)#3,111 |
| 90. | Sullivan | 3.56% | 2.06%(+1.50)#90 | 4.26%(-0.697)#3,177 |
| 91. | Kirtland Hills | 3.54% | 2.06%(+1.48)#91 | 4.26%(-0.721)#3,197 |
| 92. | Kent | 3.53% | 2.06%(+1.47)#92 | 4.26%(-0.727)#3,202 |
| 93. | Stow | 3.44% | 2.06%(+1.38)#93 | 4.26%(-0.821)#3,284 |
| 94. | Sparta | 3.43% | 2.06%(+1.37)#94 | 4.26%(-0.832)#3,299 |
| 95. | Geneva On The Lake | 3.41% | 2.06%(+1.35)#95 | 4.26%(-0.850)#3,313 |
| 96. | Cedarville | 3.40% | 2.06%(+1.34)#96 | 4.26%(-0.863)#3,331 |
| 97. | Bratenahl | 3.38% | 2.06%(+1.32)#97 | 4.26%(-0.885)#3,351 |
| 98. | Cuyahoga Heights | 3.35% | 2.06%(+1.29)#98 | 4.26%(-0.911)#3,381 |
| 99. | Riverside | 3.32% | 2.06%(+1.27)#99 | 4.26%(-0.935)#3,407 |
| 100. | Carlisle | 3.24% | 2.06%(+1.18)#100 | 4.26%(-1.02)#3,482 |
Common Questions
What are the Top 10 Cities with the Highest Percentage of Immigrants from Asia in Ohio?
Top 10 Cities with the Highest Percentage of Immigrants from Asia in Ohio are:
#1
22.03%
#2
18.18%
#3
17.54%
#4
14.96%
#5
12.30%
#6
11.88%
#7
11.54%
#8
11.24%
#9
10.62%
#10
10.60%
What city has the Highest Percentage of Immigrants from Asia in Ohio?
East Liberty has the Highest Percentage of Immigrants from Asia in Ohio with 22.03%.
What is the Percentage of Immigrants from Asia in the State of Ohio?
Percentage of Immigrants from Asia in Ohio is 2.06%.
What is the Percentage of Immigrants from Asia in the United States?
Percentage of Immigrants from Asia in the United States is 4.26%.