Eaton Estates, OH Map & Demographics
Eaton Estates Map
Eaton Estates Overview
$27,664
PER CAPITA INCOME
$57,868
AVG FAMILY INCOME
$58,967
AVG HOUSEHOLD INCOME
39.5%
WAGE / INCOME GAP [ % ]
60.5¢/ $1
WAGE / INCOME GAP [ $ ]
0.29
INEQUALITY / GINI INDEX
1,191
TOTAL POPULATION
578
MALE POPULATION
613
FEMALE POPULATION
94.29
MALES / 100 FEMALES
106.06
FEMALES / 100 MALES
55.9
MEDIAN AGE
3.3
AVG FAMILY SIZE
2.6
AVG HOUSEHOLD SIZE
500
LABOR FORCE [ PEOPLE ]
46.8%
PERCENT IN LABOR FORCE
Income in Eaton Estates
Income Overview in Eaton Estates
Per Capita Income in Eaton Estates is $27,664, while median incomes of families and households are $57,868 and $58,967 respectively.
| Characteristic | Number | Measure |
| Per Capita Income | 1,191 | $27,664 |
| Median Family Income | 243 | $57,868 |
| Mean Family Income | 243 | $64,287 |
| Median Household Income | 455 | $58,967 |
| Mean Household Income | 455 | $68,262 |
| Income Deficit | 243 | $0 |
| Wage / Income Gap (%) | 1,191 | 39.51% |
| Wage / Income Gap ($) | 1,191 | 60.49¢ per $1 |
| Gini / Inequality Index | 1,191 | 0.29 |
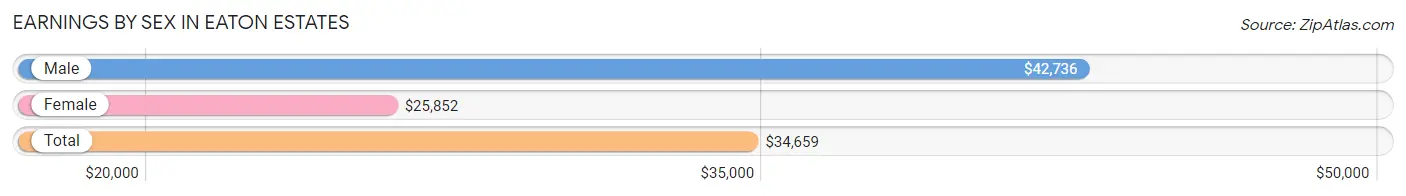
Earnings by Sex in Eaton Estates
Average Earnings in Eaton Estates are $34,659, $42,736 for men and $25,852 for women, a difference of 39.5%.
| Sex | Number | Average Earnings |
| Male | 293 (57.7%) | $42,736 |
| Female | 215 (42.3%) | $25,852 |
| Total | 508 (100.0%) | $34,659 |
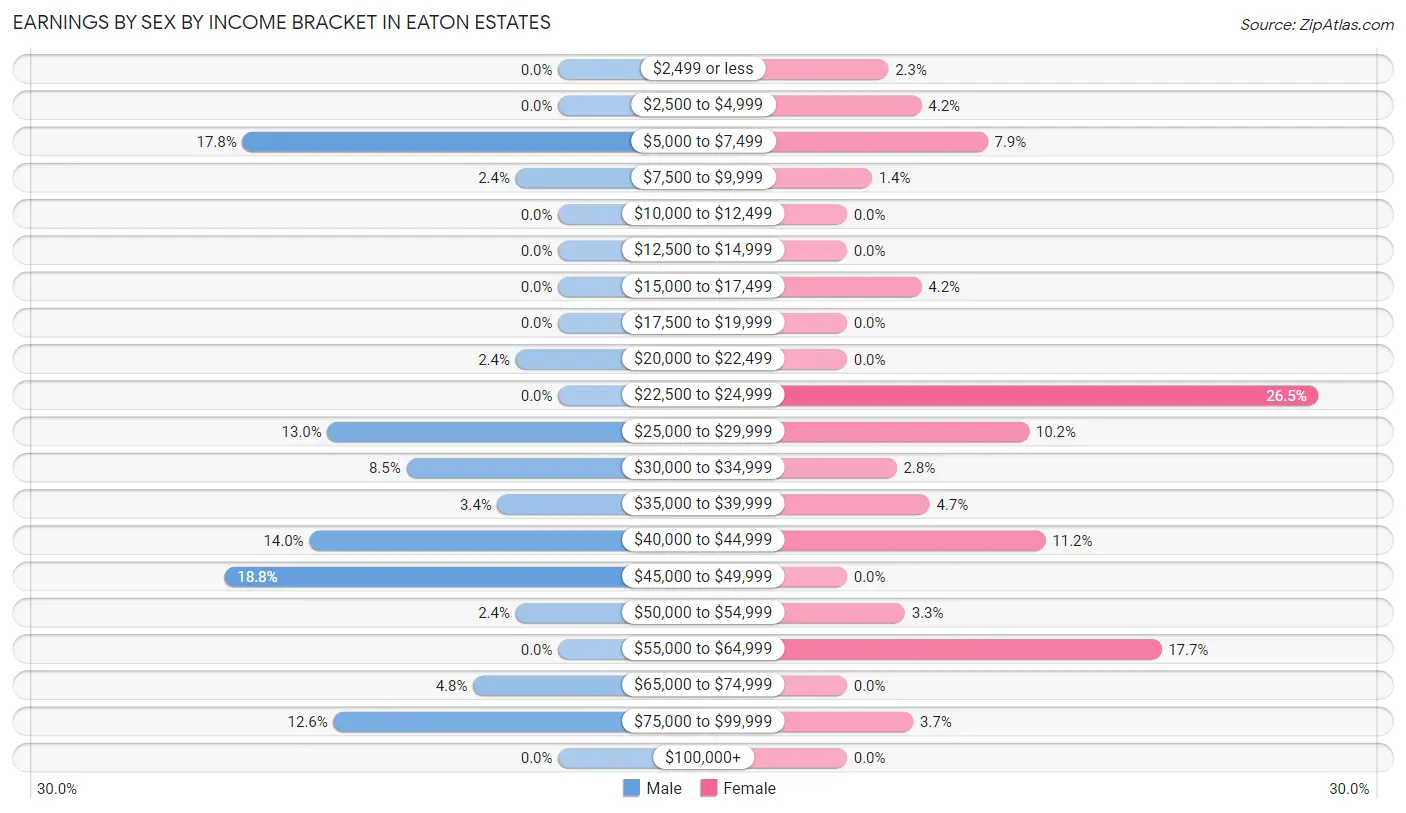
Earnings by Sex by Income Bracket in Eaton Estates
The most common earnings brackets in Eaton Estates are $45,000 to $49,999 for men (55 | 18.8%) and $22,500 to $24,999 for women (57 | 26.5%).
| Income | Male | Female |
| $2,499 or less | 0 (0.0%) | 5 (2.3%) |
| $2,500 to $4,999 | 0 (0.0%) | 9 (4.2%) |
| $5,000 to $7,499 | 52 (17.7%) | 17 (7.9%) |
| $7,500 to $9,999 | 7 (2.4%) | 3 (1.4%) |
| $10,000 to $12,499 | 0 (0.0%) | 0 (0.0%) |
| $12,500 to $14,999 | 0 (0.0%) | 0 (0.0%) |
| $15,000 to $17,499 | 0 (0.0%) | 9 (4.2%) |
| $17,500 to $19,999 | 0 (0.0%) | 0 (0.0%) |
| $20,000 to $22,499 | 7 (2.4%) | 0 (0.0%) |
| $22,500 to $24,999 | 0 (0.0%) | 57 (26.5%) |
| $25,000 to $29,999 | 38 (13.0%) | 22 (10.2%) |
| $30,000 to $34,999 | 25 (8.5%) | 6 (2.8%) |
| $35,000 to $39,999 | 10 (3.4%) | 10 (4.6%) |
| $40,000 to $44,999 | 41 (14.0%) | 24 (11.2%) |
| $45,000 to $49,999 | 55 (18.8%) | 0 (0.0%) |
| $50,000 to $54,999 | 7 (2.4%) | 7 (3.3%) |
| $55,000 to $64,999 | 0 (0.0%) | 38 (17.7%) |
| $65,000 to $74,999 | 14 (4.8%) | 0 (0.0%) |
| $75,000 to $99,999 | 37 (12.6%) | 8 (3.7%) |
| $100,000+ | 0 (0.0%) | 0 (0.0%) |
| Total | 293 (100.0%) | 215 (100.0%) |
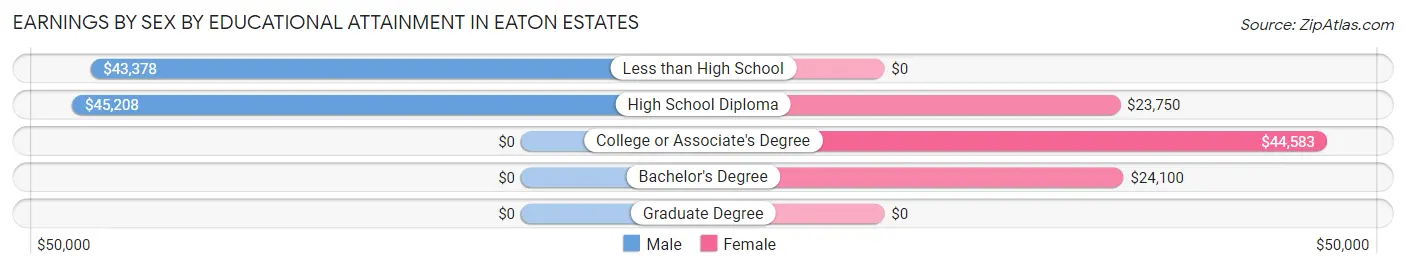
Earnings by Sex by Educational Attainment in Eaton Estates
Average earnings in Eaton Estates are $42,736 for men and $26,193 for women, a difference of 38.7%. Men with an educational attainment of high school diploma enjoy the highest average annual earnings of $45,208, while those with less than high school education earn the least with $43,378. Women with an educational attainment of college or associate's degree earn the most with the average annual earnings of $44,583, while those with high school diploma education have the smallest earnings of $23,750.
| Educational Attainment | Male Income | Female Income |
| Less than High School | $43,378 | $0 |
| High School Diploma | $45,208 | $23,750 |
| College or Associate's Degree | - | - |
| Bachelor's Degree | - | - |
| Graduate Degree | - | - |
| Total | $42,736 | $26,193 |
Family Income in Eaton Estates
Family Income Brackets in Eaton Estates
According to the Eaton Estates family income data, there are 95 families falling into the $50,000 to $74,999 income range, which is the most common income bracket and makes up 39.1% of all families.
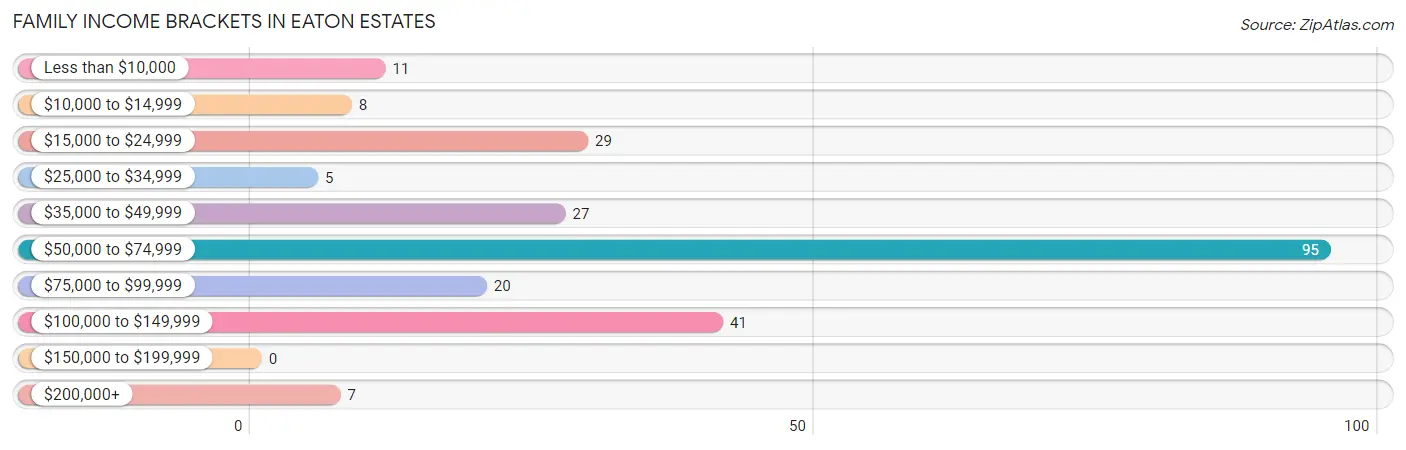
| Income Bracket | # Families | % Families |
| Less than $10,000 | 11 | 4.5% |
| $10,000 to $14,999 | 8 | 3.3% |
| $15,000 to $24,999 | 29 | 11.9% |
| $25,000 to $34,999 | 5 | 2.1% |
| $35,000 to $49,999 | 27 | 11.1% |
| $50,000 to $74,999 | 95 | 39.1% |
| $75,000 to $99,999 | 20 | 8.2% |
| $100,000 to $149,999 | 41 | 16.9% |
| $150,000 to $199,999 | 0 | 0.0% |
| $200,000+ | 7 | 2.9% |
Family Income by Famaliy Size in Eaton Estates
3-person families (74 | 30.4%) account for the highest median family income in Eaton Estates with $73,782 per family, while 3-person families (74 | 30.4%) have the highest median income of $24,594 per family member.
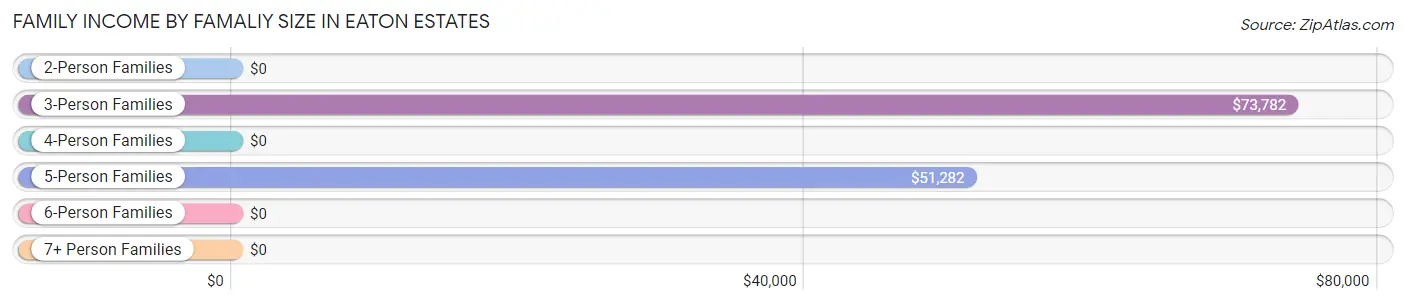
| Income Bracket | # Families | Median Income |
| 2-Person Families | 119 (49.0%) | $0 |
| 3-Person Families | 74 (30.4%) | $73,782 |
| 4-Person Families | 0 (0.0%) | $0 |
| 5-Person Families | 50 (20.6%) | $51,282 |
| 6-Person Families | 0 (0.0%) | $0 |
| 7+ Person Families | 0 (0.0%) | $0 |
| Total | 243 (100.0%) | $57,868 |
Family Income by Number of Earners in Eaton Estates
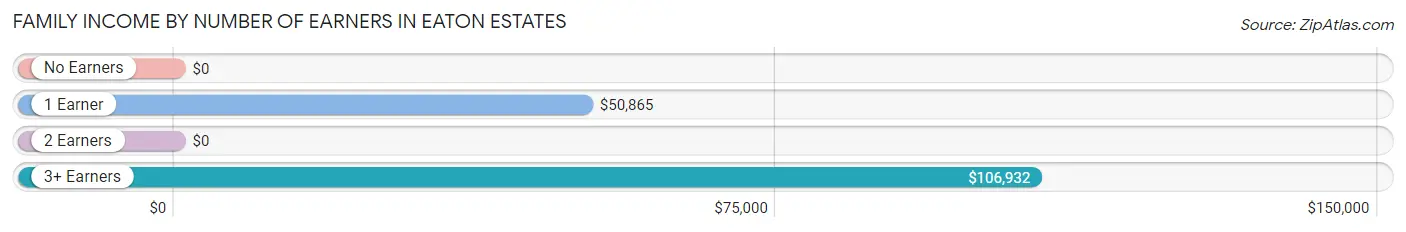
| Number of Earners | # Families | Median Income |
| No Earners | 102 (42.0%) | $0 |
| 1 Earner | 83 (34.2%) | $50,865 |
| 2 Earners | 41 (16.9%) | $0 |
| 3+ Earners | 17 (7.0%) | $106,932 |
| Total | 243 (100.0%) | $57,868 |
Household Income in Eaton Estates
Household Income Brackets in Eaton Estates
With 140 households falling in the category, the $50,000 to $74,999 income range is the most frequent in Eaton Estates, accounting for 30.8% of all households.
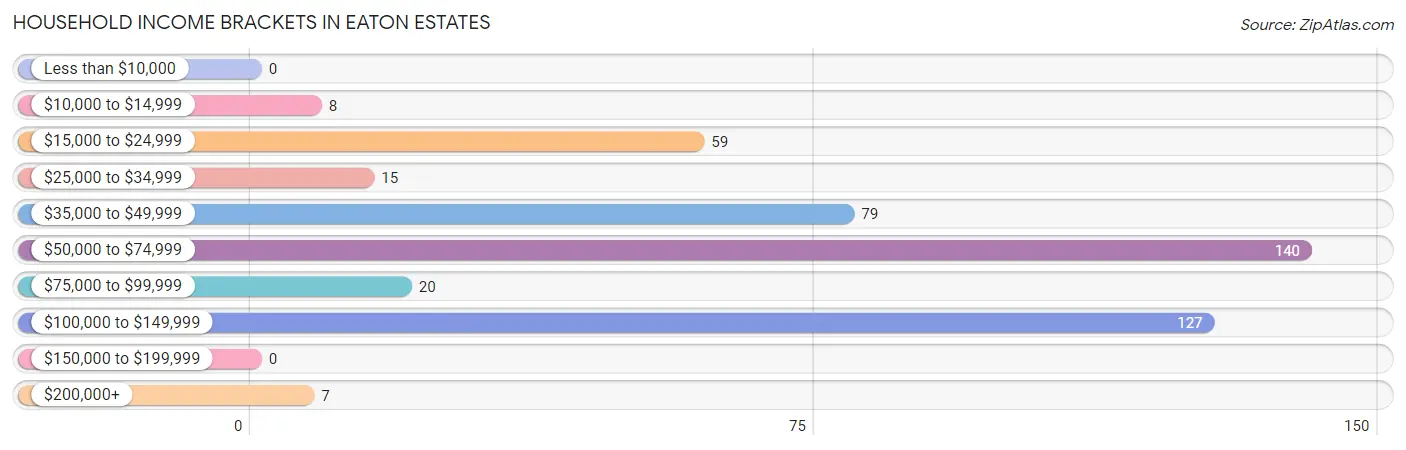
| Income Bracket | # Households | % Households |
| Less than $10,000 | 0 | 0.0% |
| $10,000 to $14,999 | 8 | 1.8% |
| $15,000 to $24,999 | 59 | 13.0% |
| $25,000 to $34,999 | 15 | 3.3% |
| $35,000 to $49,999 | 79 | 17.4% |
| $50,000 to $74,999 | 140 | 30.8% |
| $75,000 to $99,999 | 20 | 4.4% |
| $100,000 to $149,999 | 127 | 27.9% |
| $150,000 to $199,999 | 0 | 0.0% |
| $200,000+ | 7 | 1.5% |
Household Income by Householder Age in Eaton Estates
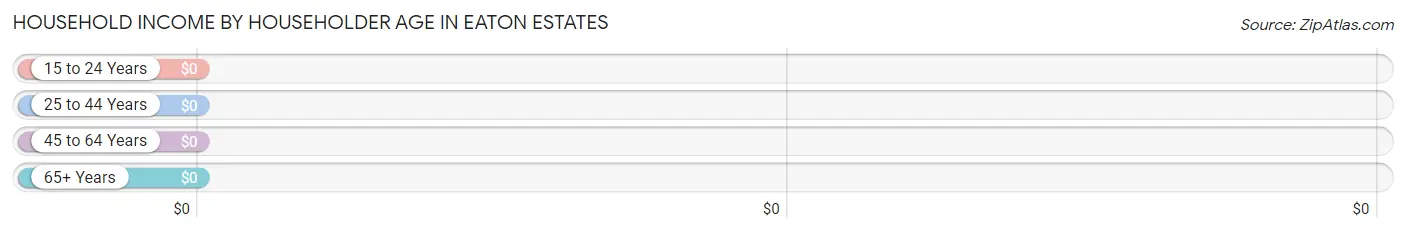
| Income Bracket | # Households | Median Income |
| 15 to 24 Years | 0 (0.0%) | $0 |
| 25 to 44 Years | 72 (15.8%) | $0 |
| 45 to 64 Years | 179 (39.3%) | $0 |
| 65+ Years | 204 (44.8%) | $0 |
| Total | 455 (100.0%) | $58,967 |
Poverty in Eaton Estates
Income Below Poverty by Sex and Age in Eaton Estates
With 5.0% poverty level for males and 5.4% for females among the residents of Eaton Estates, 6 to 11 year old males and 25 to 34 year old females are the most vulnerable to poverty, with 15 males (100.0%) and 16 females (12.3%) in their respective age groups living below the poverty level.
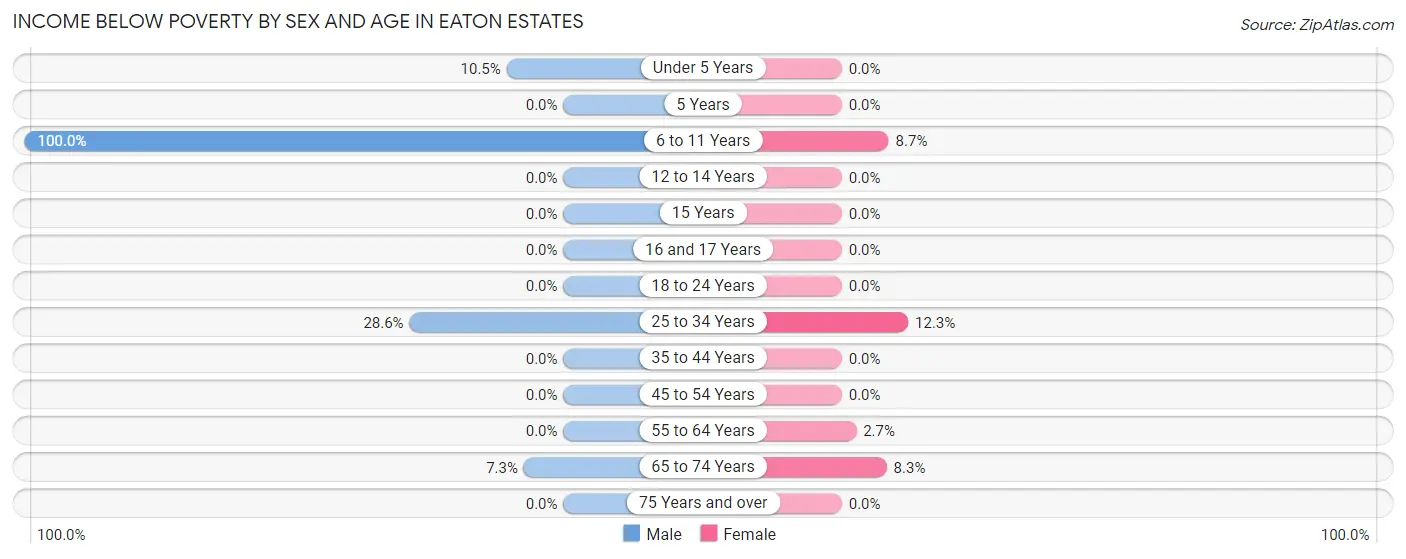
| Age Bracket | Male | Female |
| Under 5 Years | 2 (10.5%) | 0 (0.0%) |
| 5 Years | 0 (0.0%) | 0 (0.0%) |
| 6 to 11 Years | 15 (100.0%) | 4 (8.7%) |
| 12 to 14 Years | 0 (0.0%) | 0 (0.0%) |
| 15 Years | 0 (0.0%) | 0 (0.0%) |
| 16 and 17 Years | 0 (0.0%) | 0 (0.0%) |
| 18 to 24 Years | 0 (0.0%) | 0 (0.0%) |
| 25 to 34 Years | 4 (28.6%) | 16 (12.3%) |
| 35 to 44 Years | 0 (0.0%) | 0 (0.0%) |
| 45 to 54 Years | 0 (0.0%) | 0 (0.0%) |
| 55 to 64 Years | 0 (0.0%) | 5 (2.7%) |
| 65 to 74 Years | 8 (7.3%) | 8 (8.3%) |
| 75 Years and over | 0 (0.0%) | 0 (0.0%) |
| Total | 29 (5.0%) | 33 (5.4%) |
Income Above Poverty by Sex and Age in Eaton Estates
According to the poverty statistics in Eaton Estates, males aged 35 to 44 years and females aged 12 to 14 years are the age groups that are most secure financially, with 100.0% of males and 100.0% of females in these age groups living above the poverty line.
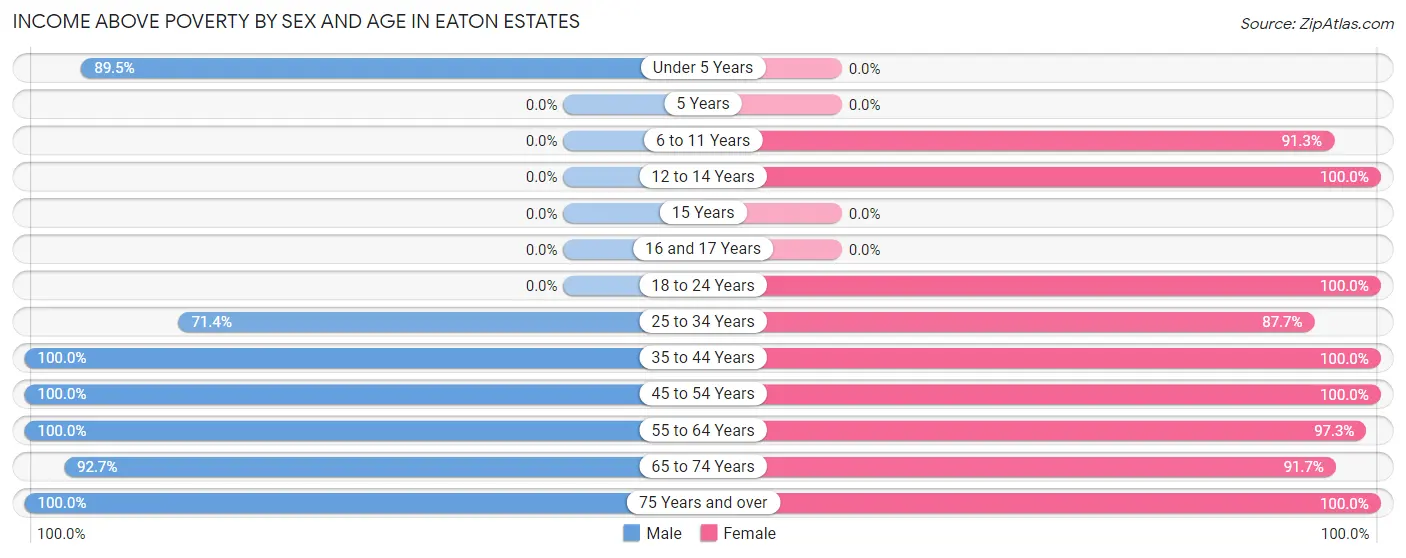
| Age Bracket | Male | Female |
| Under 5 Years | 17 (89.5%) | 0 (0.0%) |
| 5 Years | 0 (0.0%) | 0 (0.0%) |
| 6 to 11 Years | 0 (0.0%) | 42 (91.3%) |
| 12 to 14 Years | 0 (0.0%) | 43 (100.0%) |
| 15 Years | 0 (0.0%) | 0 (0.0%) |
| 16 and 17 Years | 0 (0.0%) | 0 (0.0%) |
| 18 to 24 Years | 0 (0.0%) | 6 (100.0%) |
| 25 to 34 Years | 10 (71.4%) | 114 (87.7%) |
| 35 to 44 Years | 133 (100.0%) | 26 (100.0%) |
| 45 to 54 Years | 31 (100.0%) | 42 (100.0%) |
| 55 to 64 Years | 188 (100.0%) | 182 (97.3%) |
| 65 to 74 Years | 101 (92.7%) | 88 (91.7%) |
| 75 Years and over | 69 (100.0%) | 37 (100.0%) |
| Total | 549 (95.0%) | 580 (94.6%) |
Income Below Poverty Among Married-Couple Families in Eaton Estates
The poverty statistics for married-couple families in Eaton Estates show that 9.6% or 13 of the total 136 families live below the poverty line. Families with 3 or 4 children have the highest poverty rate of 100.0%, comprising of 5 families. On the other hand, families with 1 or 2 children have the lowest poverty rate of 0.0%, which includes 0 families.
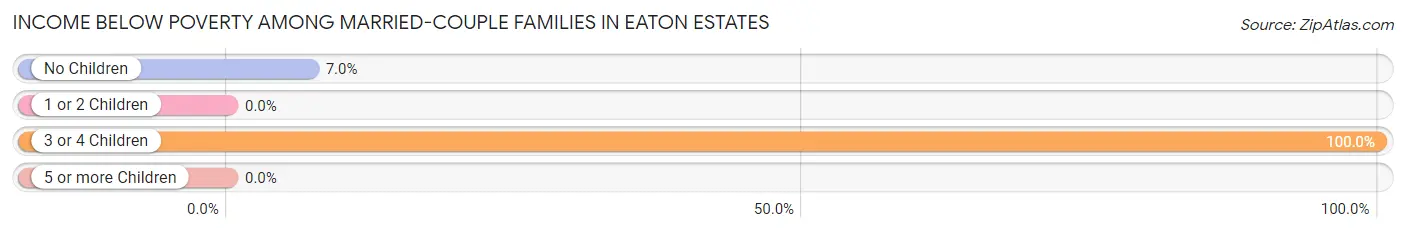
| Children | Above Poverty | Below Poverty |
| No Children | 106 (93.0%) | 8 (7.0%) |
| 1 or 2 Children | 17 (100.0%) | 0 (0.0%) |
| 3 or 4 Children | 0 (0.0%) | 5 (100.0%) |
| 5 or more Children | 0 (0.0%) | 0 (0.0%) |
| Total | 123 (90.4%) | 13 (9.6%) |
Income Below Poverty Among Single-Parent Households in Eaton Estates
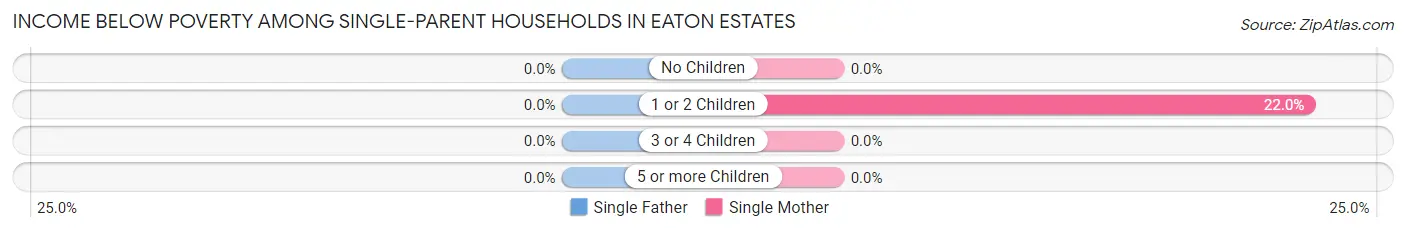
| Children | Single Father | Single Mother |
| No Children | 0 (0.0%) | 0 (0.0%) |
| 1 or 2 Children | 0 (0.0%) | 11 (22.0%) |
| 3 or 4 Children | 0 (0.0%) | 0 (0.0%) |
| 5 or more Children | 0 (0.0%) | 0 (0.0%) |
| Total | 0 (0.0%) | 11 (22.0%) |
Income Below Poverty Among Married-Couple vs Single-Parent Households in Eaton Estates
The poverty data for Eaton Estates shows that 13 of the married-couple family households (9.6%) and 11 of the single-parent households (10.3%) are living below the poverty level. Within the married-couple family households, those with 3 or 4 children have the highest poverty rate, with 5 households (100.0%) falling below the poverty line. Among the single-parent households, those with 1 or 2 children have the highest poverty rate, with 11 household (22.0%) living below poverty.
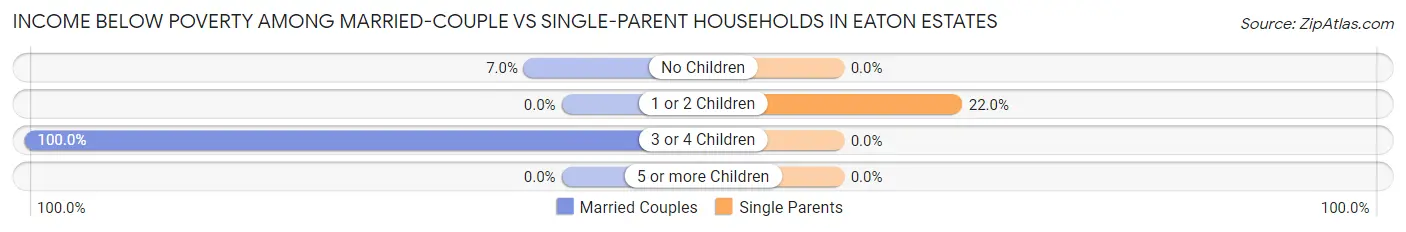
| Children | Married-Couple Families | Single-Parent Households |
| No Children | 8 (7.0%) | 0 (0.0%) |
| 1 or 2 Children | 0 (0.0%) | 11 (22.0%) |
| 3 or 4 Children | 5 (100.0%) | 0 (0.0%) |
| 5 or more Children | 0 (0.0%) | 0 (0.0%) |
| Total | 13 (9.6%) | 11 (10.3%) |
Race in Eaton Estates
The most populous races in Eaton Estates are White / Caucasian (1,175 | 98.7%), and Two or more Races (16 | 1.3%).
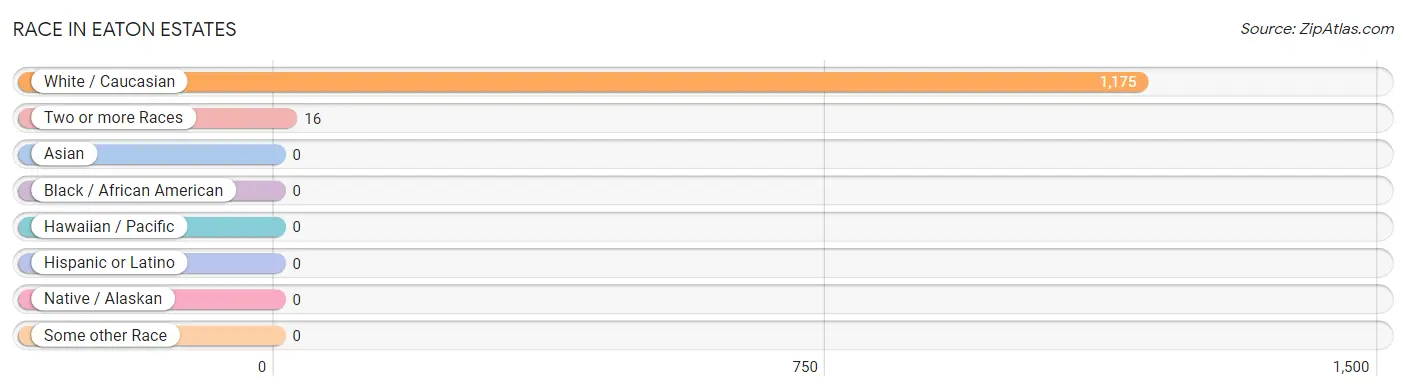
| Race | # Population | % Population |
| Asian | 0 | 0.0% |
| Black / African American | 0 | 0.0% |
| Hawaiian / Pacific | 0 | 0.0% |
| Hispanic or Latino | 0 | 0.0% |
| Native / Alaskan | 0 | 0.0% |
| White / Caucasian | 1,175 | 98.7% |
| Two or more Races | 16 | 1.3% |
| Some other Race | 0 | 0.0% |
| Total | 1,191 | 100.0% |
Ancestry in Eaton Estates
The most populous ancestries reported in Eaton Estates are American (453 | 38.0%), German (248 | 20.8%), Polish (177 | 14.9%), Irish (120 | 10.1%), and Hungarian (59 | 5.0%), together accounting for 88.8% of all Eaton Estates residents.
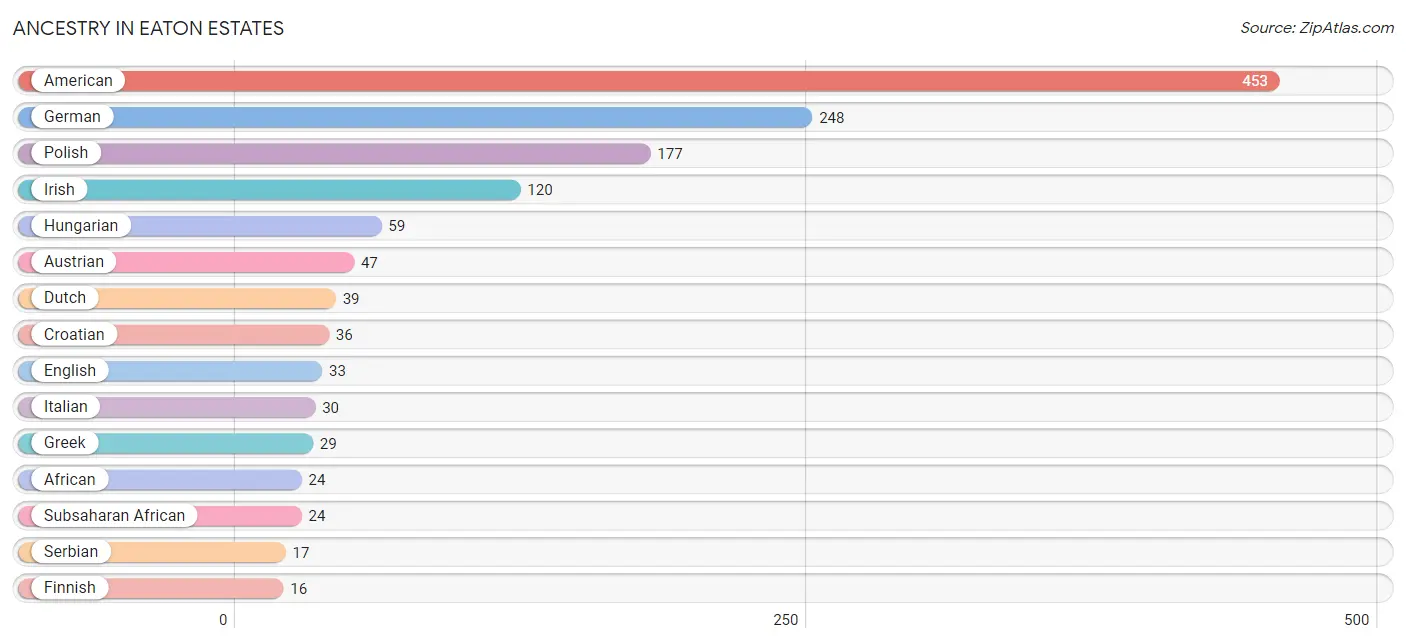
| Ancestry | # Population | % Population |
| African | 24 | 2.0% |
| American | 453 | 38.0% |
| Austrian | 47 | 4.0% |
| Croatian | 36 | 3.0% |
| Dutch | 39 | 3.3% |
| English | 33 | 2.8% |
| Finnish | 16 | 1.3% |
| French Canadian | 7 | 0.6% |
| German | 248 | 20.8% |
| Greek | 29 | 2.4% |
| Hungarian | 59 | 5.0% |
| Irish | 120 | 10.1% |
| Italian | 30 | 2.5% |
| Polish | 177 | 14.9% |
| Russian | 3 | 0.3% |
| Serbian | 17 | 1.4% |
| Slovene | 3 | 0.3% |
| Subsaharan African | 24 | 2.0% | View All 18 Rows |
Immigrants in Eaton Estates

| Immigration Origin | # Population | % Population | View All 0 Rows |
Sex and Age in Eaton Estates
Sex and Age in Eaton Estates
The most populous age groups in Eaton Estates are 35 to 39 Years (120 | 20.8%) for men and 60 to 64 Years (136 | 22.2%) for women.
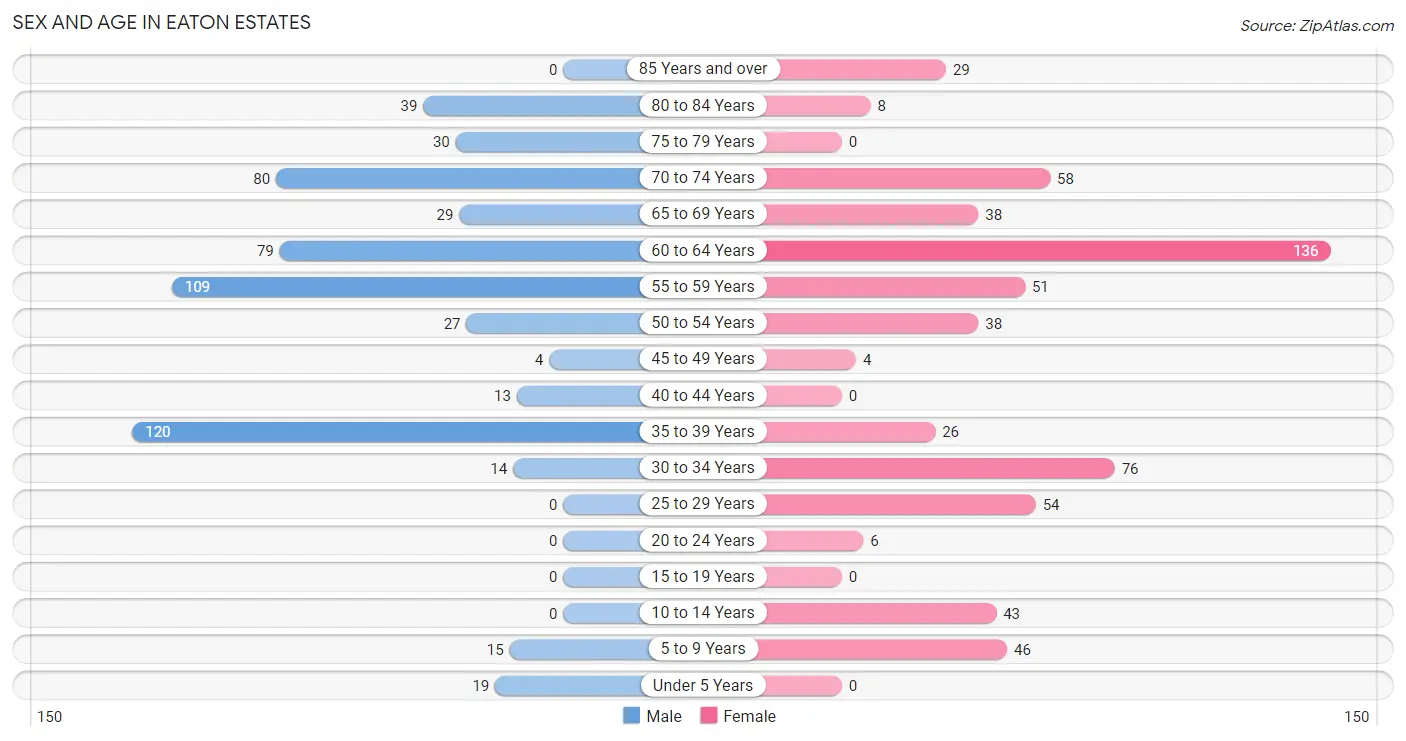
| Age Bracket | Male | Female |
| Under 5 Years | 19 (3.3%) | 0 (0.0%) |
| 5 to 9 Years | 15 (2.6%) | 46 (7.5%) |
| 10 to 14 Years | 0 (0.0%) | 43 (7.0%) |
| 15 to 19 Years | 0 (0.0%) | 0 (0.0%) |
| 20 to 24 Years | 0 (0.0%) | 6 (1.0%) |
| 25 to 29 Years | 0 (0.0%) | 54 (8.8%) |
| 30 to 34 Years | 14 (2.4%) | 76 (12.4%) |
| 35 to 39 Years | 120 (20.8%) | 26 (4.2%) |
| 40 to 44 Years | 13 (2.2%) | 0 (0.0%) |
| 45 to 49 Years | 4 (0.7%) | 4 (0.6%) |
| 50 to 54 Years | 27 (4.7%) | 38 (6.2%) |
| 55 to 59 Years | 109 (18.9%) | 51 (8.3%) |
| 60 to 64 Years | 79 (13.7%) | 136 (22.2%) |
| 65 to 69 Years | 29 (5.0%) | 38 (6.2%) |
| 70 to 74 Years | 80 (13.8%) | 58 (9.5%) |
| 75 to 79 Years | 30 (5.2%) | 0 (0.0%) |
| 80 to 84 Years | 39 (6.8%) | 8 (1.3%) |
| 85 Years and over | 0 (0.0%) | 29 (4.7%) |
| Total | 578 (100.0%) | 613 (100.0%) |
Families and Households in Eaton Estates
Median Family Size in Eaton Estates
The median family size in Eaton Estates is 3.29 persons per family, with single female/mother families (50 | 20.6%) accounting for the largest median family size of 5 persons per family. On the other hand, married-couple families (136 | 56.0%) represent the smallest median family size with 2.51 persons per family.
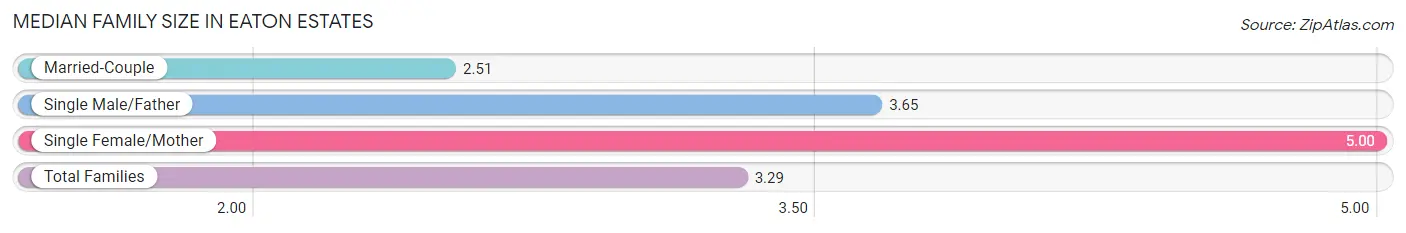
| Family Type | # Families | Family Size |
| Married-Couple | 136 (56.0%) | 2.51 |
| Single Male/Father | 57 (23.5%) | 3.65 |
| Single Female/Mother | 50 (20.6%) | 5.00 |
| Total Families | 243 (100.0%) | 3.29 |
Median Household Size in Eaton Estates
The median household size in Eaton Estates is 2.62 persons per household, with single female/mother households (50 | 11.0%) accounting for the largest median household size of 5.2 persons per household. non-family households (212 | 46.6%) represent the smallest median household size with 1.57 persons per household.
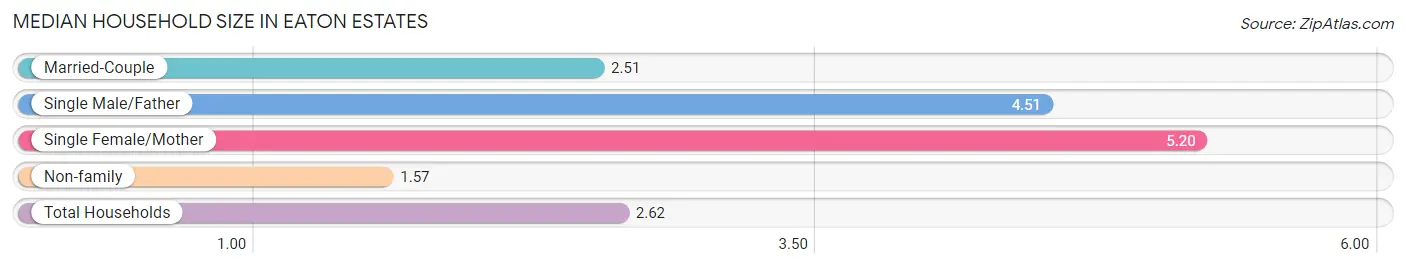
| Household Type | # Households | Household Size |
| Married-Couple | 136 (29.9%) | 2.51 |
| Single Male/Father | 57 (12.5%) | 4.51 |
| Single Female/Mother | 50 (11.0%) | 5.20 |
| Non-family | 212 (46.6%) | 1.57 |
| Total Households | 455 (100.0%) | 2.62 |
Household Size by Marriage Status in Eaton Estates
Out of a total of 455 households in Eaton Estates, 243 (53.4%) are family households, while 212 (46.6%) are nonfamily households. The most numerous type of family households are 2-person households, comprising 90, and the most common type of nonfamily households are 1-person households, comprising 138.
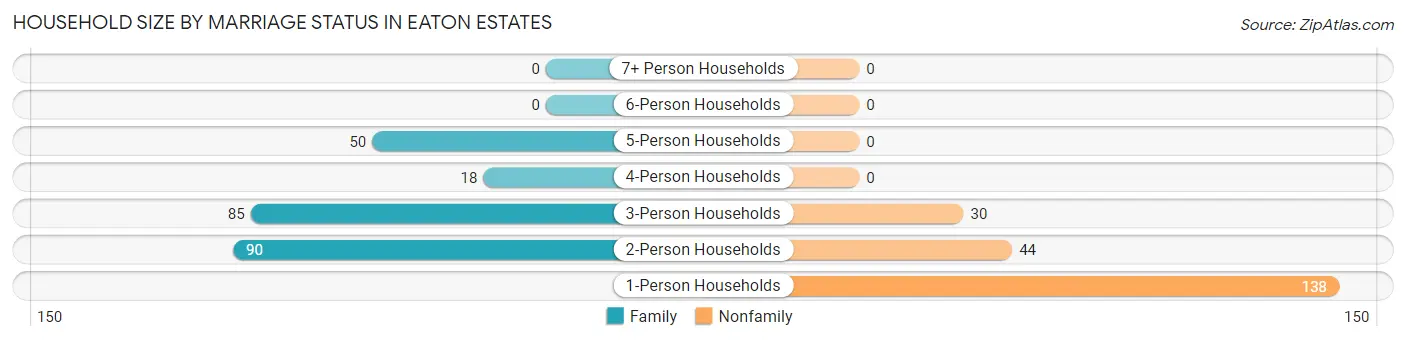
| Household Size | Family Households | Nonfamily Households |
| 1-Person Households | - | 138 (30.3%) |
| 2-Person Households | 90 (19.8%) | 44 (9.7%) |
| 3-Person Households | 85 (18.7%) | 30 (6.6%) |
| 4-Person Households | 18 (4.0%) | 0 (0.0%) |
| 5-Person Households | 50 (11.0%) | 0 (0.0%) |
| 6-Person Households | 0 (0.0%) | 0 (0.0%) |
| 7+ Person Households | 0 (0.0%) | 0 (0.0%) |
| Total | 243 (53.4%) | 212 (46.6%) |
Female Fertility in Eaton Estates
Fertility by Age in Eaton Estates
| Age Bracket | Women with Births | Births / 1,000 Women |
| 15 to 19 years | 0 (0.0%) | 0.0 |
| 20 to 34 years | 0 (0.0%) | 0.0 |
| 35 to 50 years | 0 (0.0%) | 0.0 |
| Total | 0 (0.0%) | 0.0 |
Fertility by Age by Marriage Status in Eaton Estates
| Age Bracket | Married | Unmarried |
| 15 to 19 years | 0 (0.0%) | 0 (0.0%) |
| 20 to 34 years | 0 (0.0%) | 0 (0.0%) |
| 35 to 50 years | 0 (0.0%) | 0 (0.0%) |
| Total | 0 (0.0%) | 0 (0.0%) |
Fertility by Education in Eaton Estates
| Educational Attainment | Women with Births | Births / 1,000 Women |
| Less than High School | 0 (0.0%) | 0.0 |
| High School Diploma | 0 (0.0%) | 0.0 |
| College or Associate's Degree | 0 (0.0%) | 0.0 |
| Bachelor's Degree | 0 (0.0%) | 0.0 |
| Graduate Degree | 0 (0.0%) | 0.0 |
| Total | 0 (0.0%) | 0.0 |
Fertility by Education by Marriage Status in Eaton Estates
| Educational Attainment | Married | Unmarried |
| Less than High School | 0 (0.0%) | 0 (0.0%) |
| High School Diploma | 0 (0.0%) | 0 (0.0%) |
| College or Associate's Degree | 0 (0.0%) | 0 (0.0%) |
| Bachelor's Degree | 0 (0.0%) | 0 (0.0%) |
| Graduate Degree | 0 (0.0%) | 0 (0.0%) |
| Total | 0 (0.0%) | 0 (0.0%) |
Employment Characteristics in Eaton Estates
Employment by Class of Employer in Eaton Estates
Among the 489 employed individuals in Eaton Estates, private company employees (388 | 79.3%), self-employed (not incorporated) (58 | 11.9%), and self-employed (incorporated) (20 | 4.1%) make up the most common classes of employment.
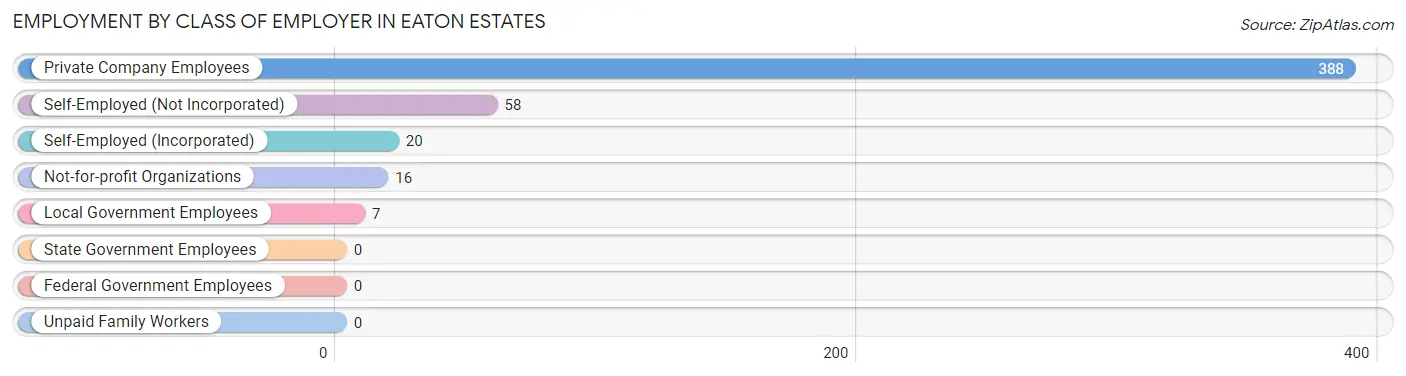
| Employer Class | # Employees | % Employees |
| Private Company Employees | 388 | 79.3% |
| Self-Employed (Incorporated) | 20 | 4.1% |
| Self-Employed (Not Incorporated) | 58 | 11.9% |
| Not-for-profit Organizations | 16 | 3.3% |
| Local Government Employees | 7 | 1.4% |
| State Government Employees | 0 | 0.0% |
| Federal Government Employees | 0 | 0.0% |
| Unpaid Family Workers | 0 | 0.0% |
| Total | 489 | 100.0% |
Employment Status by Age in Eaton Estates
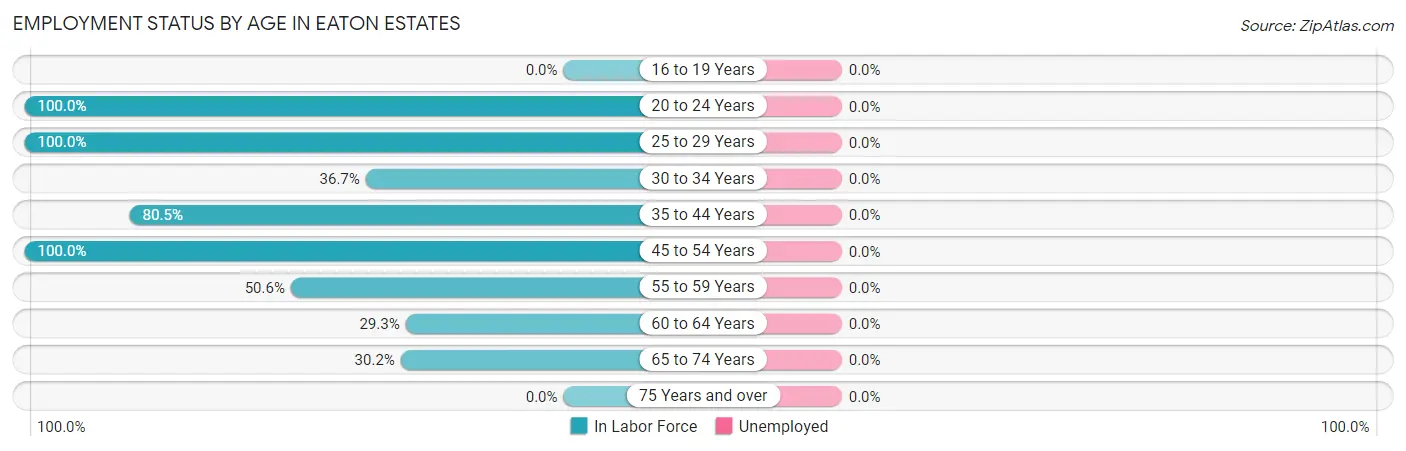
| Age Bracket | In Labor Force | Unemployed |
| 16 to 19 Years | 0 (0.0%) | 0 (0.0%) |
| 20 to 24 Years | 6 (100.0%) | 0 (0.0%) |
| 25 to 29 Years | 54 (100.0%) | 0 (0.0%) |
| 30 to 34 Years | 33 (36.7%) | 0 (0.0%) |
| 35 to 44 Years | 128 (80.5%) | 0 (0.0%) |
| 45 to 54 Years | 73 (100.0%) | 0 (0.0%) |
| 55 to 59 Years | 81 (50.6%) | 0 (0.0%) |
| 60 to 64 Years | 63 (29.3%) | 0 (0.0%) |
| 65 to 74 Years | 62 (30.2%) | 0 (0.0%) |
| 75 Years and over | 0 (0.0%) | 0 (0.0%) |
| Total | 500 (46.8%) | 0 (0.0%) |
Employment Status by Educational Attainment in Eaton Estates
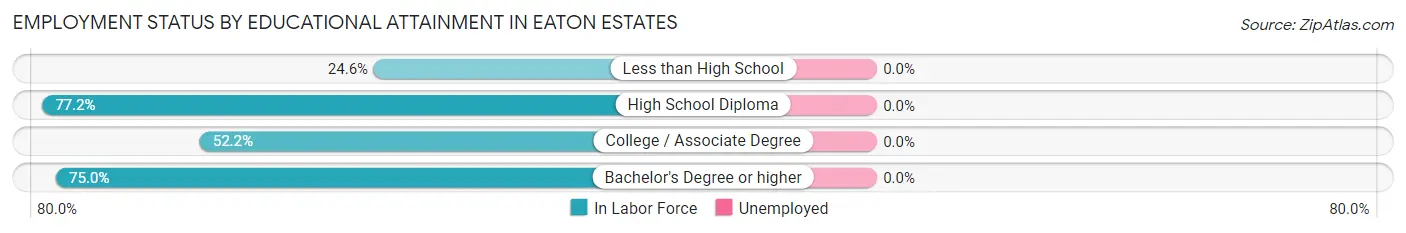
| Educational Attainment | In Labor Force | Unemployed |
| Less than High School | 29 (24.6%) | 0 (0.0%) |
| High School Diploma | 176 (77.2%) | 0 (0.0%) |
| College / Associate Degree | 176 (52.2%) | 0 (0.0%) |
| Bachelor's Degree or higher | 51 (75.0%) | 0 (0.0%) |
| Total | 432 (57.5%) | 0 (0.0%) |
Employment Occupations by Sex in Eaton Estates
Management, Business, Science and Arts Occupations
The most common Management, Business, Science and Arts occupations in Eaton Estates are Computers, Engineering & Science (30 | 6.0%), Architecture & Engineering (30 | 6.0%), Community & Social Service (19 | 3.8%), Education, Arts & Media (11 | 2.2%), and Arts, Media & Entertainment (8 | 1.6%).
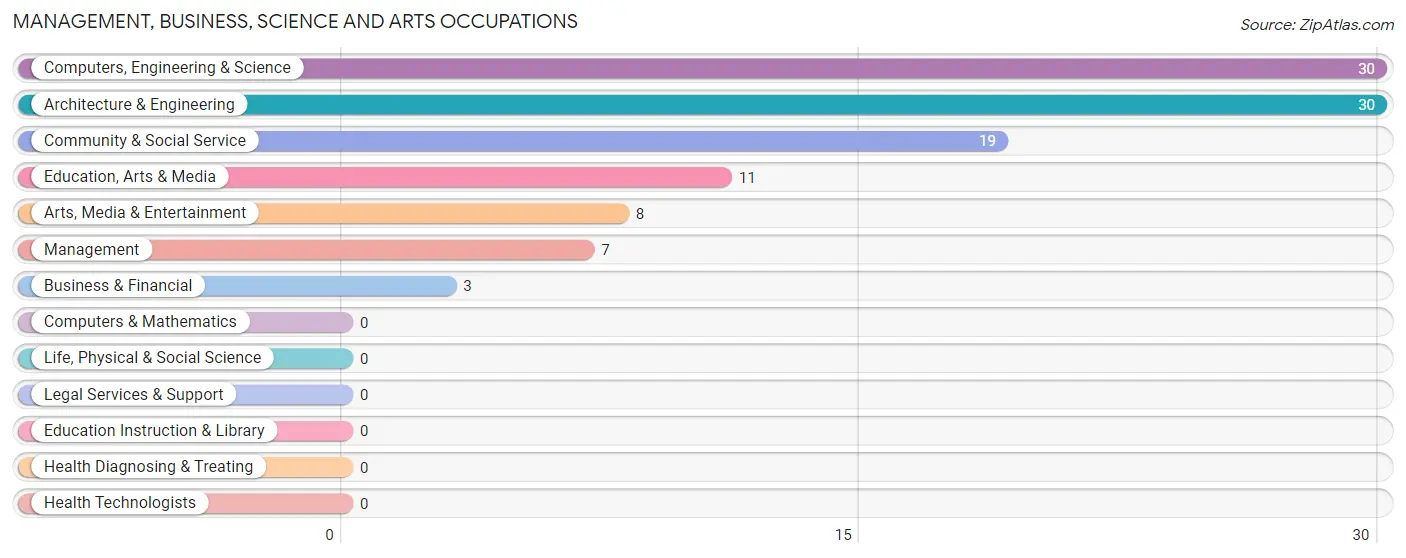
Management, Business, Science and Arts Occupations by Sex
Within the Management, Business, Science and Arts occupations in Eaton Estates, the most male-oriented occupations are Computers, Engineering & Science (100.0%), and Architecture & Engineering (100.0%), while the most female-oriented occupations are Management (100.0%), Business & Financial (100.0%), and Community & Social Service (100.0%).
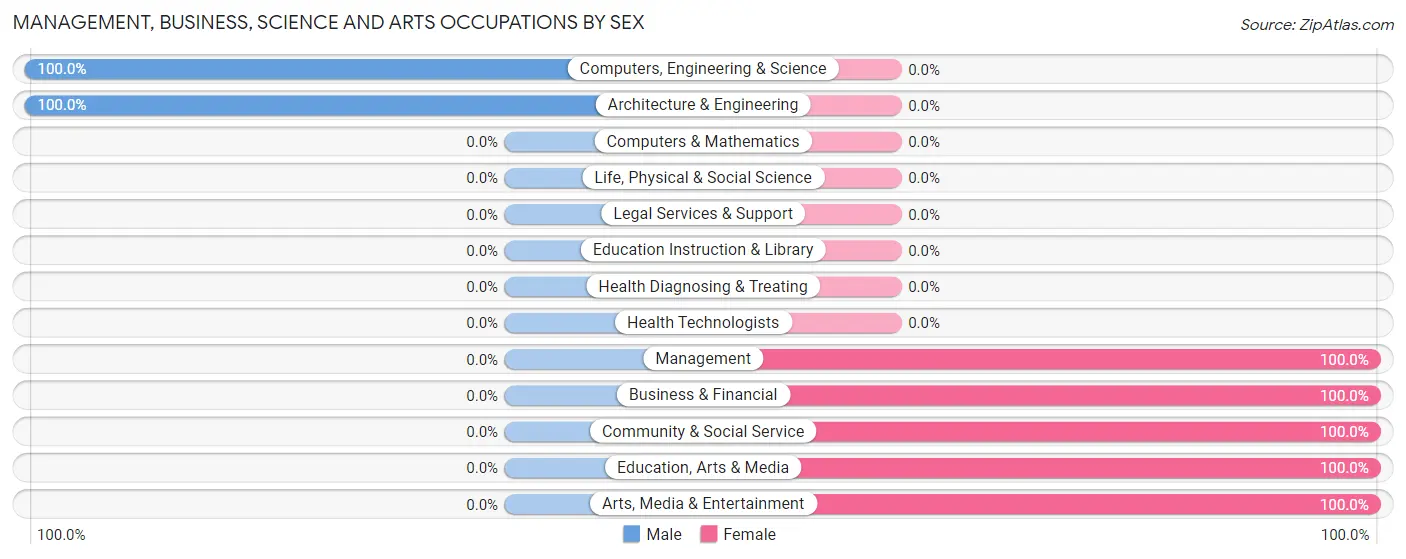
| Occupation | Male | Female |
| Management | 0 (0.0%) | 7 (100.0%) |
| Business & Financial | 0 (0.0%) | 3 (100.0%) |
| Computers, Engineering & Science | 30 (100.0%) | 0 (0.0%) |
| Computers & Mathematics | 0 (0.0%) | 0 (0.0%) |
| Architecture & Engineering | 30 (100.0%) | 0 (0.0%) |
| Life, Physical & Social Science | 0 (0.0%) | 0 (0.0%) |
| Community & Social Service | 0 (0.0%) | 19 (100.0%) |
| Education, Arts & Media | 0 (0.0%) | 11 (100.0%) |
| Legal Services & Support | 0 (0.0%) | 0 (0.0%) |
| Education Instruction & Library | 0 (0.0%) | 0 (0.0%) |
| Arts, Media & Entertainment | 0 (0.0%) | 8 (100.0%) |
| Health Diagnosing & Treating | 0 (0.0%) | 0 (0.0%) |
| Health Technologists | 0 (0.0%) | 0 (0.0%) |
| Total (Category) | 30 (50.8%) | 29 (49.1%) |
| Total (Overall) | 293 (58.6%) | 207 (41.4%) |
Services Occupations
The most common Services occupations in Eaton Estates are Cleaning & Maintenance (60 | 12.0%), Food Preparation & Serving (9 | 1.8%), and Personal Care & Service (7 | 1.4%).
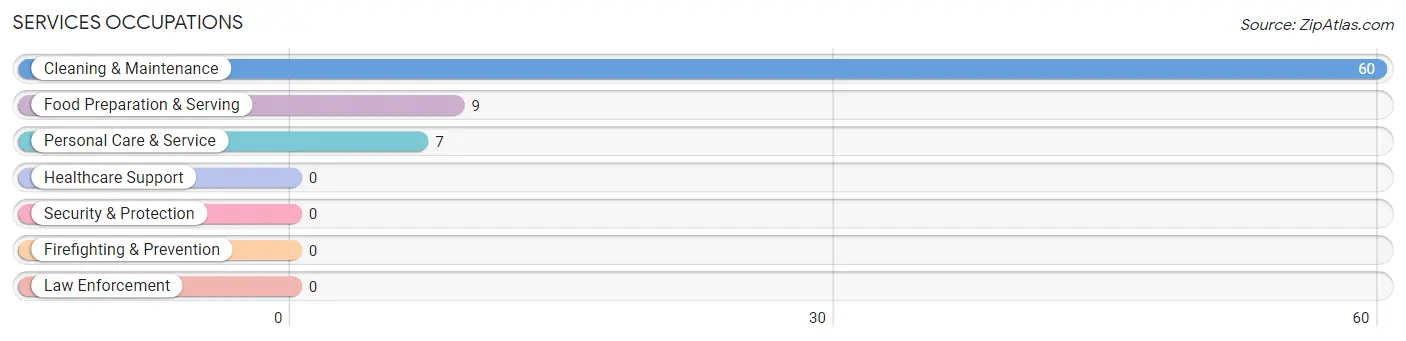
Services Occupations by Sex
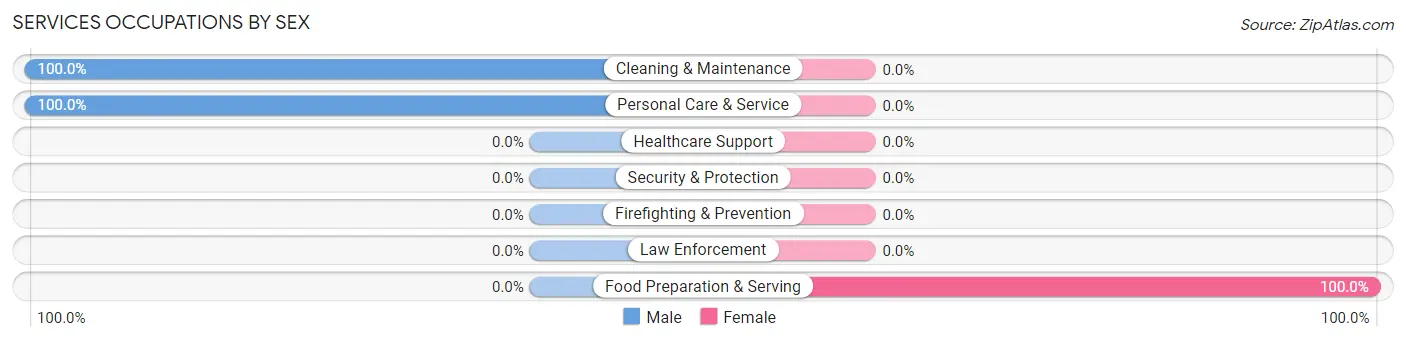
| Occupation | Male | Female |
| Healthcare Support | 0 (0.0%) | 0 (0.0%) |
| Security & Protection | 0 (0.0%) | 0 (0.0%) |
| Firefighting & Prevention | 0 (0.0%) | 0 (0.0%) |
| Law Enforcement | 0 (0.0%) | 0 (0.0%) |
| Food Preparation & Serving | 0 (0.0%) | 9 (100.0%) |
| Cleaning & Maintenance | 60 (100.0%) | 0 (0.0%) |
| Personal Care & Service | 7 (100.0%) | 0 (0.0%) |
| Total (Category) | 67 (88.2%) | 9 (11.8%) |
| Total (Overall) | 293 (58.6%) | 207 (41.4%) |
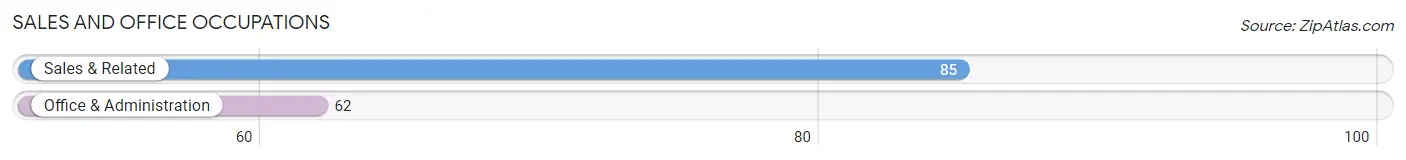
Sales and Office Occupations
The most common Sales and Office occupations in Eaton Estates are Sales & Related (85 | 17.0%), and Office & Administration (62 | 12.4%).
Sales and Office Occupations by Sex
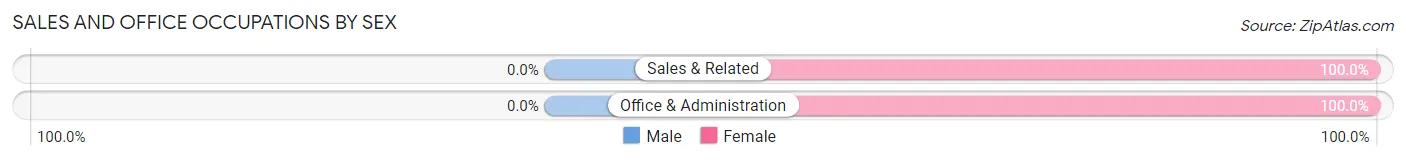
| Occupation | Male | Female |
| Sales & Related | 0 (0.0%) | 85 (100.0%) |
| Office & Administration | 0 (0.0%) | 62 (100.0%) |
| Total (Category) | 0 (0.0%) | 147 (100.0%) |
| Total (Overall) | 293 (58.6%) | 207 (41.4%) |
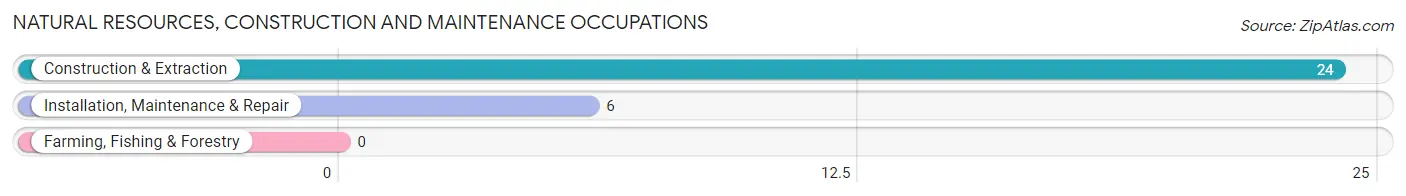
Natural Resources, Construction and Maintenance Occupations
The most common Natural Resources, Construction and Maintenance occupations in Eaton Estates are Construction & Extraction (24 | 4.8%), and Installation, Maintenance & Repair (6 | 1.2%).
Natural Resources, Construction and Maintenance Occupations by Sex
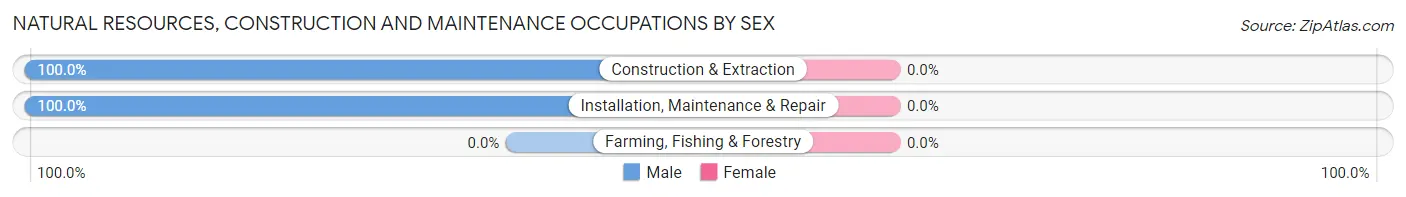
| Occupation | Male | Female |
| Farming, Fishing & Forestry | 0 (0.0%) | 0 (0.0%) |
| Construction & Extraction | 24 (100.0%) | 0 (0.0%) |
| Installation, Maintenance & Repair | 6 (100.0%) | 0 (0.0%) |
| Total (Category) | 30 (100.0%) | 0 (0.0%) |
| Total (Overall) | 293 (58.6%) | 207 (41.4%) |
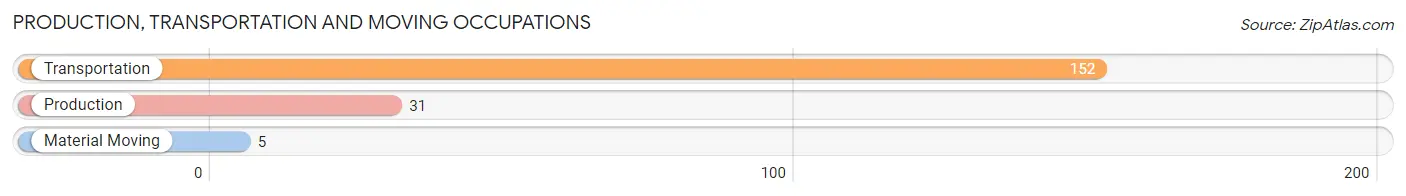
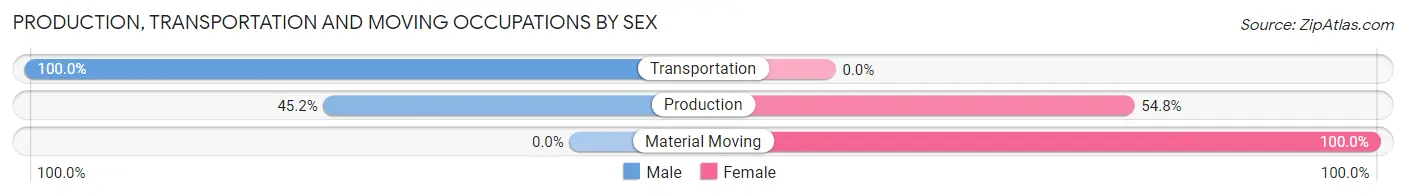
Production, Transportation and Moving Occupations
The most common Production, Transportation and Moving occupations in Eaton Estates are Transportation (152 | 30.4%), Production (31 | 6.2%), and Material Moving (5 | 1.0%).
Production, Transportation and Moving Occupations by Sex
| Occupation | Male | Female |
| Production | 14 (45.2%) | 17 (54.8%) |
| Transportation | 152 (100.0%) | 0 (0.0%) |
| Material Moving | 0 (0.0%) | 5 (100.0%) |
| Total (Category) | 166 (88.3%) | 22 (11.7%) |
| Total (Overall) | 293 (58.6%) | 207 (41.4%) |
Employment Industries by Sex in Eaton Estates
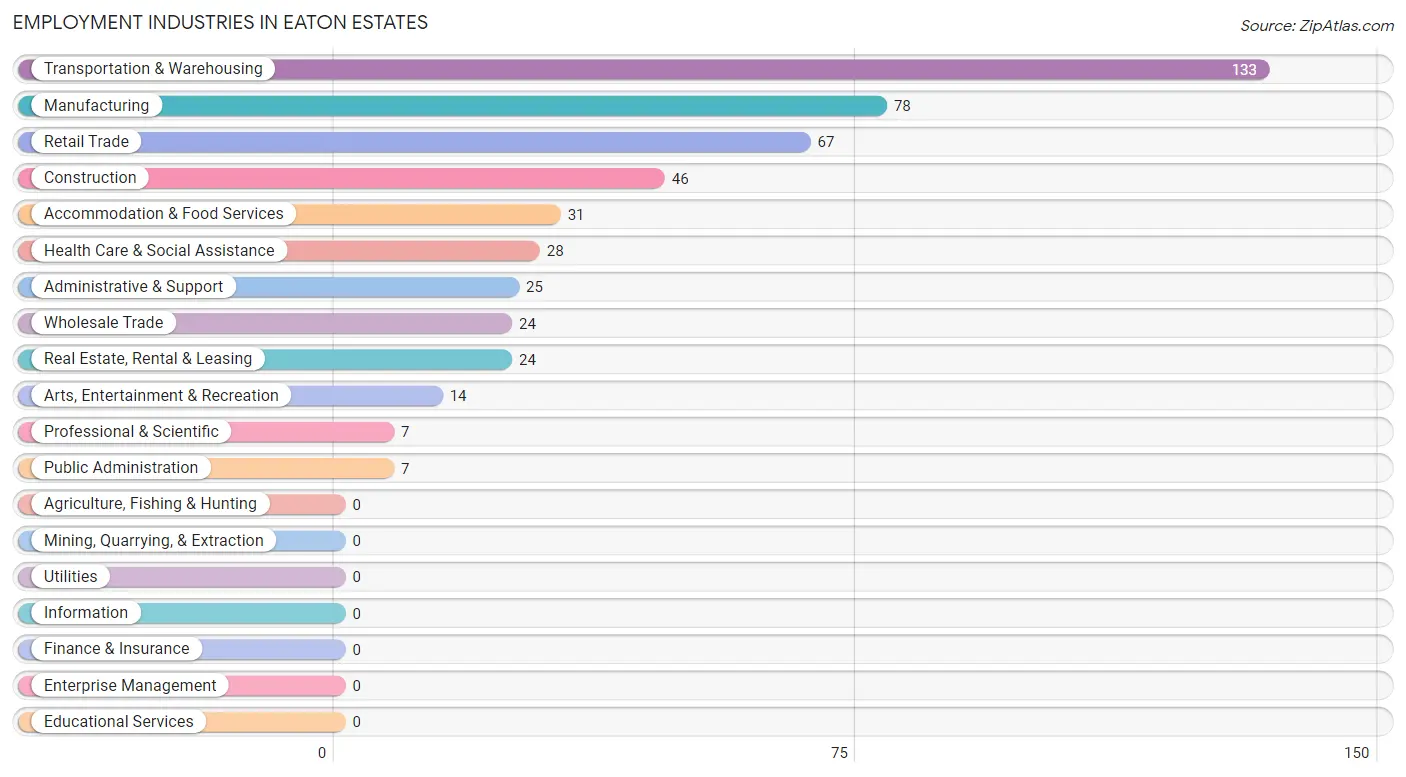
Employment Industries in Eaton Estates
The major employment industries in Eaton Estates include Transportation & Warehousing (133 | 26.6%), Manufacturing (78 | 15.6%), Retail Trade (67 | 13.4%), Construction (46 | 9.2%), and Accommodation & Food Services (31 | 6.2%).
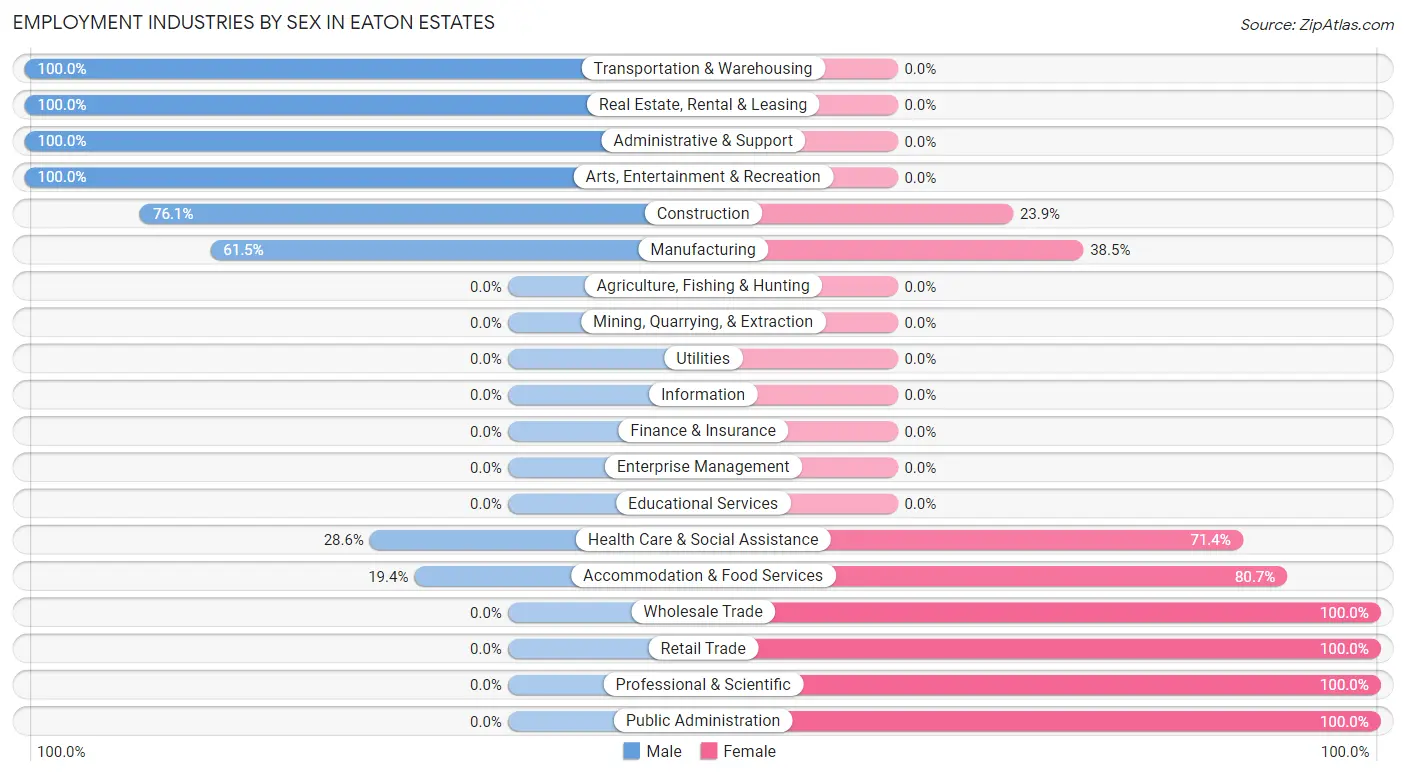
Employment Industries by Sex in Eaton Estates
The Eaton Estates industries that see more men than women are Transportation & Warehousing (100.0%), Real Estate, Rental & Leasing (100.0%), and Administrative & Support (100.0%), whereas the industries that tend to have a higher number of women are Wholesale Trade (100.0%), Retail Trade (100.0%), and Professional & Scientific (100.0%).
| Industry | Male | Female |
| Agriculture, Fishing & Hunting | 0 (0.0%) | 0 (0.0%) |
| Mining, Quarrying, & Extraction | 0 (0.0%) | 0 (0.0%) |
| Construction | 35 (76.1%) | 11 (23.9%) |
| Manufacturing | 48 (61.5%) | 30 (38.5%) |
| Wholesale Trade | 0 (0.0%) | 24 (100.0%) |
| Retail Trade | 0 (0.0%) | 67 (100.0%) |
| Transportation & Warehousing | 133 (100.0%) | 0 (0.0%) |
| Utilities | 0 (0.0%) | 0 (0.0%) |
| Information | 0 (0.0%) | 0 (0.0%) |
| Finance & Insurance | 0 (0.0%) | 0 (0.0%) |
| Real Estate, Rental & Leasing | 24 (100.0%) | 0 (0.0%) |
| Professional & Scientific | 0 (0.0%) | 7 (100.0%) |
| Enterprise Management | 0 (0.0%) | 0 (0.0%) |
| Administrative & Support | 25 (100.0%) | 0 (0.0%) |
| Educational Services | 0 (0.0%) | 0 (0.0%) |
| Health Care & Social Assistance | 8 (28.6%) | 20 (71.4%) |
| Arts, Entertainment & Recreation | 14 (100.0%) | 0 (0.0%) |
| Accommodation & Food Services | 6 (19.4%) | 25 (80.6%) |
| Public Administration | 0 (0.0%) | 7 (100.0%) |
| Total | 293 (58.6%) | 207 (41.4%) |
Education in Eaton Estates
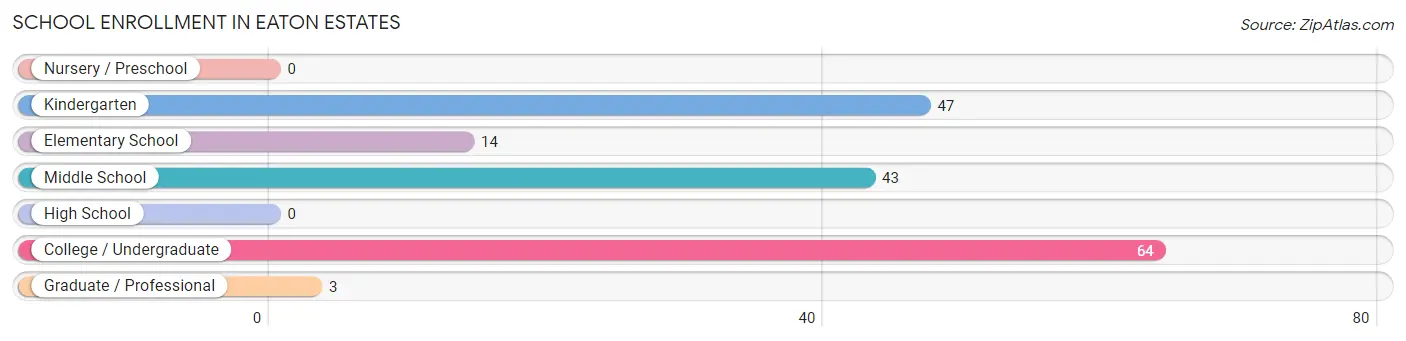
School Enrollment in Eaton Estates
The most common levels of schooling among the 171 students in Eaton Estates are college / undergraduate (64 | 37.4%), kindergarten (47 | 27.5%), and middle school (43 | 25.2%).
| School Level | # Students | % Students |
| Nursery / Preschool | 0 | 0.0% |
| Kindergarten | 47 | 27.5% |
| Elementary School | 14 | 8.2% |
| Middle School | 43 | 25.2% |
| High School | 0 | 0.0% |
| College / Undergraduate | 64 | 37.4% |
| Graduate / Professional | 3 | 1.8% |
| Total | 171 | 100.0% |
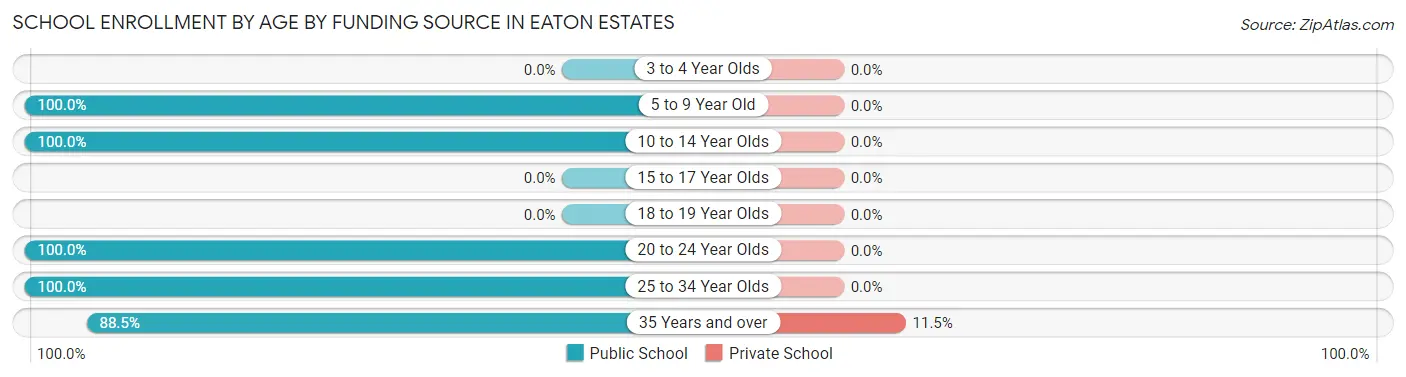
School Enrollment by Age by Funding Source in Eaton Estates
Out of a total of 171 students who are enrolled in schools in Eaton Estates, 3 (1.8%) attend a private institution, while the remaining 168 (98.2%) are enrolled in public schools. The age group of 35 years and over has the highest likelihood of being enrolled in private schools, with 3 (11.5% in the age bracket) enrolled. Conversely, the age group of 5 to 9 year old has the lowest likelihood of being enrolled in a private school, with 61 (100.0% in the age bracket) attending a public institution.
| Age Bracket | Public School | Private School |
| 3 to 4 Year Olds | 0 (0.0%) | 0 (0.0%) |
| 5 to 9 Year Old | 61 (100.0%) | 0 (0.0%) |
| 10 to 14 Year Olds | 43 (100.0%) | 0 (0.0%) |
| 15 to 17 Year Olds | 0 (0.0%) | 0 (0.0%) |
| 18 to 19 Year Olds | 0 (0.0%) | 0 (0.0%) |
| 20 to 24 Year Olds | 6 (100.0%) | 0 (0.0%) |
| 25 to 34 Year Olds | 35 (100.0%) | 0 (0.0%) |
| 35 Years and over | 23 (88.5%) | 3 (11.5%) |
| Total | 168 (98.2%) | 3 (1.8%) |
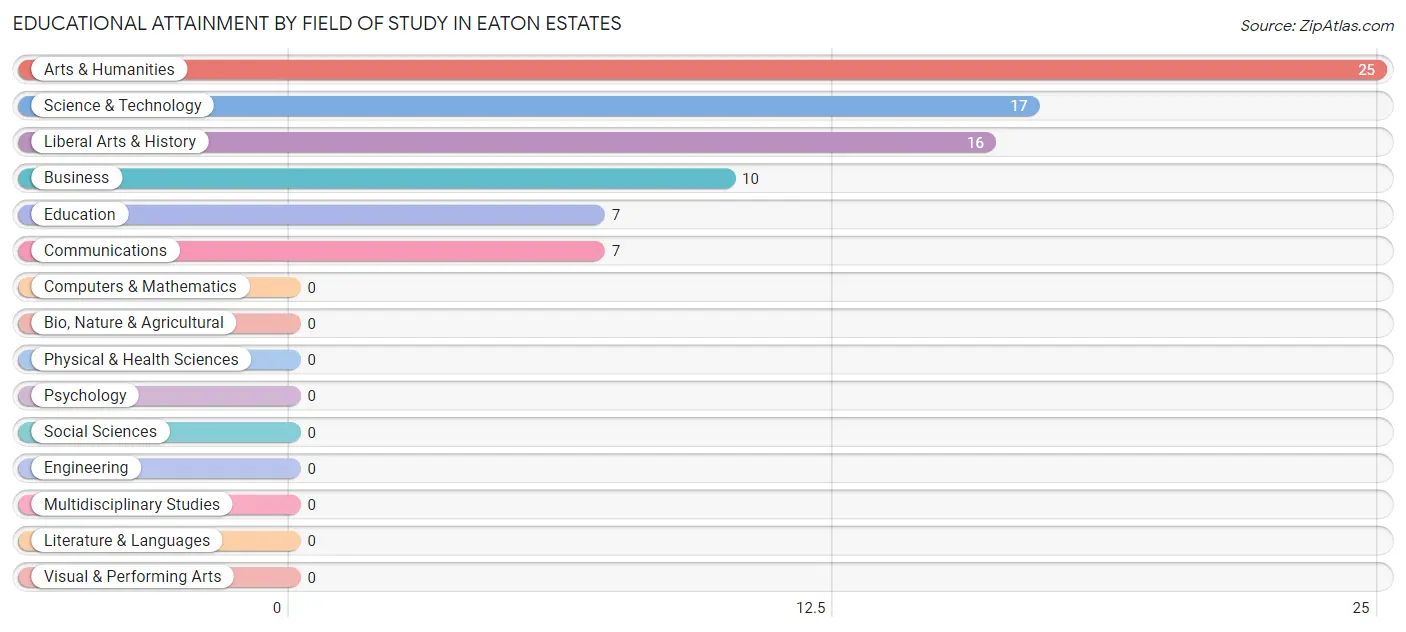
Educational Attainment by Field of Study in Eaton Estates
Arts & humanities (25 | 30.5%), science & technology (17 | 20.7%), liberal arts & history (16 | 19.5%), business (10 | 12.2%), and education (7 | 8.5%) are the most common fields of study among 82 individuals in Eaton Estates who have obtained a bachelor's degree or higher.
| Field of Study | # Graduates | % Graduates |
| Computers & Mathematics | 0 | 0.0% |
| Bio, Nature & Agricultural | 0 | 0.0% |
| Physical & Health Sciences | 0 | 0.0% |
| Psychology | 0 | 0.0% |
| Social Sciences | 0 | 0.0% |
| Engineering | 0 | 0.0% |
| Multidisciplinary Studies | 0 | 0.0% |
| Science & Technology | 17 | 20.7% |
| Business | 10 | 12.2% |
| Education | 7 | 8.5% |
| Literature & Languages | 0 | 0.0% |
| Liberal Arts & History | 16 | 19.5% |
| Visual & Performing Arts | 0 | 0.0% |
| Communications | 7 | 8.5% |
| Arts & Humanities | 25 | 30.5% |
| Total | 82 | 100.0% |
Transportation & Commute in Eaton Estates
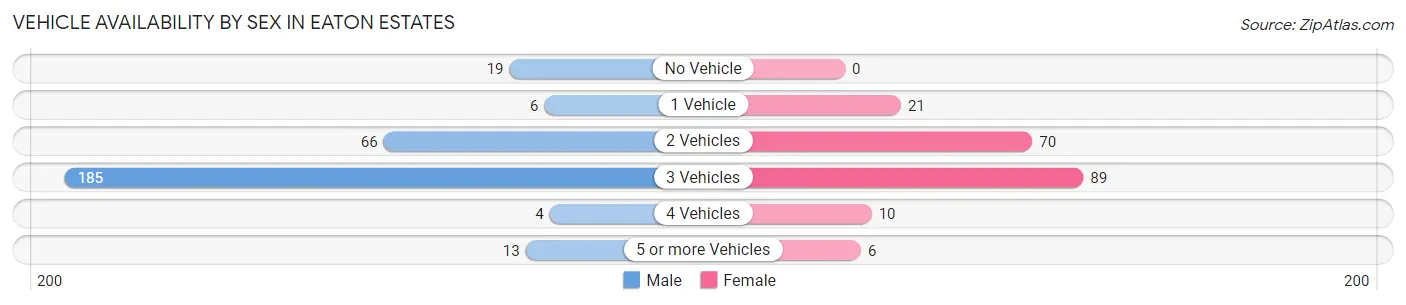
Vehicle Availability by Sex in Eaton Estates
The most prevalent vehicle ownership categories in Eaton Estates are males with 3 vehicles (185, accounting for 63.1%) and females with 3 vehicles (89, making up 94.4%).
| Vehicles Available | Male | Female |
| No Vehicle | 19 (6.5%) | 0 (0.0%) |
| 1 Vehicle | 6 (2.1%) | 21 (10.7%) |
| 2 Vehicles | 66 (22.5%) | 70 (35.7%) |
| 3 Vehicles | 185 (63.1%) | 89 (45.4%) |
| 4 Vehicles | 4 (1.4%) | 10 (5.1%) |
| 5 or more Vehicles | 13 (4.4%) | 6 (3.1%) |
| Total | 293 (100.0%) | 196 (100.0%) |
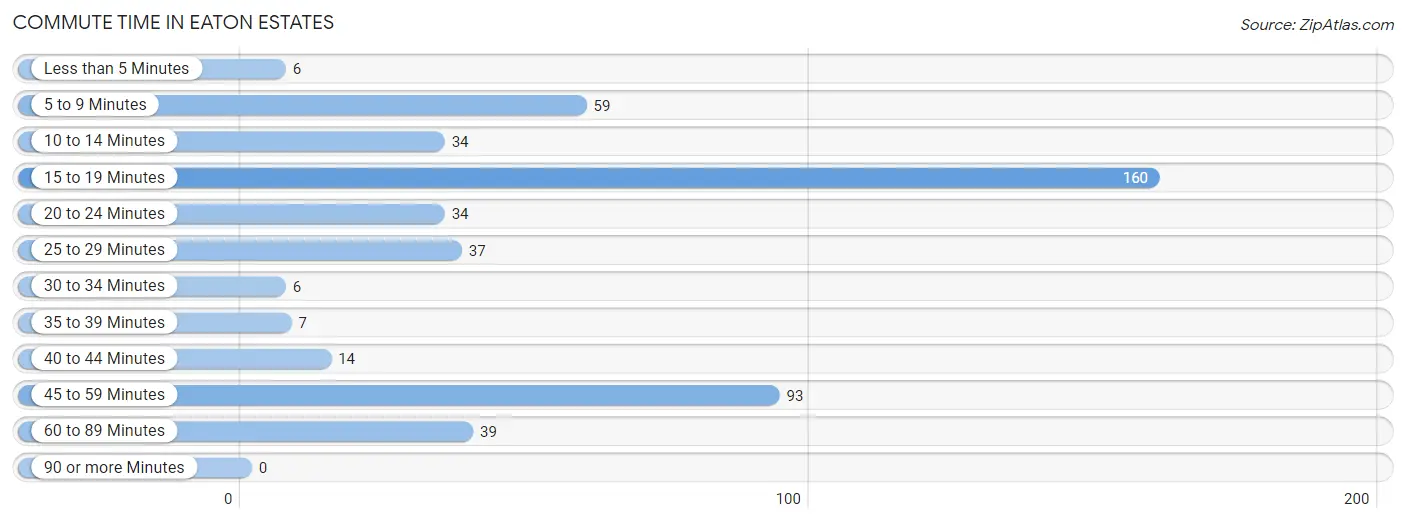
Commute Time in Eaton Estates
The most frequently occuring commute durations in Eaton Estates are 15 to 19 minutes (160 commuters, 32.7%), 45 to 59 minutes (93 commuters, 19.0%), and 5 to 9 minutes (59 commuters, 12.1%).
| Commute Time | # Commuters | % Commuters |
| Less than 5 Minutes | 6 | 1.2% |
| 5 to 9 Minutes | 59 | 12.1% |
| 10 to 14 Minutes | 34 | 7.0% |
| 15 to 19 Minutes | 160 | 32.7% |
| 20 to 24 Minutes | 34 | 7.0% |
| 25 to 29 Minutes | 37 | 7.6% |
| 30 to 34 Minutes | 6 | 1.2% |
| 35 to 39 Minutes | 7 | 1.4% |
| 40 to 44 Minutes | 14 | 2.9% |
| 45 to 59 Minutes | 93 | 19.0% |
| 60 to 89 Minutes | 39 | 8.0% |
| 90 or more Minutes | 0 | 0.0% |
Commute Time by Sex in Eaton Estates
The most common commute times in Eaton Estates are 45 to 59 minutes (90 commuters, 30.7%) for males and 15 to 19 minutes (74 commuters, 37.8%) for females.
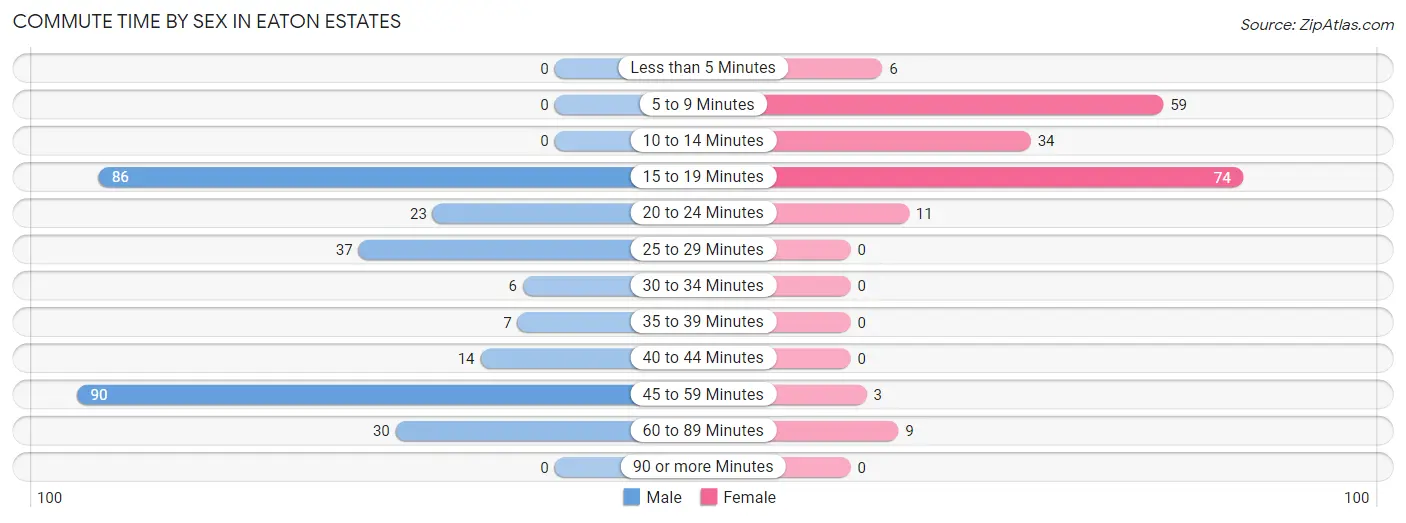
| Commute Time | Male | Female |
| Less than 5 Minutes | 0 (0.0%) | 6 (3.1%) |
| 5 to 9 Minutes | 0 (0.0%) | 59 (30.1%) |
| 10 to 14 Minutes | 0 (0.0%) | 34 (17.3%) |
| 15 to 19 Minutes | 86 (29.3%) | 74 (37.8%) |
| 20 to 24 Minutes | 23 (7.9%) | 11 (5.6%) |
| 25 to 29 Minutes | 37 (12.6%) | 0 (0.0%) |
| 30 to 34 Minutes | 6 (2.1%) | 0 (0.0%) |
| 35 to 39 Minutes | 7 (2.4%) | 0 (0.0%) |
| 40 to 44 Minutes | 14 (4.8%) | 0 (0.0%) |
| 45 to 59 Minutes | 90 (30.7%) | 3 (1.5%) |
| 60 to 89 Minutes | 30 (10.2%) | 9 (4.6%) |
| 90 or more Minutes | 0 (0.0%) | 0 (0.0%) |
Time of Departure to Work by Sex in Eaton Estates
The most frequent times of departure to work in Eaton Estates are 7:00 AM to 7:29 AM (100, 34.1%) for males and 11:00 AM to 11:59 AM (72, 36.7%) for females.
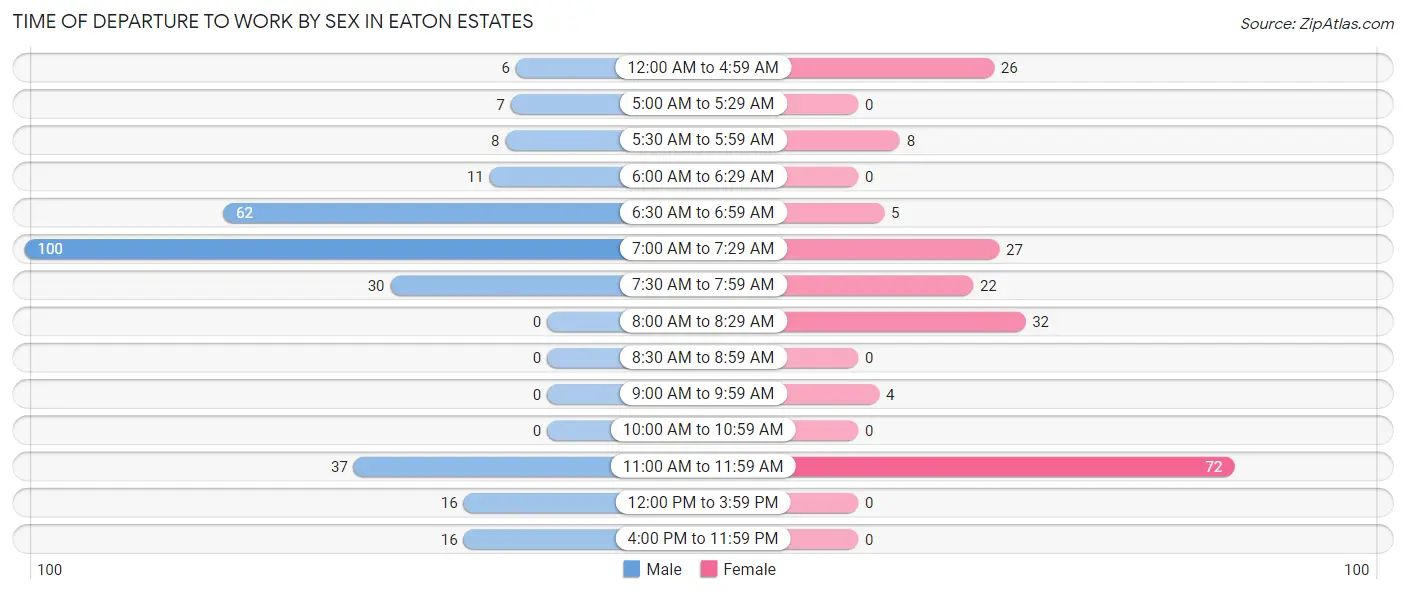
| Time of Departure | Male | Female |
| 12:00 AM to 4:59 AM | 6 (2.1%) | 26 (13.3%) |
| 5:00 AM to 5:29 AM | 7 (2.4%) | 0 (0.0%) |
| 5:30 AM to 5:59 AM | 8 (2.7%) | 8 (4.1%) |
| 6:00 AM to 6:29 AM | 11 (3.7%) | 0 (0.0%) |
| 6:30 AM to 6:59 AM | 62 (21.2%) | 5 (2.5%) |
| 7:00 AM to 7:29 AM | 100 (34.1%) | 27 (13.8%) |
| 7:30 AM to 7:59 AM | 30 (10.2%) | 22 (11.2%) |
| 8:00 AM to 8:29 AM | 0 (0.0%) | 32 (16.3%) |
| 8:30 AM to 8:59 AM | 0 (0.0%) | 0 (0.0%) |
| 9:00 AM to 9:59 AM | 0 (0.0%) | 4 (2.0%) |
| 10:00 AM to 10:59 AM | 0 (0.0%) | 0 (0.0%) |
| 11:00 AM to 11:59 AM | 37 (12.6%) | 72 (36.7%) |
| 12:00 PM to 3:59 PM | 16 (5.5%) | 0 (0.0%) |
| 4:00 PM to 11:59 PM | 16 (5.5%) | 0 (0.0%) |
| Total | 293 (100.0%) | 196 (100.0%) |
Housing Occupancy in Eaton Estates
Occupancy by Ownership in Eaton Estates
Of the total 455 dwellings in Eaton Estates, owner-occupied units account for 403 (88.6%), while renter-occupied units make up 52 (11.4%).
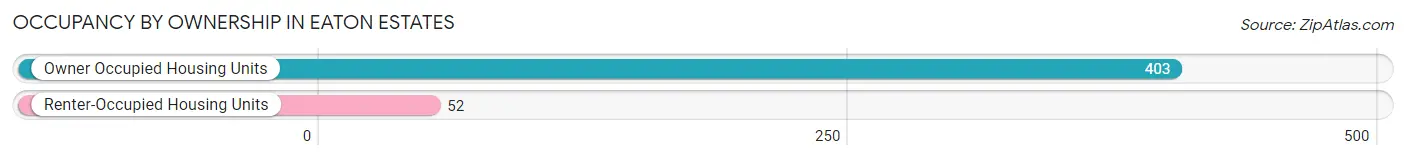
| Occupancy | # Housing Units | % Housing Units |
| Owner Occupied Housing Units | 403 | 88.6% |
| Renter-Occupied Housing Units | 52 | 11.4% |
| Total Occupied Housing Units | 455 | 100.0% |
Occupancy by Household Size in Eaton Estates
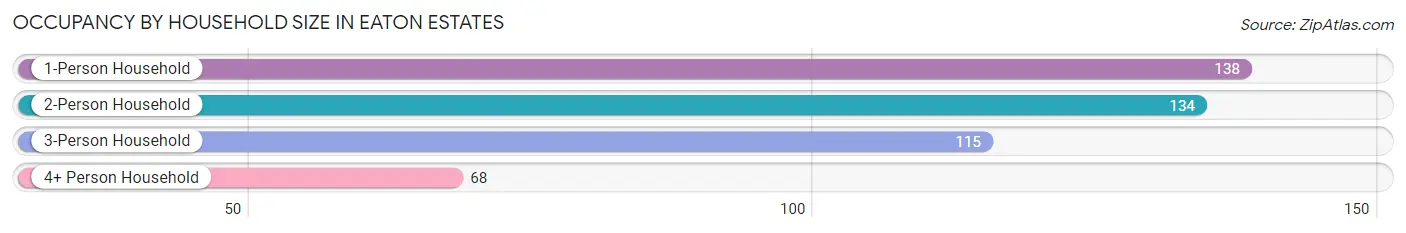
| Household Size | # Housing Units | % Housing Units |
| 1-Person Household | 138 | 30.3% |
| 2-Person Household | 134 | 29.4% |
| 3-Person Household | 115 | 25.3% |
| 4+ Person Household | 68 | 14.9% |
| Total Housing Units | 455 | 100.0% |
Occupancy by Ownership by Household Size in Eaton Estates
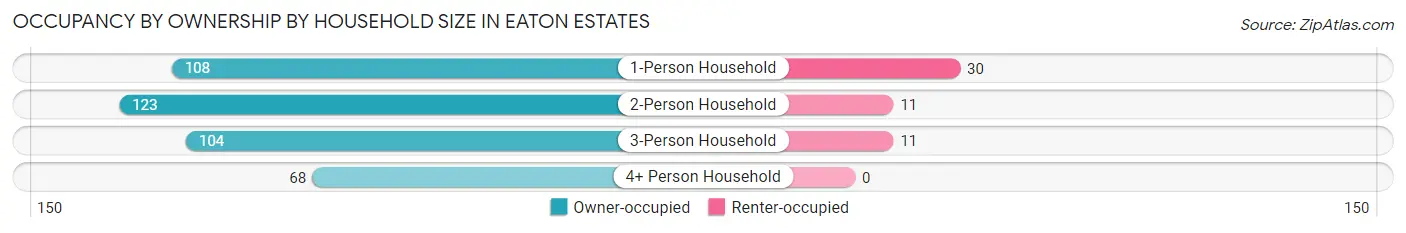
| Household Size | Owner-occupied | Renter-occupied |
| 1-Person Household | 108 (78.3%) | 30 (21.7%) |
| 2-Person Household | 123 (91.8%) | 11 (8.2%) |
| 3-Person Household | 104 (90.4%) | 11 (9.6%) |
| 4+ Person Household | 68 (100.0%) | 0 (0.0%) |
| Total Housing Units | 403 (88.6%) | 52 (11.4%) |
Occupancy by Educational Attainment in Eaton Estates
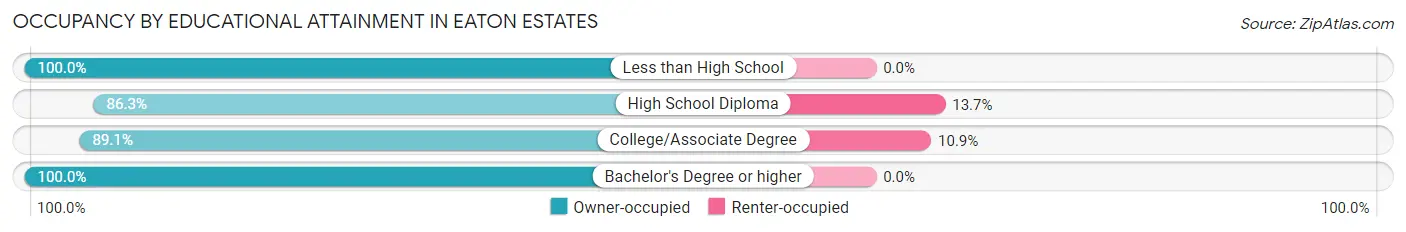
| Household Size | Owner-occupied | Renter-occupied |
| Less than High School | 14 (100.0%) | 0 (0.0%) |
| High School Diploma | 189 (86.3%) | 30 (13.7%) |
| College/Associate Degree | 180 (89.1%) | 22 (10.9%) |
| Bachelor's Degree or higher | 20 (100.0%) | 0 (0.0%) |
Occupancy by Age of Householder in Eaton Estates
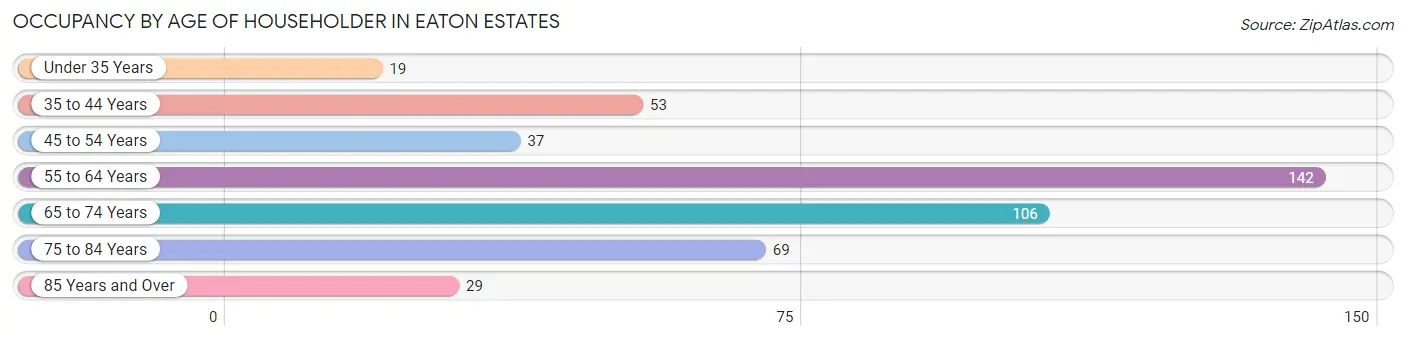
| Age Bracket | # Households | % Households |
| Under 35 Years | 19 | 4.2% |
| 35 to 44 Years | 53 | 11.7% |
| 45 to 54 Years | 37 | 8.1% |
| 55 to 64 Years | 142 | 31.2% |
| 65 to 74 Years | 106 | 23.3% |
| 75 to 84 Years | 69 | 15.2% |
| 85 Years and Over | 29 | 6.4% |
| Total | 455 | 100.0% |
Housing Finances in Eaton Estates
Median Income by Occupancy in Eaton Estates
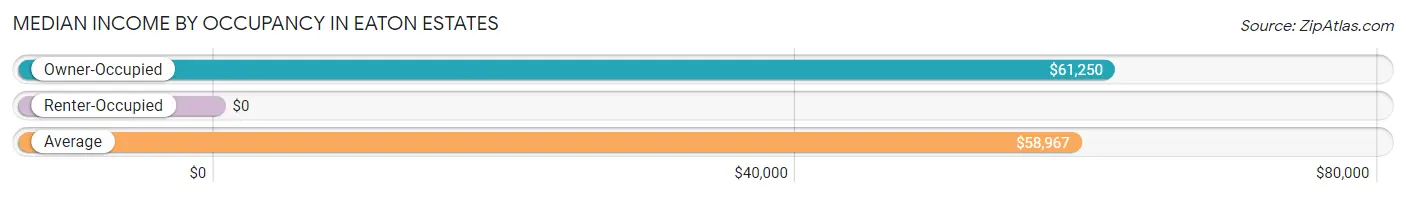
| Occupancy Type | # Households | Median Income |
| Owner-Occupied | 403 (88.6%) | $61,250 |
| Renter-Occupied | 52 (11.4%) | $0 |
| Average | 455 (100.0%) | $58,967 |
Occupancy by Householder Income Bracket in Eaton Estates
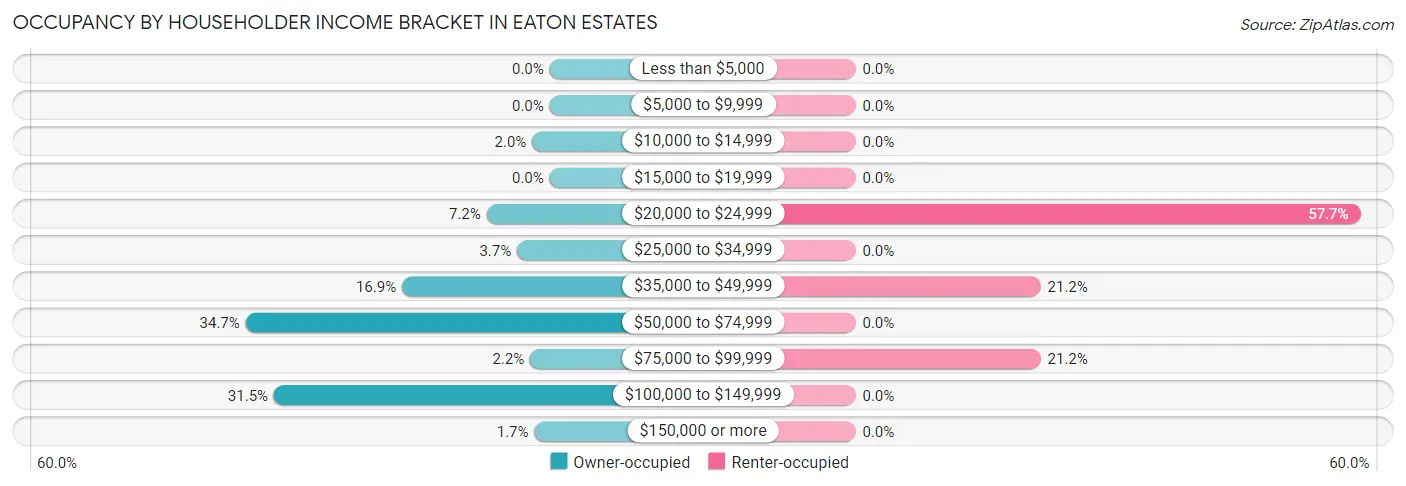
| Income Bracket | Owner-occupied | Renter-occupied |
| Less than $5,000 | 0 (0.0%) | 0 (0.0%) |
| $5,000 to $9,999 | 0 (0.0%) | 0 (0.0%) |
| $10,000 to $14,999 | 8 (2.0%) | 0 (0.0%) |
| $15,000 to $19,999 | 0 (0.0%) | 0 (0.0%) |
| $20,000 to $24,999 | 29 (7.2%) | 30 (57.7%) |
| $25,000 to $34,999 | 15 (3.7%) | 0 (0.0%) |
| $35,000 to $49,999 | 68 (16.9%) | 11 (21.1%) |
| $50,000 to $74,999 | 140 (34.7%) | 0 (0.0%) |
| $75,000 to $99,999 | 9 (2.2%) | 11 (21.1%) |
| $100,000 to $149,999 | 127 (31.5%) | 0 (0.0%) |
| $150,000 or more | 7 (1.7%) | 0 (0.0%) |
| Total | 403 (100.0%) | 52 (100.0%) |
Monthly Housing Cost Tiers in Eaton Estates
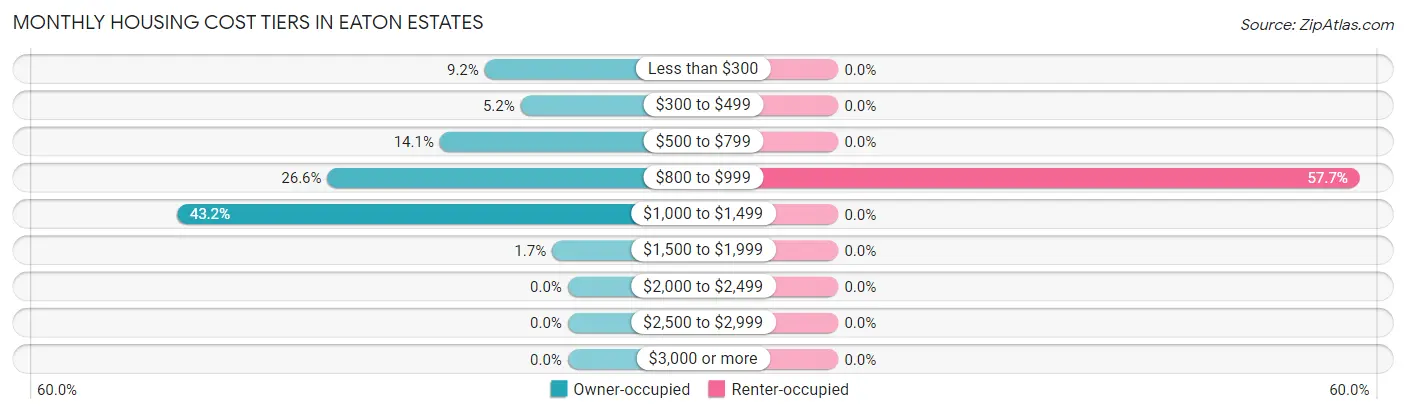
| Monthly Cost | Owner-occupied | Renter-occupied |
| Less than $300 | 37 (9.2%) | 0 (0.0%) |
| $300 to $499 | 21 (5.2%) | 0 (0.0%) |
| $500 to $799 | 57 (14.1%) | 0 (0.0%) |
| $800 to $999 | 107 (26.6%) | 30 (57.7%) |
| $1,000 to $1,499 | 174 (43.2%) | 0 (0.0%) |
| $1,500 to $1,999 | 7 (1.7%) | 0 (0.0%) |
| $2,000 to $2,499 | 0 (0.0%) | 0 (0.0%) |
| $2,500 to $2,999 | 0 (0.0%) | 0 (0.0%) |
| $3,000 or more | 0 (0.0%) | 0 (0.0%) |
| Total | 403 (100.0%) | 52 (100.0%) |
Physical Housing Characteristics in Eaton Estates
Housing Structures in Eaton Estates
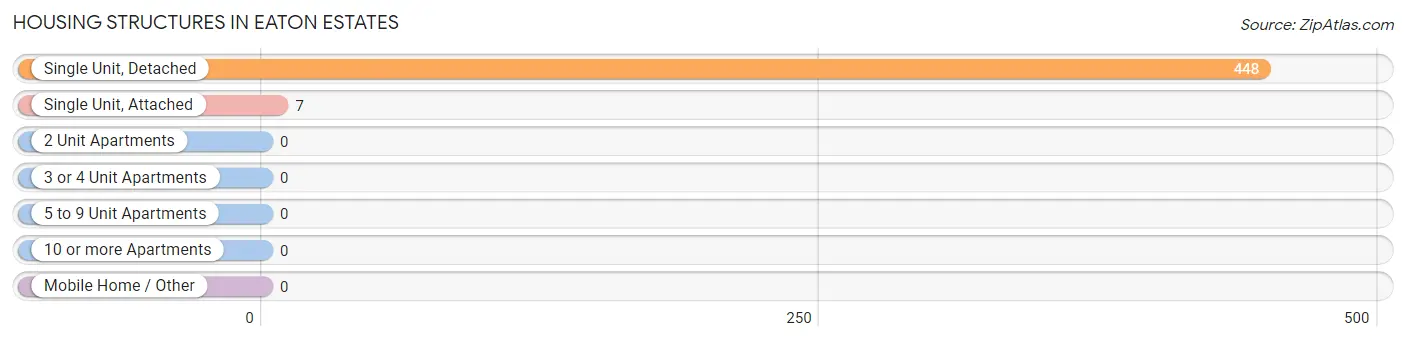
| Structure Type | # Housing Units | % Housing Units |
| Single Unit, Detached | 448 | 98.5% |
| Single Unit, Attached | 7 | 1.5% |
| 2 Unit Apartments | 0 | 0.0% |
| 3 or 4 Unit Apartments | 0 | 0.0% |
| 5 to 9 Unit Apartments | 0 | 0.0% |
| 10 or more Apartments | 0 | 0.0% |
| Mobile Home / Other | 0 | 0.0% |
| Total | 455 | 100.0% |
Housing Structures by Occupancy in Eaton Estates
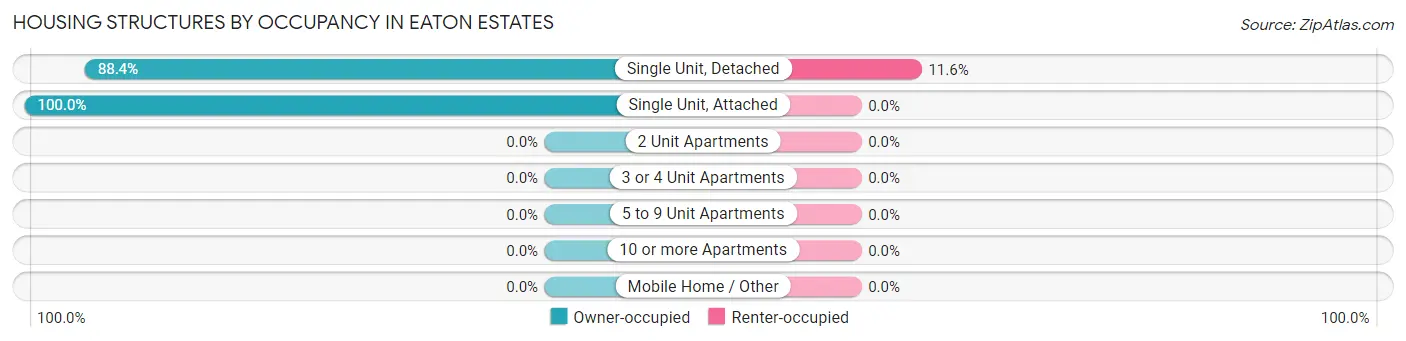
| Structure Type | Owner-occupied | Renter-occupied |
| Single Unit, Detached | 396 (88.4%) | 52 (11.6%) |
| Single Unit, Attached | 7 (100.0%) | 0 (0.0%) |
| 2 Unit Apartments | 0 (0.0%) | 0 (0.0%) |
| 3 or 4 Unit Apartments | 0 (0.0%) | 0 (0.0%) |
| 5 to 9 Unit Apartments | 0 (0.0%) | 0 (0.0%) |
| 10 or more Apartments | 0 (0.0%) | 0 (0.0%) |
| Mobile Home / Other | 0 (0.0%) | 0 (0.0%) |
| Total | 403 (88.6%) | 52 (11.4%) |
Housing Structures by Number of Rooms in Eaton Estates
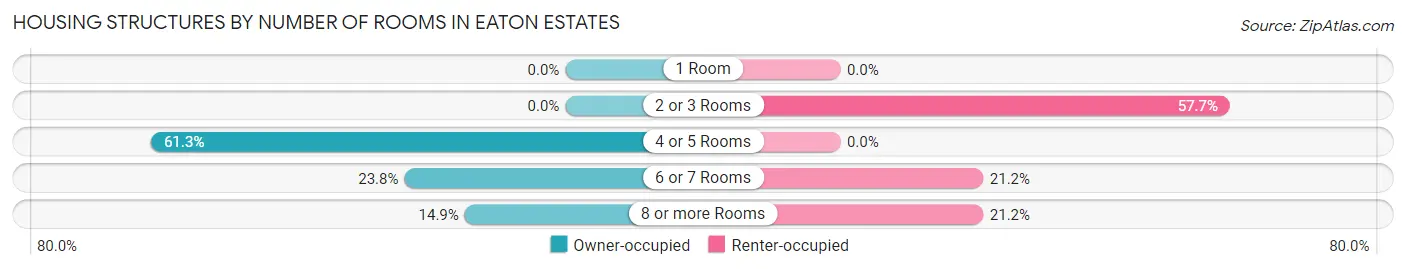
| Number of Rooms | Owner-occupied | Renter-occupied |
| 1 Room | 0 (0.0%) | 0 (0.0%) |
| 2 or 3 Rooms | 0 (0.0%) | 30 (57.7%) |
| 4 or 5 Rooms | 247 (61.3%) | 0 (0.0%) |
| 6 or 7 Rooms | 96 (23.8%) | 11 (21.1%) |
| 8 or more Rooms | 60 (14.9%) | 11 (21.1%) |
| Total | 403 (100.0%) | 52 (100.0%) |
Housing Structure by Heating Type in Eaton Estates
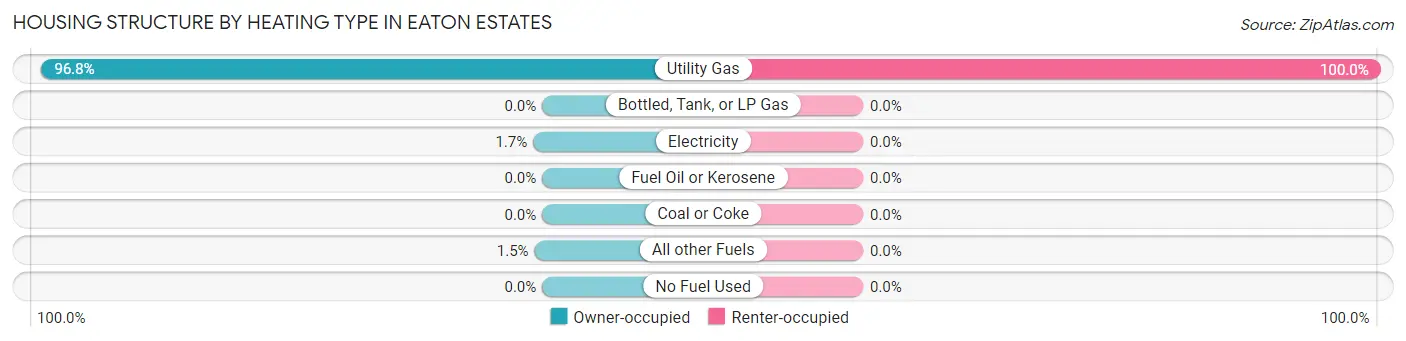
| Heating Type | Owner-occupied | Renter-occupied |
| Utility Gas | 390 (96.8%) | 52 (100.0%) |
| Bottled, Tank, or LP Gas | 0 (0.0%) | 0 (0.0%) |
| Electricity | 7 (1.7%) | 0 (0.0%) |
| Fuel Oil or Kerosene | 0 (0.0%) | 0 (0.0%) |
| Coal or Coke | 0 (0.0%) | 0 (0.0%) |
| All other Fuels | 6 (1.5%) | 0 (0.0%) |
| No Fuel Used | 0 (0.0%) | 0 (0.0%) |
| Total | 403 (100.0%) | 52 (100.0%) |
Household Vehicle Usage in Eaton Estates
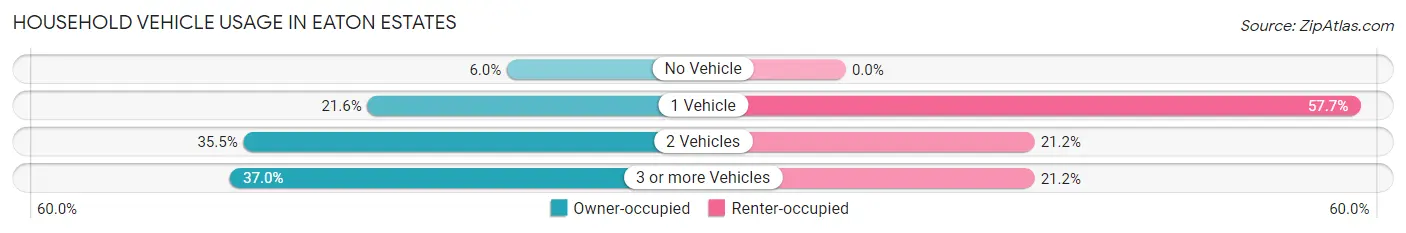
| Vehicles per Household | Owner-occupied | Renter-occupied |
| No Vehicle | 24 (6.0%) | 0 (0.0%) |
| 1 Vehicle | 87 (21.6%) | 30 (57.7%) |
| 2 Vehicles | 143 (35.5%) | 11 (21.1%) |
| 3 or more Vehicles | 149 (37.0%) | 11 (21.1%) |
| Total | 403 (100.0%) | 52 (100.0%) |
Real Estate & Mortgages in Eaton Estates
Real Estate and Mortgage Overview in Eaton Estates
| Characteristic | Without Mortgage | With Mortgage |
| Housing Units | 144 | 259 |
| Median Property Value | $116,300 | $112,300 |
| Median Household Income | $72,500 | $7 |
| Monthly Housing Costs | $600 | $0 |
| Real Estate Taxes | - | - |
Property Value by Mortgage Status in Eaton Estates
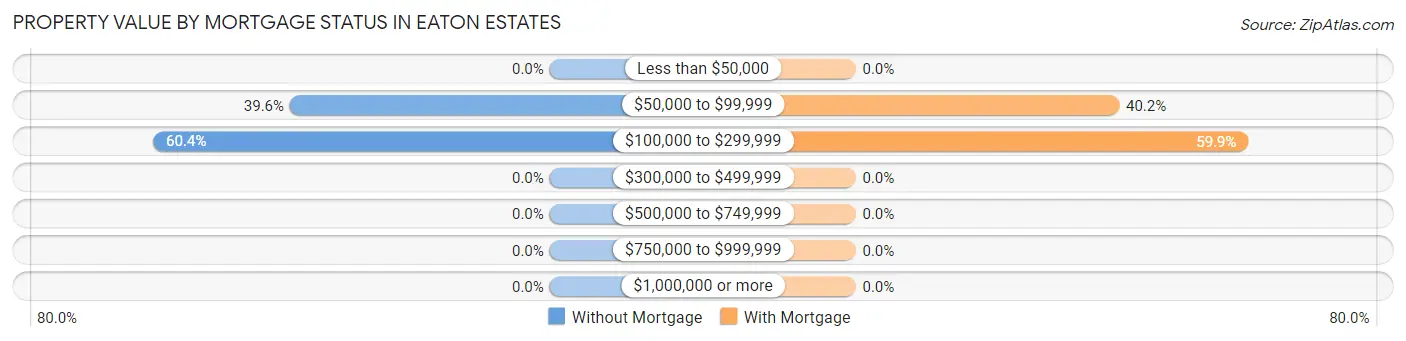
| Property Value | Without Mortgage | With Mortgage |
| Less than $50,000 | 0 (0.0%) | 0 (0.0%) |
| $50,000 to $99,999 | 57 (39.6%) | 104 (40.2%) |
| $100,000 to $299,999 | 87 (60.4%) | 155 (59.9%) |
| $300,000 to $499,999 | 0 (0.0%) | 0 (0.0%) |
| $500,000 to $749,999 | 0 (0.0%) | 0 (0.0%) |
| $750,000 to $999,999 | 0 (0.0%) | 0 (0.0%) |
| $1,000,000 or more | 0 (0.0%) | 0 (0.0%) |
| Total | 144 (100.0%) | 259 (100.0%) |
Household Income by Mortgage Status in Eaton Estates
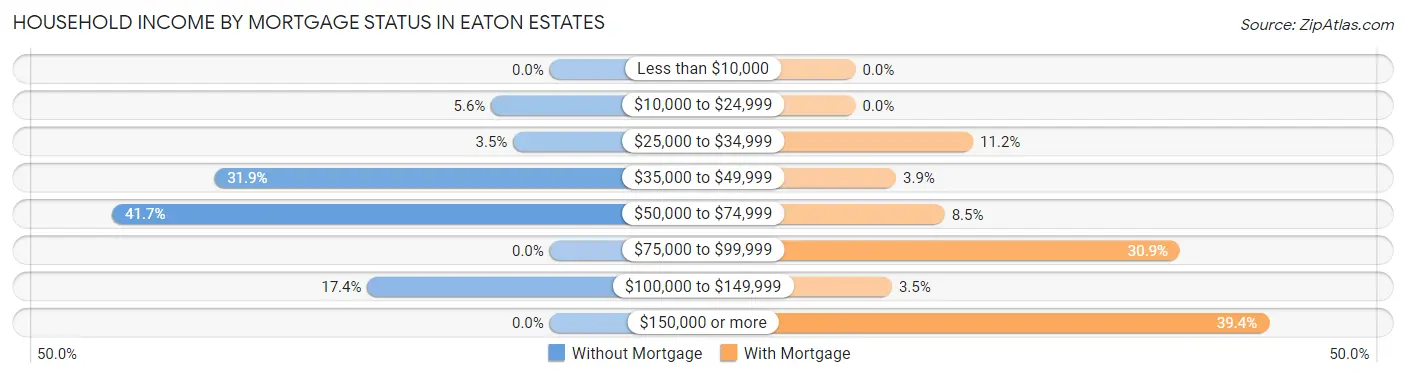
| Household Income | Without Mortgage | With Mortgage |
| Less than $10,000 | 0 (0.0%) | 0 (0.0%) |
| $10,000 to $24,999 | 8 (5.6%) | 0 (0.0%) |
| $25,000 to $34,999 | 5 (3.5%) | 29 (11.2%) |
| $35,000 to $49,999 | 46 (31.9%) | 10 (3.9%) |
| $50,000 to $74,999 | 60 (41.7%) | 22 (8.5%) |
| $75,000 to $99,999 | 0 (0.0%) | 80 (30.9%) |
| $100,000 to $149,999 | 25 (17.4%) | 9 (3.5%) |
| $150,000 or more | 0 (0.0%) | 102 (39.4%) |
| Total | 144 (100.0%) | 259 (100.0%) |
Property Value to Household Income Ratio in Eaton Estates
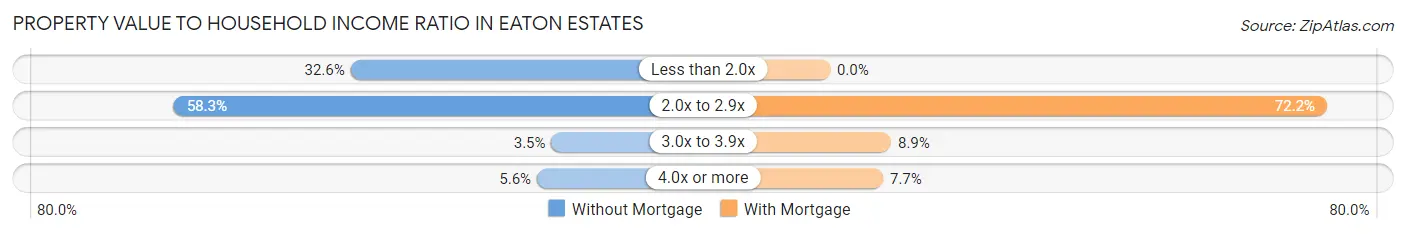
| Value-to-Income Ratio | Without Mortgage | With Mortgage |
| Less than 2.0x | 47 (32.6%) | 0 (0.0%) |
| 2.0x to 2.9x | 84 (58.3%) | 187 (72.2%) |
| 3.0x to 3.9x | 5 (3.5%) | 23 (8.9%) |
| 4.0x or more | 8 (5.6%) | 20 (7.7%) |
| Total | 144 (100.0%) | 259 (100.0%) |
Real Estate Taxes by Mortgage Status in Eaton Estates
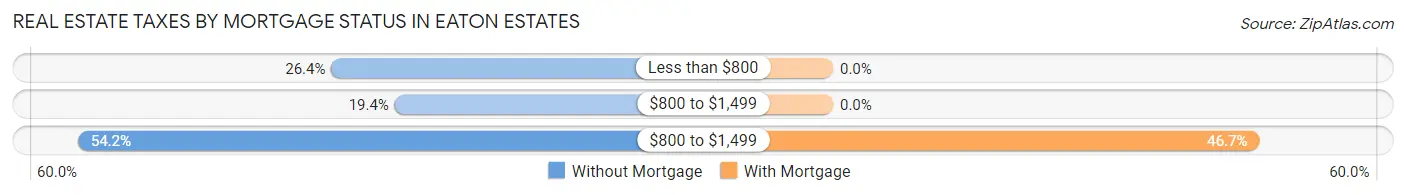
| Property Taxes | Without Mortgage | With Mortgage |
| Less than $800 | 38 (26.4%) | 0 (0.0%) |
| $800 to $1,499 | 28 (19.4%) | 0 (0.0%) |
| $800 to $1,499 | 78 (54.2%) | 121 (46.7%) |
| Total | 144 (100.0%) | 259 (100.0%) |
Health & Disability in Eaton Estates
Health Insurance Coverage by Age in Eaton Estates
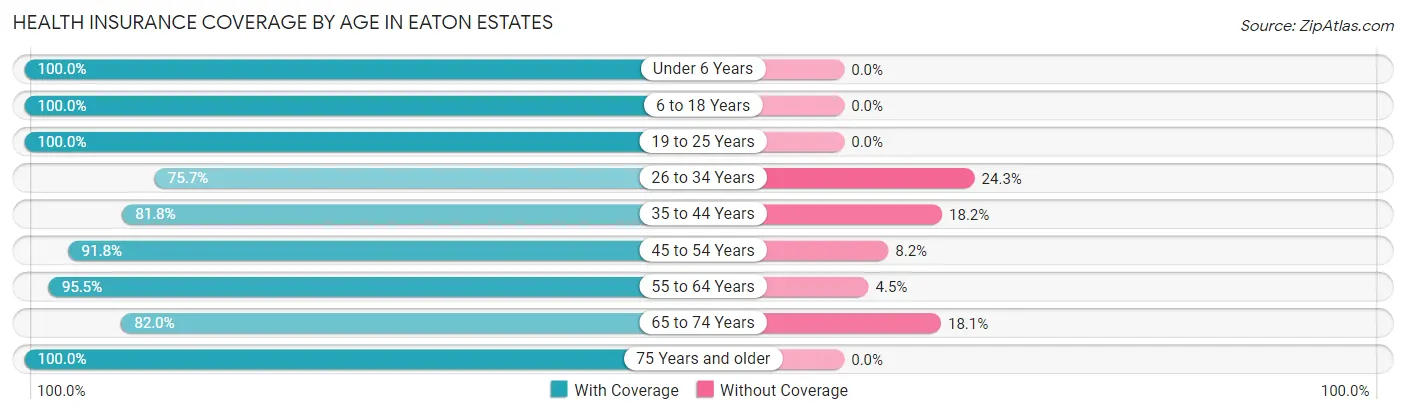
| Age Bracket | With Coverage | Without Coverage |
| Under 6 Years | 19 (100.0%) | 0 (0.0%) |
| 6 to 18 Years | 104 (100.0%) | 0 (0.0%) |
| 19 to 25 Years | 6 (100.0%) | 0 (0.0%) |
| 26 to 34 Years | 109 (75.7%) | 35 (24.3%) |
| 35 to 44 Years | 130 (81.8%) | 29 (18.2%) |
| 45 to 54 Years | 67 (91.8%) | 6 (8.2%) |
| 55 to 64 Years | 358 (95.5%) | 17 (4.5%) |
| 65 to 74 Years | 168 (82.0%) | 37 (18.0%) |
| 75 Years and older | 106 (100.0%) | 0 (0.0%) |
| Total | 1,067 (89.6%) | 124 (10.4%) |
Health Insurance Coverage by Citizenship Status in Eaton Estates
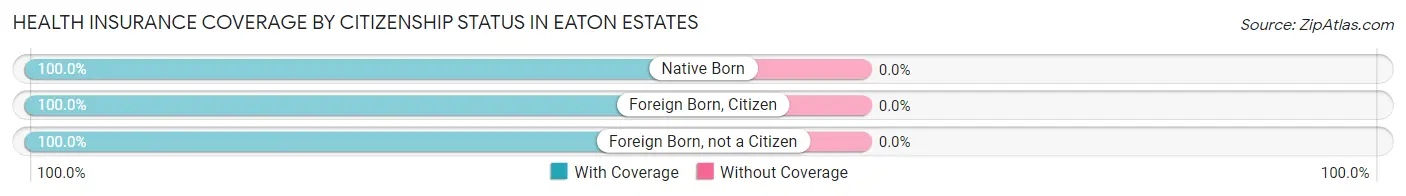
| Citizenship Status | With Coverage | Without Coverage |
| Native Born | 19 (100.0%) | 0 (0.0%) |
| Foreign Born, Citizen | 104 (100.0%) | 0 (0.0%) |
| Foreign Born, not a Citizen | 6 (100.0%) | 0 (0.0%) |
Health Insurance Coverage by Household Income in Eaton Estates
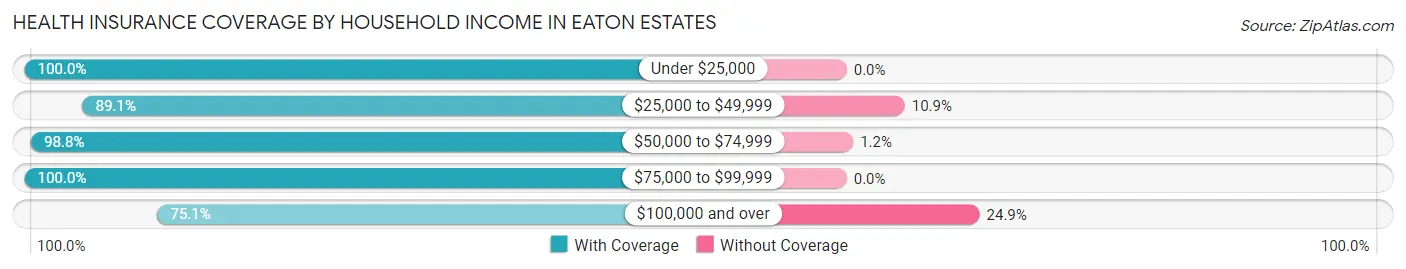
| Household Income | With Coverage | Without Coverage |
| Under $25,000 | 104 (100.0%) | 0 (0.0%) |
| $25,000 to $49,999 | 123 (89.1%) | 15 (10.9%) |
| $50,000 to $74,999 | 491 (98.8%) | 6 (1.2%) |
| $75,000 to $99,999 | 38 (100.0%) | 0 (0.0%) |
| $100,000 and over | 311 (75.1%) | 103 (24.9%) |
Public vs Private Health Insurance Coverage by Age in Eaton Estates
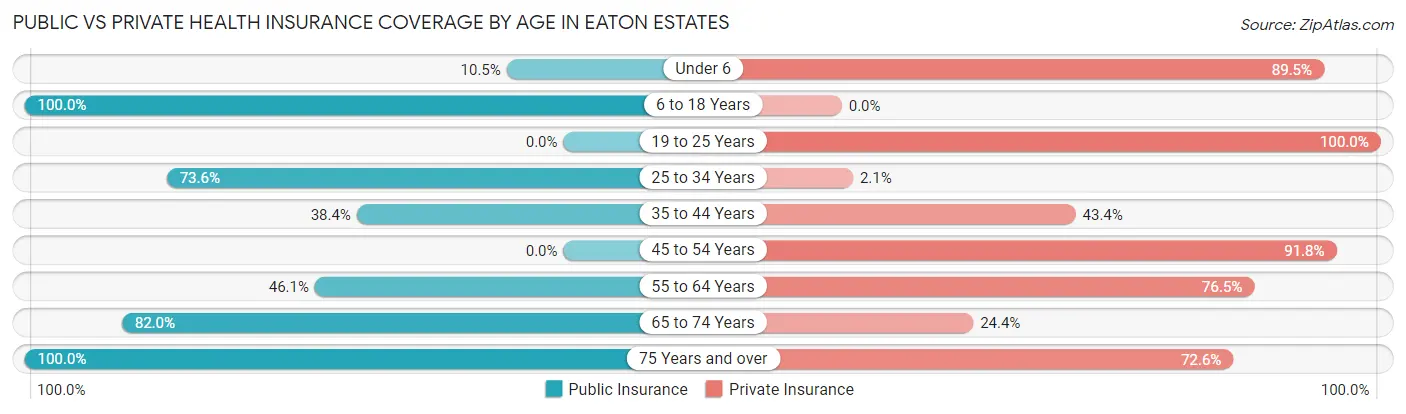
| Age Bracket | Public Insurance | Private Insurance |
| Under 6 | 2 (10.5%) | 17 (89.5%) |
| 6 to 18 Years | 104 (100.0%) | 0 (0.0%) |
| 19 to 25 Years | 0 (0.0%) | 6 (100.0%) |
| 25 to 34 Years | 106 (73.6%) | 3 (2.1%) |
| 35 to 44 Years | 61 (38.4%) | 69 (43.4%) |
| 45 to 54 Years | 0 (0.0%) | 67 (91.8%) |
| 55 to 64 Years | 173 (46.1%) | 287 (76.5%) |
| 65 to 74 Years | 168 (82.0%) | 50 (24.4%) |
| 75 Years and over | 106 (100.0%) | 77 (72.6%) |
| Total | 720 (60.5%) | 576 (48.4%) |
Disability Status by Sex by Age in Eaton Estates
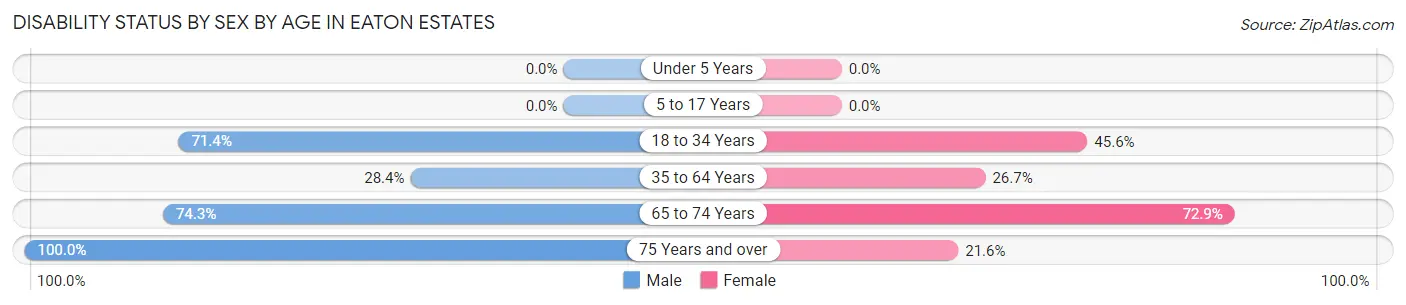
| Age Bracket | Male | Female |
| Under 5 Years | 0 (0.0%) | 0 (0.0%) |
| 5 to 17 Years | 0 (0.0%) | 0 (0.0%) |
| 18 to 34 Years | 10 (71.4%) | 62 (45.6%) |
| 35 to 64 Years | 100 (28.4%) | 68 (26.7%) |
| 65 to 74 Years | 81 (74.3%) | 70 (72.9%) |
| 75 Years and over | 69 (100.0%) | 8 (21.6%) |
Disability Class by Sex by Age in Eaton Estates
Disability Class: Hearing Difficulty
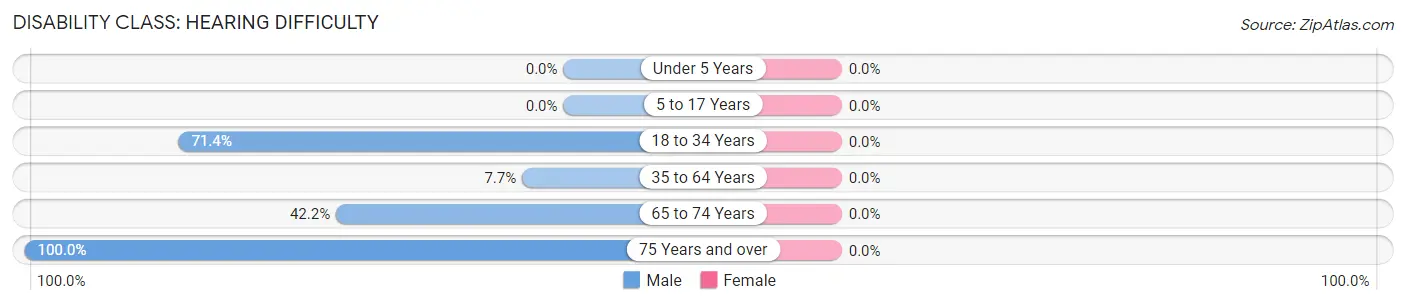
| Age Bracket | Male | Female |
| Under 5 Years | 0 (0.0%) | 0 (0.0%) |
| 5 to 17 Years | 0 (0.0%) | 0 (0.0%) |
| 18 to 34 Years | 10 (71.4%) | 0 (0.0%) |
| 35 to 64 Years | 27 (7.7%) | 0 (0.0%) |
| 65 to 74 Years | 46 (42.2%) | 0 (0.0%) |
| 75 Years and over | 69 (100.0%) | 0 (0.0%) |
Disability Class: Vision Difficulty
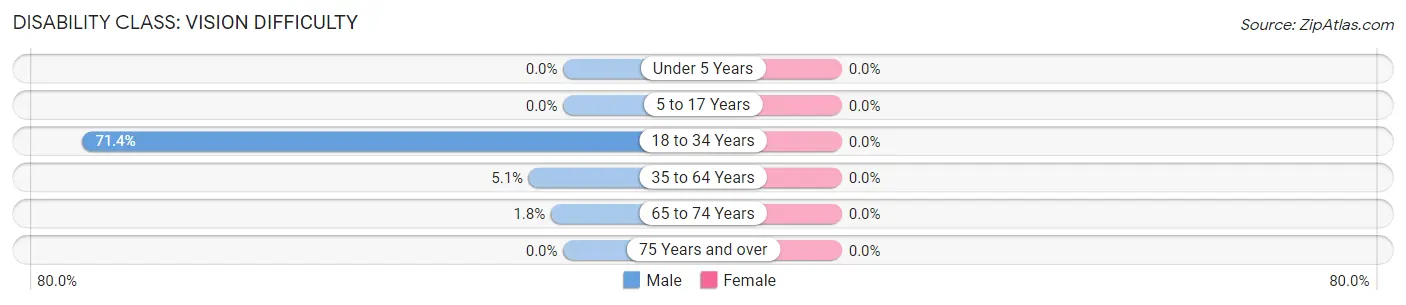
| Age Bracket | Male | Female |
| Under 5 Years | 0 (0.0%) | 0 (0.0%) |
| 5 to 17 Years | 0 (0.0%) | 0 (0.0%) |
| 18 to 34 Years | 10 (71.4%) | 0 (0.0%) |
| 35 to 64 Years | 18 (5.1%) | 0 (0.0%) |
| 65 to 74 Years | 2 (1.8%) | 0 (0.0%) |
| 75 Years and over | 0 (0.0%) | 0 (0.0%) |
Disability Class: Cognitive Difficulty
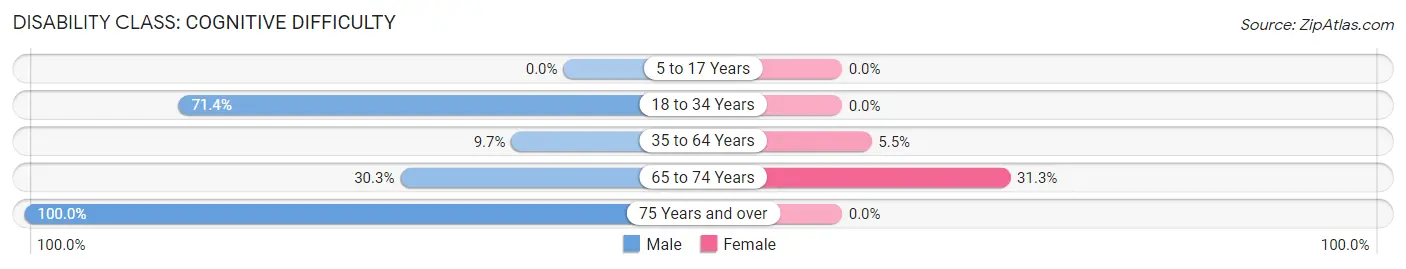
| Age Bracket | Male | Female |
| 5 to 17 Years | 0 (0.0%) | 0 (0.0%) |
| 18 to 34 Years | 10 (71.4%) | 0 (0.0%) |
| 35 to 64 Years | 34 (9.7%) | 14 (5.5%) |
| 65 to 74 Years | 33 (30.3%) | 30 (31.2%) |
| 75 Years and over | 69 (100.0%) | 0 (0.0%) |
Disability Class: Ambulatory Difficulty
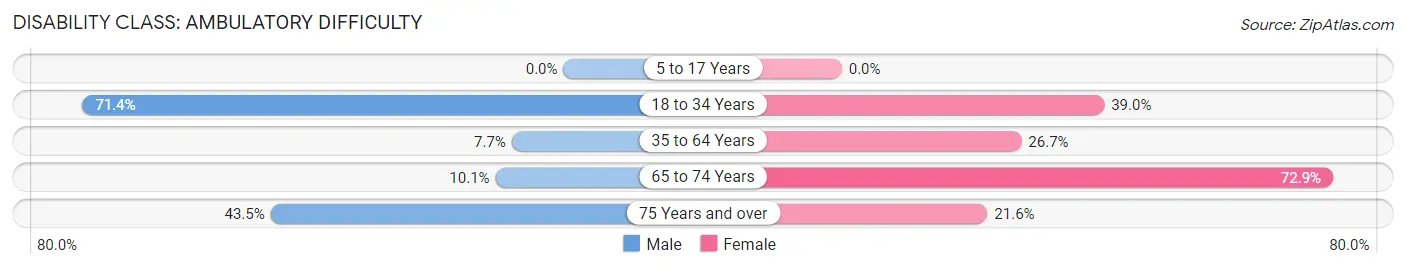
| Age Bracket | Male | Female |
| 5 to 17 Years | 0 (0.0%) | 0 (0.0%) |
| 18 to 34 Years | 10 (71.4%) | 53 (39.0%) |
| 35 to 64 Years | 27 (7.7%) | 68 (26.7%) |
| 65 to 74 Years | 11 (10.1%) | 70 (72.9%) |
| 75 Years and over | 30 (43.5%) | 8 (21.6%) |
Disability Class: Self-Care Difficulty
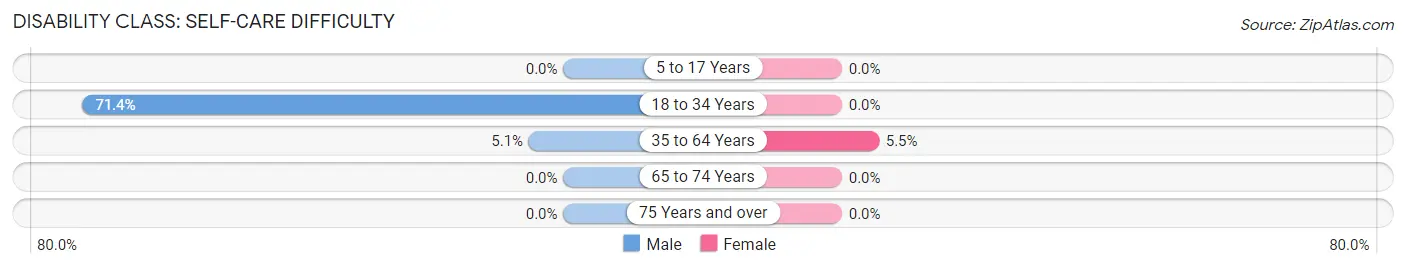
| Age Bracket | Male | Female |
| 5 to 17 Years | 0 (0.0%) | 0 (0.0%) |
| 18 to 34 Years | 10 (71.4%) | 0 (0.0%) |
| 35 to 64 Years | 18 (5.1%) | 14 (5.5%) |
| 65 to 74 Years | 0 (0.0%) | 0 (0.0%) |
| 75 Years and over | 0 (0.0%) | 0 (0.0%) |
Technology Access in Eaton Estates
Computing Device Access in Eaton Estates
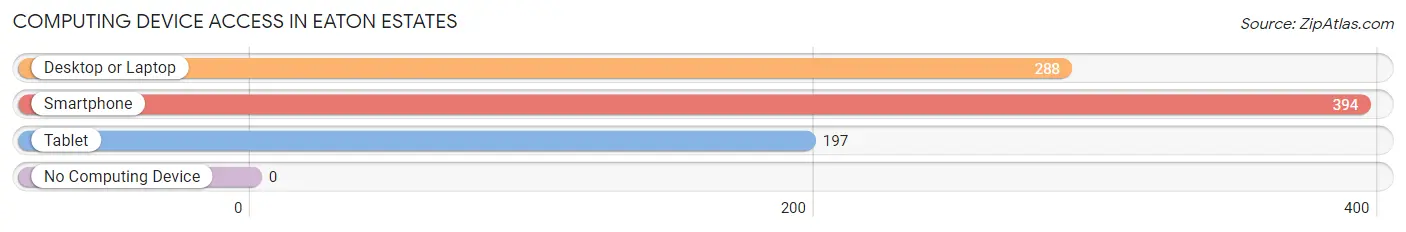
| Device Type | # Households | % Households |
| Desktop or Laptop | 288 | 63.3% |
| Smartphone | 394 | 86.6% |
| Tablet | 197 | 43.3% |
| No Computing Device | 0 | 0.0% |
| Total | 455 | 100.0% |
Internet Access in Eaton Estates
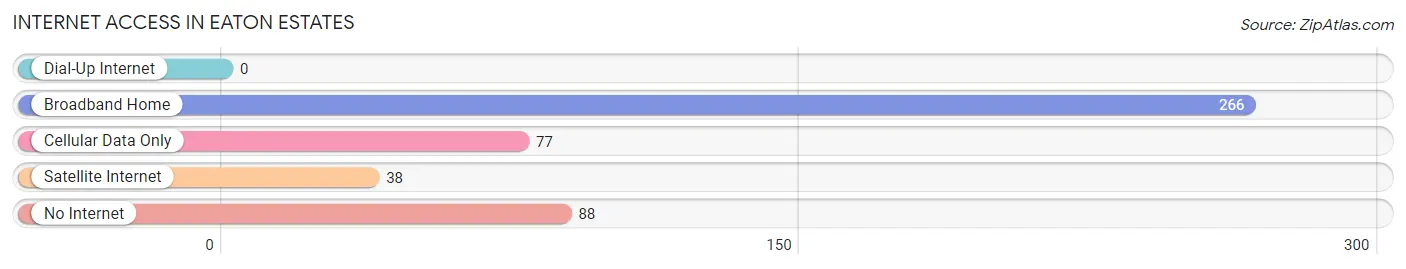
| Internet Type | # Households | % Households |
| Dial-Up Internet | 0 | 0.0% |
| Broadband Home | 266 | 58.5% |
| Cellular Data Only | 77 | 16.9% |
| Satellite Internet | 38 | 8.4% |
| No Internet | 88 | 19.3% |
| Total | 455 | 100.0% |
Eaton Estates Summary
Eaton Estates is a small village located in the state of Ohio, United States. It is situated in the county of Preble, and is part of the Dayton Metropolitan Statistical Area. The village has a population of approximately 1,000 people, and is located about 20 miles east of Dayton.
History
Eaton Estates was founded in 1820 by William Eaton, a Revolutionary War veteran. He purchased the land from the government and began to develop the area. The village was originally known as Eatonville, but the name was changed to Eaton Estates in 1845. The village was incorporated in 1848.
In the late 19th century, Eaton Estates was a thriving agricultural community. The village was home to several farms, and the local economy was largely based on the production of corn, wheat, and other crops. The village also had a number of small businesses, including a general store, a blacksmith, and a post office.
In the early 20th century, the village began to decline. The local economy shifted away from agriculture and towards manufacturing. The village was home to several factories, including a paper mill and a furniture factory. However, these factories eventually closed, and the village began to decline.
Geography
Eaton Estates is located in the western part of Preble County, Ohio. The village is situated on the banks of the Great Miami River, and is surrounded by rolling hills and farmland. The village is located about 20 miles east of Dayton, and is about 40 miles west of Cincinnati.
The village has a total area of 0.7 square miles, all of which is land. The village is located at an elevation of 845 feet above sea level.
Economy
The economy of Eaton Estates is largely based on agriculture and tourism. The village is home to several farms, which produce corn, wheat, and other crops. The village also has a number of small businesses, including a general store, a post office, and a few restaurants.
The village is also a popular tourist destination. The village is home to several historic sites, including the Eaton Estates Historic District, which is listed on the National Register of Historic Places. The village also has several parks and recreational areas, including the Eaton Estates Nature Preserve.
Demographics
As of the 2010 census, the population of Eaton Estates was 1,000 people. The racial makeup of the village was 97.2% White, 0.7% African American, 0.3% Native American, 0.3% Asian, and 1.5% from other races. The median household income was $45,000, and the median family income was $50,000.
The village has a high rate of homeownership, with nearly 90% of the population owning their own homes. The village also has a low crime rate, and is considered to be a safe place to live.
Common Questions
What is Per Capita Income in Eaton Estates?
Per Capita income in Eaton Estates is $27,664.
What is the Median Family Income in Eaton Estates?
Median Family Income in Eaton Estates is $57,868.
What is the Median Household income in Eaton Estates?
Median Household Income in Eaton Estates is $58,967.
What is Income or Wage Gap in Eaton Estates?
Income or Wage Gap in Eaton Estates is 39.5%.
Women in Eaton Estates earn 60.5 cents for every dollar earned by a man.
What is Inequality or Gini Index in Eaton Estates?
Inequality or Gini Index in Eaton Estates is 0.29.
What is the Total Population of Eaton Estates?
Total Population of Eaton Estates is 1,191.
What is the Total Male Population of Eaton Estates?
Total Male Population of Eaton Estates is 578.
What is the Total Female Population of Eaton Estates?
Total Female Population of Eaton Estates is 613.
What is the Ratio of Males per 100 Females in Eaton Estates?
There are 94.29 Males per 100 Females in Eaton Estates.
What is the Ratio of Females per 100 Males in Eaton Estates?
There are 106.06 Females per 100 Males in Eaton Estates.
What is the Median Population Age in Eaton Estates?
Median Population Age in Eaton Estates is 55.9 Years.
What is the Average Family Size in Eaton Estates
Average Family Size in Eaton Estates is 3.3 People.
What is the Average Household Size in Eaton Estates
Average Household Size in Eaton Estates is 2.6 People.
How Large is the Labor Force in Eaton Estates?
There are 500 People in the Labor Forcein in Eaton Estates.
What is the Percentage of People in the Labor Force in Eaton Estates?
46.8% of People are in the Labor Force in Eaton Estates.