Cities with the Highest Percentage of Latvian Population in Ohio
RELATED REPORTS & OPTIONS
Latvian
Ohio
Compare Cities
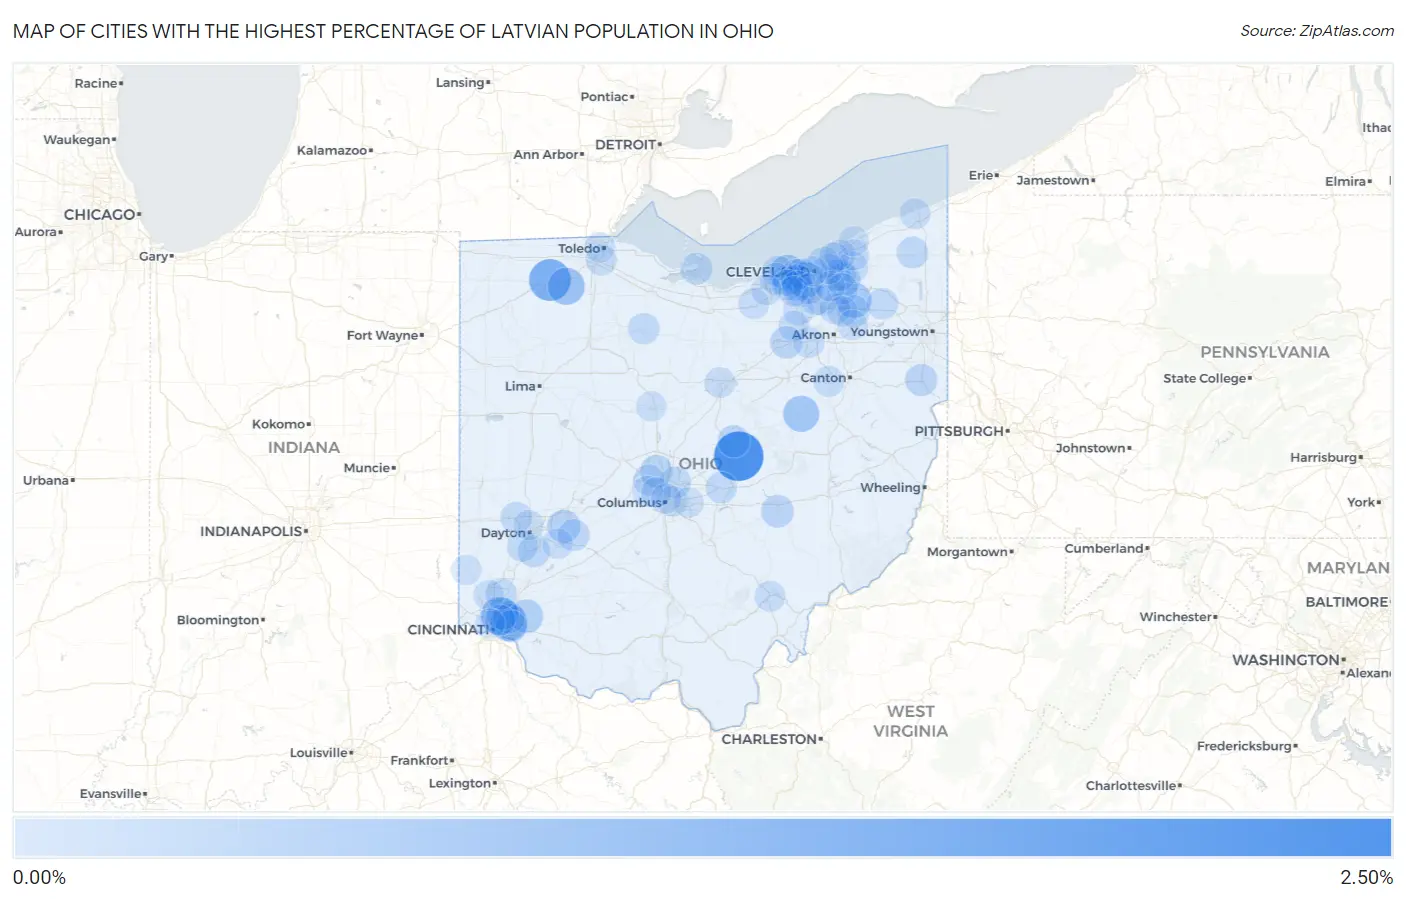
Map of Cities with the Highest Percentage of Latvian Population in Ohio
0.00%
2.50%
Cities with the Highest Percentage of Latvian Population in Ohio
| City | Latvian | vs State | vs National | |
| 1. | Martinsburg | 2.23% | 0.020%(+2.21)#1 | 0.026%(+2.21)#35 |
| 2. | Liberty Center | 1.33% | 0.020%(+1.31)#2 | 0.026%(+1.30)#63 |
| 3. | Golf Manor | 0.90% | 0.020%(+0.878)#3 | 0.026%(+0.872)#102 |
| 4. | Mariemont | 0.80% | 0.020%(+0.782)#4 | 0.026%(+0.776)#120 |
| 5. | Grand Rapids | 0.77% | 0.020%(+0.755)#5 | 0.026%(+0.749)#126 |
| 6. | Linndale | 0.72% | 0.020%(+0.705)#6 | 0.026%(+0.699)#140 |
| 7. | Berlin | 0.66% | 0.020%(+0.643)#7 | 0.026%(+0.637)#155 |
| 8. | Aurora | 0.60% | 0.020%(+0.584)#8 | 0.026%(+0.578)#175 |
| 9. | Bay Village | 0.59% | 0.020%(+0.566)#9 | 0.026%(+0.560)#183 |
| 10. | Mount Repose | 0.40% | 0.020%(+0.380)#10 | 0.026%(+0.374)#280 |
| 11. | Moreland Hills | 0.35% | 0.020%(+0.329)#11 | 0.026%(+0.323)#326 |
| 12. | Yellow Springs | 0.32% | 0.020%(+0.301)#12 | 0.026%(+0.295)#360 |
| 13. | Powell | 0.27% | 0.020%(+0.249)#13 | 0.026%(+0.244)#438 |
| 14. | South Zanesville | 0.27% | 0.020%(+0.247)#14 | 0.026%(+0.241)#443 |
| 15. | Gambier | 0.25% | 0.020%(+0.230)#15 | 0.026%(+0.224)#480 |
| 16. | Madeira | 0.23% | 0.020%(+0.214)#16 | 0.026%(+0.208)#527 |
| 17. | Lisbon | 0.23% | 0.020%(+0.213)#17 | 0.026%(+0.207)#533 |
| 18. | Westfield Center | 0.23% | 0.020%(+0.209)#18 | 0.026%(+0.203)#541 |
| 19. | Amberley | 0.21% | 0.020%(+0.189)#19 | 0.026%(+0.184)#572 |
| 20. | Marblehead | 0.21% | 0.020%(+0.188)#20 | 0.026%(+0.182)#574 |
| 21. | Streetsboro | 0.21% | 0.020%(+0.187)#21 | 0.026%(+0.181)#576 |
| 22. | Roaming Shores | 0.20% | 0.020%(+0.185)#22 | 0.026%(+0.179)#581 |
| 23. | Beachwood | 0.20% | 0.020%(+0.175)#23 | 0.026%(+0.169)#610 |
| 24. | Centerville | 0.19% | 0.020%(+0.172)#24 | 0.026%(+0.166)#620 |
| 25. | Westlake | 0.19% | 0.020%(+0.168)#25 | 0.026%(+0.162)#630 |
| 26. | Newtown | 0.19% | 0.020%(+0.166)#26 | 0.026%(+0.160)#634 |
| 27. | Cedarville | 0.18% | 0.020%(+0.159)#27 | 0.026%(+0.153)#654 |
| 28. | Pepper Pike | 0.18% | 0.020%(+0.157)#28 | 0.026%(+0.151)#659 |
| 29. | Rocky River | 0.17% | 0.020%(+0.152)#29 | 0.026%(+0.146)#673 |
| 30. | Huber Ridge | 0.16% | 0.020%(+0.143)#30 | 0.026%(+0.137)#702 |
| 31. | Avon | 0.16% | 0.020%(+0.141)#31 | 0.026%(+0.135)#709 |
| 32. | Granville | 0.16% | 0.020%(+0.136)#32 | 0.026%(+0.130)#721 |
| 33. | Garrettsville | 0.15% | 0.020%(+0.135)#33 | 0.026%(+0.129)#731 |
| 34. | Englewood | 0.15% | 0.020%(+0.129)#34 | 0.026%(+0.123)#750 |
| 35. | Tiffin | 0.15% | 0.020%(+0.126)#35 | 0.026%(+0.120)#758 |
| 36. | Bratenahl | 0.14% | 0.020%(+0.121)#36 | 0.026%(+0.115)#779 |
| 37. | Beckett Ridge | 0.12% | 0.020%(+0.102)#37 | 0.026%(+0.096)#850 |
| 38. | Dublin | 0.12% | 0.020%(+0.101)#38 | 0.026%(+0.095)#851 |
| 39. | West Carrollton | 0.11% | 0.020%(+0.095)#39 | 0.026%(+0.089)#876 |
| 40. | Chesterland | 0.096% | 0.020%(+0.076)#40 | 0.026%(+0.070)#962 |
| 41. | Brecksville | 0.095% | 0.020%(+0.076)#41 | 0.026%(+0.070)#964 |
| 42. | Avon Lake | 0.095% | 0.020%(+0.075)#42 | 0.026%(+0.069)#965 |
| 43. | Solon | 0.091% | 0.020%(+0.072)#43 | 0.026%(+0.066)#989 |
| 44. | Wadsworth | 0.091% | 0.020%(+0.072)#44 | 0.026%(+0.066)#991 |
| 45. | Middleburg Heights | 0.088% | 0.020%(+0.068)#45 | 0.026%(+0.062)#1,017 |
| 46. | Brunswick | 0.088% | 0.020%(+0.068)#46 | 0.026%(+0.062)#1,020 |
| 47. | Fairview Park | 0.088% | 0.020%(+0.068)#47 | 0.026%(+0.062)#1,022 |
| 48. | Massillon | 0.087% | 0.020%(+0.067)#48 | 0.026%(+0.061)#1,028 |
| 49. | Lakewood | 0.087% | 0.020%(+0.067)#49 | 0.026%(+0.061)#1,029 |
| 50. | Kirtland | 0.087% | 0.020%(+0.067)#50 | 0.026%(+0.061)#1,031 |
| 51. | Brook Park | 0.081% | 0.020%(+0.061)#51 | 0.026%(+0.055)#1,068 |
| 52. | Boston Heights | 0.081% | 0.020%(+0.061)#52 | 0.026%(+0.055)#1,074 |
| 53. | Rossford | 0.079% | 0.020%(+0.059)#53 | 0.026%(+0.054)#1,087 |
| 54. | Athens | 0.075% | 0.020%(+0.055)#54 | 0.026%(+0.049)#1,118 |
| 55. | Oberlin | 0.073% | 0.020%(+0.053)#55 | 0.026%(+0.048)#1,131 |
| 56. | Medina | 0.069% | 0.020%(+0.049)#56 | 0.026%(+0.043)#1,157 |
| 57. | Parma | 0.066% | 0.020%(+0.046)#57 | 0.026%(+0.040)#1,181 |
| 58. | Broadview Heights | 0.066% | 0.020%(+0.046)#58 | 0.026%(+0.040)#1,185 |
| 59. | Mansfield | 0.065% | 0.020%(+0.045)#59 | 0.026%(+0.039)#1,188 |
| 60. | Norwood | 0.063% | 0.020%(+0.043)#60 | 0.026%(+0.037)#1,202 |
| 61. | Ashtabula | 0.061% | 0.020%(+0.041)#61 | 0.026%(+0.035)#1,218 |
| 62. | Wickliffe | 0.055% | 0.020%(+0.036)#62 | 0.026%(+0.030)#1,269 |
| 63. | Bexley | 0.052% | 0.020%(+0.032)#63 | 0.026%(+0.026)#1,301 |
| 64. | Hilliard | 0.050% | 0.020%(+0.030)#64 | 0.026%(+0.024)#1,318 |
| 65. | North Olmsted | 0.047% | 0.020%(+0.027)#65 | 0.026%(+0.021)#1,352 |
| 66. | Cleveland Heights | 0.042% | 0.020%(+0.022)#66 | 0.026%(+0.017)#1,400 |
| 67. | Maple Heights | 0.038% | 0.020%(+0.019)#67 | 0.026%(+0.013)#1,450 |
| 68. | Berea | 0.038% | 0.020%(+0.018)#68 | 0.026%(+0.012)#1,456 |
| 69. | Xenia | 0.035% | 0.020%(+0.016)#69 | 0.026%(+0.010)#1,483 |
| 70. | Upper Arlington | 0.033% | 0.020%(+0.013)#70 | 0.026%(+0.007)#1,515 |
| 71. | Euclid | 0.032% | 0.020%(+0.013)#71 | 0.026%(+0.007)#1,521 |
| 72. | Fairfield | 0.029% | 0.020%(+0.009)#72 | 0.026%(+0.003)#1,567 |
| 73. | Elyria | 0.028% | 0.020%(+0.009)#73 | 0.026%(+0.003)#1,579 |
| 74. | Hudson | 0.026% | 0.020%(+0.006)#74 | 0.026%(+0.000)#1,615 |
| 75. | Oxford | 0.023% | 0.020%(+0.003)#75 | 0.026%(-0.003)#1,659 |
| 76. | Marion | 0.019% | 0.020%(-0.000)#76 | 0.026%(-0.006)#1,700 |
| 77. | Reynoldsburg | 0.017% | 0.020%(-0.003)#77 | 0.026%(-0.009)#1,742 |
| 78. | Columbus | 0.016% | 0.020%(-0.004)#78 | 0.026%(-0.010)#1,768 |
| 79. | Kent | 0.015% | 0.020%(-0.005)#79 | 0.026%(-0.011)#1,782 |
| 80. | Cincinnati | 0.013% | 0.020%(-0.006)#80 | 0.026%(-0.012)#1,800 |
| 81. | Cleveland | 0.013% | 0.020%(-0.007)#81 | 0.026%(-0.013)#1,807 |
| 82. | Mentor | 0.013% | 0.020%(-0.007)#82 | 0.026%(-0.013)#1,814 |
| 83. | Toledo | 0.0093% | 0.020%(-0.011)#83 | 0.026%(-0.016)#1,874 |
| 84. | Dayton | 0.0044% | 0.020%(-0.015)#84 | 0.026%(-0.021)#1,927 |
Common Questions
What are the Top 10 Cities with the Highest Percentage of Latvian Population in Ohio?
Top 10 Cities with the Highest Percentage of Latvian Population in Ohio are:
#1
2.23%
#2
1.33%
#3
0.90%
#4
0.80%
#5
0.77%
#6
0.72%
#7
0.66%
#8
0.60%
#9
0.59%
#10
0.40%
What city has the Highest Percentage of Latvian Population in Ohio?
Martinsburg has the Highest Percentage of Latvian Population in Ohio with 2.23%.
What is the Percentage of Latvian Population in the State of Ohio?
Percentage of Latvian Population in Ohio is 0.020%.
What is the Percentage of Latvian Population in the United States?
Percentage of Latvian Population in the United States is 0.026%.