Cities with the Highest Percentage of Sri Lankan Population in Ohio
RELATED REPORTS & OPTIONS
Sri Lankan
Ohio
Compare Cities
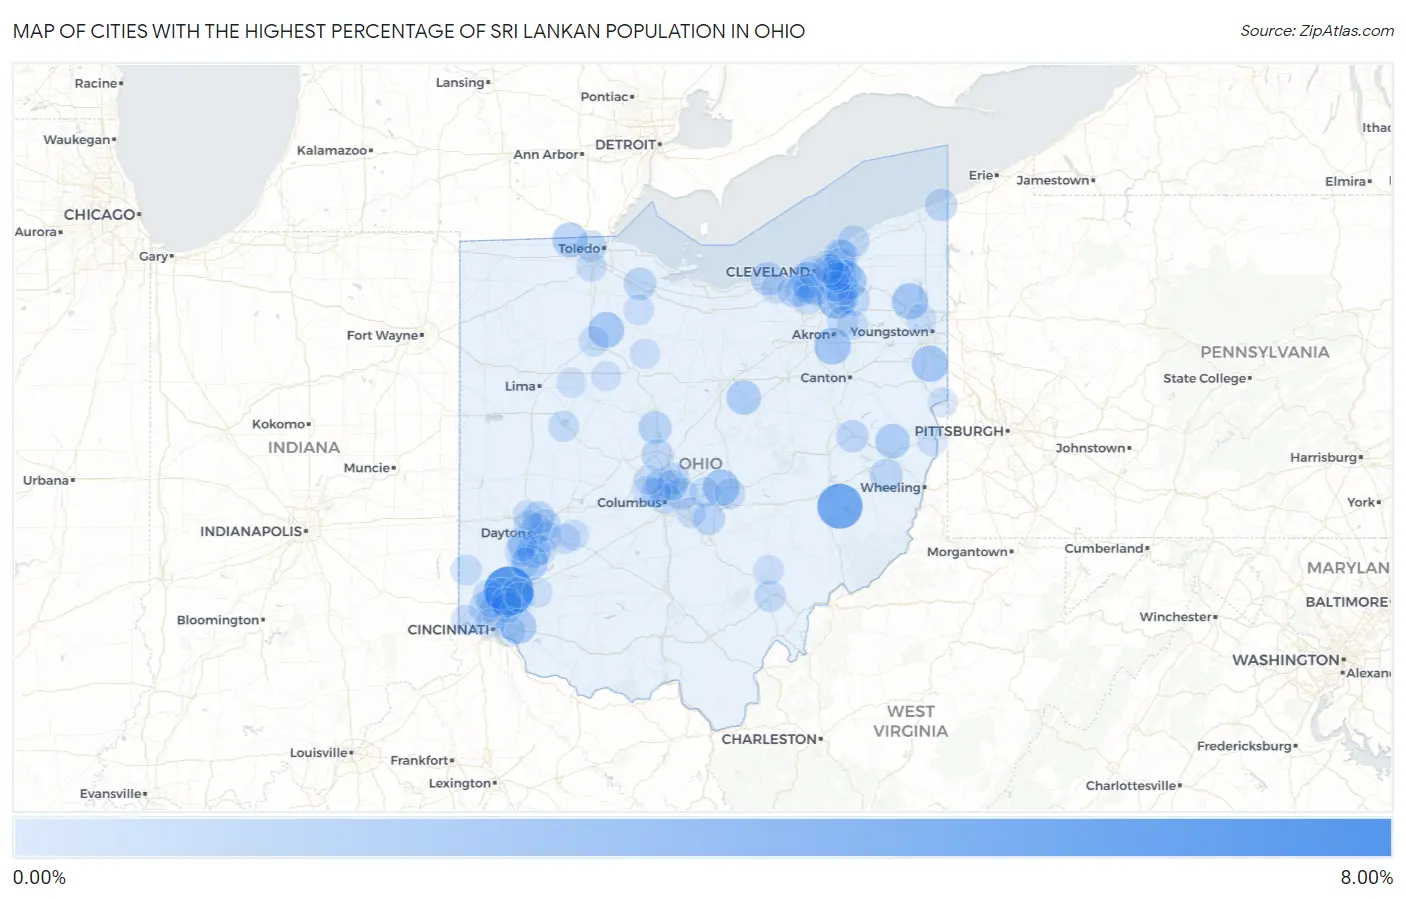
Map of Cities with the Highest Percentage of Sri Lankan Population in Ohio
0.00%
8.00%
Cities with the Highest Percentage of Sri Lankan Population in Ohio
| City | Sri Lankan | vs State | vs National | |
| 1. | Sharon Center | 6.68% | 0.17%(+6.50)#1 | 0.68%(+6.00)#94 |
| 2. | Wetherington | 6.06% | 0.17%(+5.89)#2 | 0.68%(+5.38)#107 |
| 3. | Senecaville | 4.68% | 0.17%(+4.50)#3 | 0.68%(+4.00)#182 |
| 4. | Macedonia | 2.38% | 0.17%(+2.21)#4 | 0.68%(+1.70)#537 |
| 5. | Portage Lakes | 2.15% | 0.17%(+1.97)#5 | 0.68%(+1.47)#625 |
| 6. | Granville | 2.08% | 0.17%(+1.90)#6 | 0.68%(+1.40)#648 |
| 7. | Brooklyn | 2.06% | 0.17%(+1.89)#7 | 0.68%(+1.38)#655 |
| 8. | Champion Heights | 2.00% | 0.17%(+1.83)#8 | 0.68%(+1.32)#671 |
| 9. | Columbiana | 1.99% | 0.17%(+1.81)#9 | 0.68%(+1.31)#678 |
| 10. | Chagrin Falls | 1.90% | 0.17%(+1.72)#10 | 0.68%(+1.22)#729 |
| 11. | Arcadia | 1.89% | 0.17%(+1.72)#11 | 0.68%(+1.21)#733 |
| 12. | Five Points | 1.82% | 0.17%(+1.64)#12 | 0.68%(+1.14)#778 |
| 13. | Summerside | 1.66% | 0.17%(+1.49)#13 | 0.68%(+0.983)#873 |
| 14. | Berkey | 1.61% | 0.17%(+1.44)#14 | 0.68%(+0.934)#910 |
| 15. | Jewett | 1.54% | 0.17%(+1.37)#15 | 0.68%(+0.866)#971 |
| 16. | Perrysville | 1.49% | 0.17%(+1.32)#16 | 0.68%(+0.816)#1,009 |
| 17. | Centerville | 1.25% | 0.17%(+1.07)#17 | 0.68%(+0.570)#1,260 |
| 18. | Riverlea | 1.17% | 0.17%(+0.991)#18 | 0.68%(+0.487)#1,352 |
| 19. | Sheffield | 1.14% | 0.17%(+0.962)#19 | 0.68%(+0.458)#1,383 |
| 20. | Seven Hills | 1.10% | 0.17%(+0.930)#20 | 0.68%(+0.426)#1,424 |
| 21. | Waldo | 1.10% | 0.17%(+0.921)#21 | 0.68%(+0.417)#1,432 |
| 22. | Pepper Pike | 1.09% | 0.17%(+0.917)#22 | 0.68%(+0.413)#1,438 |
| 23. | Solon | 0.99% | 0.17%(+0.811)#23 | 0.68%(+0.307)#1,587 |
| 24. | Lindsey | 0.96% | 0.17%(+0.789)#24 | 0.68%(+0.285)#1,619 |
| 25. | Flushing | 0.93% | 0.17%(+0.756)#25 | 0.68%(+0.252)#1,684 |
| 26. | Baltimore | 0.88% | 0.17%(+0.702)#26 | 0.68%(+0.198)#1,776 |
| 27. | Conneaut | 0.86% | 0.17%(+0.690)#27 | 0.68%(+0.186)#1,794 |
| 28. | Uhrichsville | 0.86% | 0.17%(+0.685)#28 | 0.68%(+0.181)#1,805 |
| 29. | Huber Heights | 0.84% | 0.17%(+0.666)#29 | 0.68%(+0.162)#1,838 |
| 30. | Wyoming | 0.83% | 0.17%(+0.651)#30 | 0.68%(+0.147)#1,872 |
| 31. | Berea | 0.79% | 0.17%(+0.613)#31 | 0.68%(+0.109)#1,949 |
| 32. | Aurora | 0.75% | 0.17%(+0.580)#32 | 0.68%(+0.076)#2,023 |
| 33. | Gahanna | 0.75% | 0.17%(+0.577)#33 | 0.68%(+0.073)#2,032 |
| 34. | Northbrook | 0.75% | 0.17%(+0.576)#34 | 0.68%(+0.072)#2,034 |
| 35. | Willoughby Hills | 0.74% | 0.17%(+0.568)#35 | 0.68%(+0.064)#2,051 |
| 36. | Beavercreek | 0.74% | 0.17%(+0.566)#36 | 0.68%(+0.062)#2,053 |
| 37. | Wickliffe | 0.73% | 0.17%(+0.560)#37 | 0.68%(+0.056)#2,069 |
| 38. | Highland Heights | 0.72% | 0.17%(+0.542)#38 | 0.68%(+0.038)#2,102 |
| 39. | Wright Patterson Afb | 0.71% | 0.17%(+0.533)#39 | 0.68%(+0.029)#2,129 |
| 40. | Twinsburg | 0.70% | 0.17%(+0.525)#40 | 0.68%(+0.021)#2,163 |
| 41. | Westerville | 0.68% | 0.17%(+0.509)#41 | 0.68%(+0.005)#2,206 |
| 42. | Delaware | 0.68% | 0.17%(+0.505)#42 | 0.68%(+0.001)#2,218 |
| 43. | Mentor | 0.67% | 0.17%(+0.496)#43 | 0.68%(-0.008)#2,249 |
| 44. | Beckett Ridge | 0.67% | 0.17%(+0.494)#44 | 0.68%(-0.010)#2,257 |
| 45. | East Cleveland | 0.60% | 0.17%(+0.429)#45 | 0.68%(-0.075)#2,427 |
| 46. | Athens | 0.58% | 0.17%(+0.403)#46 | 0.68%(-0.101)#2,496 |
| 47. | Ottawa Hills | 0.54% | 0.17%(+0.369)#47 | 0.68%(-0.135)#2,602 |
| 48. | Riverside | 0.52% | 0.17%(+0.348)#48 | 0.68%(-0.156)#2,671 |
| 49. | Fairfield | 0.50% | 0.17%(+0.328)#49 | 0.68%(-0.176)#2,742 |
| 50. | Sherwood | 0.50% | 0.17%(+0.324)#50 | 0.68%(-0.180)#2,756 |
| 51. | Russells Point | 0.48% | 0.17%(+0.309)#51 | 0.68%(-0.195)#2,817 |
| 52. | Columbus | 0.48% | 0.17%(+0.302)#52 | 0.68%(-0.202)#2,843 |
| 53. | Oxford | 0.45% | 0.17%(+0.274)#53 | 0.68%(-0.230)#2,938 |
| 54. | Middleburg Heights | 0.41% | 0.17%(+0.234)#54 | 0.68%(-0.270)#3,113 |
| 55. | Blue Ash | 0.41% | 0.17%(+0.231)#55 | 0.68%(-0.273)#3,128 |
| 56. | Moraine | 0.39% | 0.17%(+0.211)#56 | 0.68%(-0.293)#3,230 |
| 57. | Beechwood Trails | 0.38% | 0.17%(+0.204)#57 | 0.68%(-0.300)#3,262 |
| 58. | Hunting Valley | 0.37% | 0.17%(+0.201)#58 | 0.68%(-0.303)#3,277 |
| 59. | Minerva Park | 0.37% | 0.17%(+0.195)#59 | 0.68%(-0.309)#3,298 |
| 60. | Forest Park | 0.36% | 0.17%(+0.190)#60 | 0.68%(-0.314)#3,318 |
| 61. | Heath | 0.36% | 0.17%(+0.188)#61 | 0.68%(-0.316)#3,337 |
| 62. | Mason | 0.36% | 0.17%(+0.182)#62 | 0.68%(-0.322)#3,368 |
| 63. | Cleves | 0.35% | 0.17%(+0.179)#63 | 0.68%(-0.325)#3,384 |
| 64. | Hilliard | 0.35% | 0.17%(+0.175)#64 | 0.68%(-0.329)#3,414 |
| 65. | Stow | 0.35% | 0.17%(+0.171)#65 | 0.68%(-0.333)#3,426 |
| 66. | Findlay | 0.34% | 0.17%(+0.169)#66 | 0.68%(-0.334)#3,430 |
| 67. | Landen | 0.34% | 0.17%(+0.169)#67 | 0.68%(-0.335)#3,434 |
| 68. | Perrysburg | 0.34% | 0.17%(+0.163)#68 | 0.68%(-0.341)#3,469 |
| 69. | Parma | 0.34% | 0.17%(+0.162)#69 | 0.68%(-0.342)#3,477 |
| 70. | Cedarville | 0.33% | 0.17%(+0.158)#70 | 0.68%(-0.346)#3,494 |
| 71. | Pickerington | 0.32% | 0.17%(+0.144)#71 | 0.68%(-0.360)#3,553 |
| 72. | University Heights | 0.32% | 0.17%(+0.141)#72 | 0.68%(-0.363)#3,575 |
| 73. | Bedford Heights | 0.31% | 0.17%(+0.136)#73 | 0.68%(-0.368)#3,597 |
| 74. | Beachwood | 0.30% | 0.17%(+0.129)#74 | 0.68%(-0.375)#3,635 |
| 75. | Woodmere | 0.29% | 0.17%(+0.118)#75 | 0.68%(-0.386)#3,691 |
| 76. | Bettsville | 0.29% | 0.17%(+0.114)#76 | 0.68%(-0.390)#3,708 |
| 77. | Wilberforce | 0.27% | 0.17%(+0.099)#77 | 0.68%(-0.405)#3,783 |
| 78. | Sycamore | 0.27% | 0.17%(+0.098)#78 | 0.68%(-0.406)#3,788 |
| 79. | Niles | 0.27% | 0.17%(+0.096)#79 | 0.68%(-0.408)#3,802 |
| 80. | Miamisburg | 0.27% | 0.17%(+0.092)#80 | 0.68%(-0.412)#3,827 |
| 81. | Kent | 0.26% | 0.17%(+0.085)#81 | 0.68%(-0.419)#3,864 |
| 82. | Sharonville | 0.26% | 0.17%(+0.082)#82 | 0.68%(-0.422)#3,884 |
| 83. | Glouster | 0.26% | 0.17%(+0.082)#83 | 0.68%(-0.422)#3,886 |
| 84. | North Ridgeville | 0.25% | 0.17%(+0.074)#84 | 0.68%(-0.430)#3,937 |
| 85. | Upper Arlington | 0.24% | 0.17%(+0.067)#85 | 0.68%(-0.437)#3,977 |
| 86. | North Royalton | 0.24% | 0.17%(+0.063)#86 | 0.68%(-0.441)#4,000 |
| 87. | Cincinnati | 0.23% | 0.17%(+0.056)#87 | 0.68%(-0.448)#4,041 |
| 88. | Forest | 0.21% | 0.17%(+0.032)#88 | 0.68%(-0.472)#4,213 |
| 89. | East Liverpool | 0.20% | 0.17%(+0.026)#89 | 0.68%(-0.478)#4,246 |
| 90. | Steubenville | 0.19% | 0.17%(+0.018)#90 | 0.68%(-0.486)#4,292 |
| 91. | Bellbrook | 0.19% | 0.17%(+0.017)#91 | 0.68%(-0.487)#4,305 |
| 92. | Dayton | 0.19% | 0.17%(+0.014)#92 | 0.68%(-0.490)#4,321 |
| 93. | Springboro | 0.19% | 0.17%(+0.013)#93 | 0.68%(-0.491)#4,334 |
| 94. | Dublin | 0.18% | 0.17%(+0.005)#94 | 0.68%(-0.499)#4,388 |
| 95. | Cleveland | 0.18% | 0.17%(+0.005)#95 | 0.68%(-0.499)#4,396 |
| 96. | Ada | 0.18% | 0.17%(+0.002)#96 | 0.68%(-0.502)#4,411 |
| 97. | West Carrollton | 0.18% | 0.17%(+0.002)#97 | 0.68%(-0.502)#4,418 |
| 98. | Vandalia | 0.17% | 0.17%(-0.003)#98 | 0.68%(-0.507)#4,456 |
| 99. | Morrow | 0.17% | 0.17%(-0.003)#99 | 0.68%(-0.507)#4,460 |
| 100. | Cleveland Heights | 0.17% | 0.17%(-0.008)#100 | 0.68%(-0.512)#4,502 |
Common Questions
What are the Top 10 Cities with the Highest Percentage of Sri Lankan Population in Ohio?
Top 10 Cities with the Highest Percentage of Sri Lankan Population in Ohio are:
#1
6.06%
#2
4.68%
#3
2.38%
#4
2.15%
#5
2.08%
#6
2.06%
#7
2.00%
#8
1.99%
#9
1.90%
#10
1.89%
What city has the Highest Percentage of Sri Lankan Population in Ohio?
Wetherington has the Highest Percentage of Sri Lankan Population in Ohio with 6.06%.
What is the Percentage of Sri Lankan Population in the State of Ohio?
Percentage of Sri Lankan Population in Ohio is 0.17%.
What is the Percentage of Sri Lankan Population in the United States?
Percentage of Sri Lankan Population in the United States is 0.68%.